patrick.thomas@LIGO.ORG - posted 09:06, Tuesday 25 November 2014 - last comment - 09:49, Tuesday 25 November 2014(15282)
starting Conlog backup
Comments related to this report
Searches unavailable for duration.
Work will be starting today on the new DCS area in the VPW as well as outside between the H-2 building and the VPW. Today's activities will include some shallow excavation work outside by George Grant Construction. Inside work will include hanging a temporary curtain in the VPW to isolate the construction area from the C & B area and layout for refrigeration lines by Apollo and George Grant.
model restarts logged for Mon 24/Nov/2014
2014_11_24 06:39 h1fw0
2014_11_24 17:43 h1fw0
both unexpected restarts. Conlog frequently changing channels report attached.
Stefan, Matt, Kiwamu, Evan, Alexa
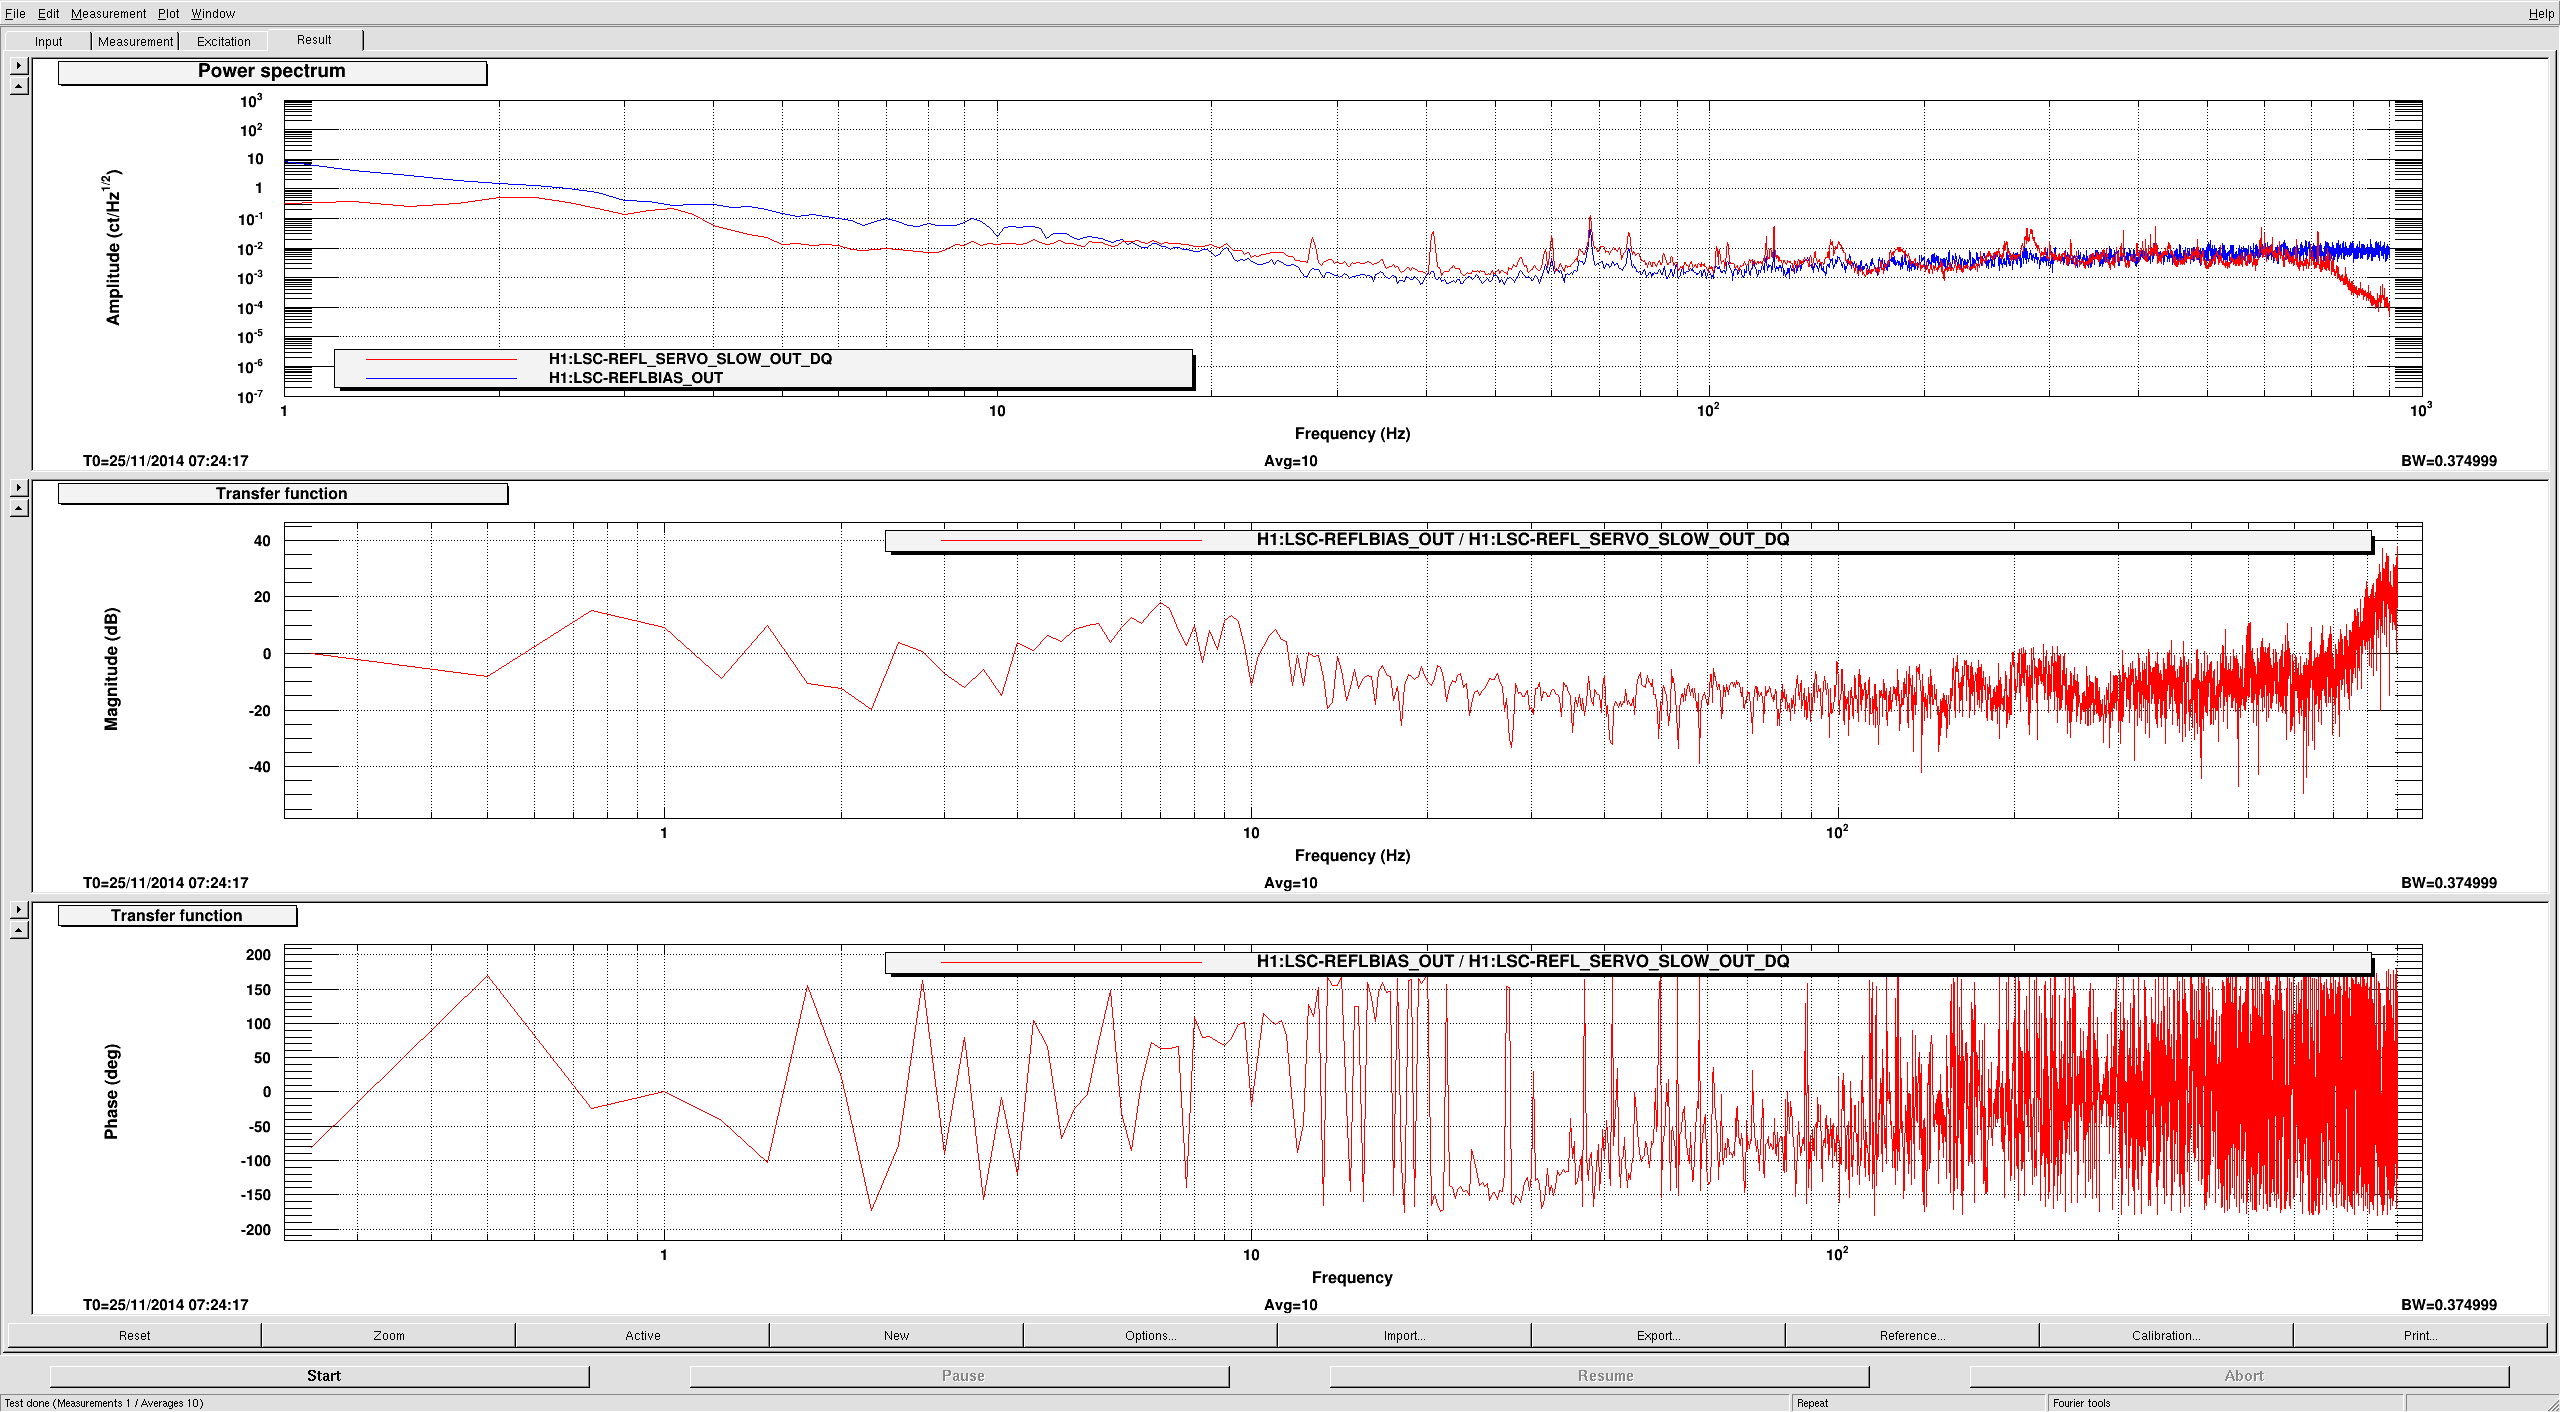
Attached are a transfer function showing the matched signals, as well as a StripTool plot of the successful sqrt(TRX+TRY) handoff.
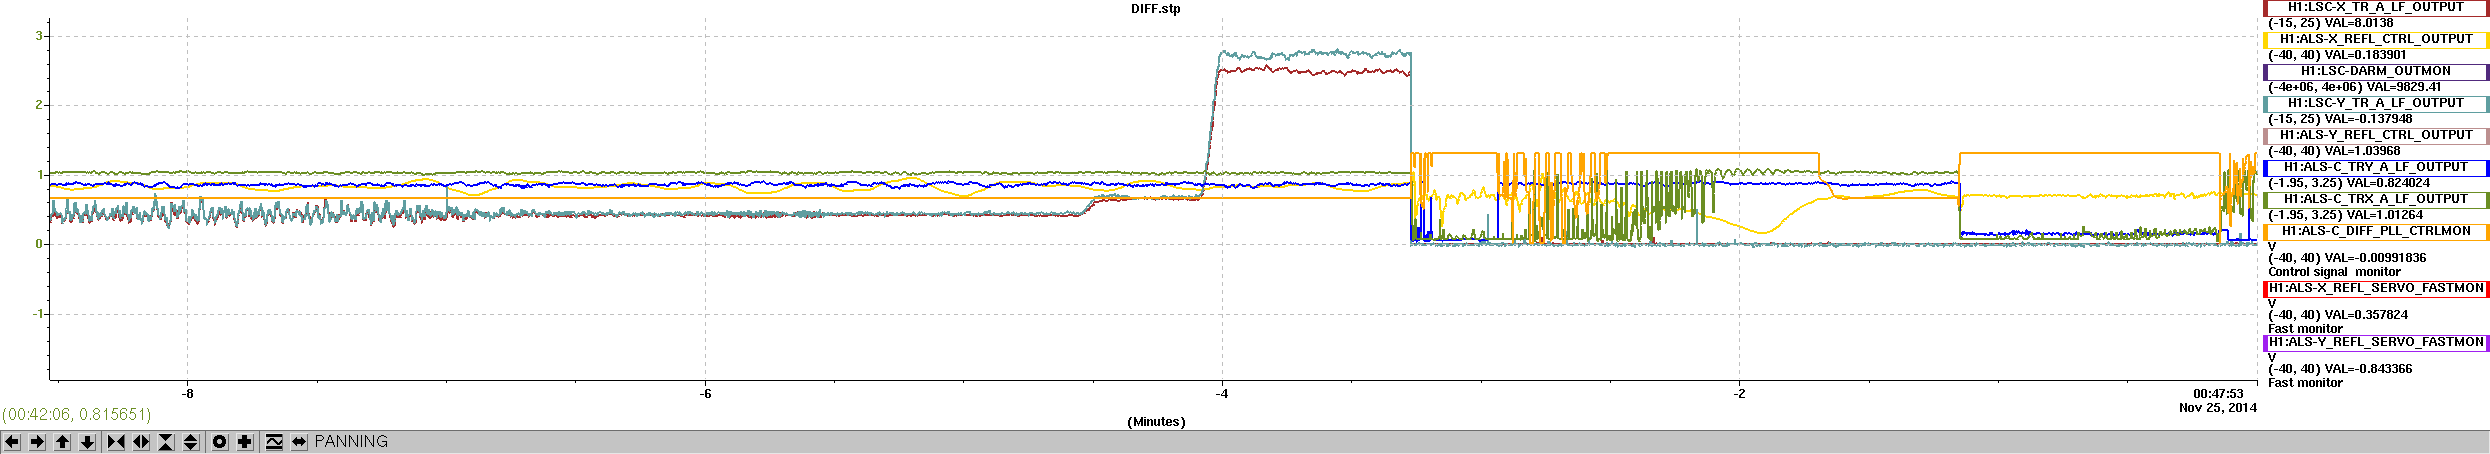
Well done! As far as I can tell, the unlock happens at 1100940293. The vertex seems happy, the first thing to go is the Y green.
LVEA: Laser Hazard
Observation Bit: Commissioning

06:45 Karen – Cleaning in the LVEA
08:00 Tweaked the ISS Reference Signal voltage to raise Diffracted Power up to 8.5%
08:47 Manny – In LVEA to check power racks near HAM2
09:00 Bubba & Mitch – Remove top from HAM ISI Storage Container and position Cleanroom
09:11 Filiberto & Aaron – At End-Y working on PEM power
09:13 Lockheed Martin locating services on site checking route to VPW
09:30 Cleaning crew – First cleaning on storage move cleanroom
09:45 Bubba & Mitch – Finished in LVEA
10:00 Bubba – Big-Red moving BSC Storage Container from LVEA Hi-Bay to Staging building
10:20 Added 300ml of water to Diode chiller
10:52 Bubba – Finished moving BSC Storage Container to Staging building
11:37 Filiberto & Aaron – Back from End-Y
11:50 Grant on site to deliver equipment for trenching work
12:35 Hanford testing emergency alarm system
Alexa, Matt
In an attempt to get stable, if low-bandwidth, loops, we made some cut-off filters.
The new ASC filter in FM5 is:
LP0.2 zpk([0.0025+i*0.499994;0.0025-i*0.499994],[0.1+i*0.0979794;0.1-i*0.0979794;0.05+i*0.193649;0.05-i*0.193649],1,"n")
A couple of old filters that got lost were:
ASC_PRC1_Y FM5 "res1.35" resgain(1.35,10,10)resgain(3.16,10,10)
ASC_MICH_P FM5 "LP15_new" ellip("LowPass", 4, 1, 20, 15)cheby1("LowPass", 2, 1, 100)gain(2, "dB")
Aaron and I continued with PEM cabling at EY this morning. We have completed all long cables runs and started installing the permanent power supplies in the DC rack. We disconnected the power supplies powering the microphones in both the VEA and EBAY and placed them in the DC rack. Got a call from commissioners asking us to leave EY, before we could reconnect microphone power with permanent power supplies. Will go back tomorrow morning and power them up.
Microphone power was reconnected at EY this morning.
PSL Status:
SysStat: All Green, except VB program offline
Output power: 33.2w
Frontend Watch: Green
HPO Watch: Red

PMC:
Locked: 4 days, 16 hours, 33 minutes
Reflected power:    2.6w
Power Transmitted: 22.9w
Total Power:       25.5w

FSS:
Locked: 0 days, 0 hours, 43 minutes
Trans PD: 1.810v

ISS:
Diffracted power: 9.39%
Last saturation event: 0 days, 14 hours, 28 minutes
Work on PEM power at End-Y
Locate Services on site Monday
Trenching work from OBS to VPW on Tuesday & Wednesday
Staging HAM ISI Storage container and Cleanroom in LVEA for 3IFO suspensions storage moves
HAM3 & BSC2 HEPI configuration work on Tuesday
When the modecleaner is kicked out of lock, the FSS oscillates and prevents relocking.
I've reduced the FSS common gain from 30 dB to 24 dB. Now the modecleaner relocks without issue.
Even at 24 dB, the FSS common loop will still oscillate every so often.
I noticed that ALS-Y_REFL_B_DC does not seemed to be aligned. The error threshold has been lowered so that the flag does not go off and we can still lock. I am not sure when this misalignment happened or if this was intentional (I can't remember). Whoever goes down to EY first, can he/she align it?
(Elli, Daniel)
Went to EY to center the green beams on the WFSs. They were too far out for the PZT mirrors. Auto-centering enaged and working again.
Since the ETMX L1 L2P filters gave us a unstable x-arm lock once ALS-DIFF was engaged, we switched to a DC-only strategy:
 - Instead of the the L2P/L2Y filters we simply used flat gains, and tuned them at 0.1 Hz:
     Pitch: -60dB (FM10) * gain of  5.3
     Yaw:   -60dB (FM10) * gain of -0.7

 - We also tweaked the ESD L2P/L2Y's at 2Hz:
     Pitch: gain of 0.021
     Yaw:   gain of 0.007

 - This left some AC pitch fluctuations on ETMX. The OPLEV took care of that. We now have a stable ALS DIFF and COMM running in this configuration.
For reference:
The previous ETMX L1 filters were as follows: L2Y gain of 0. L2P FM1, FM2 ON with gain of -1.0. Nothing had been installed in L3.
With these new L2P/L2Y settings and pitch oplev damping on L2, and the arms locked on HEPI slow ALS DIFF has been stably locked (with no build up drifts) for 20 minutes.


