h1guardian reboot: Dave, Patrick
At 10:06 PST I rebooted the h1guardian0 machine to test that all the nodes started automatically. The reboot proceded normally and all the guardian nodes did start automatically, SUSMC1 node was slightly delayed relative to all the other nodes. For reasons currently unknown the restart crashed the conlog master. Patrick restarted the conlog.
Model Changes: Keita, Daniel, Dan H, Dave
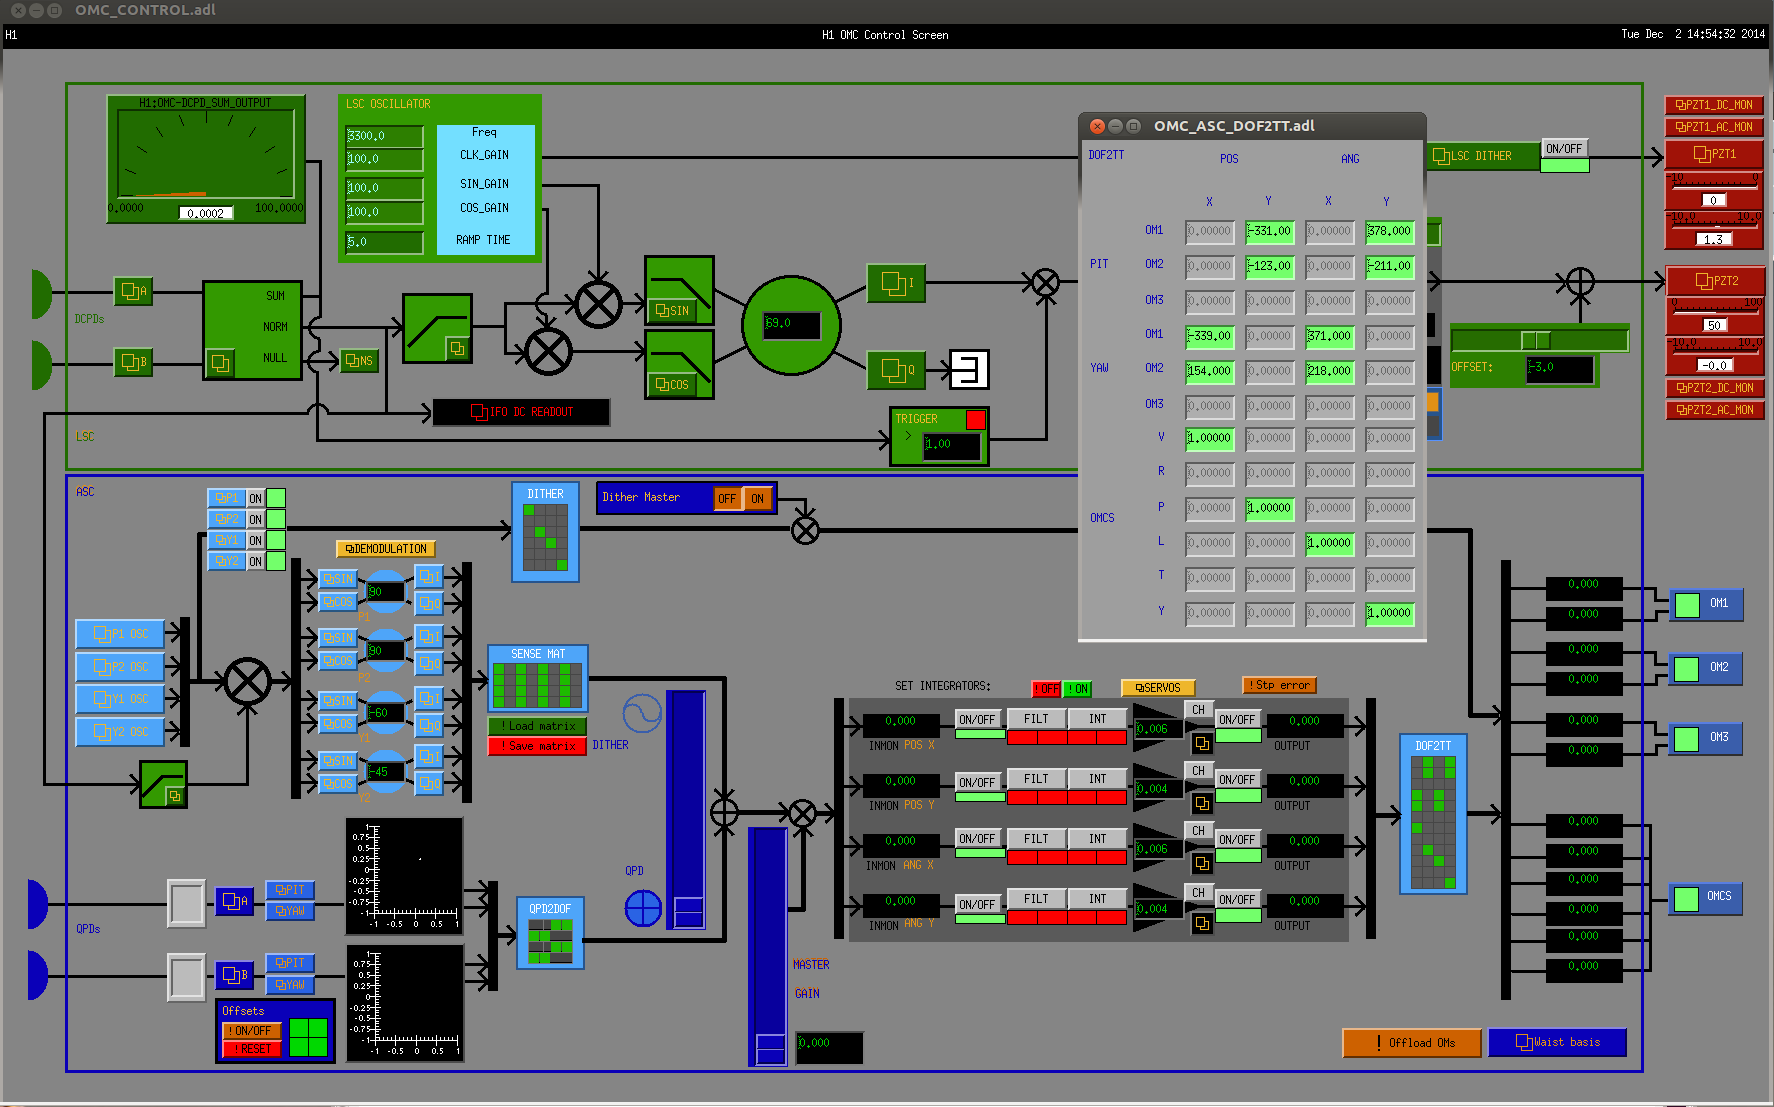
The following models were restarted with new code: h1susetmx, h1iscex, h1hpietmx, h1susetmy, h1iscey, h1hpietmy, h1asc, h1omc, h1susomc
Frame Writer Minute Trends Offload: Jim
h1fw0 has been busy over the past day copying its raw minute trends from the SSD array to HDD. Many restarts of h1fw0 are attributed to this loading.
h1susetmx snap files: Dave
For reasons unknown many old snap and log files in the directory target/h1susetmx/h1susetmxepics/burt/ were deleted between 10:00 and 11:00 PST this morning. This included the safe.snap symbolic link. Therefore the 11am restart of h1susetmx did not burt restore to its safe.snap, rather to the snap file created at the shutdown time. I restored the safe.snap link. Investigation continuing.
Partial loaded Filter Module Files: Dave
The following systems were discovered to have partially loaded filter files, I performed a "load all coefficients" on: h1psliss, h1susprm, h1sussrm, h1oaf, h1lsc, h1omc. The model h1asc took care of itself after it was restarted.
SVN local mods: Dave
The following front end source files have local modifications:
lsc/common/models/lscals.mdl Tue Mar 11 21:57:37 2014 M
lsc/h1/models/h1lsc.mdl Mon Oct 27 15:40:01 2014 M
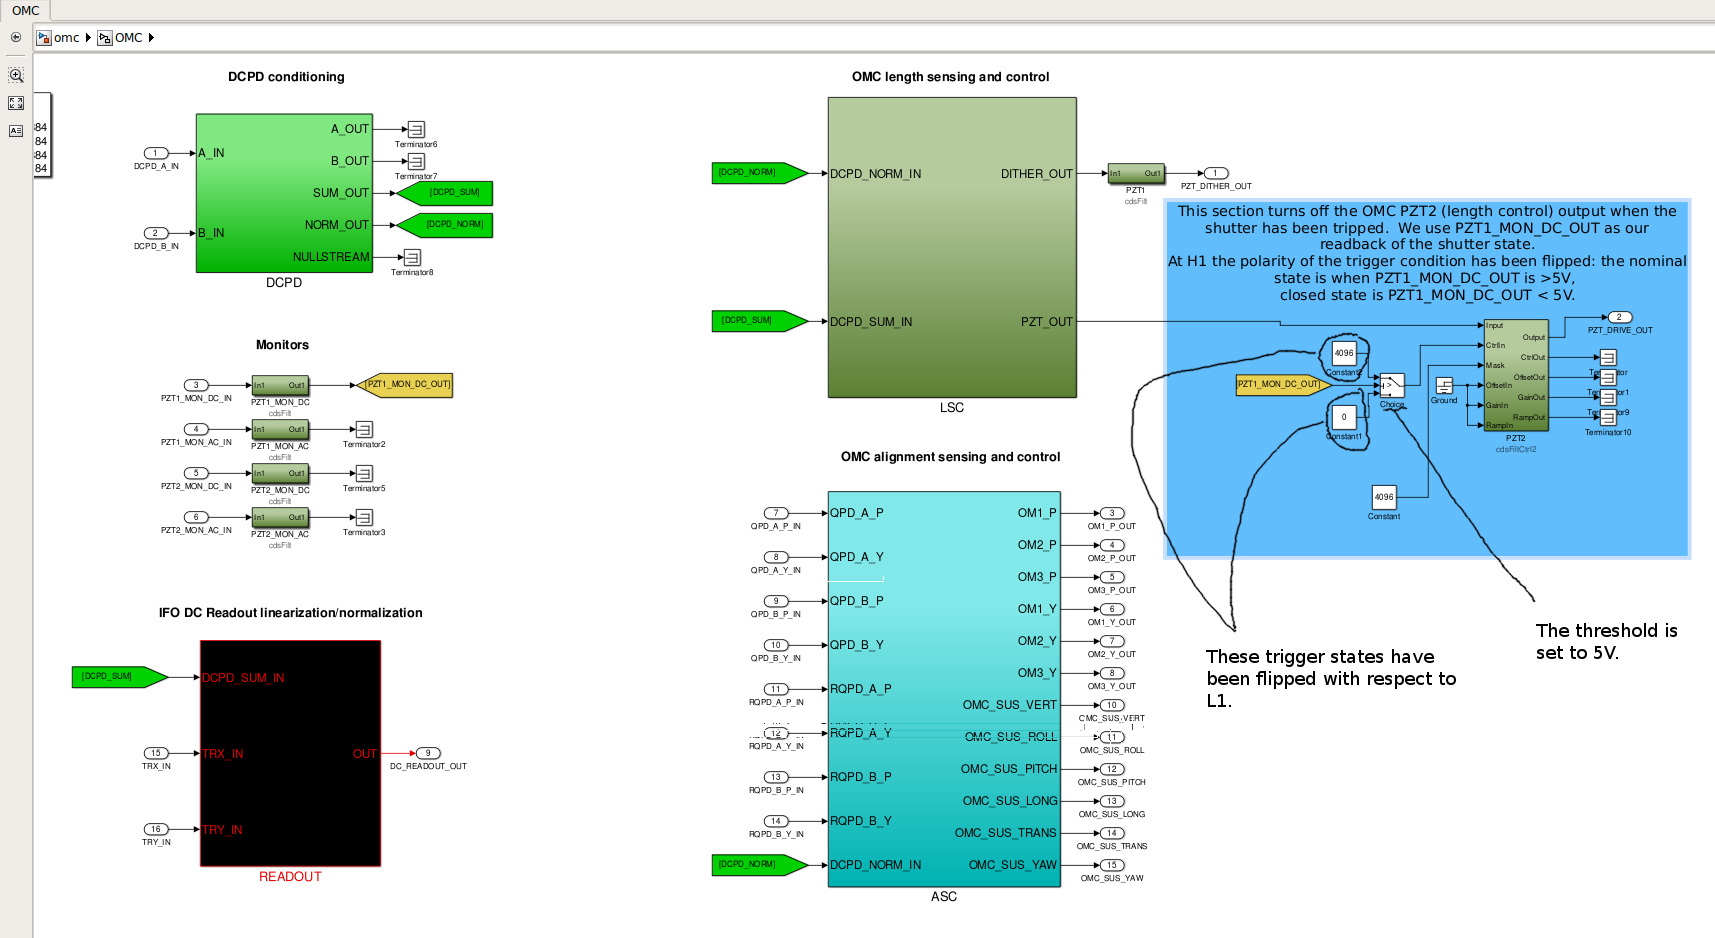
omc/common/models/omc.mdl Tue Dec 2 13:16:29 2014 M
omc/h1/models/h1omc.mdl Tue Dec 2 12:32:27 2014 M
psl/common/models/psldbb.mdl Fri Jan 10 19:19:47 2014 M
psl/common/models/pslfss.mdl Fri Nov 21 14:12:02 2014 M
psl/common/models/psliss.mdl Tue Nov 18 11:47:45 2014 M
psl/common/models/pslpmc.mdl Fri Nov 21 14:13:54 2014 M
psl/h1/models/h1pslfss.mdl Wed Sep 17 14:54:45 2014 M
psl/h1/models/h1psliss.mdl Fri Nov 21 14:16:00 2014 M
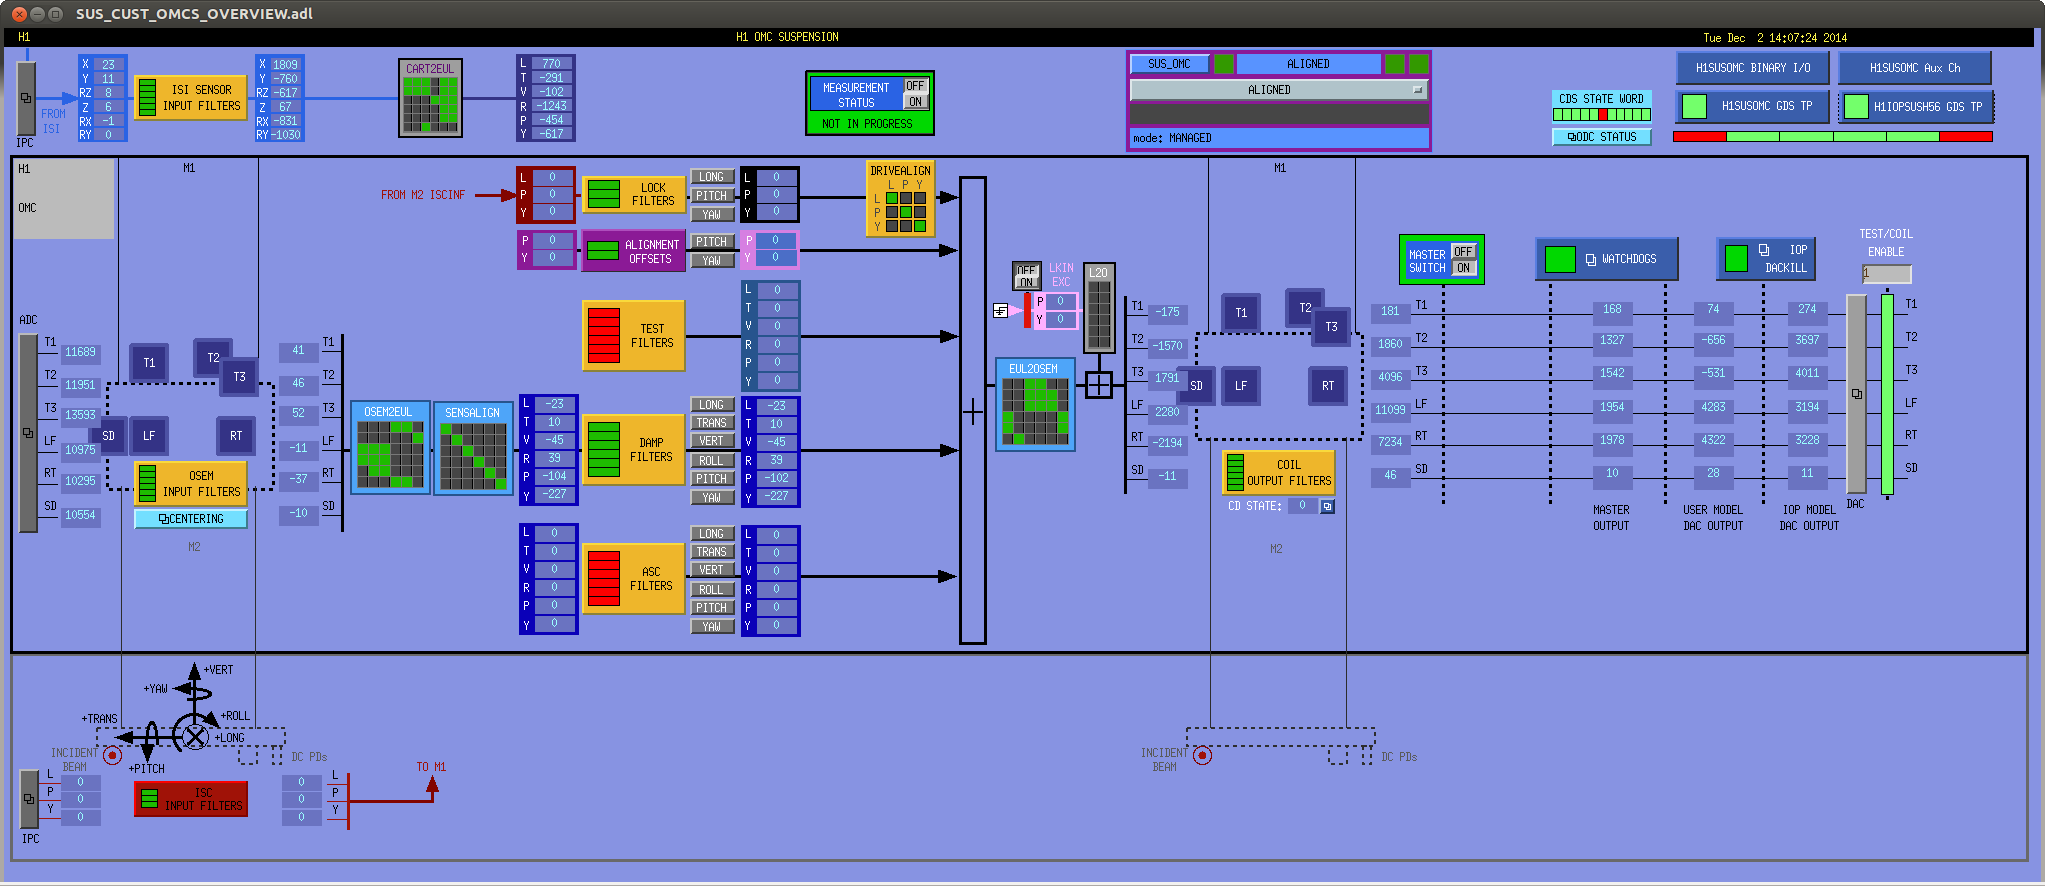
sus/h1/models/h1susomc.mdl Tue Dec 2 12:32:25 2014 M
the following guardian files have local modifications:
M common/guardian/ALS_DIFF.py
M common/guardian/ALS_COMM.py
M common/guardian/ALS_ARM.py
M common/guardian/IMC_LOCK.py
M h1/guardian/lscparams.py
M h1/guardian/ISC_DRMI.py
M common/guardian/LSC_PRMIsb.py
M common/guardian/LSC_CARM.py
M h1/guardian/lsclib/prxy/carrierlock.py
M h1/guardian/lsclib/pdOffsetNull/pdOffsetNull.py
M h1/guardian/lsclib/prmi/sidebandlock.py
MM h1/guardian/LSC.py
M common/guardian/OMC_LOCK.py
M h1/guardian/omcparams.py
M common/guardian/SUS.py
M common/guardian/susconst.py
M common/guardian/SUS_TMS.py
M common/guardian/SUS_BS.py
M h1/guardian/SUS.py
M common/guardian/ifolib/CameraInterface.py
M h1/guardian/H1ECATX1PLC2.py
M h1/guardian/H1ISCEX.py
M h1/guardian/CSD_LoadDatabase.cmd
DMT Broadcaster: Dave
Checked all DMT channels are in the DAQ. Found to my chagrin that two channels were duplicated in the broadcaster list. H1:PEM-EX_MIC_VEA_MINUSX_DQ and H1:PEM-EX_MIC_VEA_PLUSX_DQ. I have removed the duplication which will be applied on the next DAQ restart.


We tripped the ISI even while DRMI was locking (and luckily did not break the lock). We compared the length signal to the BS between today and yesterday, and concluded the LSC signals were not very different and were not the culprit.