Betsy, Travis, Rick
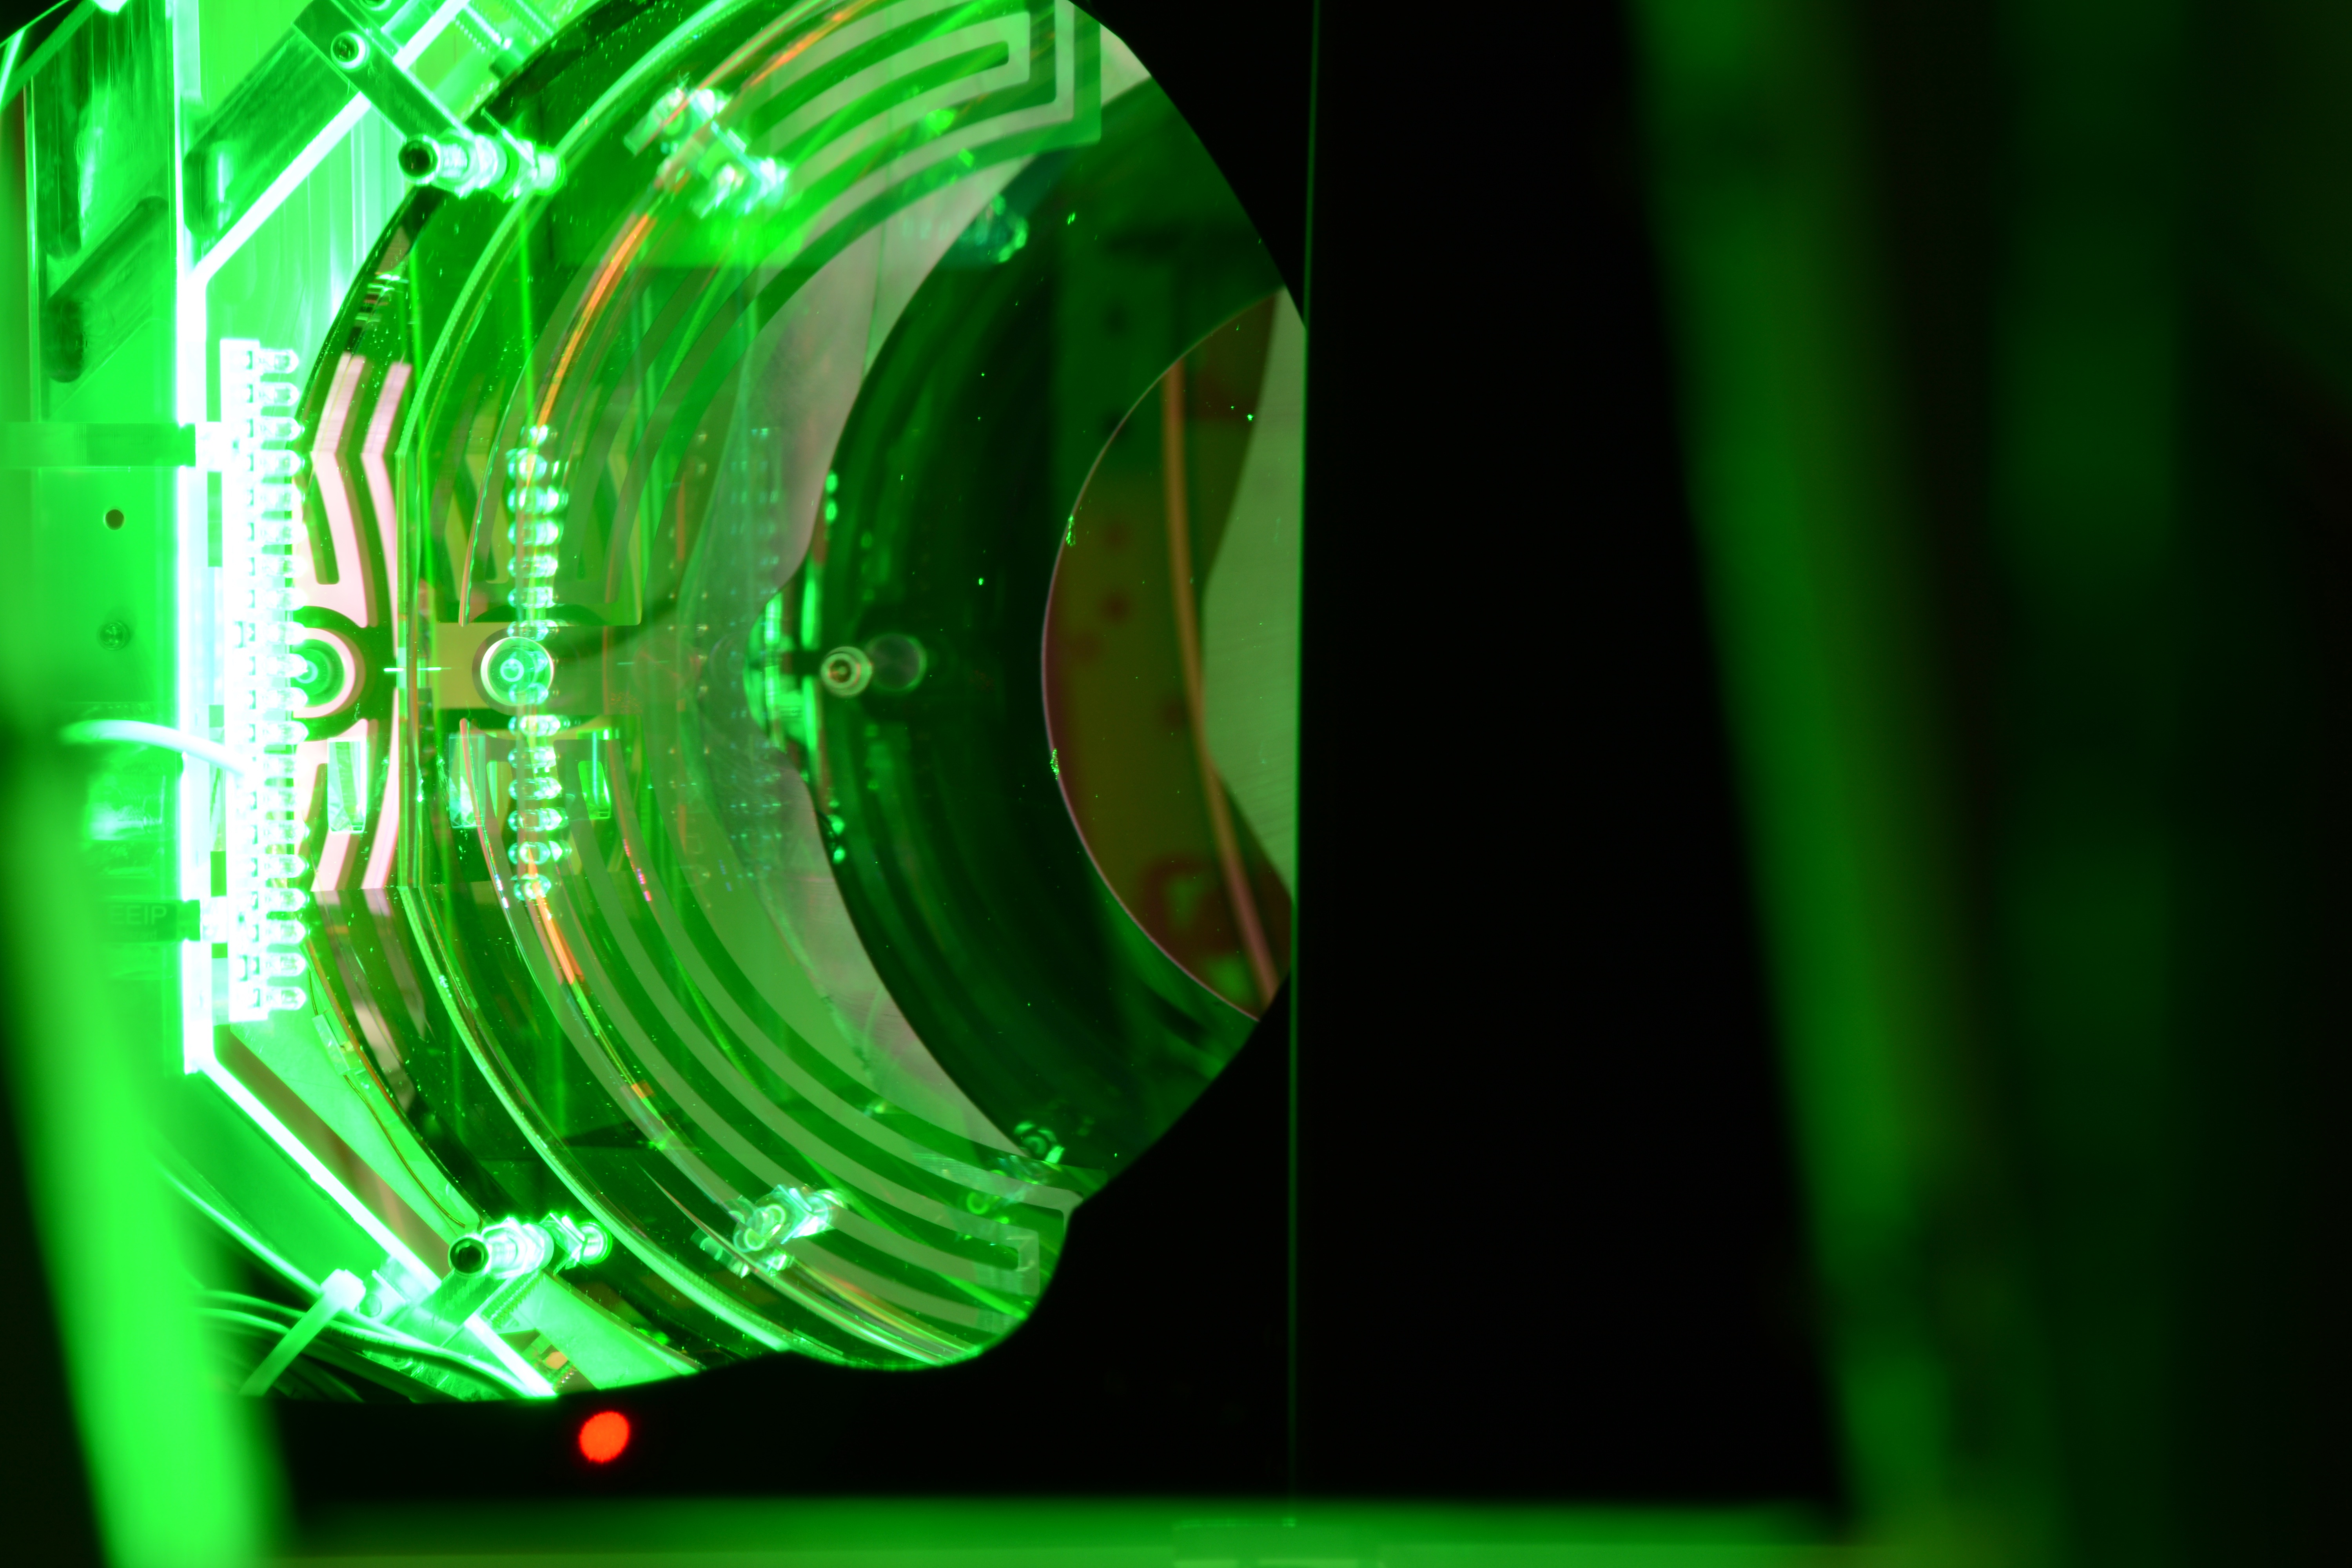
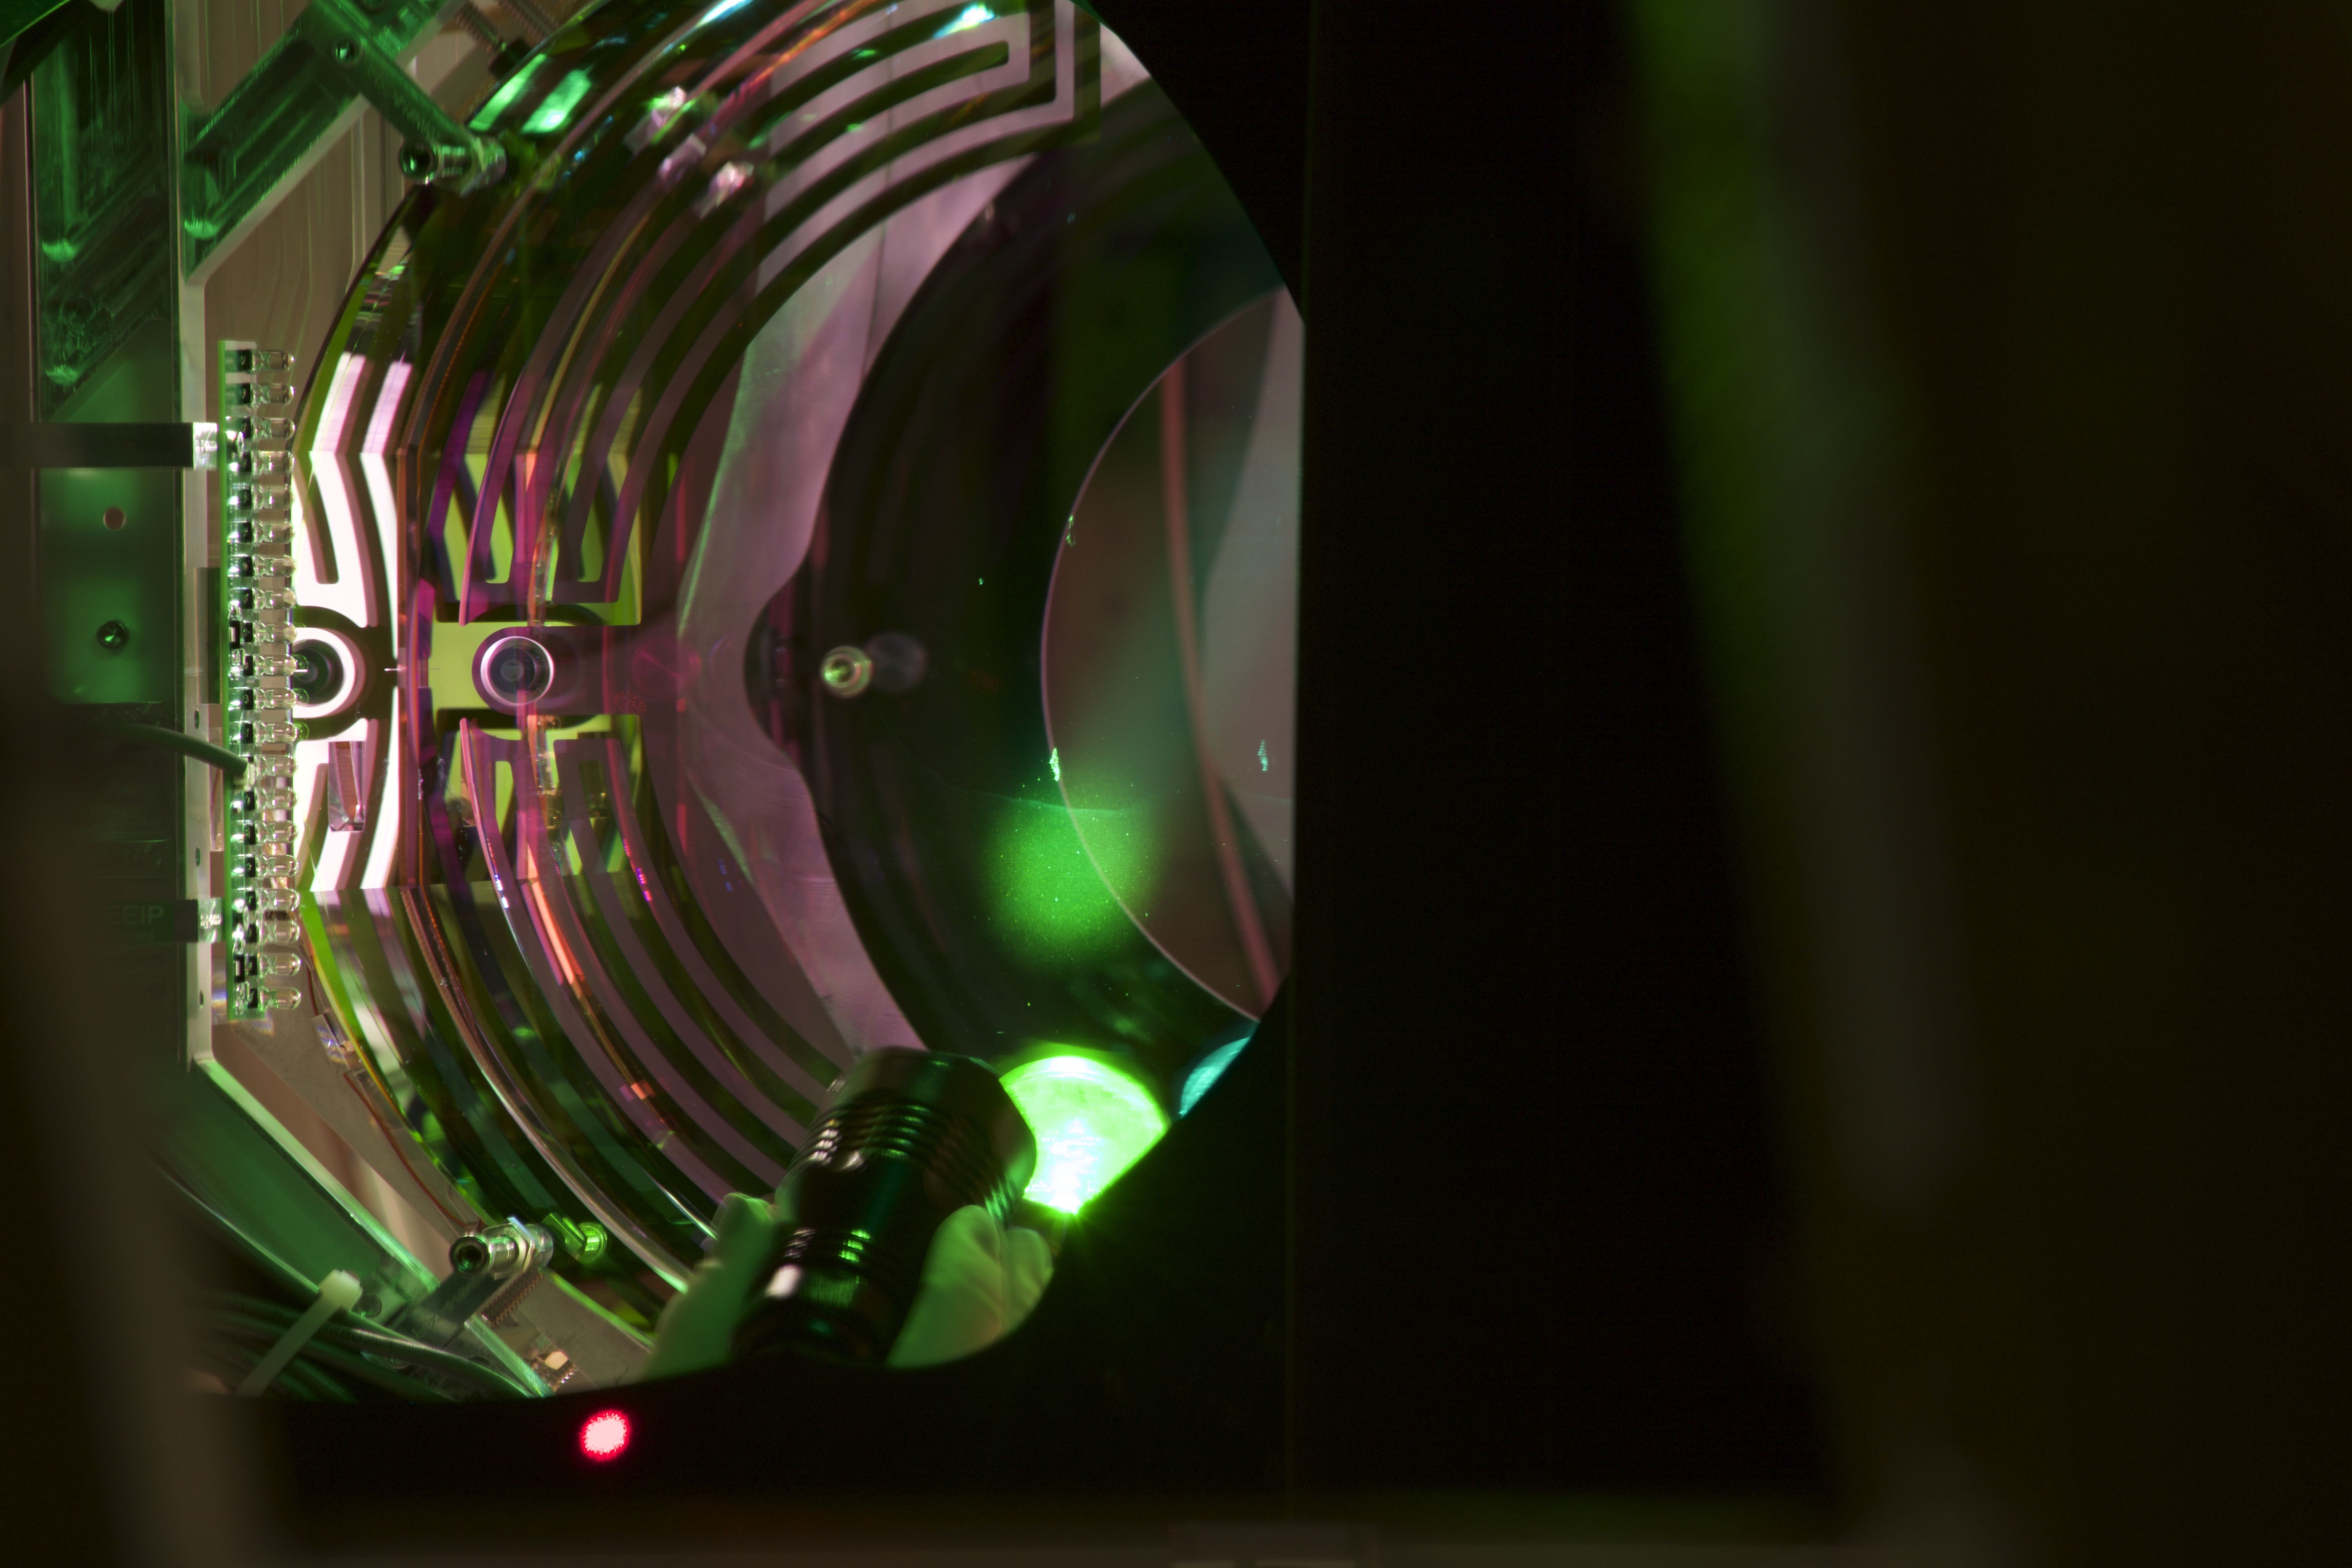
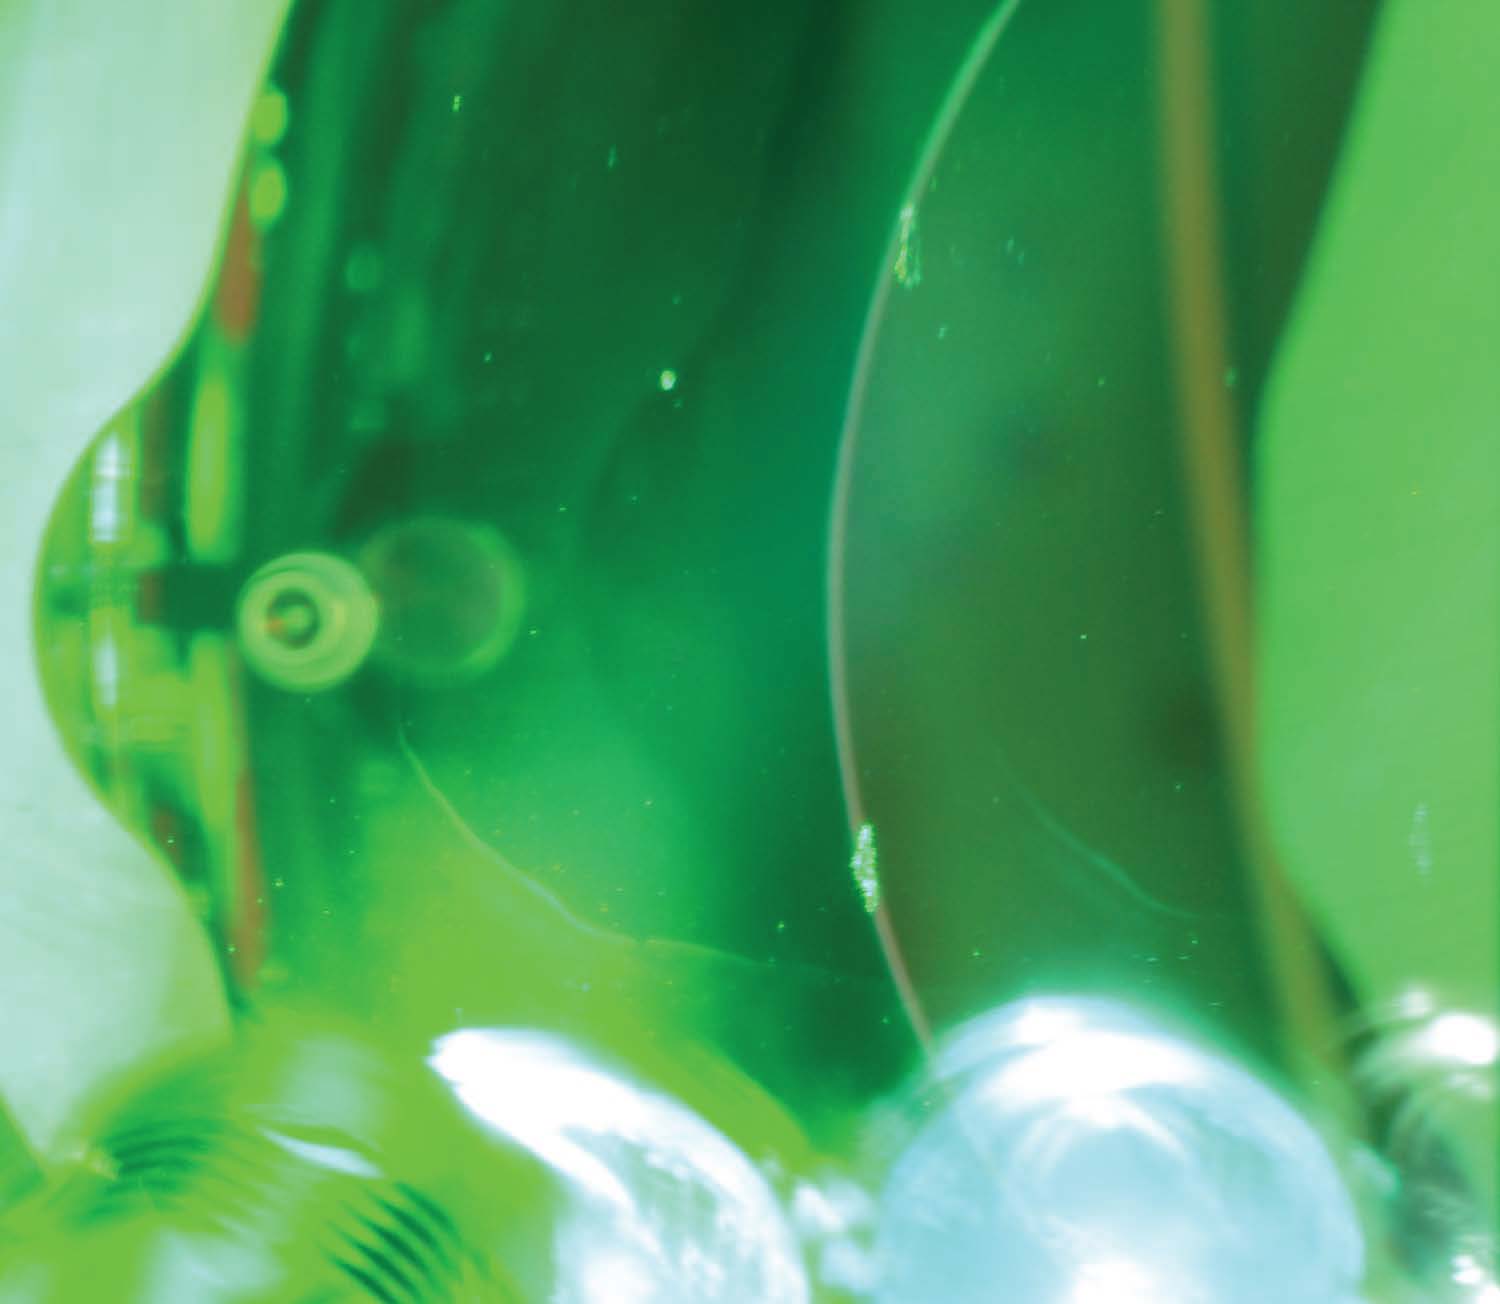
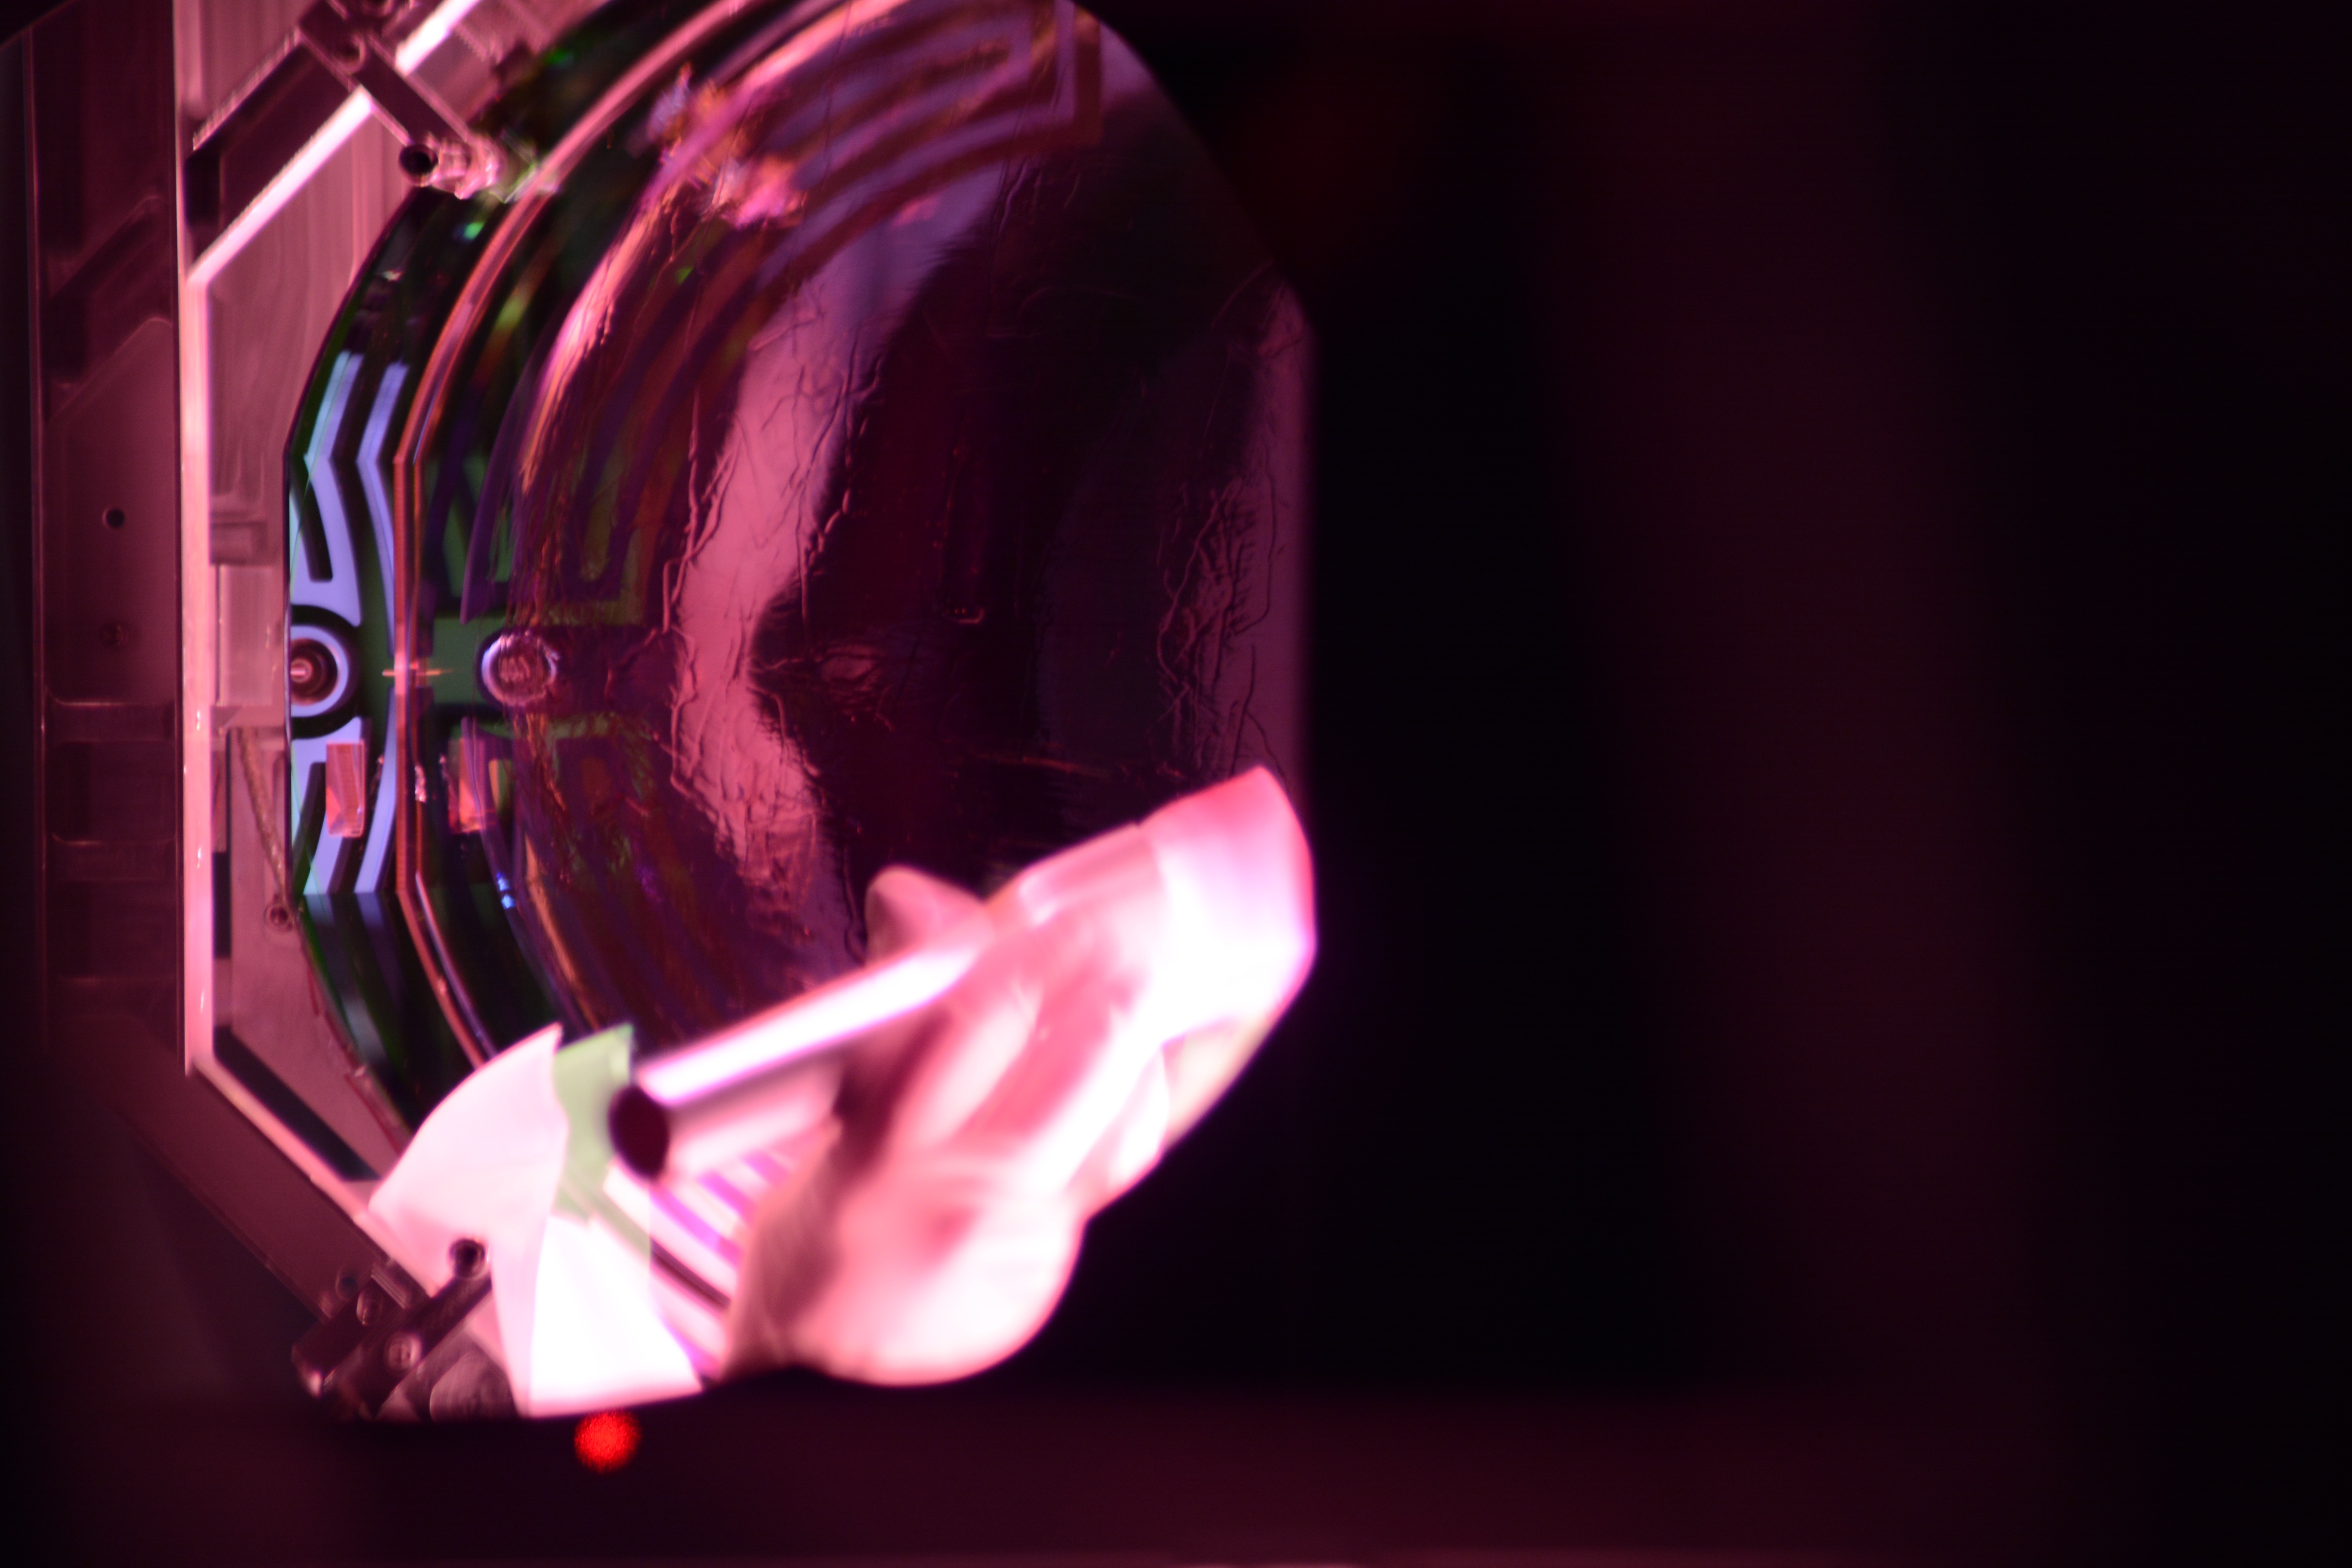
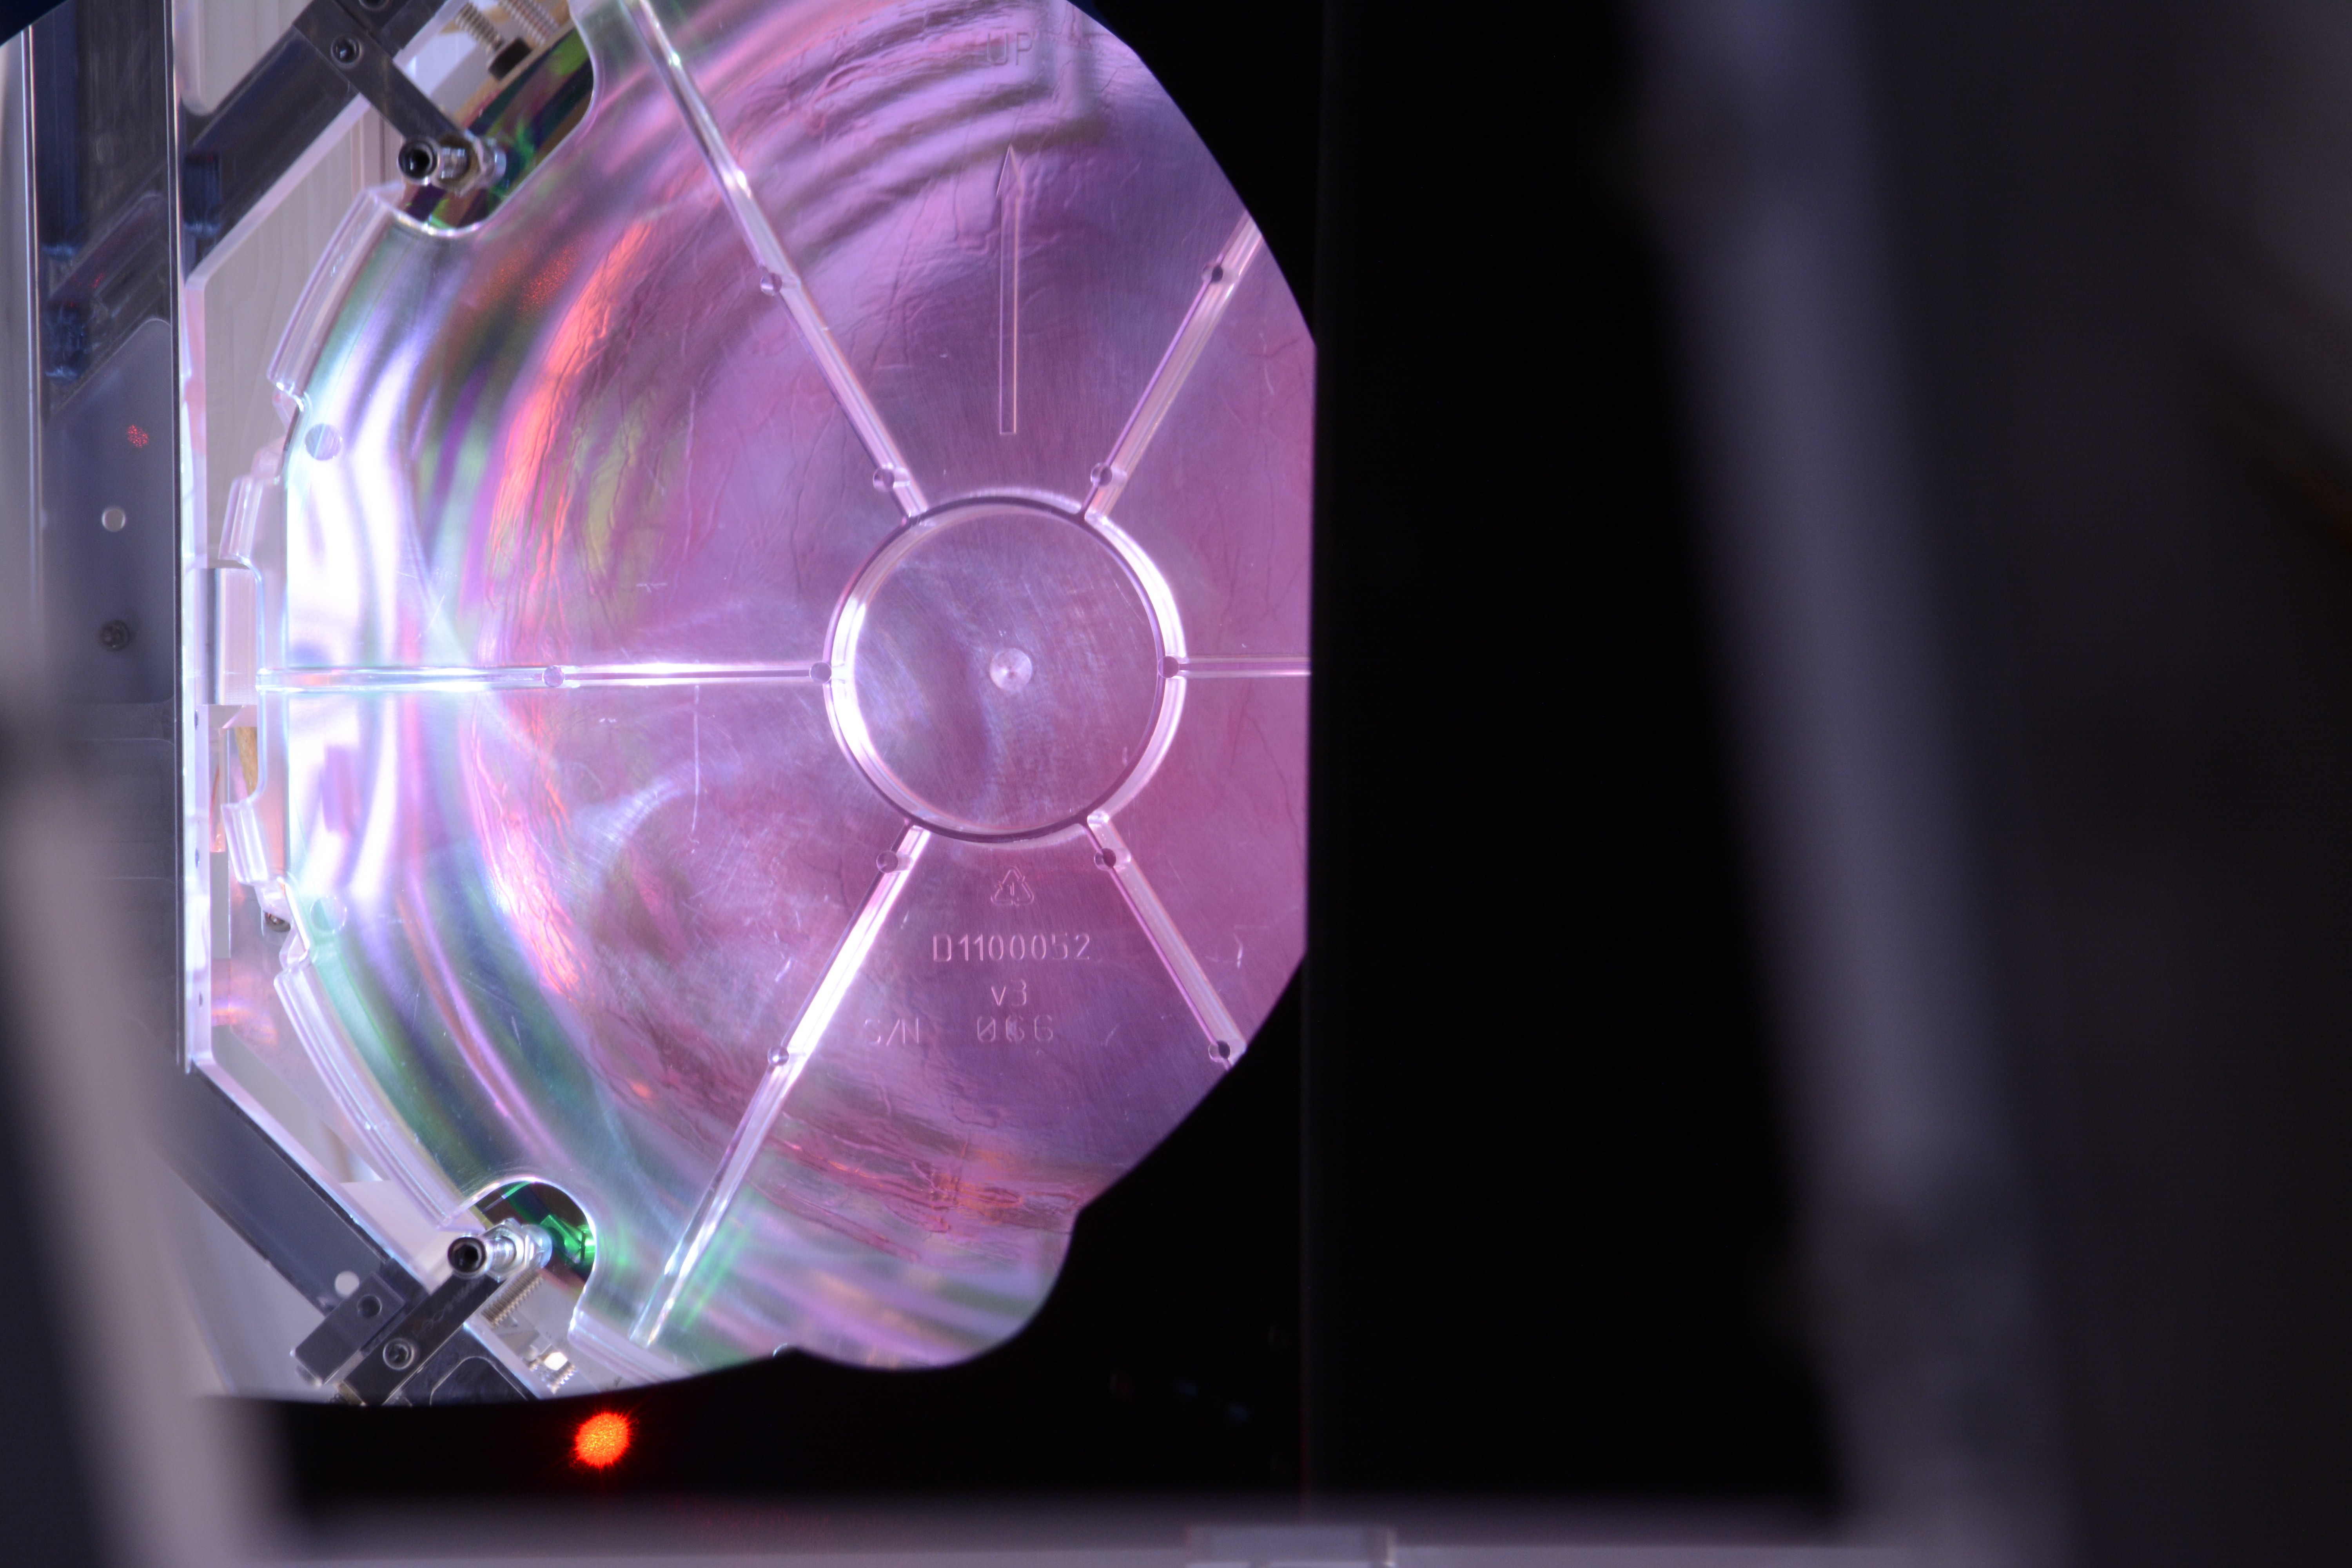
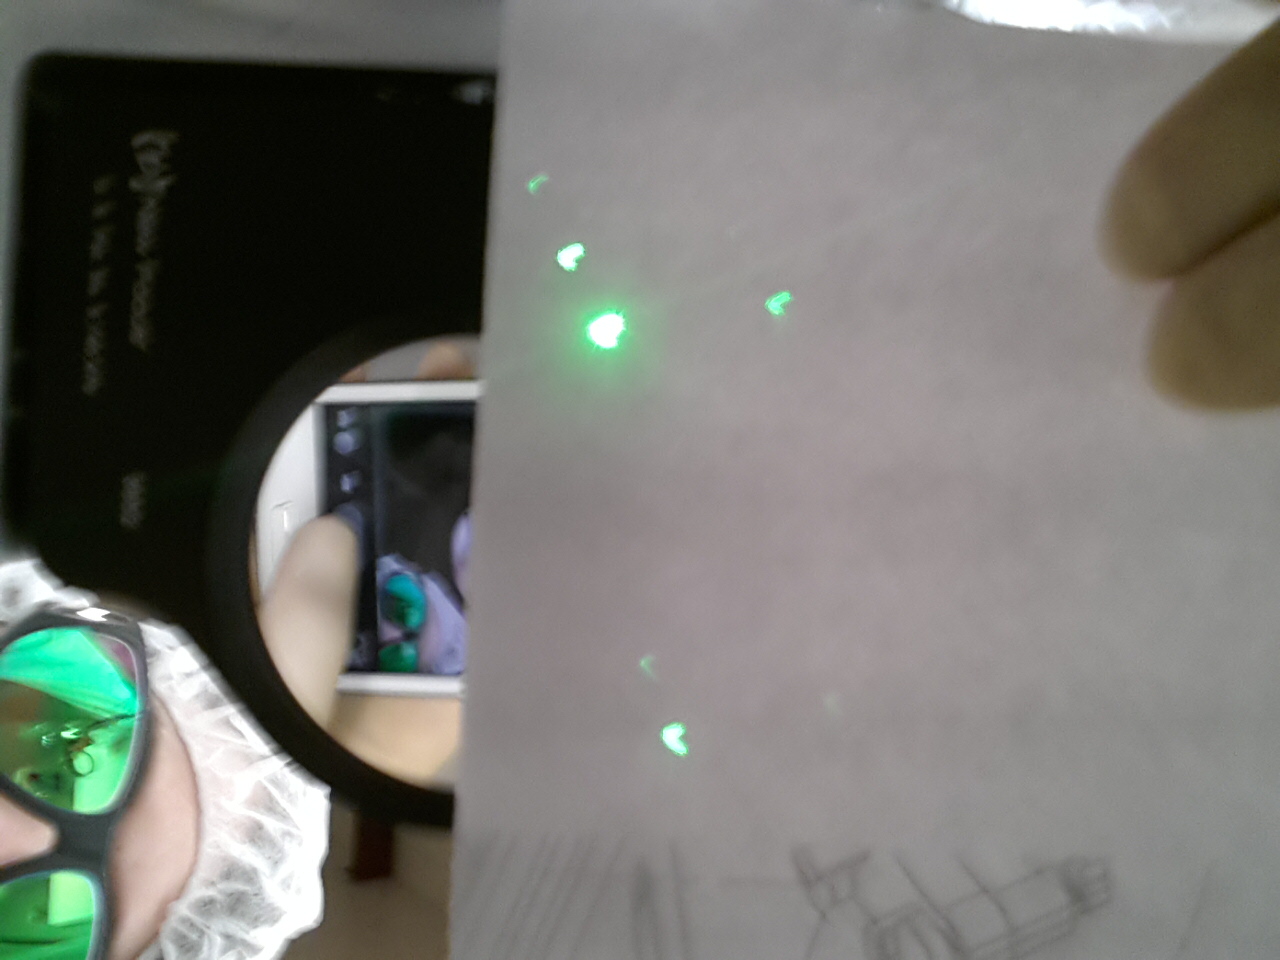
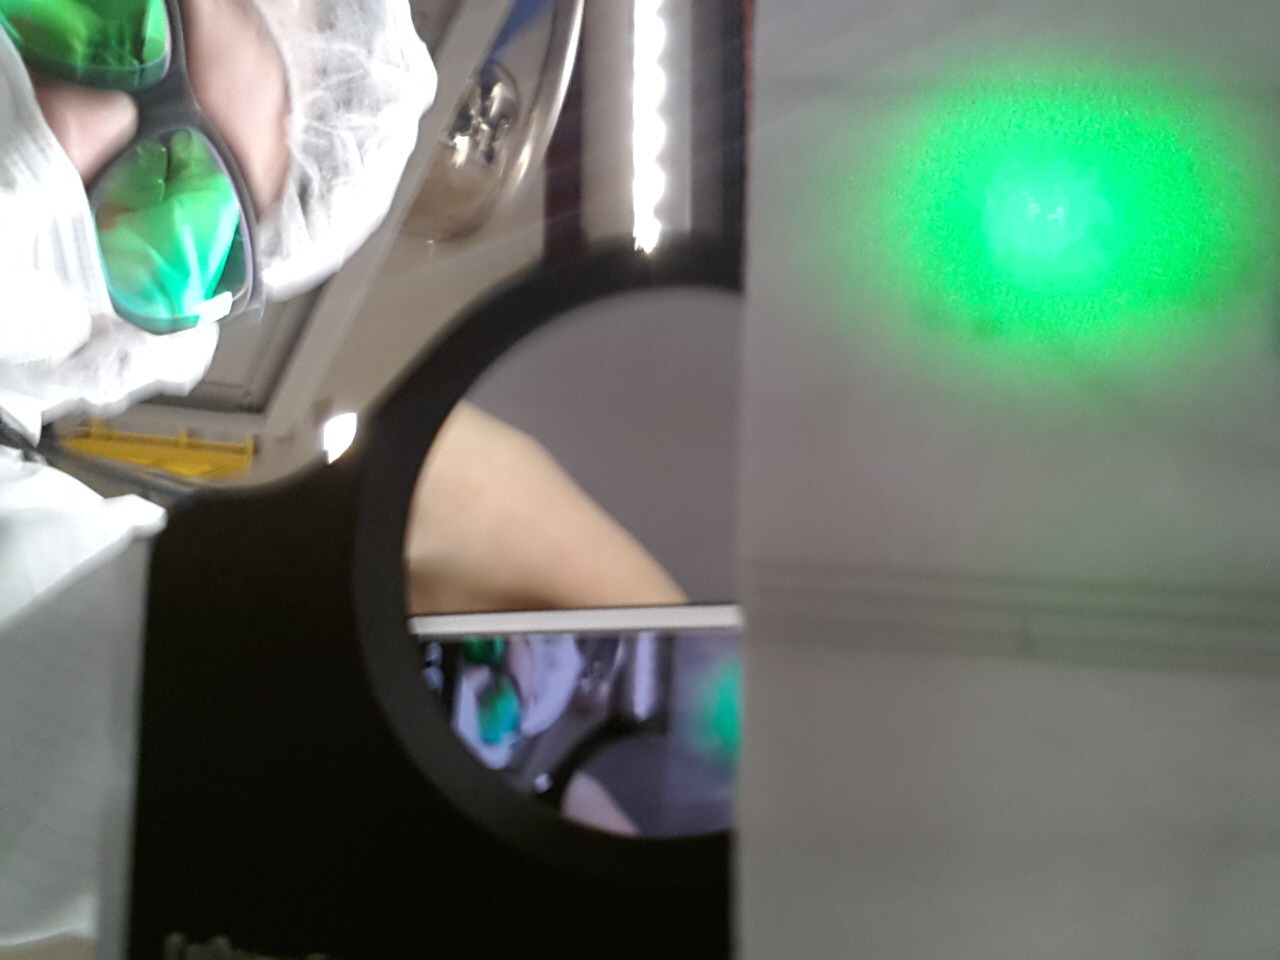
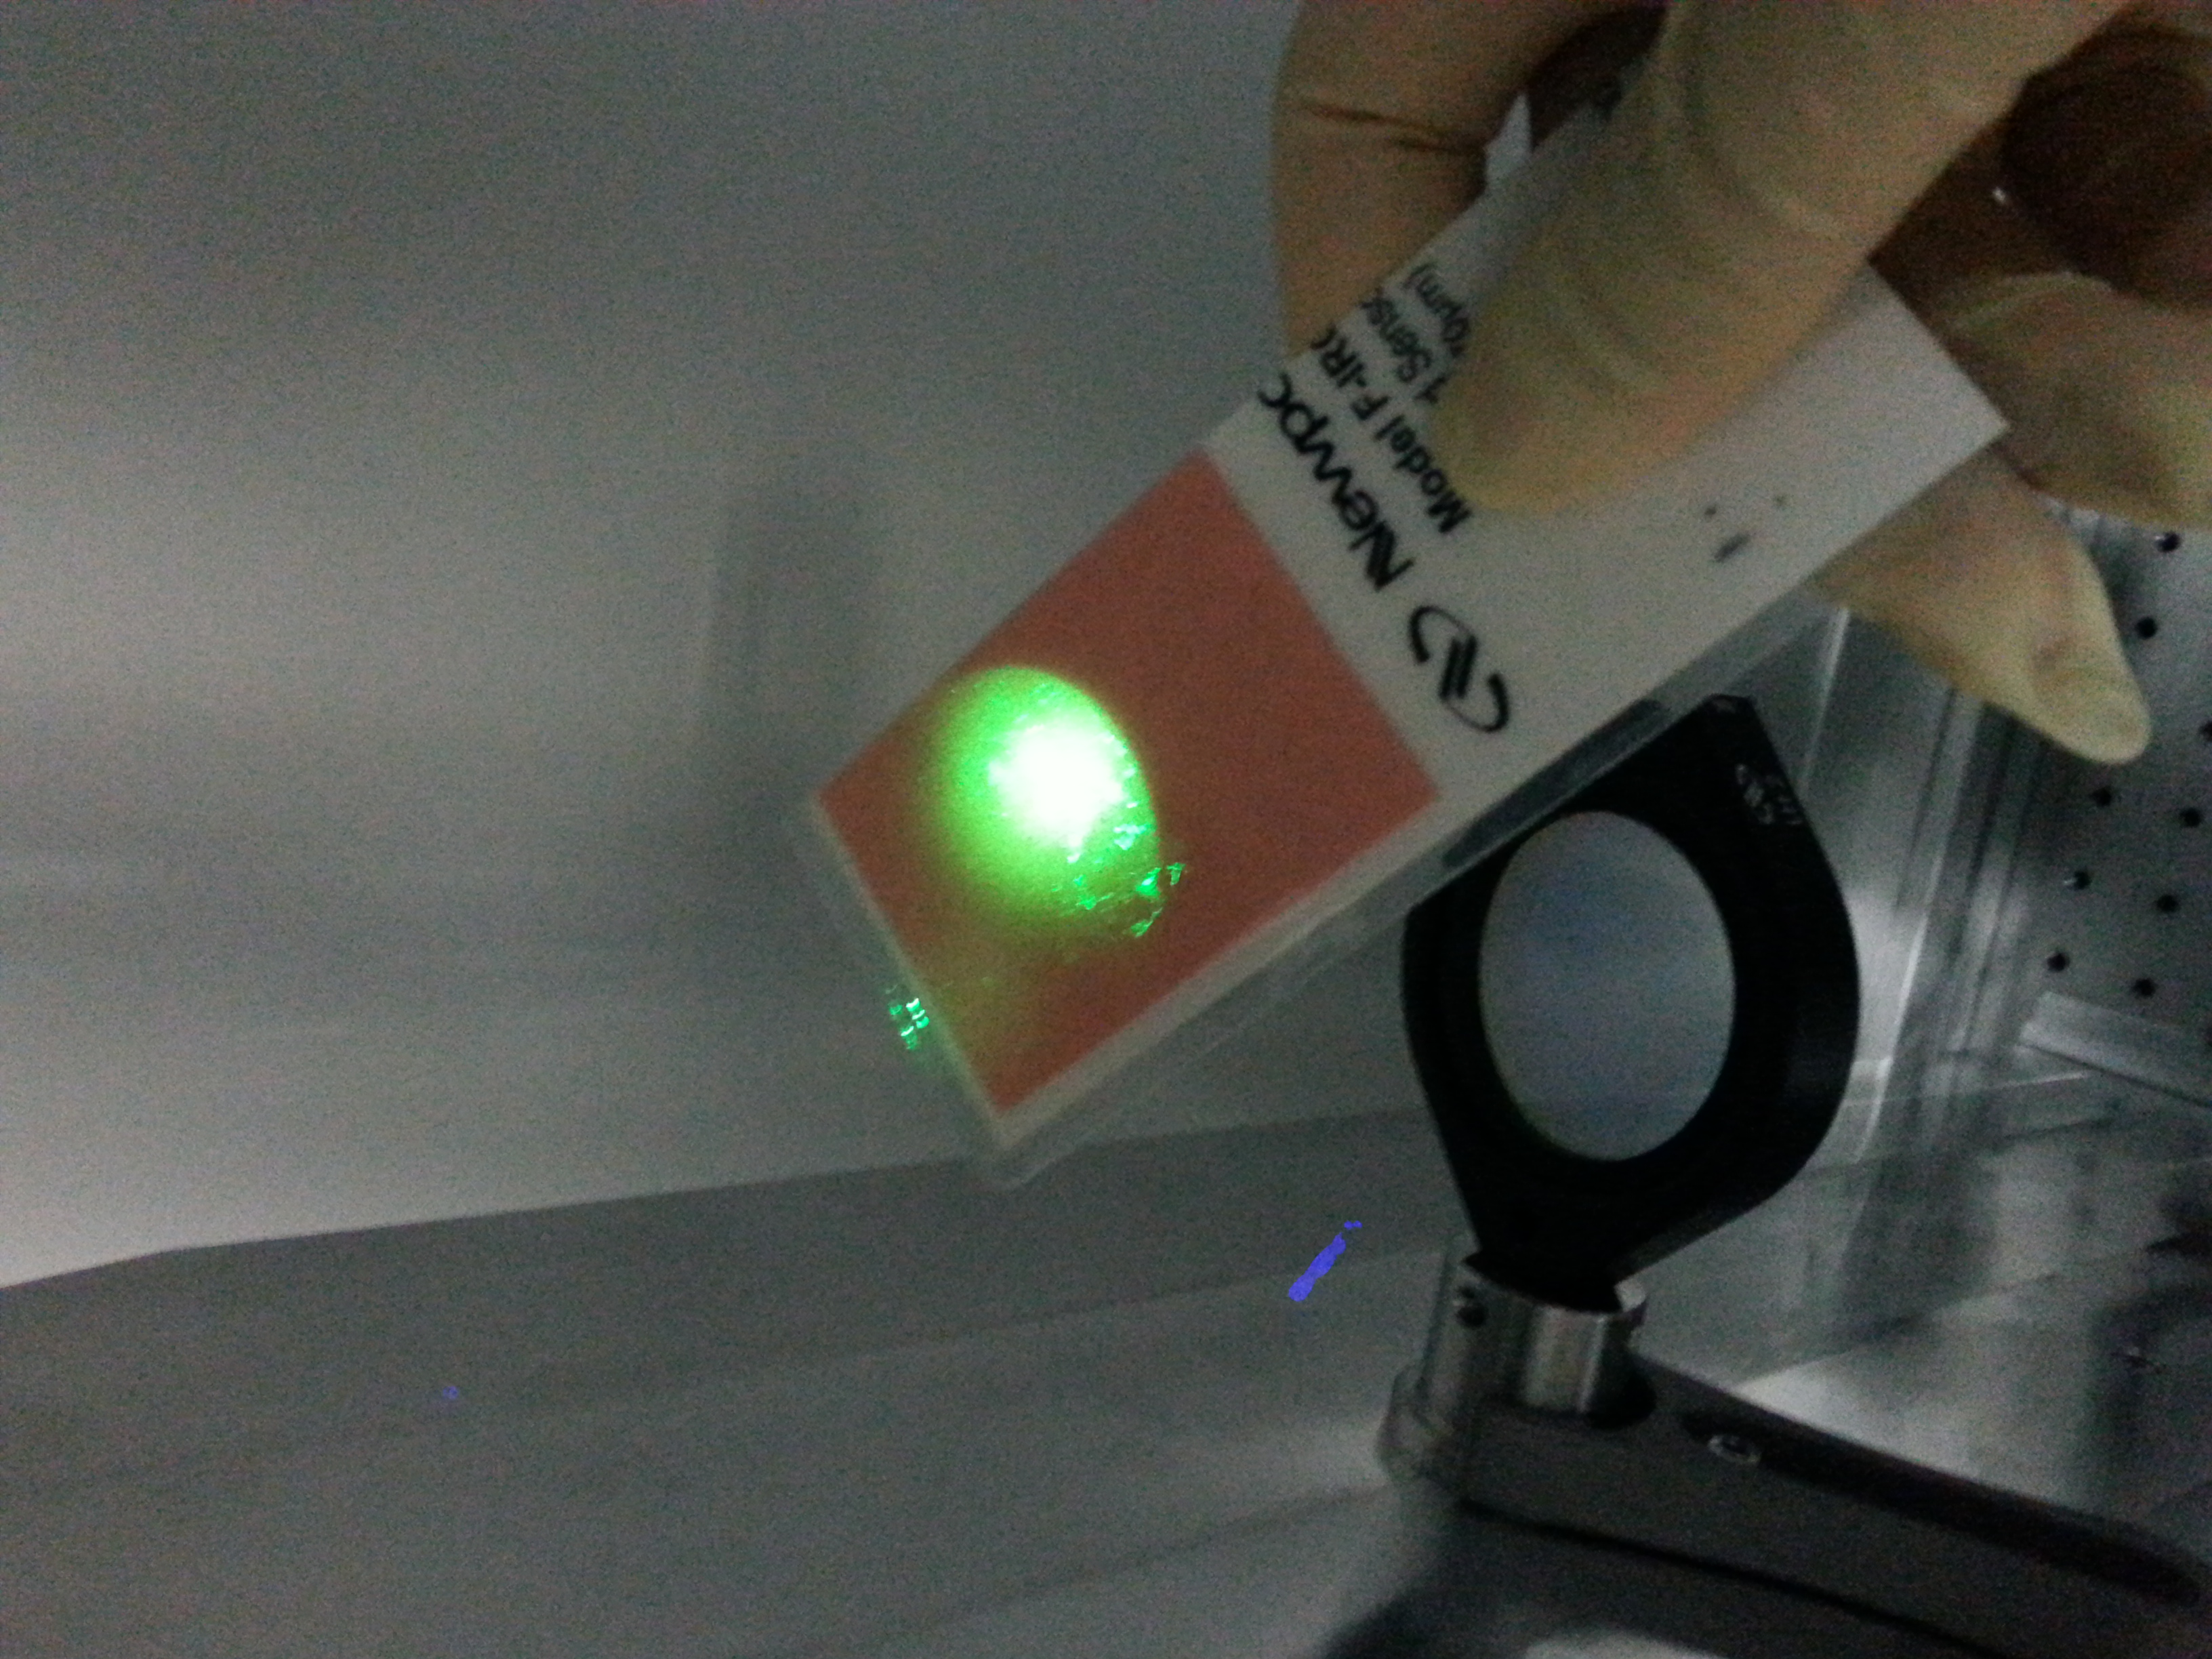
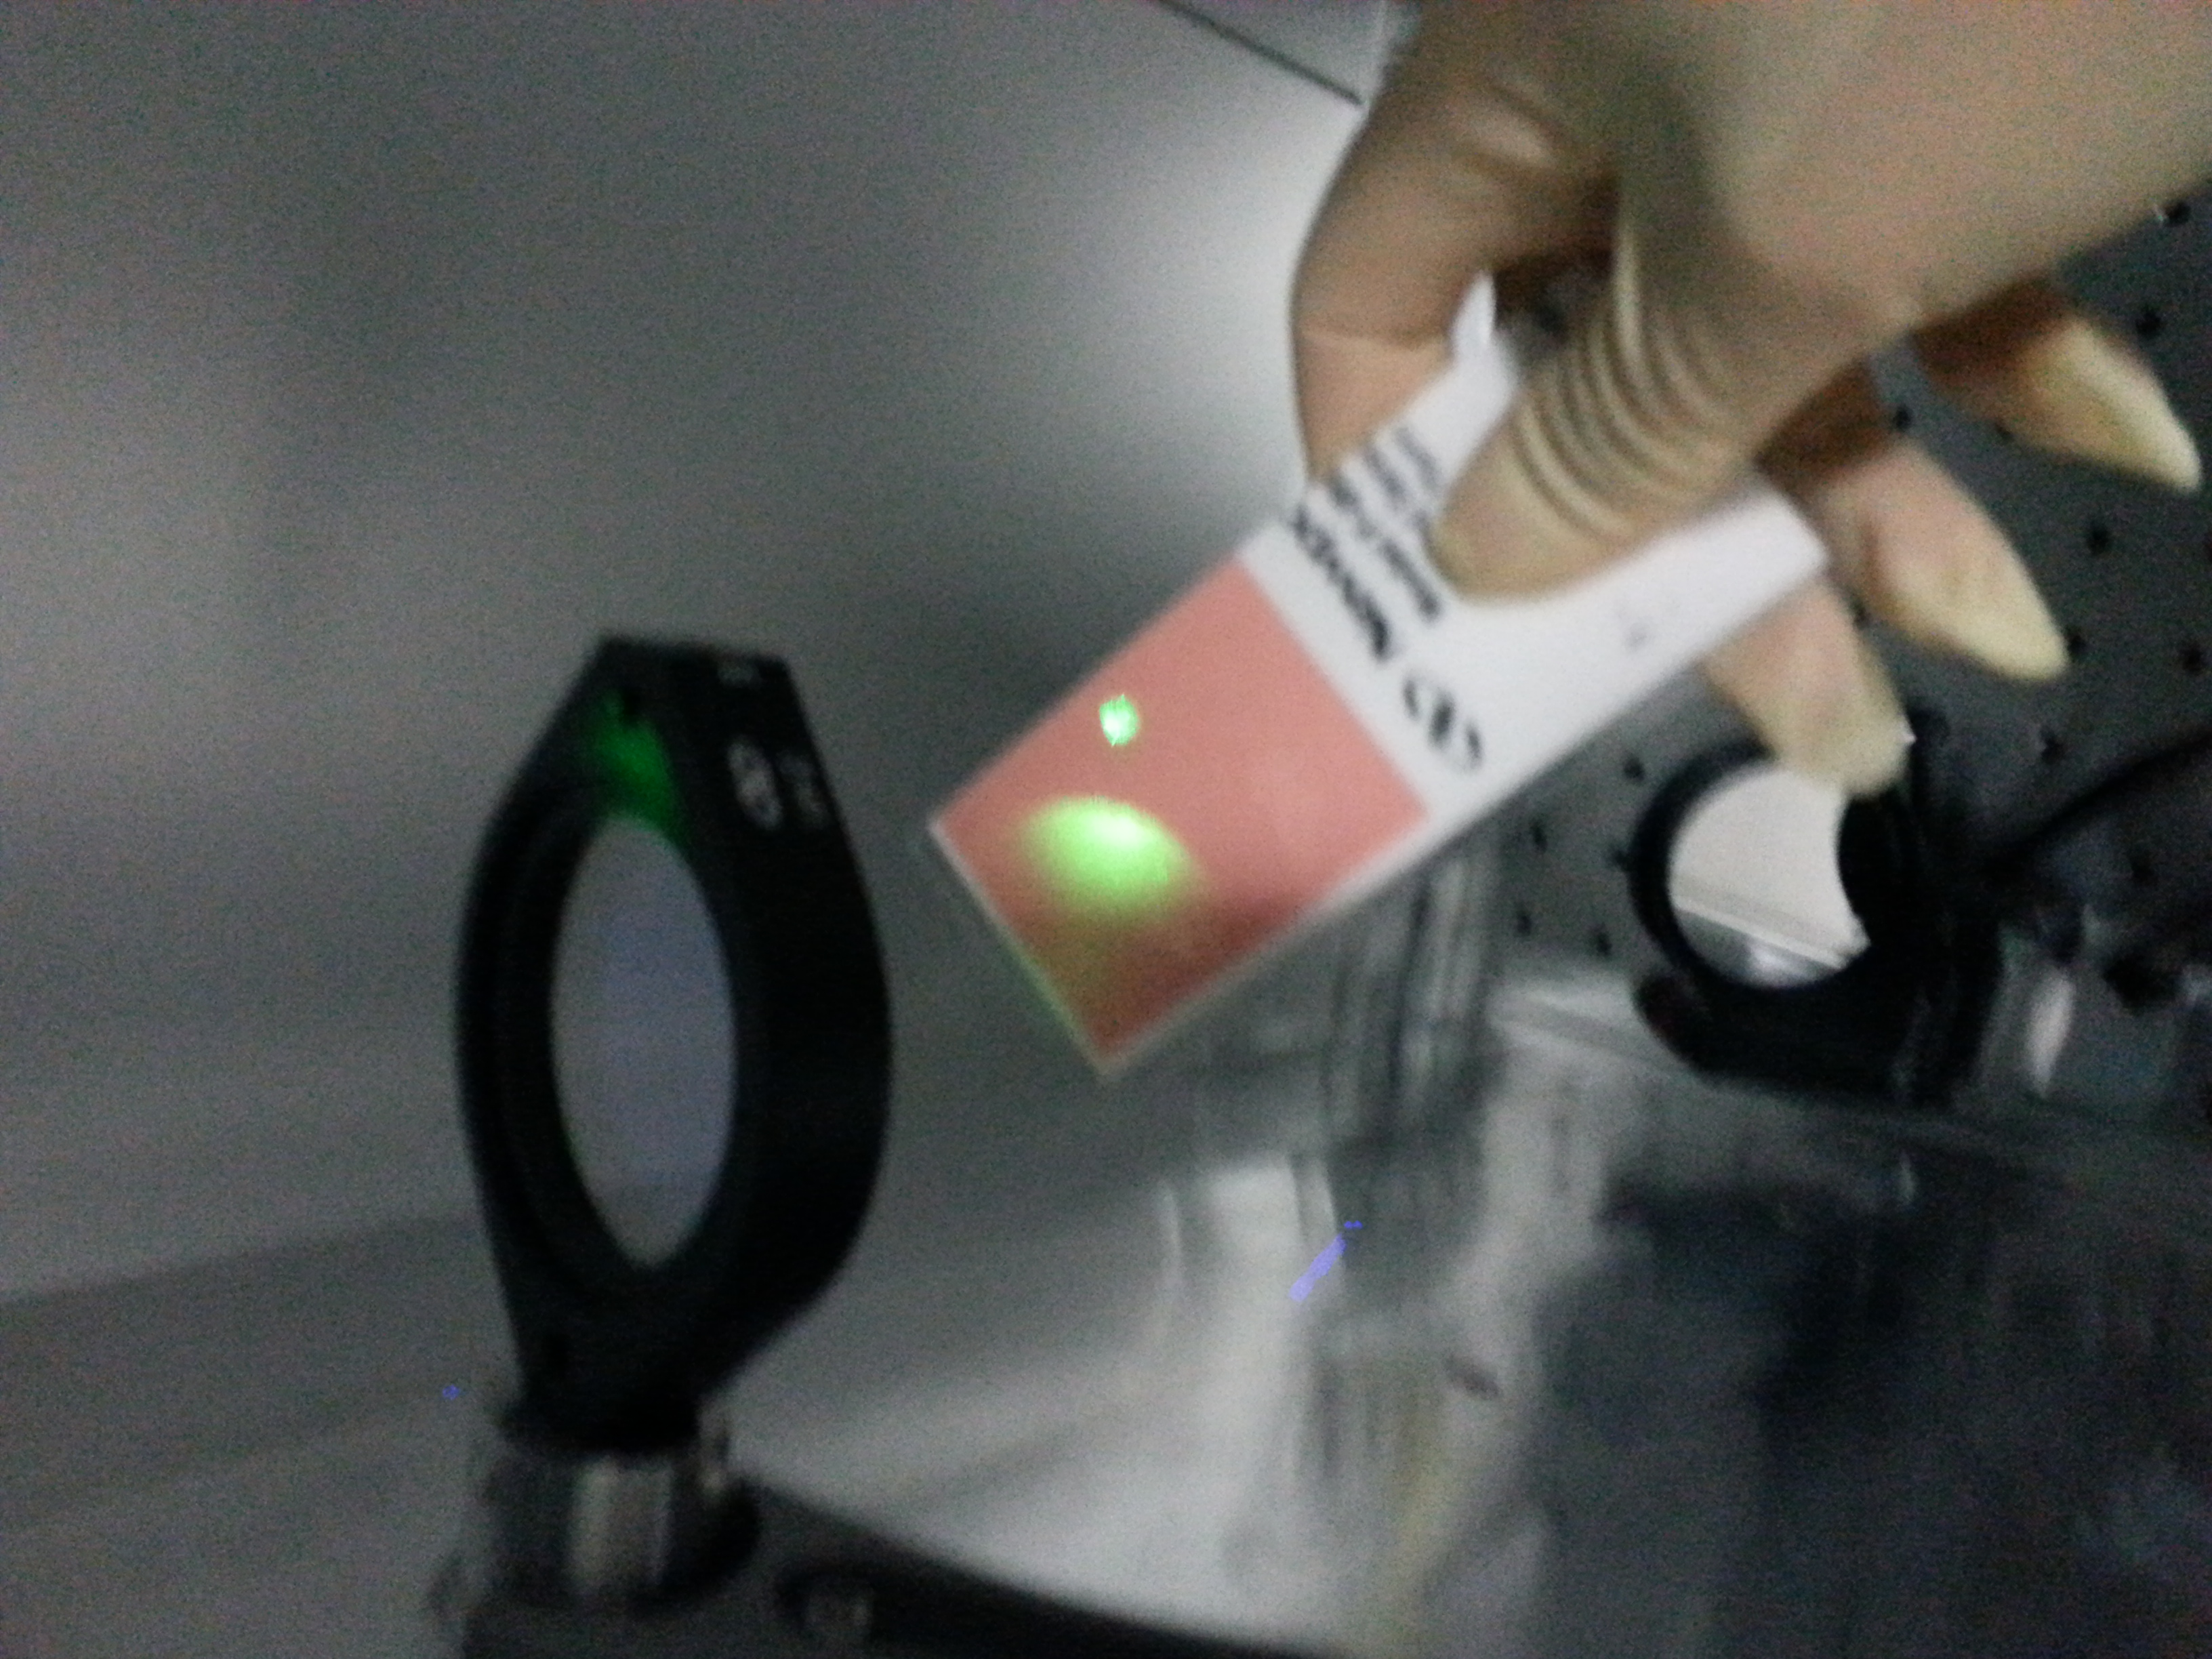
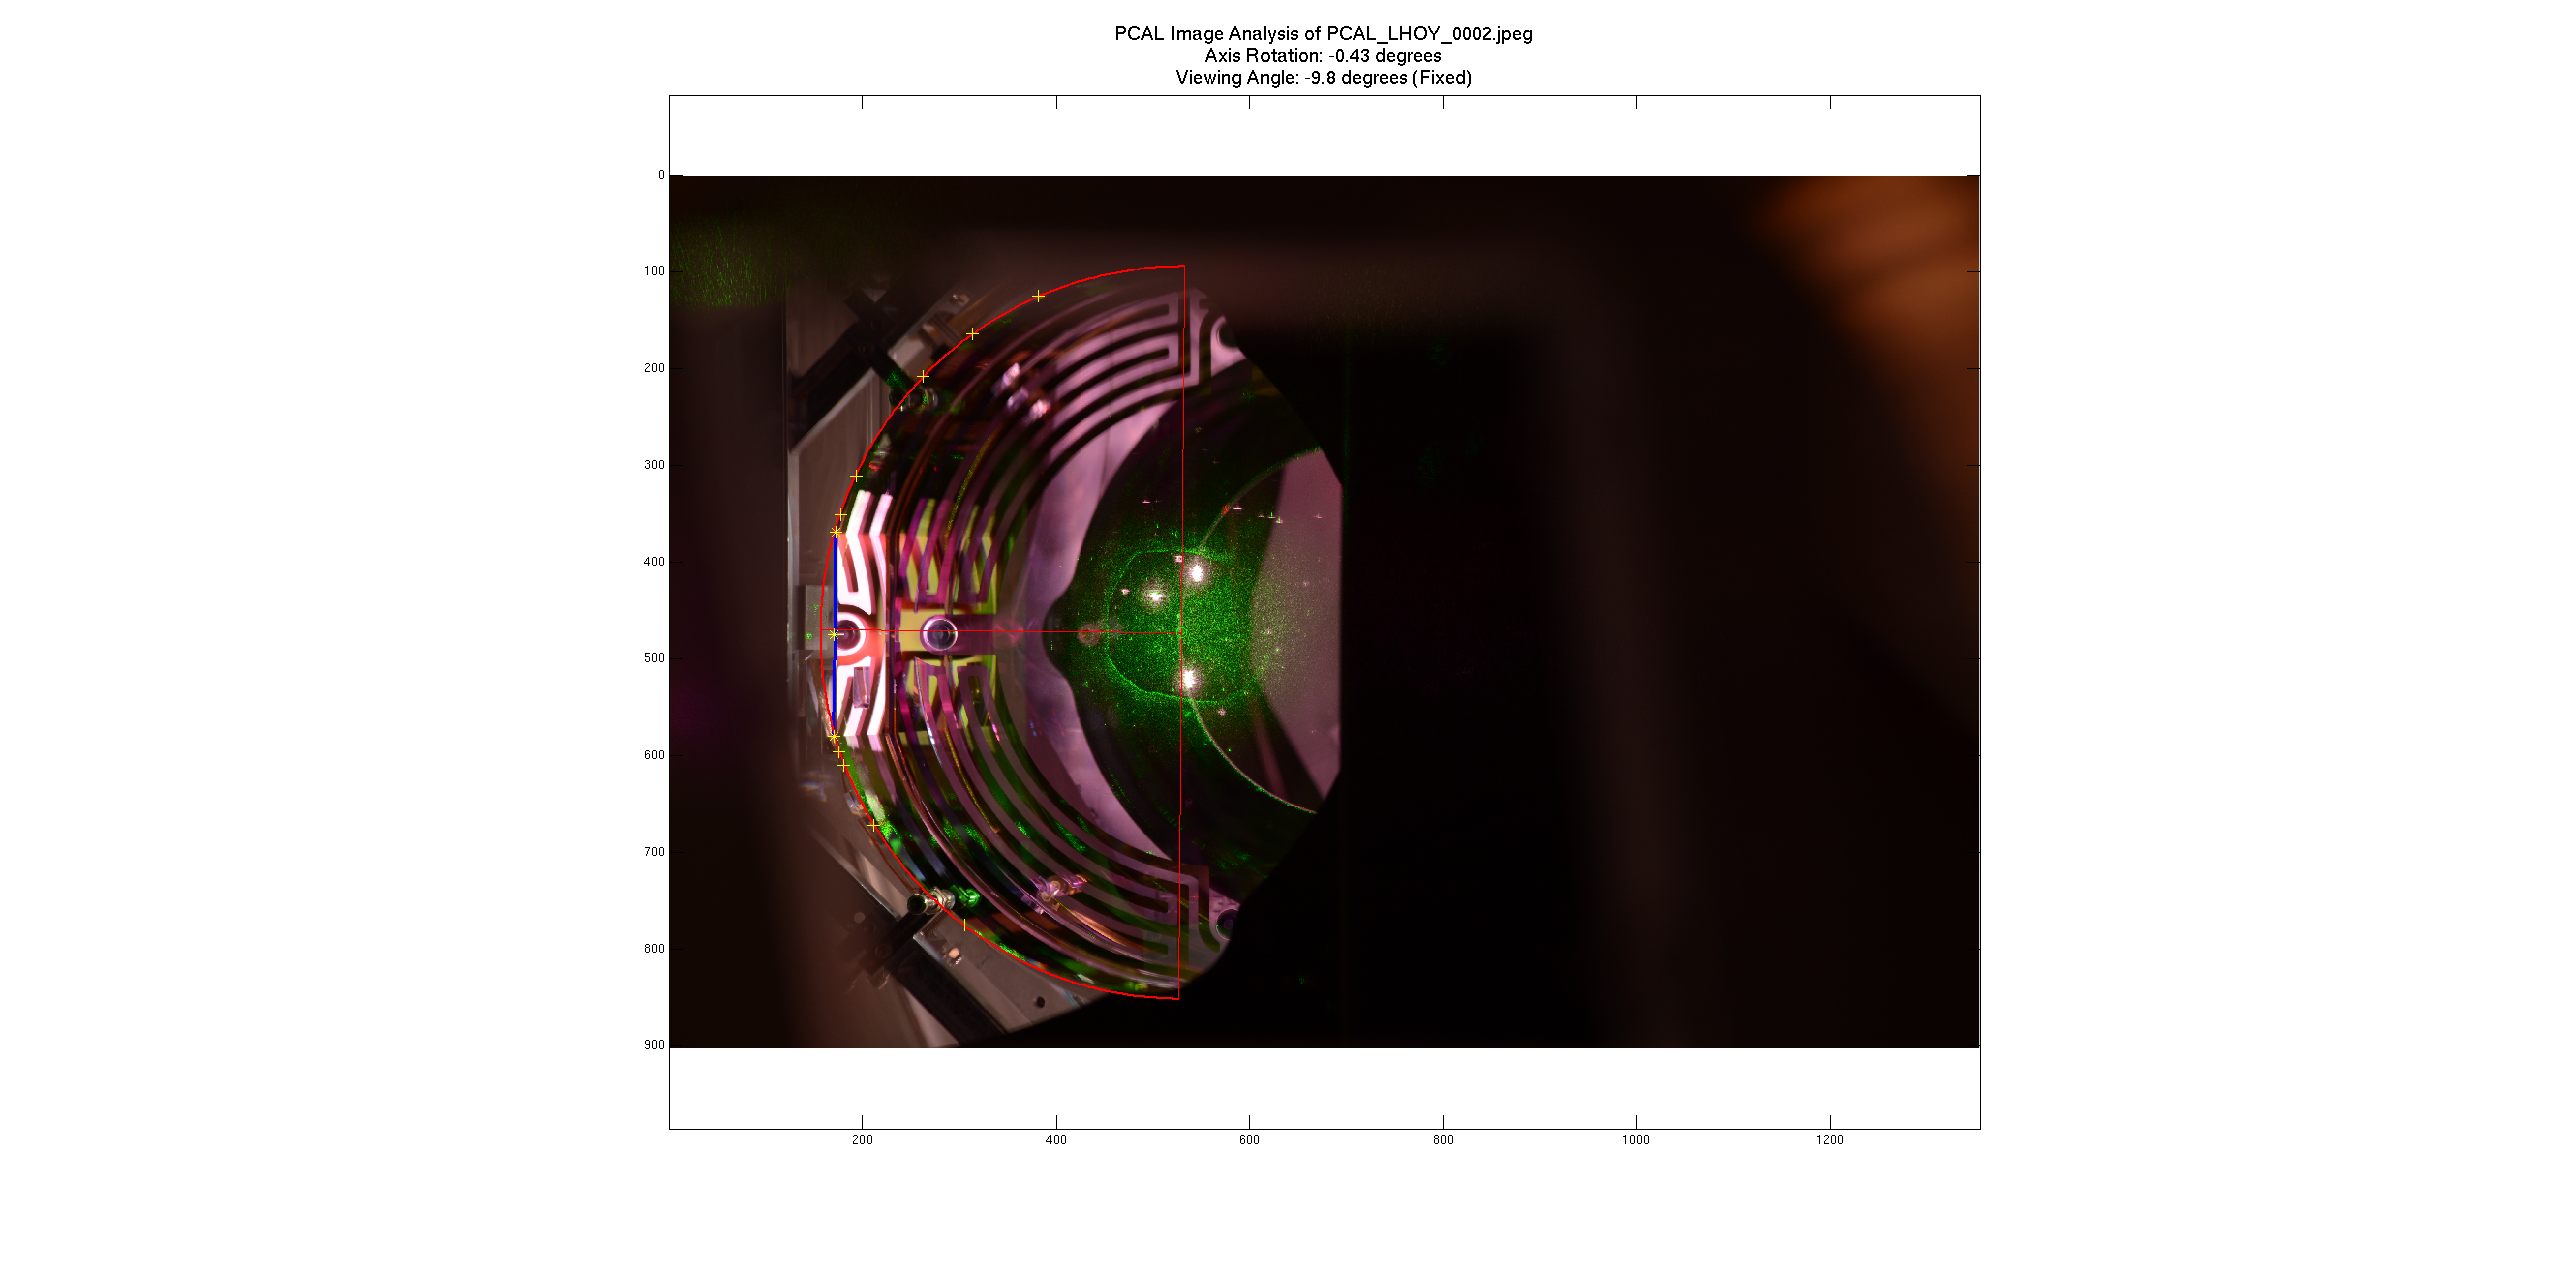
After Jim finished locking the ISI this afternoon, Travis hopped in the chamber. Using the Green LED flashlight (part of the "green lantern" kit) he immediately identified the 3 spots on the HR surface of the ETMy that last week's pcal images highlighted - 2 fairly large chunks of FirstContact (FC) remnants and one quite small one. I also went into the chamber and with green and white flashlights we then identified the ring observed at 3" diameter around the center of the optic also due to previous FC sheets. The 3 macroscopic remnants near the center of the optics look very similar to remnants we have observed on other failed FC sheet pulls, and were likely left on there from the March cleaning FC sheet, and not from the original sheet. Why Margot and I missed them in March is beyond me.
We then:
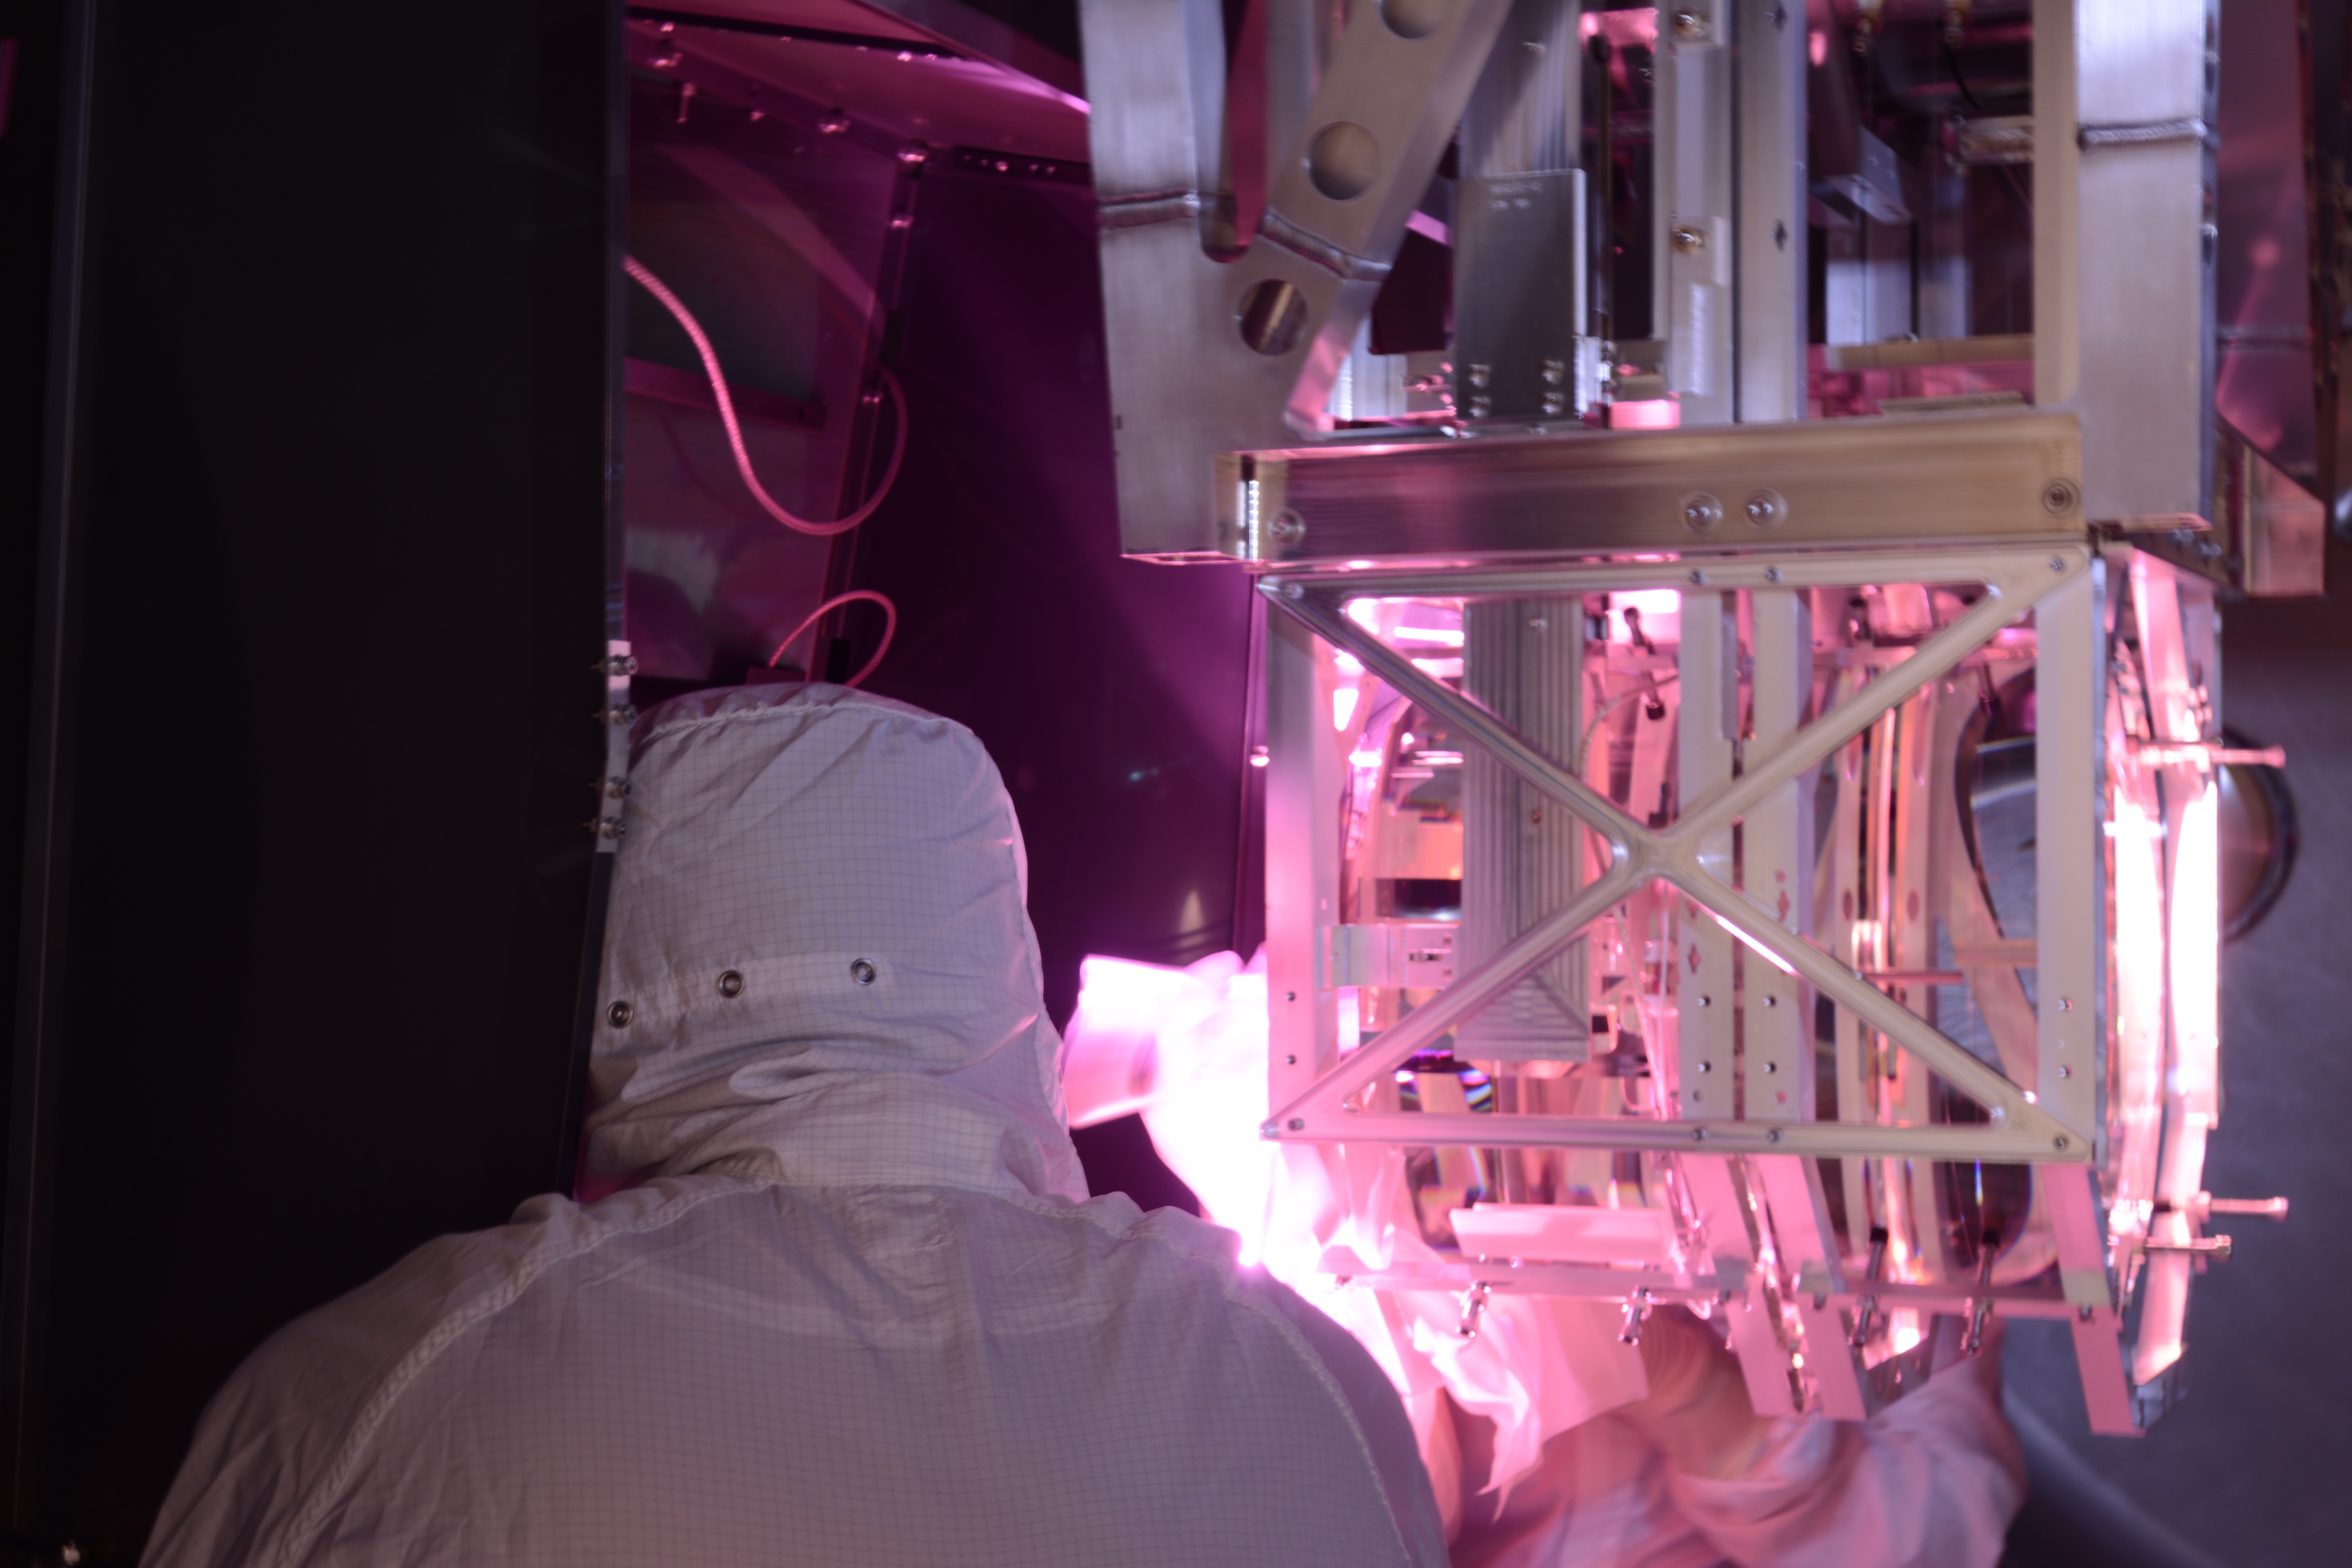
Installed the ACB locking brackets and dropped the ACB down such that it was partially swung back. (We did not use the wedge, but instead just let it hang in it's free and open state. This allowed pcal to still see the optic but also gave enough clearance to attach the green lantern and also to paint FC.)
Installed the Green Lantern on the ETMy structure and reinspected the optic. Again the large FC remnants lit up well. However, the ring feature did not show up under this lighting condition. (The flashlights were better for this. The ring feature looked more like a staining or clouding that started at the 3" ring boundary and spread ~uniformly outward towards the edge of the optic. There did not appear to be large macroscopic contaminants or FC remnants at this 3" ring boundary.
Rick took a few pcal photos (see attached) of the remnants and the ring using the green lantern and the green flashlight.
We secured the ETM TM with TFE rails on the EQ stops around the barrel of the optic.
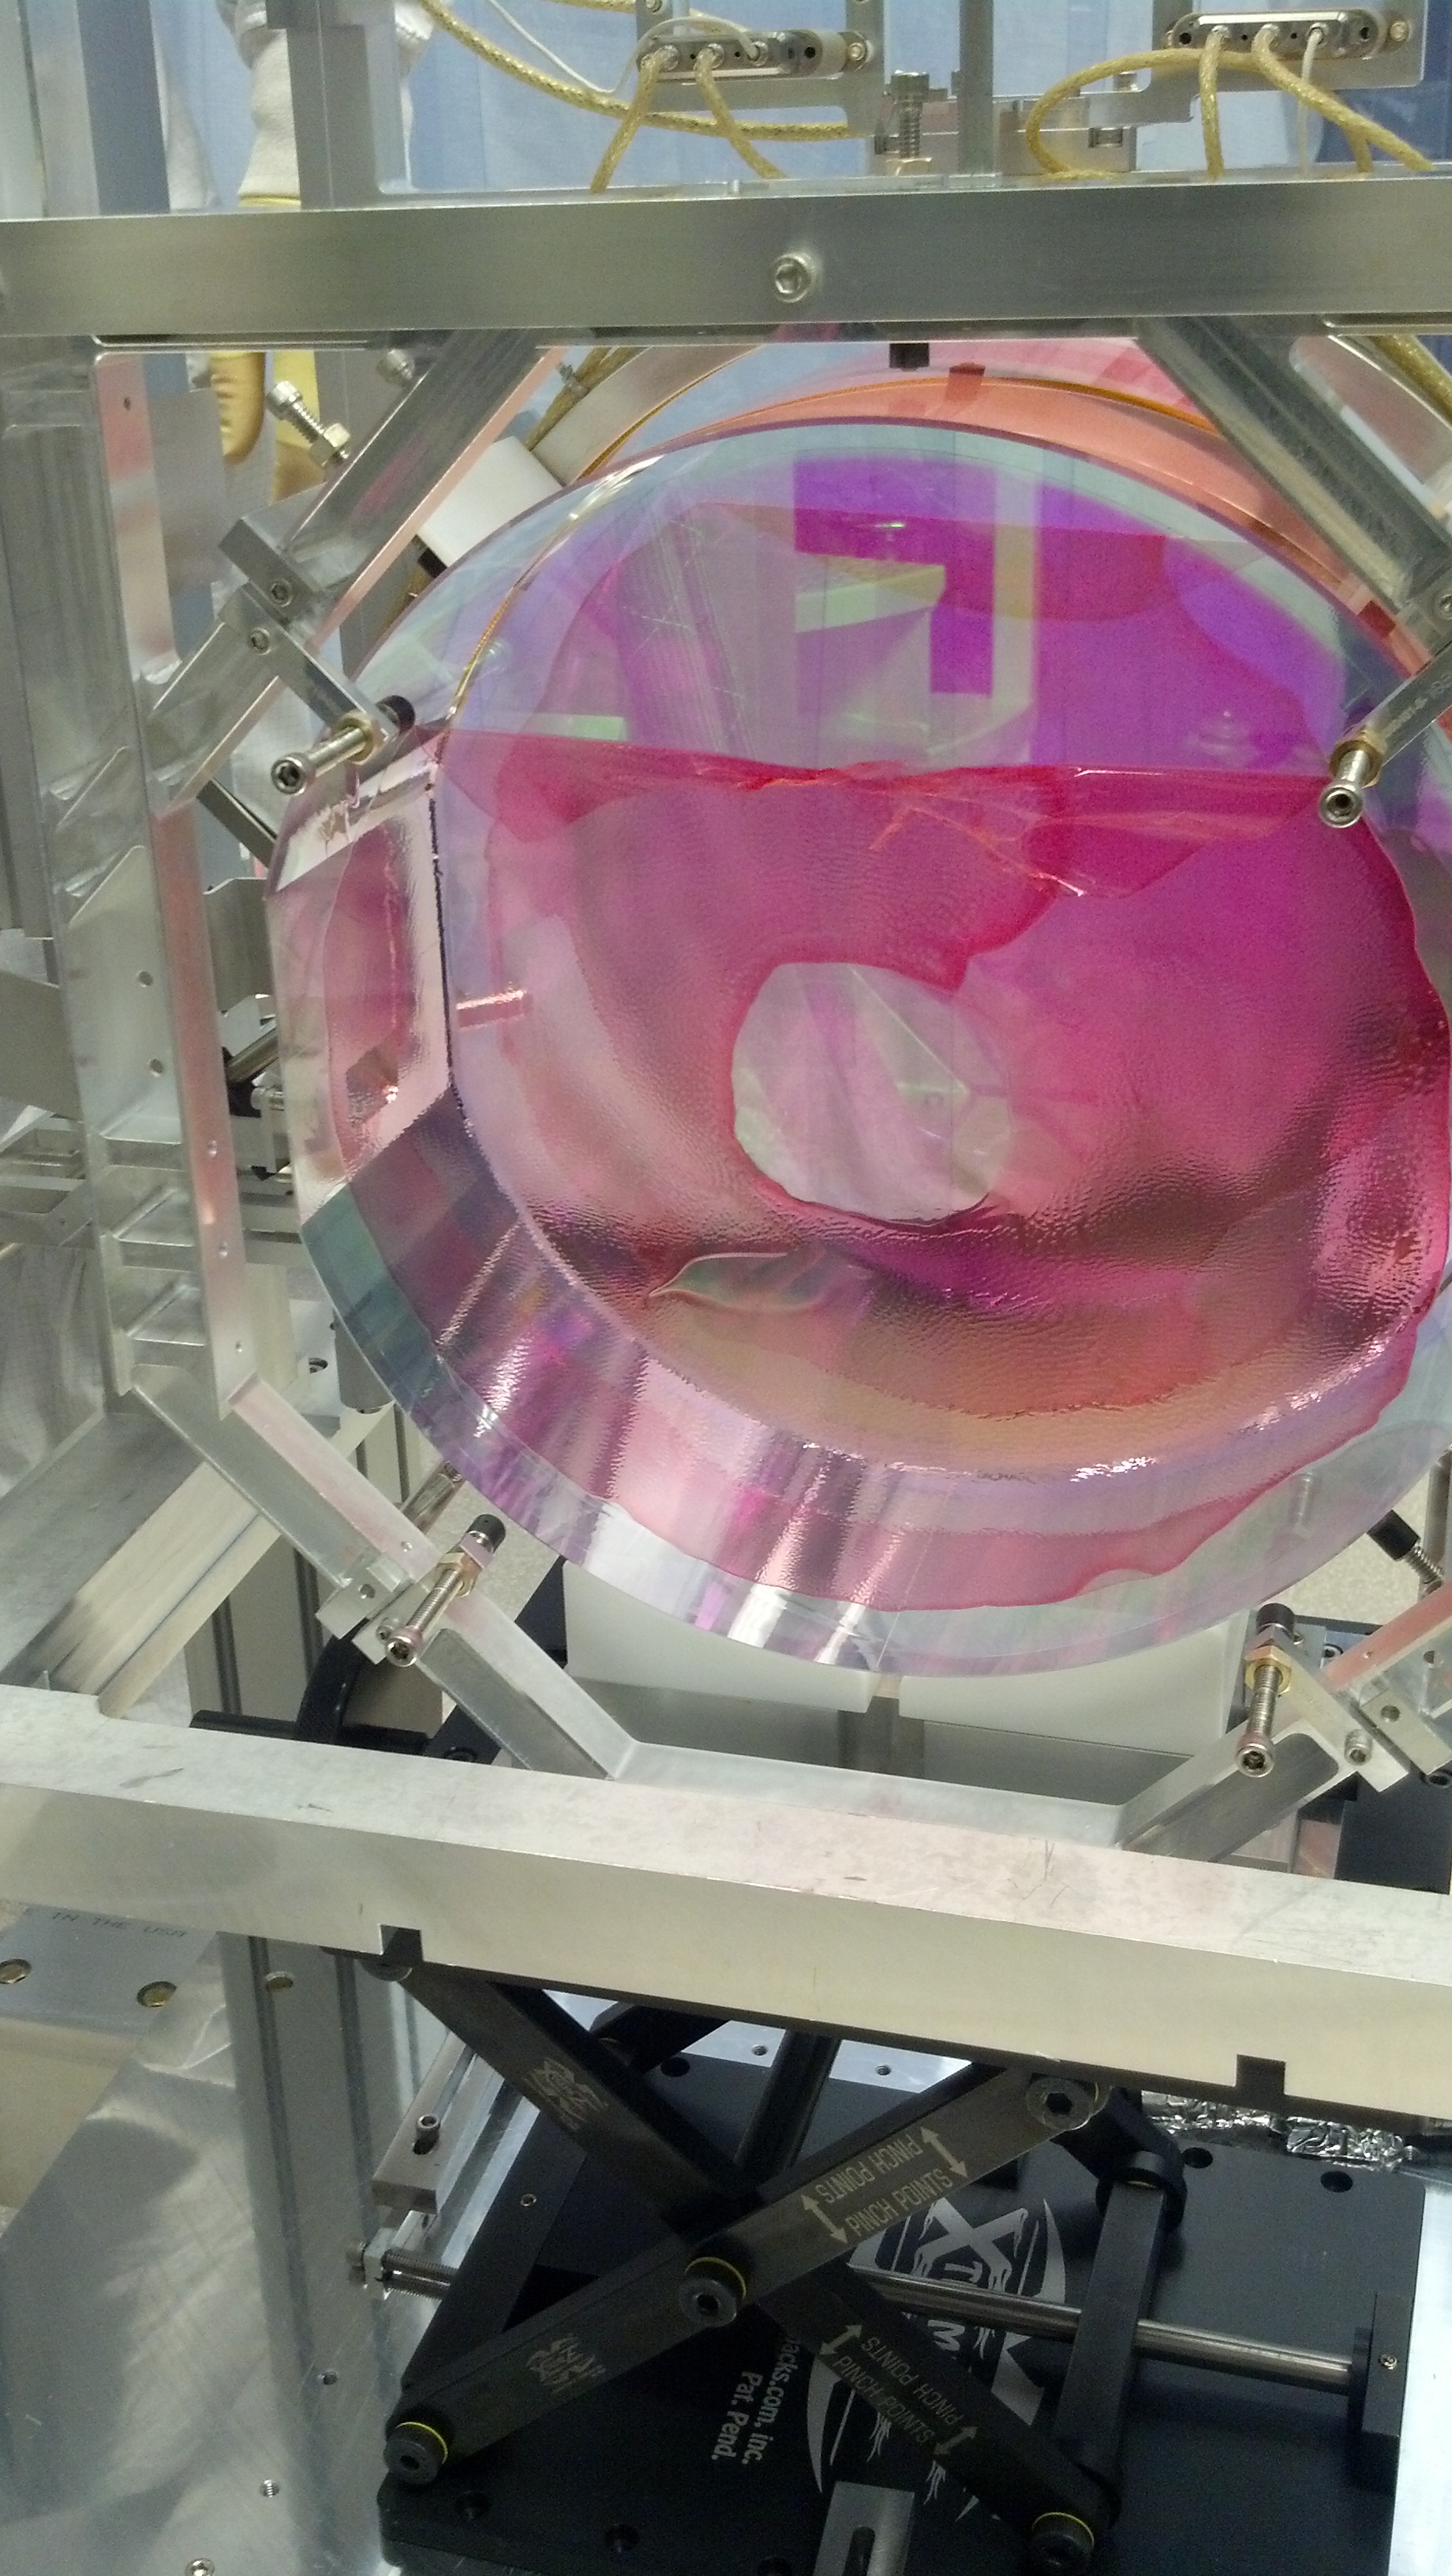
We proceeded to paint FC onto the HR surface, making a nice thick coating after a few layers were applied - this took ~45 mins. Note, we only observed "spider webs" on the FC sheet/brush toward the end of the 45 min and they were more noticeable around the TFE rail that was nearest the HR face which was likely charged and attracting or even causing(?) the webs.
Set the PETG cap on the face of the optic.
Tomorrow we plan to come in mid morning and then catch up with Richard/Fil to make the ESD connector swap midday. After that, we can pull the FC and hopefully see that we have removed the remnants and improved the ring feature.