Displaying reports 7281-7300 of 89028.Go to page Start 361 362 363 364 365 366 367 368 369 End
Reports until 11:24, Tuesday 29 April 2025
LHO VE
jordan.vanosky@LIGO.ORG - posted 11:24, Tuesday 29 April 2025 (84170)
Morning Purge Air Checks 4-29-25

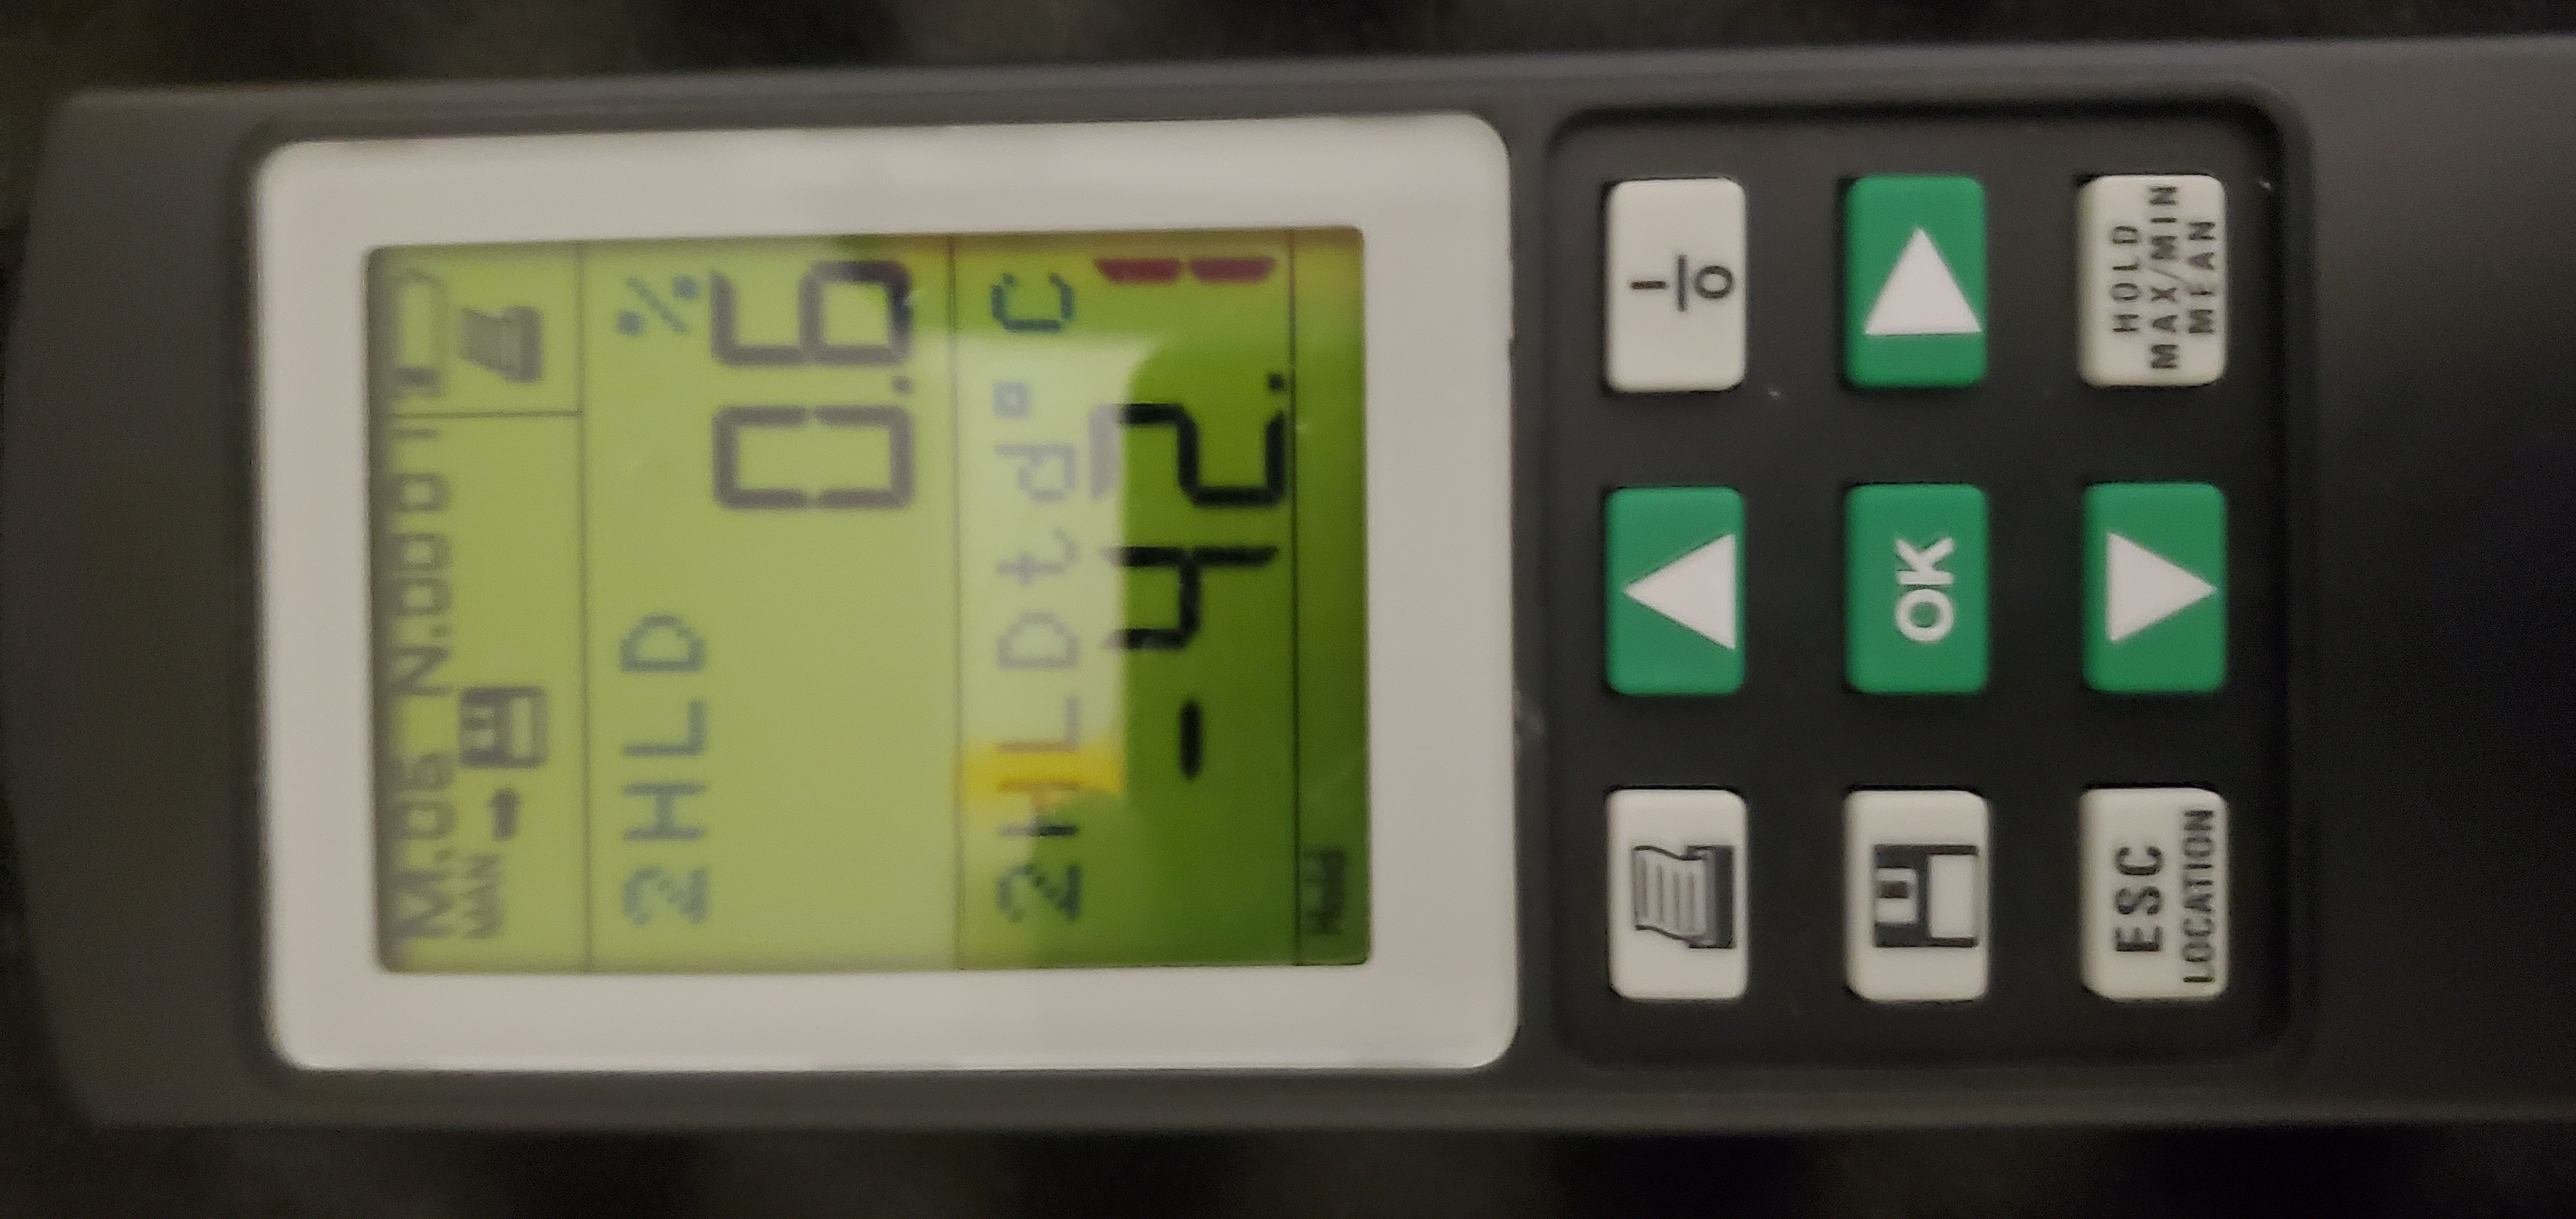
Morning dry air skid checks, water pump, kobelco, drying towers all nominal.

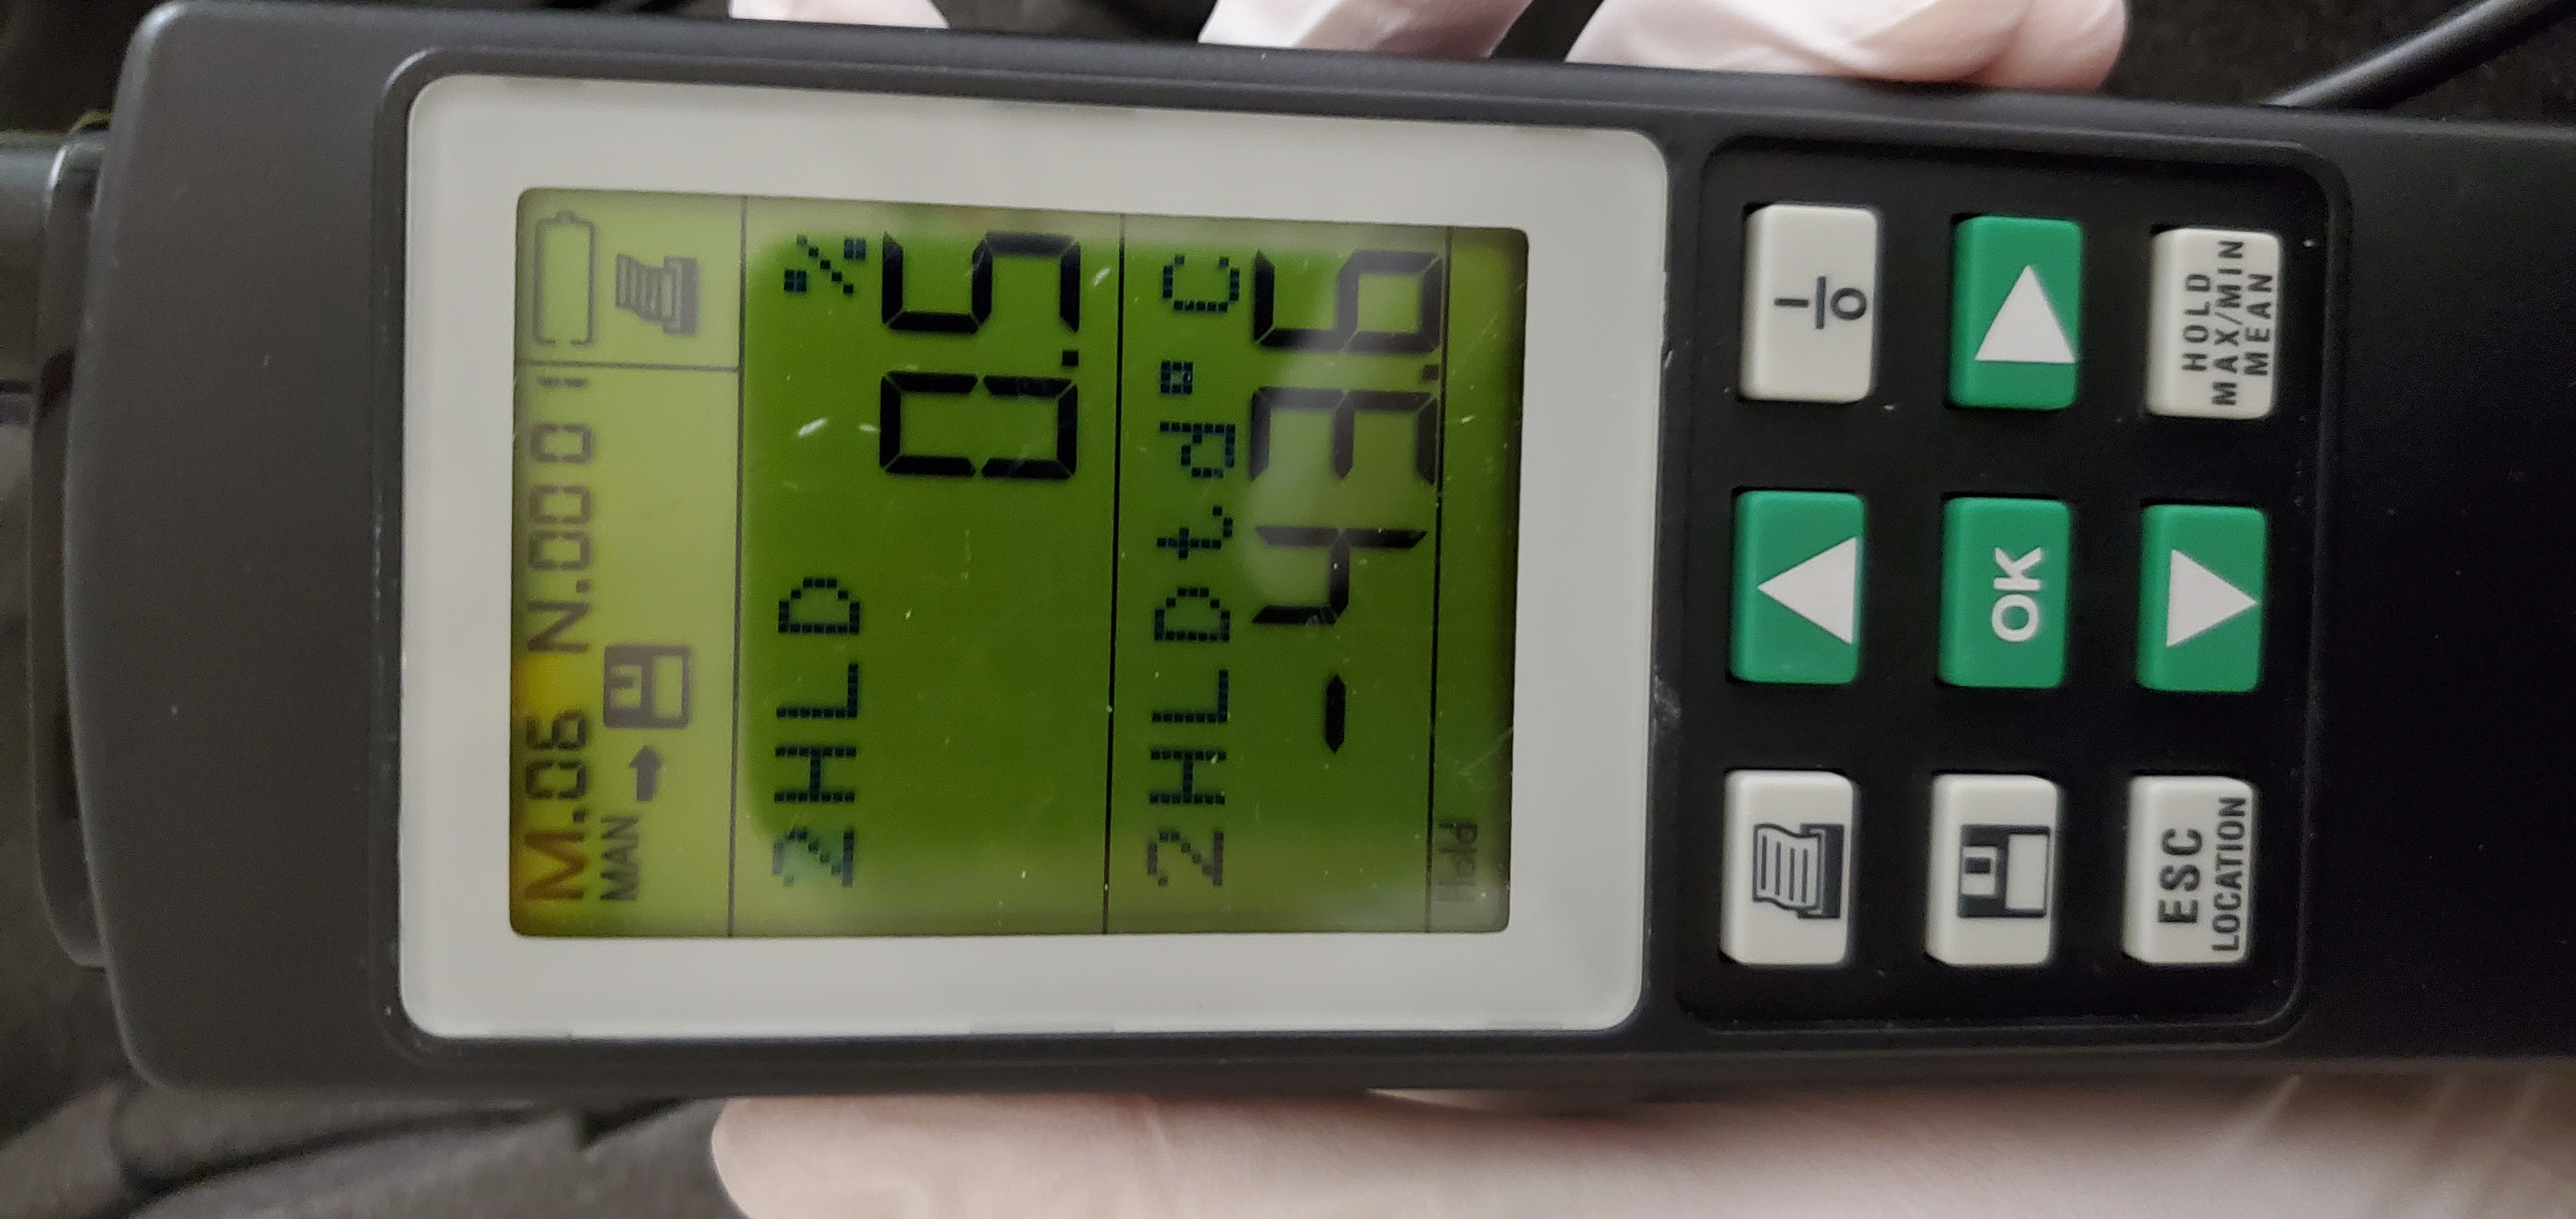
Dew point measurement at HAM1 , approx. -43C

Images attached to this report
LHO VE
david.barker@LIGO.ORG - posted 10:10, Tuesday 29 April 2025 (84169)
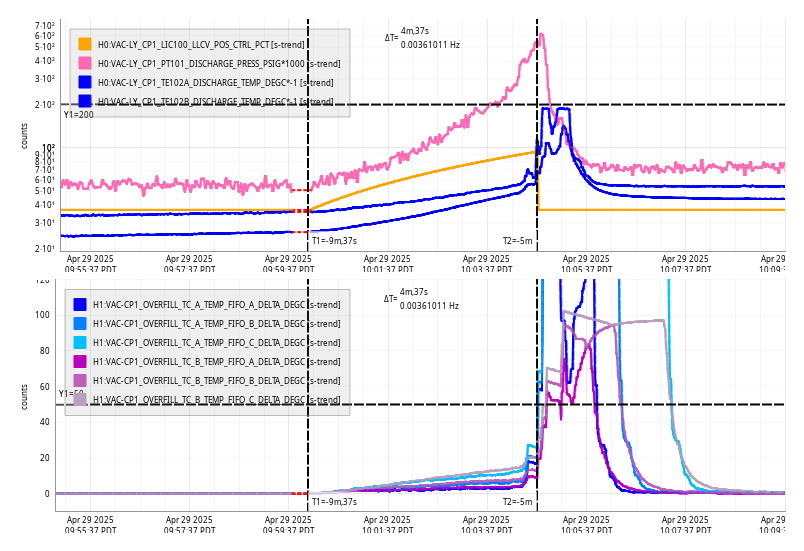
Tue CP1 Fill

Tue Apr 29 10:04:37 2025 INFO: Fill completed in 4min 34secs


Images attached to this report
H1 SEI (SEI)
ryan.crouch@LIGO.ORG - posted 08:11, Tuesday 29 April 2025 (84163)
SEI ground seismometer mass position check - Monthly (#26501)

Closes FAMIS26501

2025-04-29 08:05:53.258718


There are 13 T240 proof masses out of range ( > 0.3 [V] )!
ETMX T240 2 DOF X/U = -1.18 [V]
ETMX T240 2 DOF Y/V = -1.115 [V]
ETMX T240 2 DOF Z/W = -0.803 [V]
ITMX T240 1 DOF X/U = -1.733 [V]
ITMX T240 2 DOF Z/W = 0.355 [V]
ITMX T240 3 DOF X/U = -2.292 [V]
ITMY T240 3 DOF X/U = -0.976 [V]
ITMY T240 3 DOF Z/W = -2.401 [V]
BS T240 2 DOF Y/V = -0.318 [V]
BS T240 3 DOF X/U = -0.604 [V]
BS T240 3 DOF Z/W = -0.365 [V]
HAM8 1 DOF Y/V = -0.478 [V]
HAM8 1 DOF Z/W = -0.764 [V]


All other proof masses are within range ( < 0.3 [V] ):
ETMX T240 1 DOF X/U = -0.1 [V]
ETMX T240 1 DOF Y/V = -0.082 [V]
ETMX T240 1 DOF Z/W = -0.092 [V]
ETMX T240 3 DOF X/U = -0.035 [V]
ETMX T240 3 DOF Y/V = -0.154 [V]
ETMX T240 3 DOF Z/W = -0.063 [V]
ETMY T240 1 DOF X/U = 0.011 [V]
ETMY T240 1 DOF Y/V = 0.083 [V]
ETMY T240 1 DOF Z/W = 0.149 [V]
ETMY T240 2 DOF X/U = -0.134 [V]
ETMY T240 2 DOF Y/V = 0.152 [V]
ETMY T240 2 DOF Z/W = 0.046 [V]
ETMY T240 3 DOF X/U = 0.158 [V]
ETMY T240 3 DOF Y/V = 0.031 [V]
ETMY T240 3 DOF Z/W = 0.058 [V]
ITMX T240 1 DOF Y/V = 0.22 [V]
ITMX T240 1 DOF Z/W = 0.14 [V]
ITMX T240 2 DOF X/U = 0.155 [V]
ITMX T240 2 DOF Y/V = -0.054 [V]
ITMX T240 3 DOF Y/V = 0.253 [V]
ITMX T240 3 DOF Z/W = 0.139 [V]
ITMY T240 1 DOF X/U = -0.059 [V]
ITMY T240 1 DOF Y/V = 0.018 [V]
ITMY T240 1 DOF Z/W = -0.067 [V]
ITMY T240 2 DOF X/U = 0.008 [V]
ITMY T240 2 DOF Y/V = 0.211 [V]
ITMY T240 2 DOF Z/W = -0.046 [V]
ITMY T240 3 DOF Y/V = -0.056 [V]
BS T240 1 DOF X/U = 0.176 [V]
BS T240 1 DOF Y/V = -0.272 [V]
BS T240 1 DOF Z/W = -0.278 [V]
BS T240 2 DOF X/U = 0.094 [V]
BS T240 2 DOF Z/W = 0.221 [V]
BS T240 3 DOF Y/V = -0.039 [V]
HAM8 1 DOF X/U = -0.297 [V]

H1 CDS
david.barker@LIGO.ORG - posted 08:09, Tuesday 29 April 2025 - last comment - 08:11, Tuesday 29 April 2025(84164)
DTS ENV EPICS IOC froze when x1dtslogin was rebooted

FRS33974

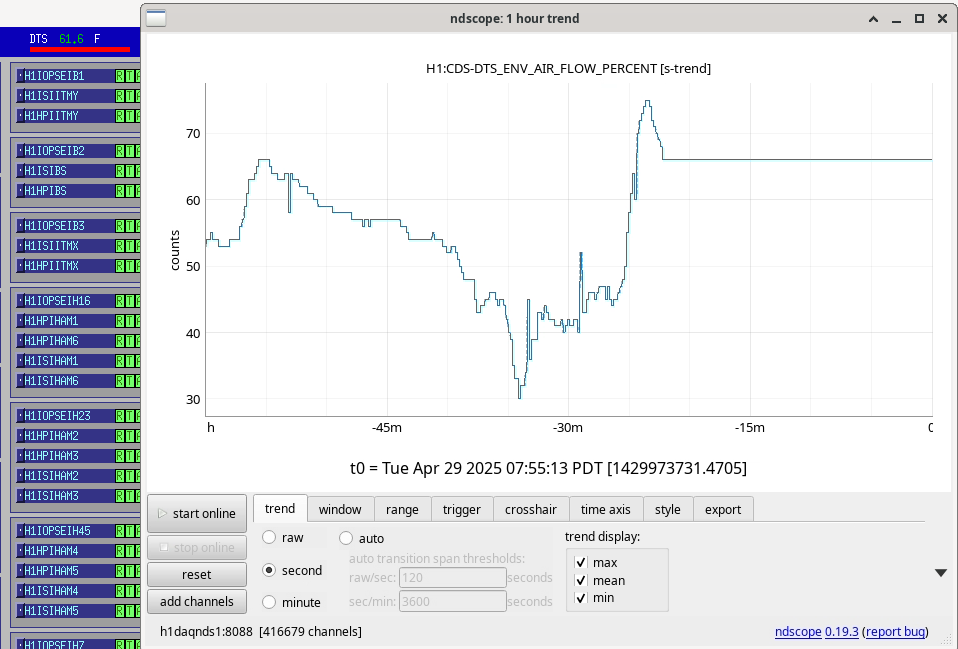
Following this morning's reboot of x1dtslogin, the EPICS IOC reporting the H2 building DTS environment channels froze with its last values instead of crashing. After 10 minutes this was reported on the main DTS MEDM with a red banner showing a stuck GPS time, but this was not reflected on the CDS Overview.

I have modified DTS.adl, which is used by the CDS overview, to show a red flag if the GPS time stops updating. Attachment shows the new flag and a trend of the DTS air flow channel showing the freeze which started at 07:33 Tue 29apr2025

Images attached to this report
Comments related to this report
david.barker@LIGO.ORG - 08:11, Tuesday 29 April 2025 (84165)

dts_tunnel.service and dts_env.service were restarted on cdsioc0 at 08:04 to clear this error.

H1 General
ryan.crouch@LIGO.ORG - posted 07:31, Tuesday 29 April 2025 (84161)
OPS Tuesday day shift start

TITLE: 04/29 Day Shift: 1430-2330 UTC (0730-1630 PST), all times posted in UTC
STATE of H1: Planned Engineering
OUTGOING OPERATOR: None
CURRENT ENVIRONMENT:
    SEI_ENV state: MAINTENANCE
    Wind: 5mph Gusts, 3mph 3min avg
    Primary useism: 0.50 μm/s
    Secondary useism: 0.13 μm/s
QUICK SUMMARY:

H1 CDS
erik.vonreis@LIGO.ORG - posted 06:37, Tuesday 29 April 2025 - last comment - 07:00, Tuesday 29 April 2025(84159)
Workstations updated

Workstations were updated and rebooted. This was an os packages update.  Conda packages were not updated.

Comments related to this report
david.barker@LIGO.ORG - 07:00, Tuesday 29 April 2025 (84160)

I have restarted the temporary EPICS IOCs running inside tmux sessions on opslogin0 to "green up" the EDC:

vacstat_dummy_ioc.py (channels removed from vacstat during the vent)

digivideo_dummy_ioc.py (those cameras which had to be reverted to the old software, but edc has new chan list)

H1 AOS
filiberto.clara@LIGO.ORG - posted 17:18, Monday 28 April 2025 (84158)
Beckhoff hardware for HEPI upgrade powered on
WP 12467
 
The following hardware was powered on:
  1. Beckhoff computer and terminals in Mechanical Room
  2. Beckhoff terminals in LVEA (BSC2)
  3. Connected to switch: sw-mech-aux port 5
This will allow the software side to be configured. The hardware is NOT connected to the HEPI controls.
 
F. Clara, J. Hanks, P. Thomas
LHO General
ibrahim.abouelfettouh@LIGO.ORG - posted 16:32, Monday 28 April 2025 (84156)
OPS Day Shift Summary

TITLE: 04/28 Day Shift: 1430-2330 UTC (0730-1630 PST), all times posted in UTC
STATE of H1: Planned Engineering
INCOMING OPERATOR: None
SHIFT SUMMARY:

IFO is in PLANNED ENGINEERING for VENT

Short summary of  work done:

LOG:

Start Time System Name Location Lazer_Haz Task Time End
14:44 FAC Kim LVEA N Tech clean 15:48
14:44 FAC Nellie FAC N Tech clean 15:48
14:44 FAC Tyler YARM N Boom Lift to EY 15:20
15:51 FAC Randy, Tyler, Betsy, TJ, Mitchell LVEA N Moving Optics Table 16:47
16:07 SUS Camilla LVEA N Moving Optics Tables 18:39
16:24 ISC Oli LVEA N HAM1 ISC install 17:50
16:42 PCAL Tony PCAL Lab N PCAL Meas. 18:39
16:48 FAC TJ LVEA N Moving Optics Table 17:53
16:48 SUS Rahul LVEA N HAM1 RMs 18:01
16:56 VAC Jordan LVEA N Purge Air Checks 16:56
17:01 FAC Nellie Water Pump N Tech cleaning 17:25
17:01 EE Marc LVEA N Ground loop help 17:45
17:05 AOS Elenna LVEA N Wipe drop 17:05
17:26 FAC Nellie LVEA N Tech clean 18:48
17:26 FAC Kim LVEA N Tech clean 18:48
17:44 VAC Jordan, Gerardo MX, MY N Dewar jack pump work 20:33
17:45 EE Fil, Marc LVEA N HAM1 Table Cable 19:26
18:52 PCAL Tony PCAL Lab y(local) TSA measurement 19:52
20:22 PCAL Tony PCAL Lab N Computer power off 21:34
20:33 PSL Jason LVEA N Locking rotation stage 20:42
20:35 ISC Camilla, Oli LVEA N HAM1 ISC Cabling 22:48
20:36 VAC Jordan, Gerardo LVEA N RGA Stand 22:18
21:34 TCS TJ, Matt LVEA N TCS Table Looksy 22:12
22:25 SUS Rahul LVEA N HAM1 Work 23:07
22:52 CDS Fil MR N Beckhoff computer power 01:52
23:03 VAC Jordan MY N Turning off dewar pump 23:23
23:22 EE Marc MY N Part search 02:22
H1 ISC
camilla.compton@LIGO.ORG - posted 16:26, Monday 28 April 2025 - last comment - 12:51, Tuesday 29 April 2025(84155)
SLED installed in HAM1 and most Diodes Cabled

Oli, Camilla.

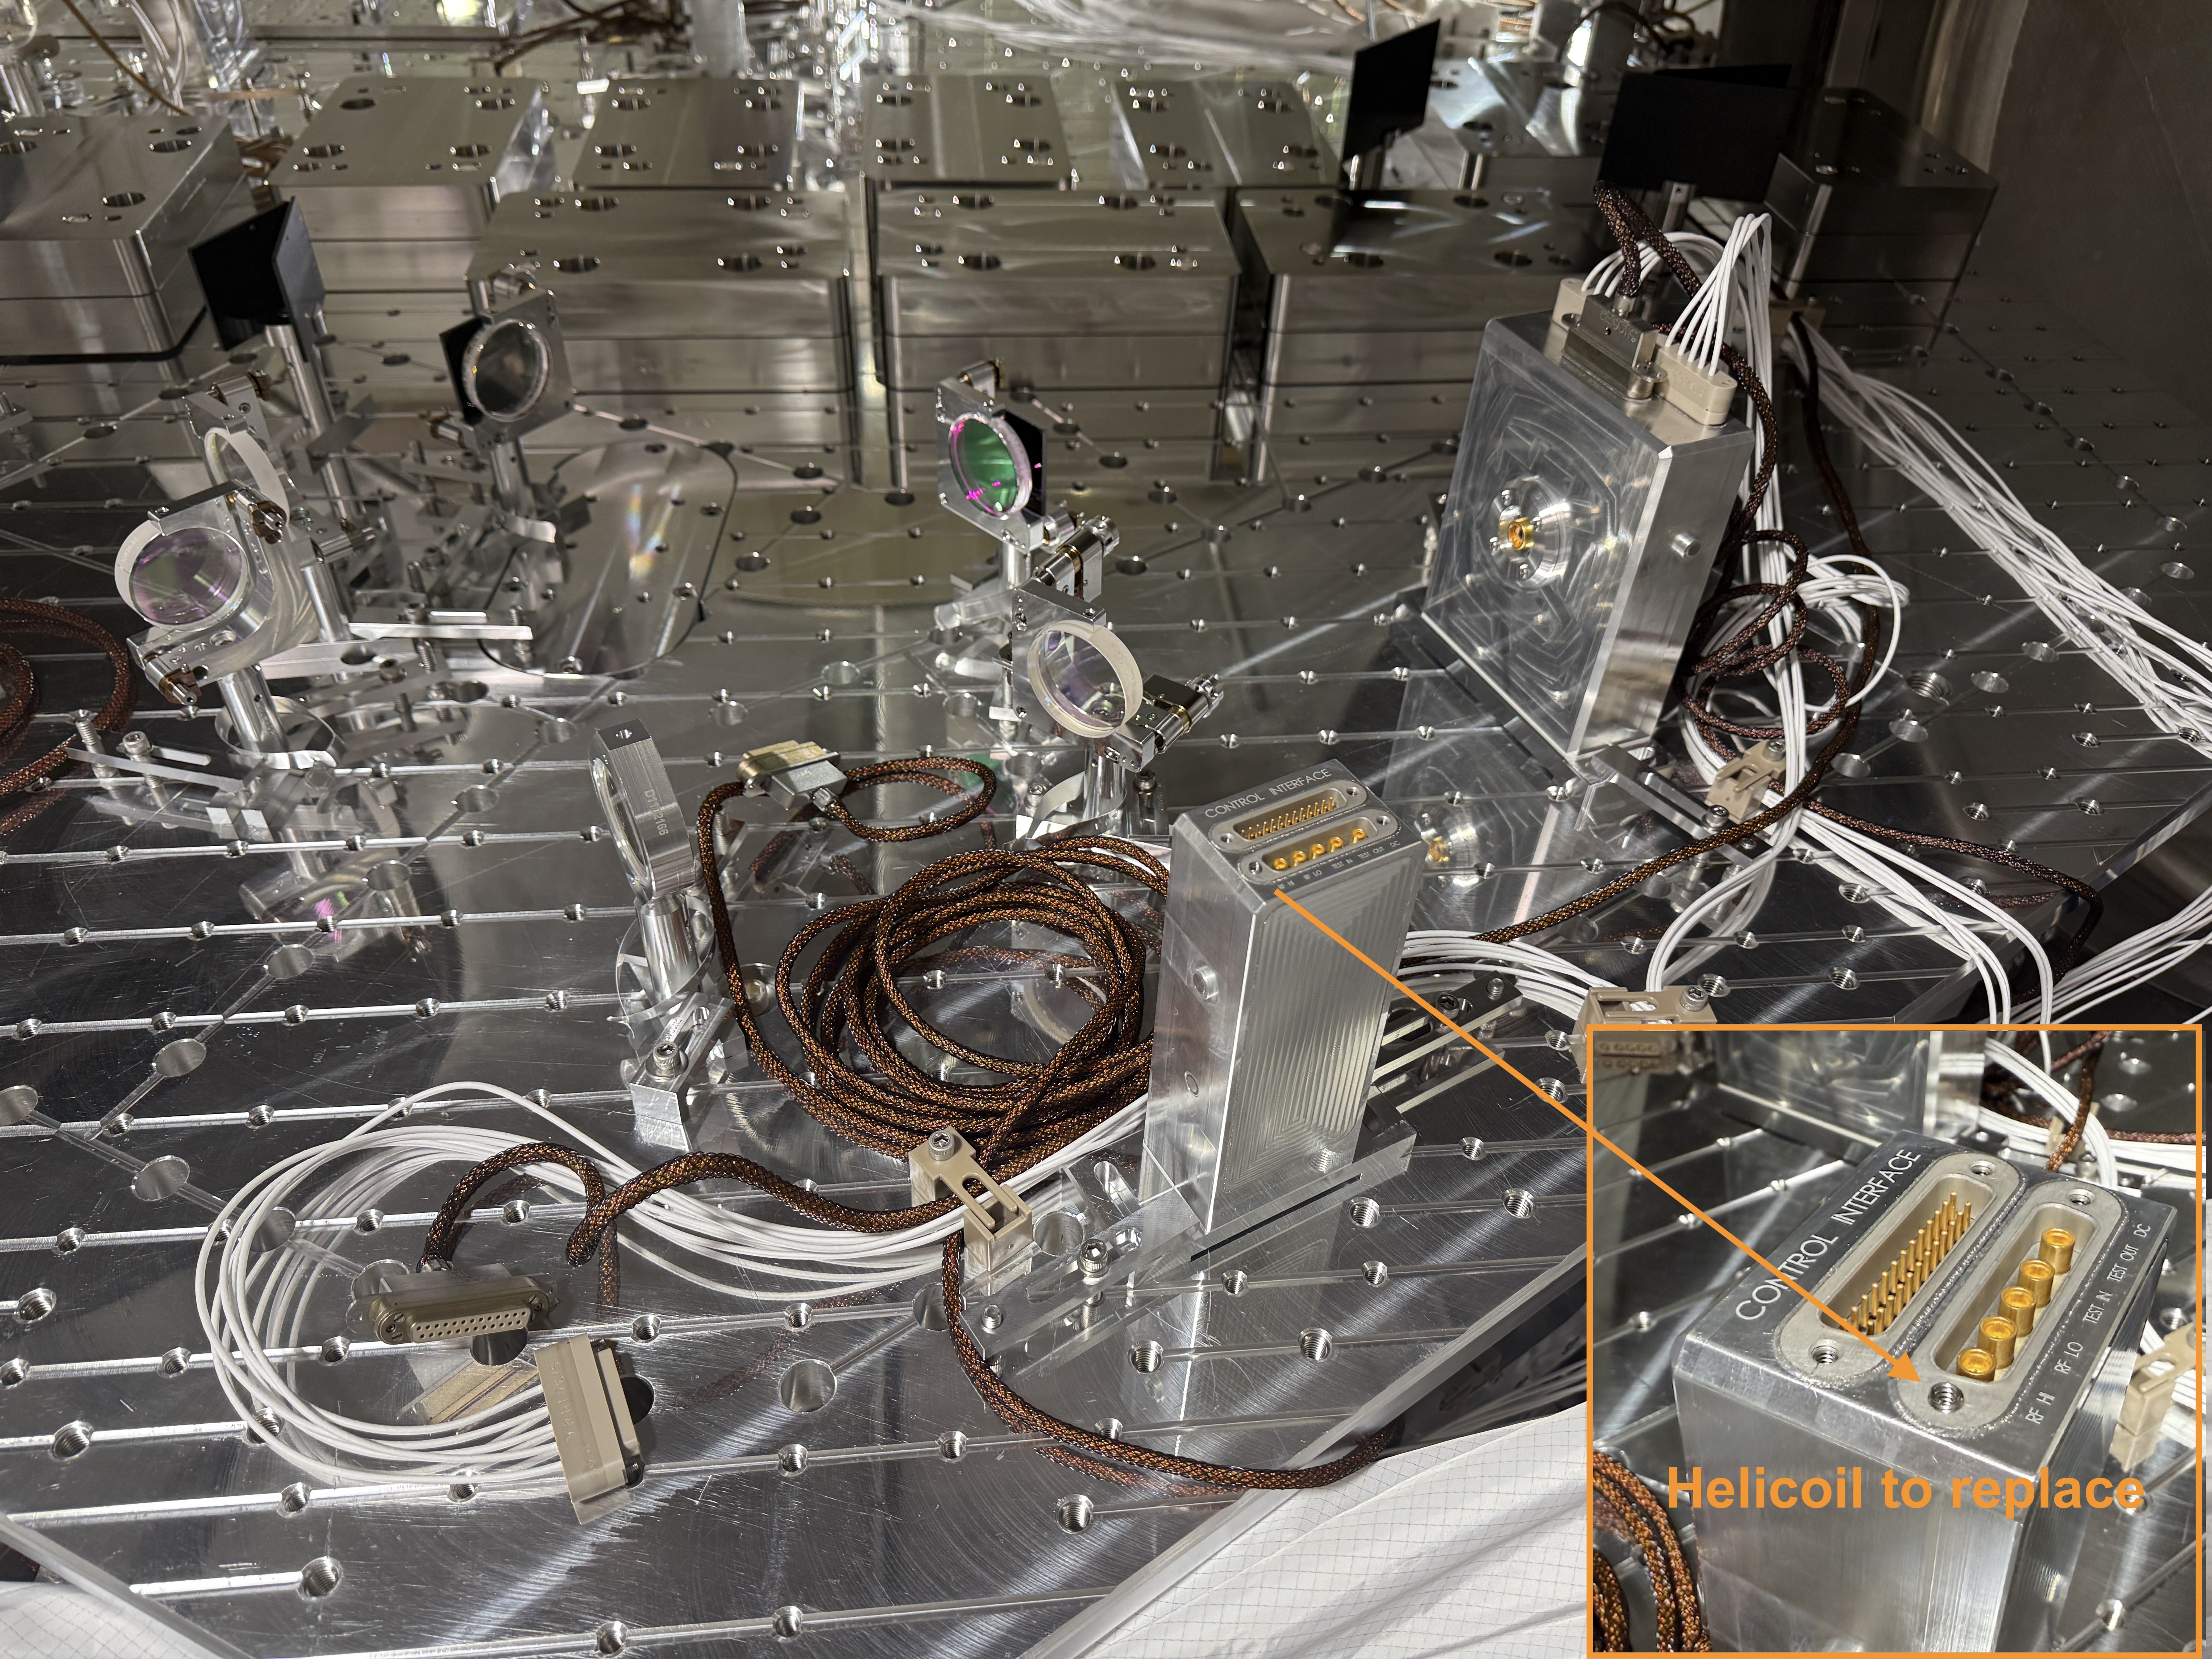
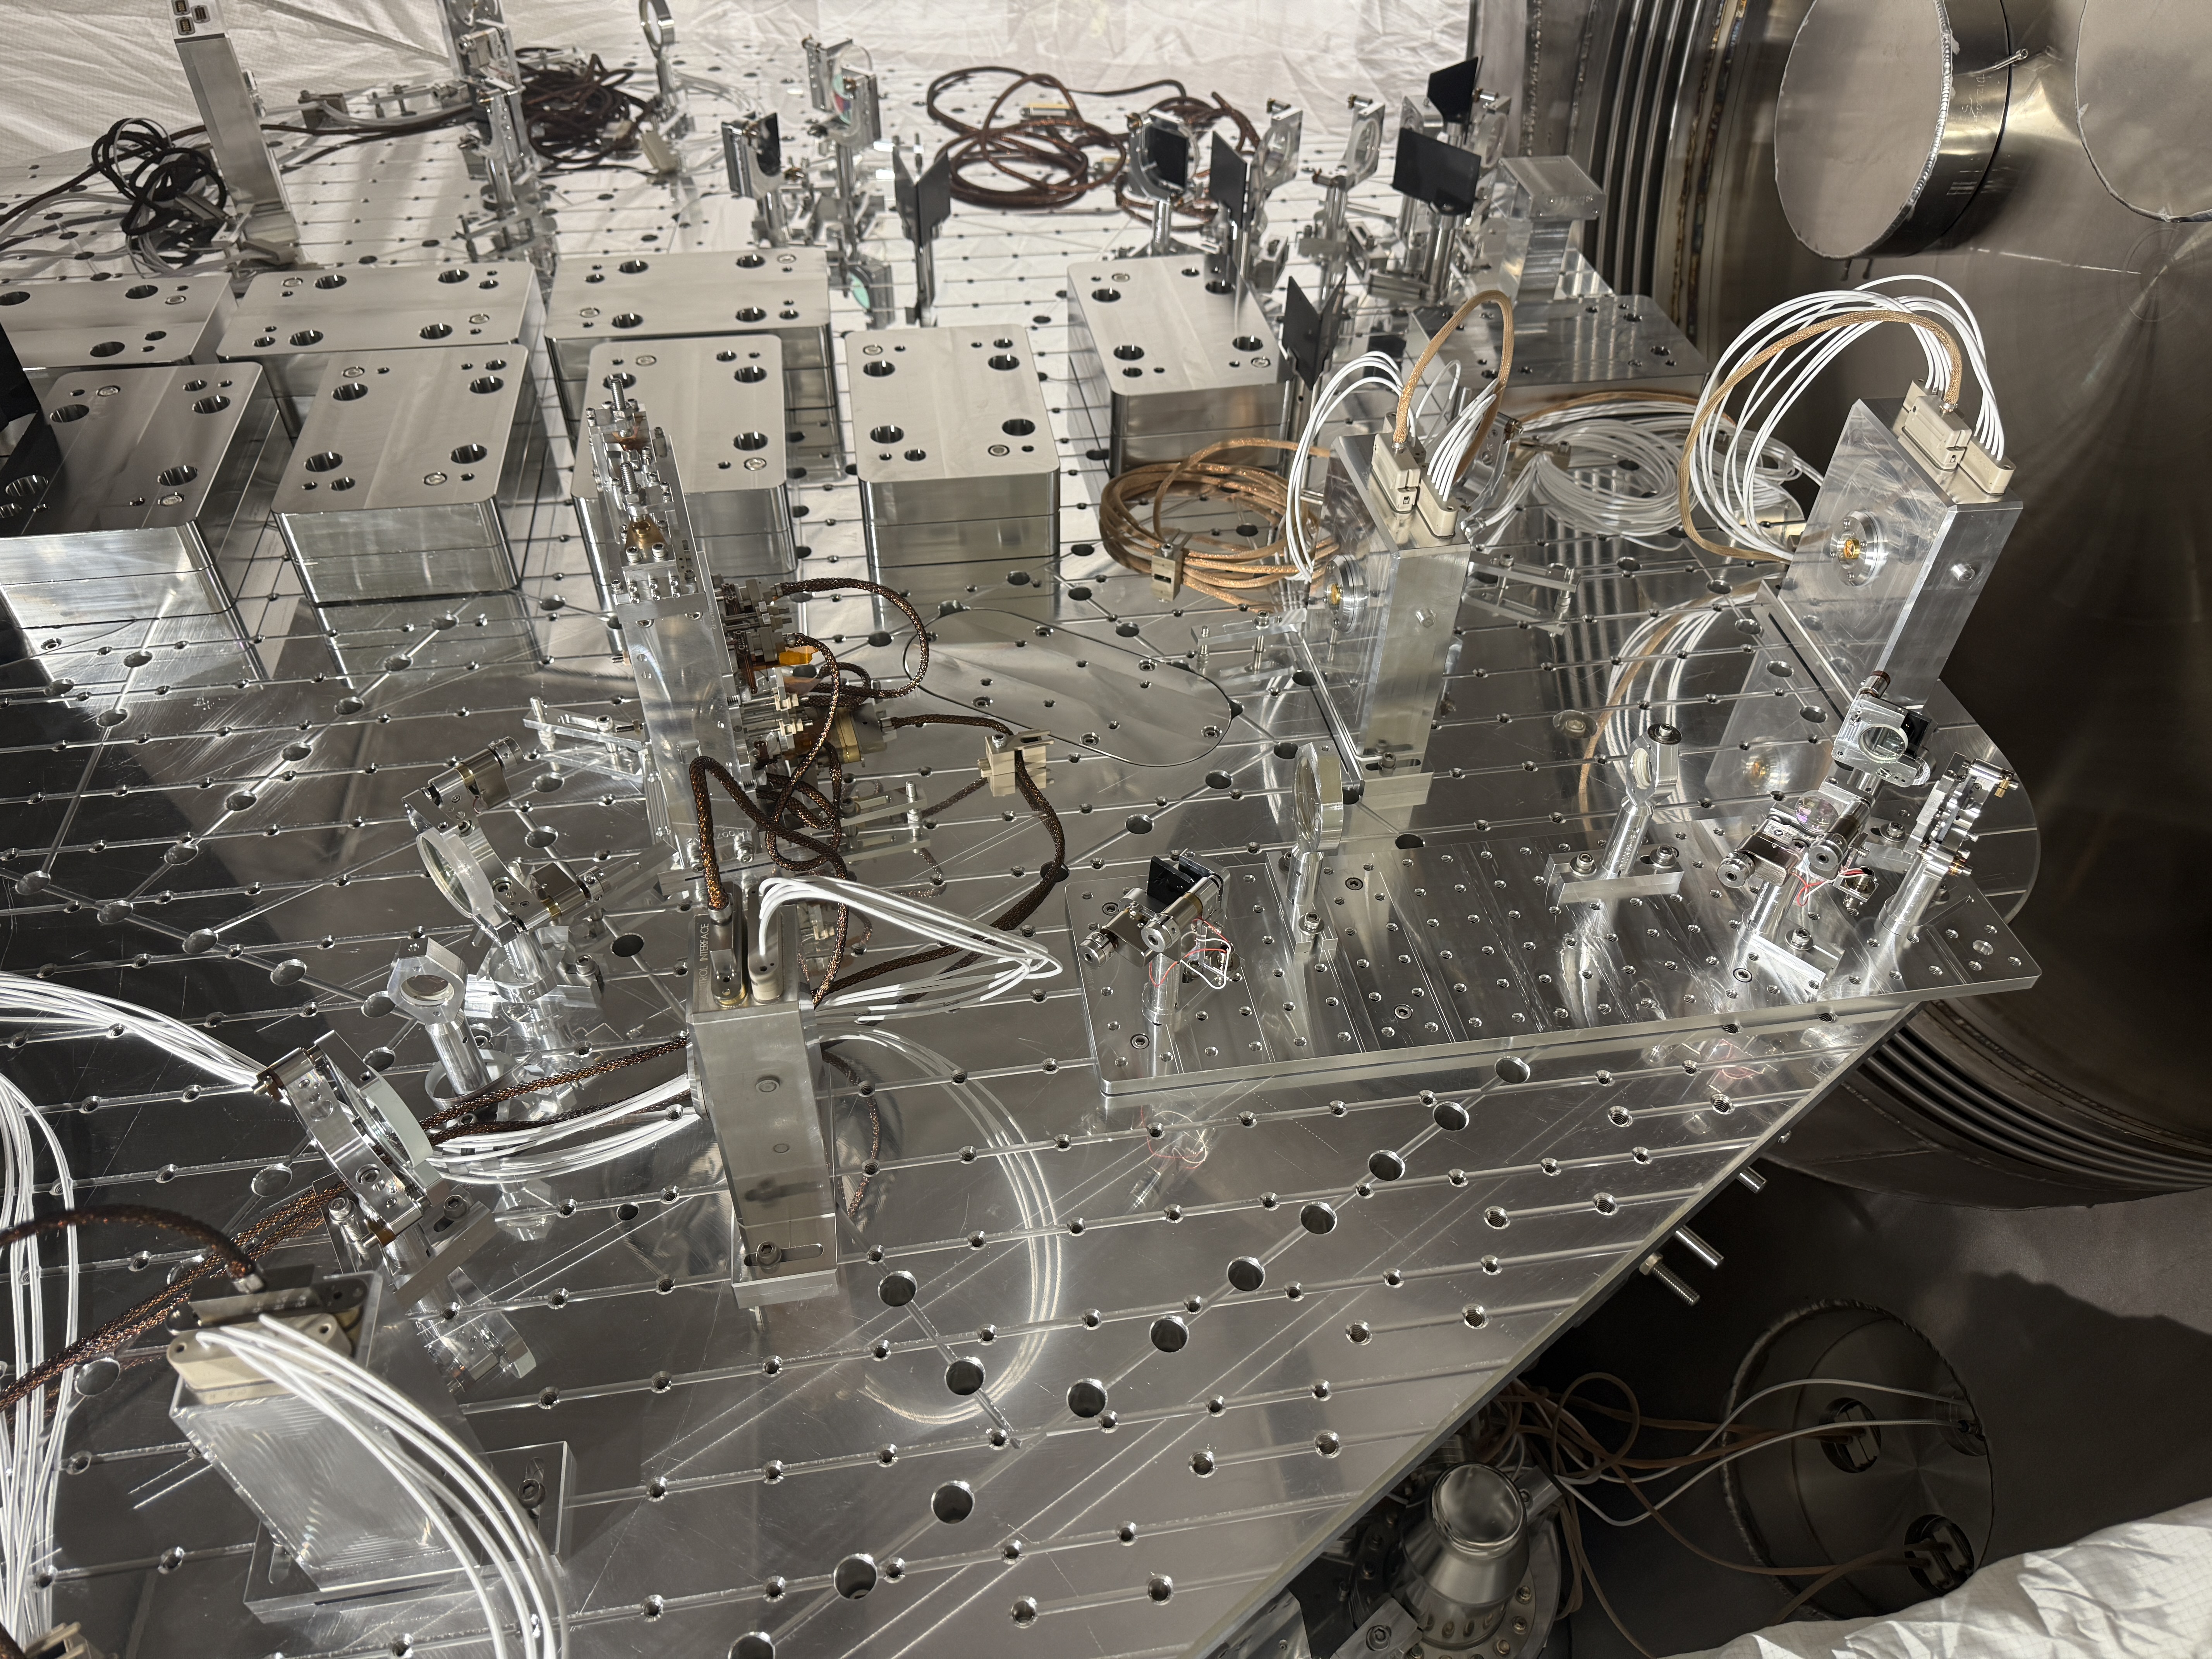
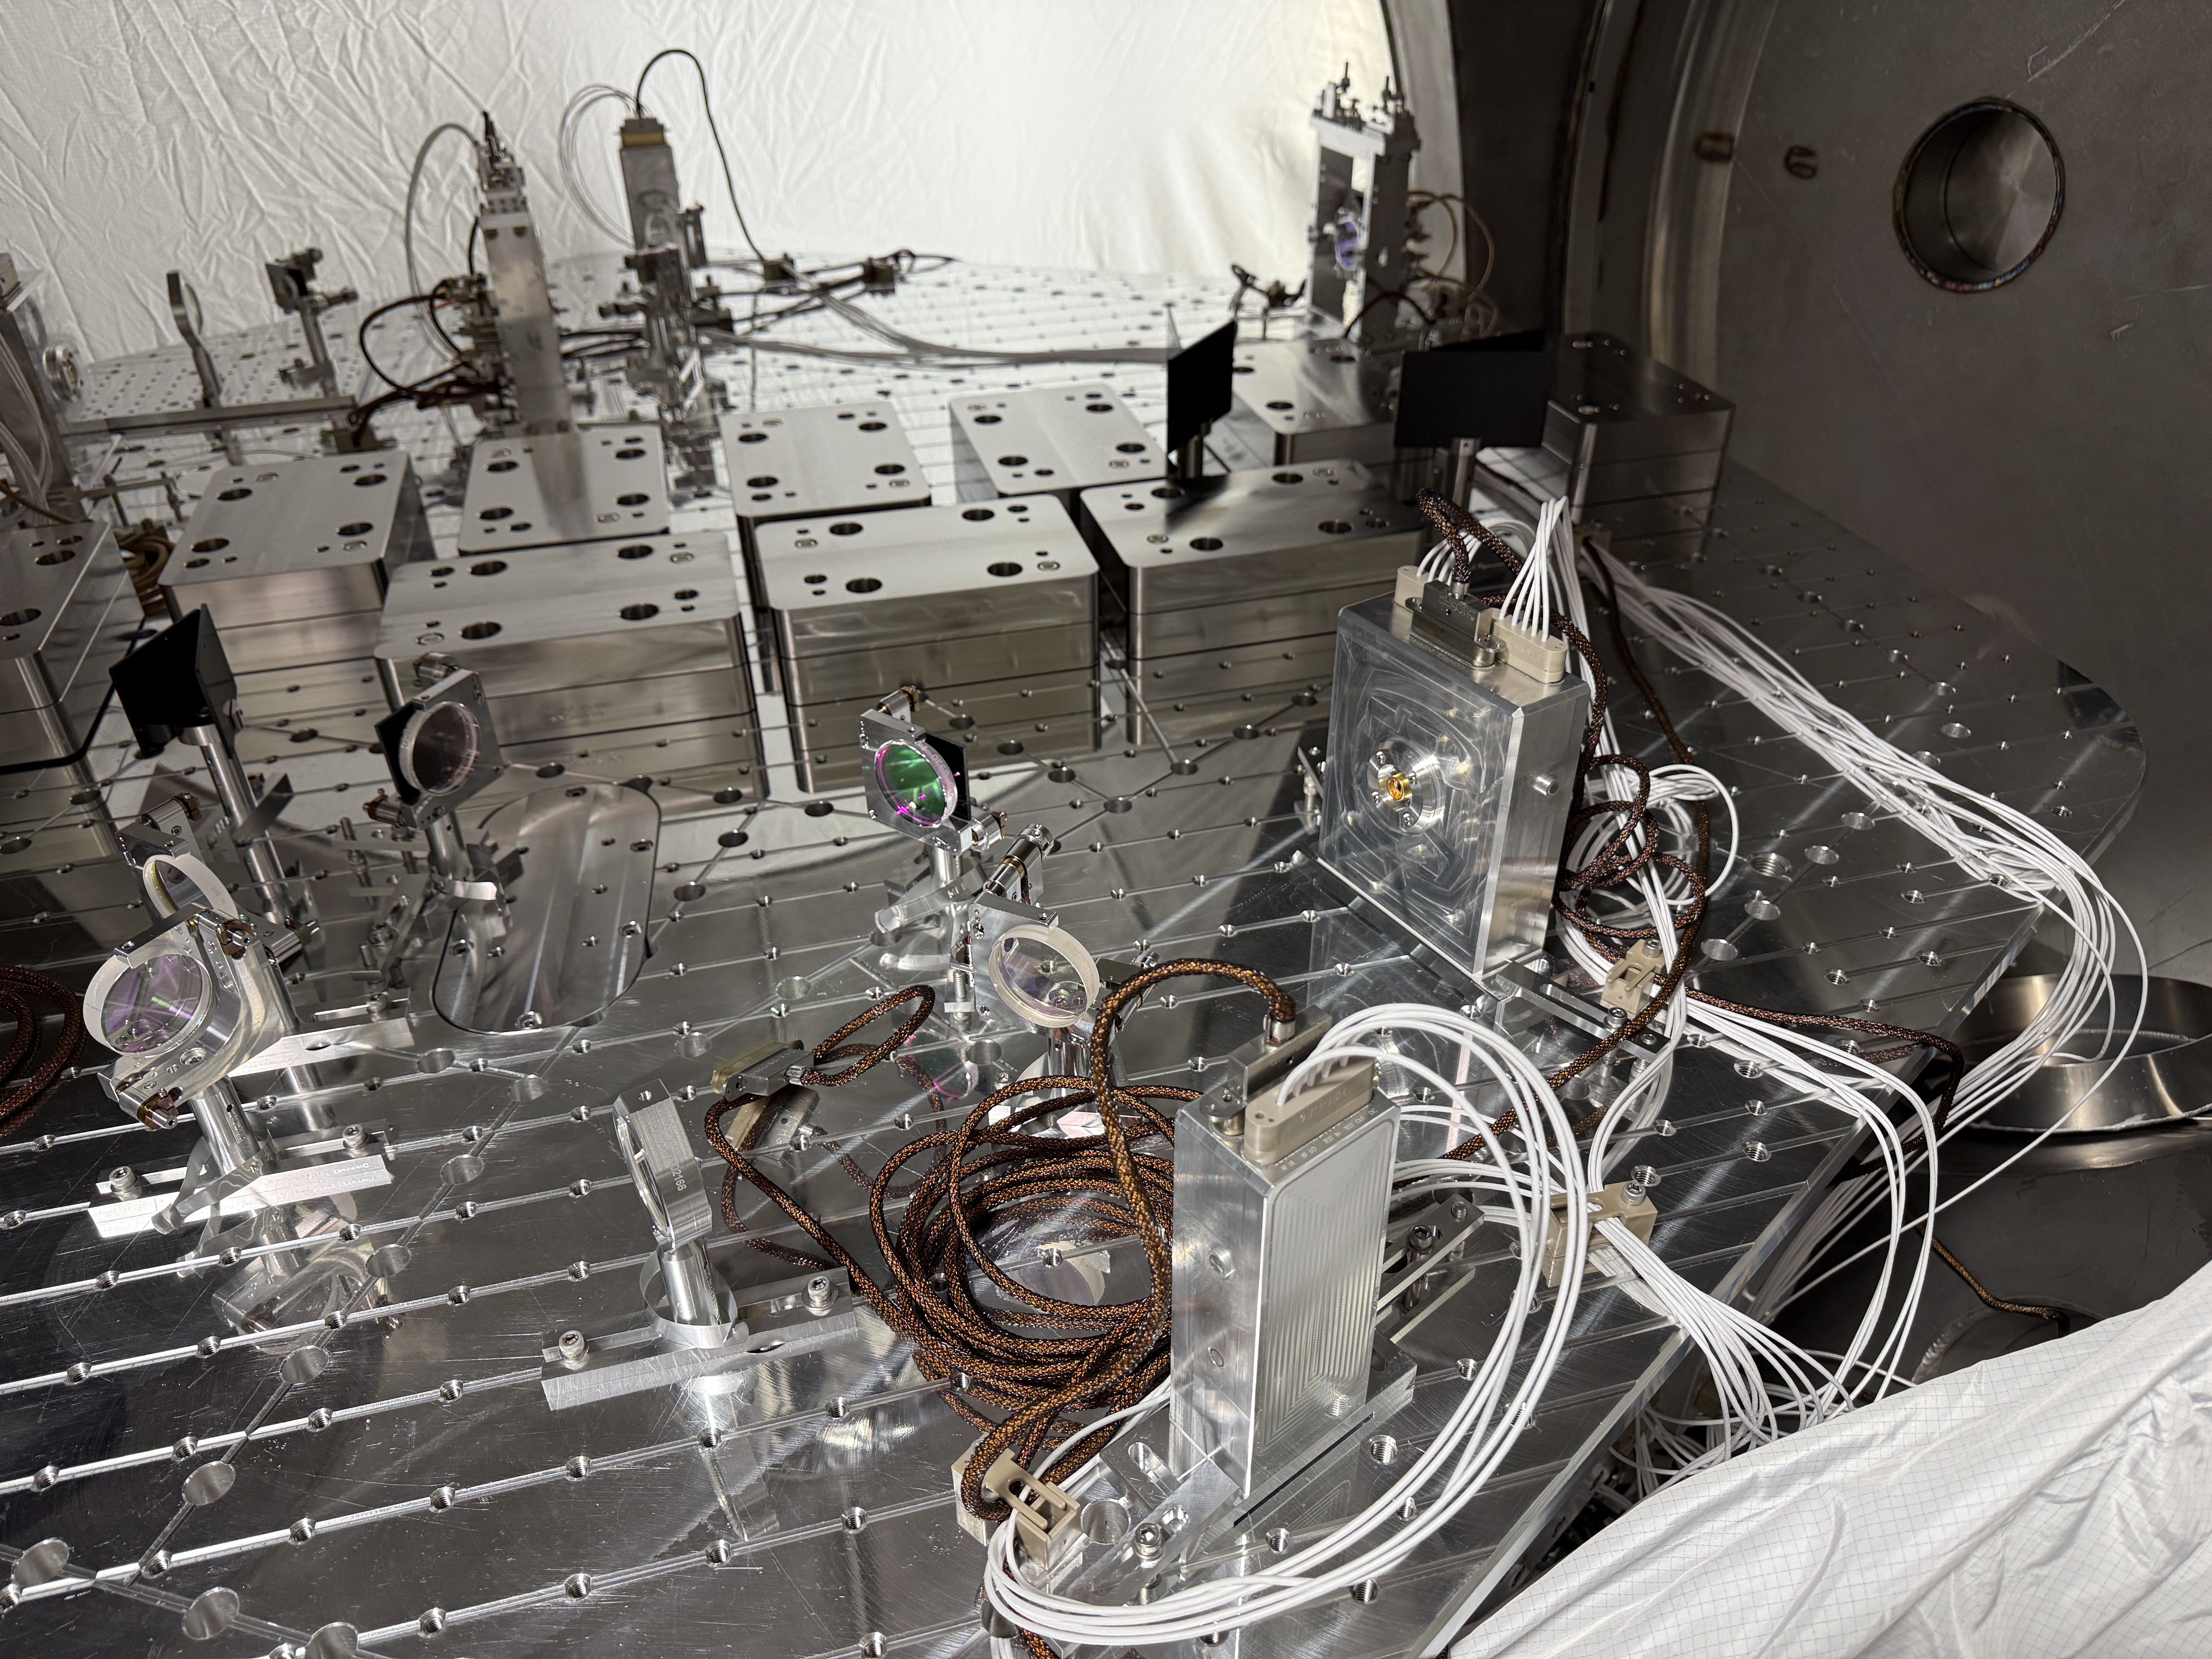
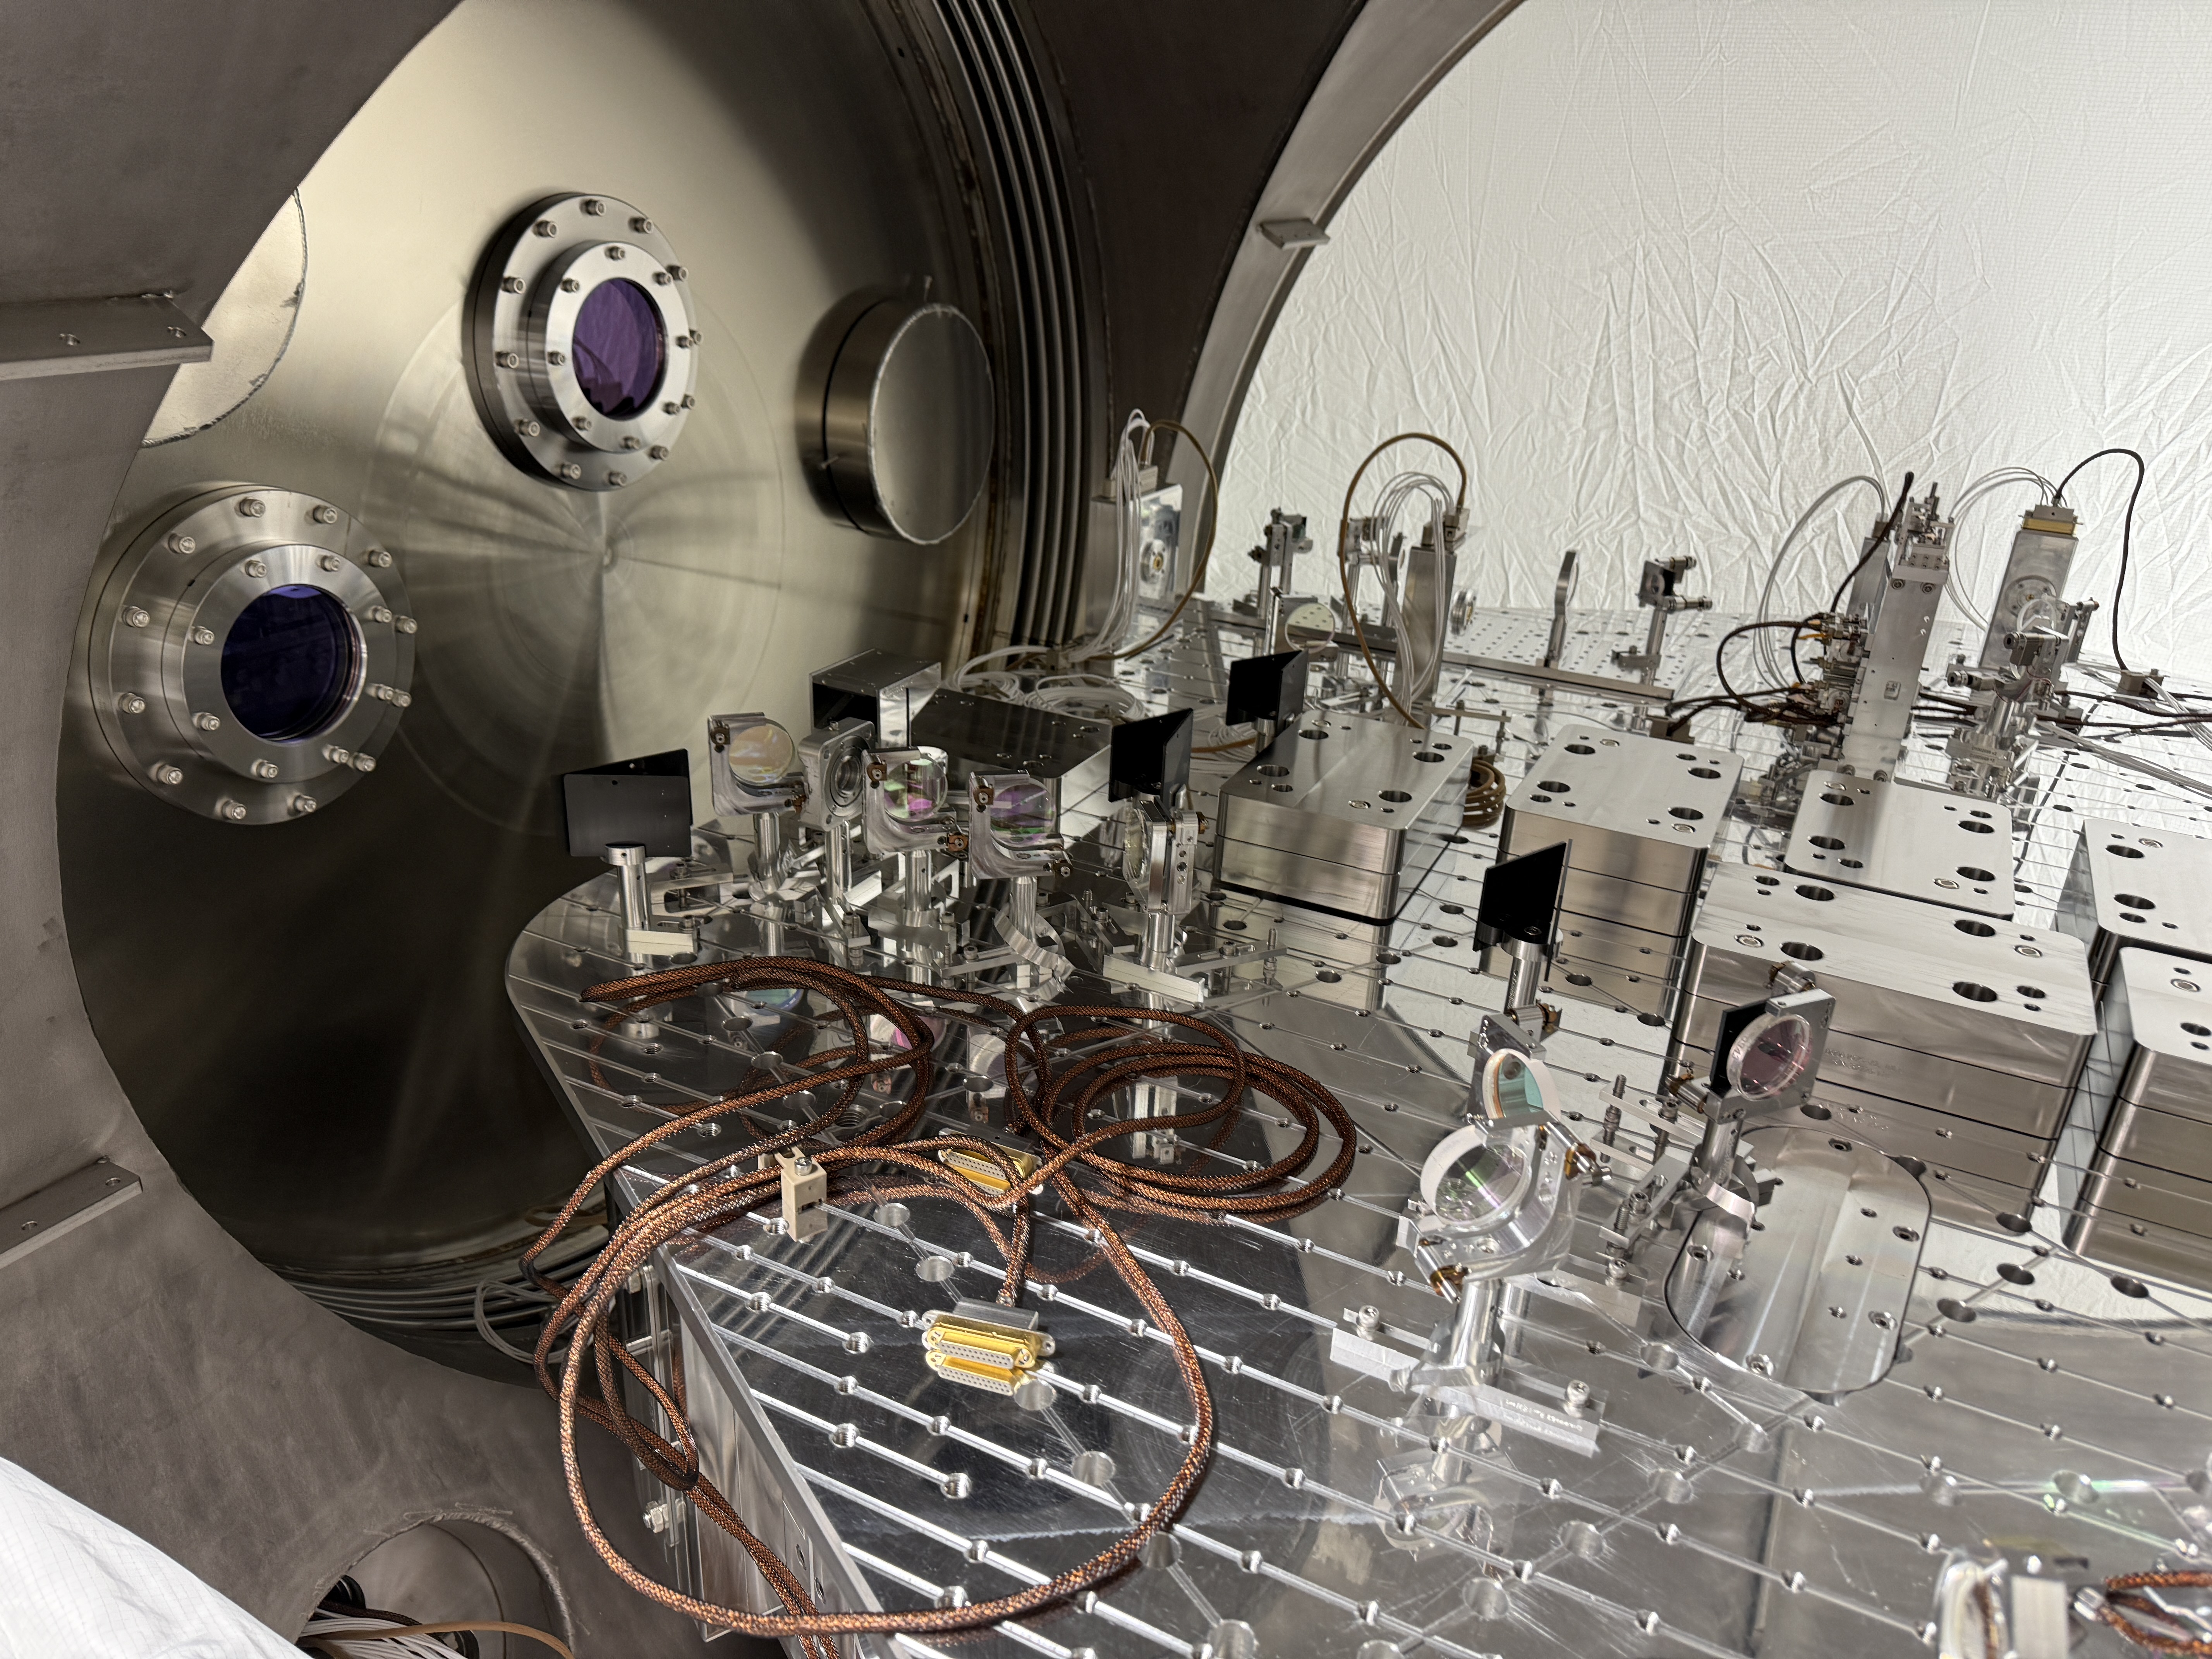
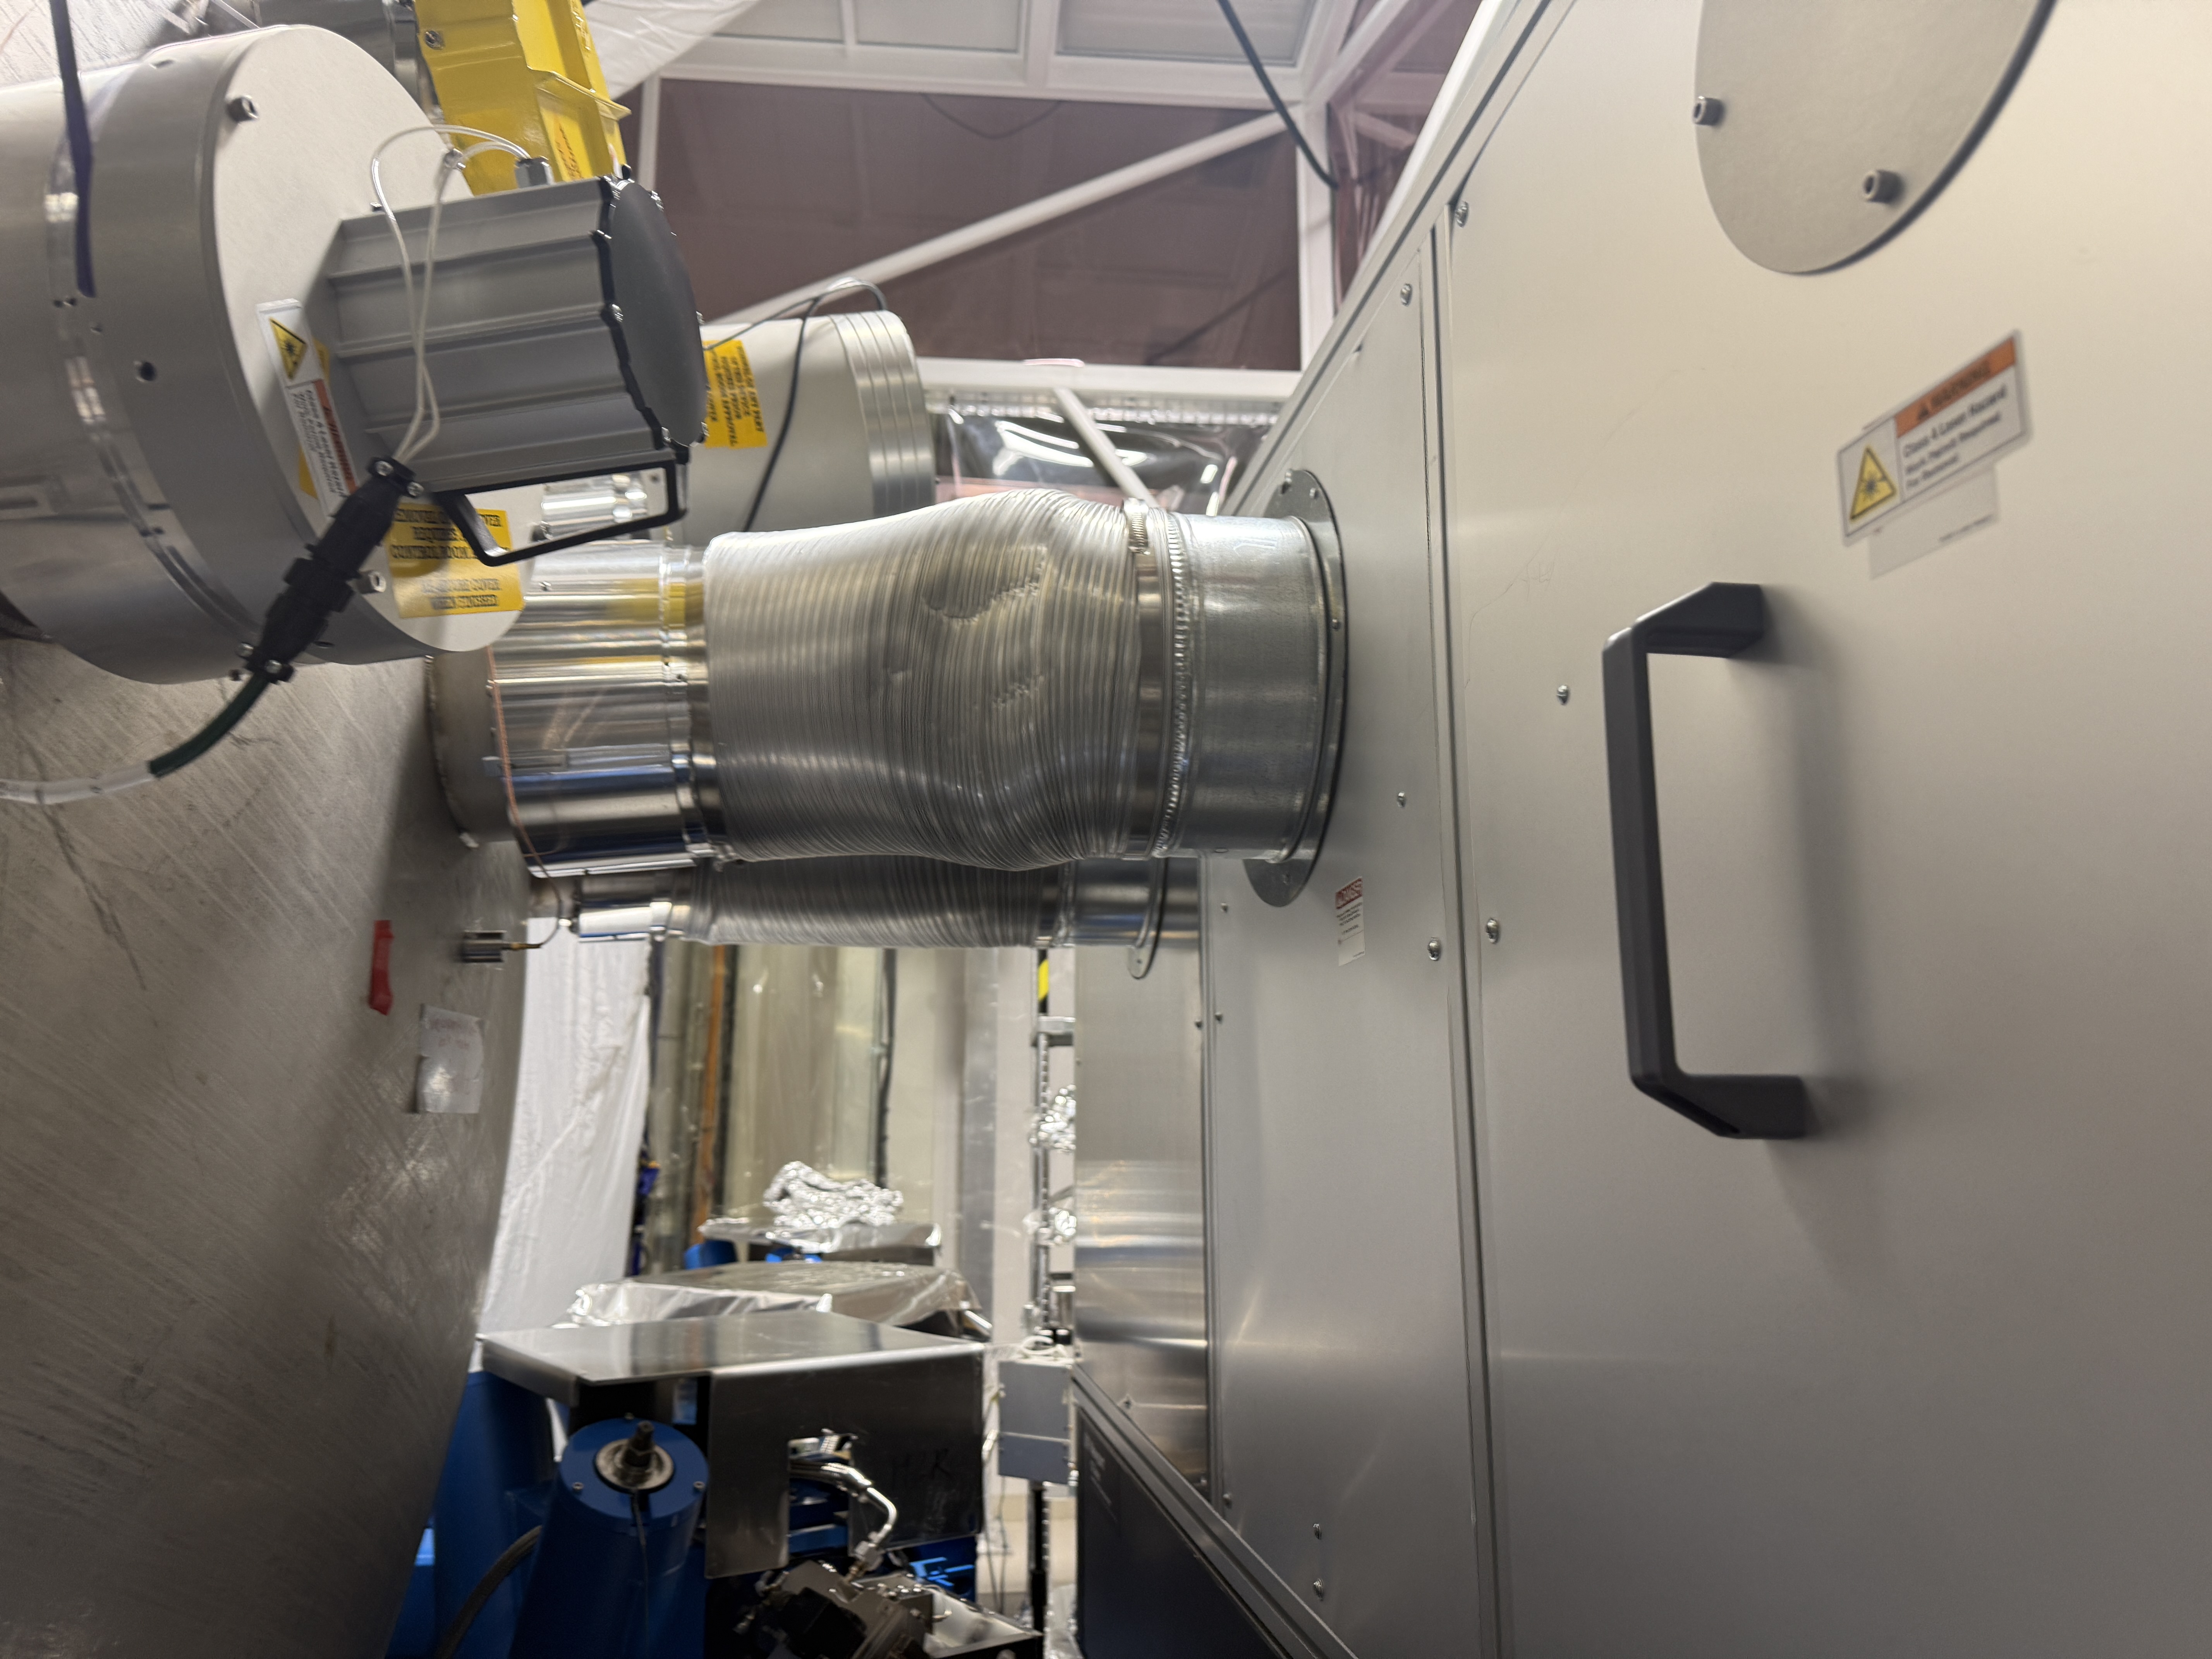
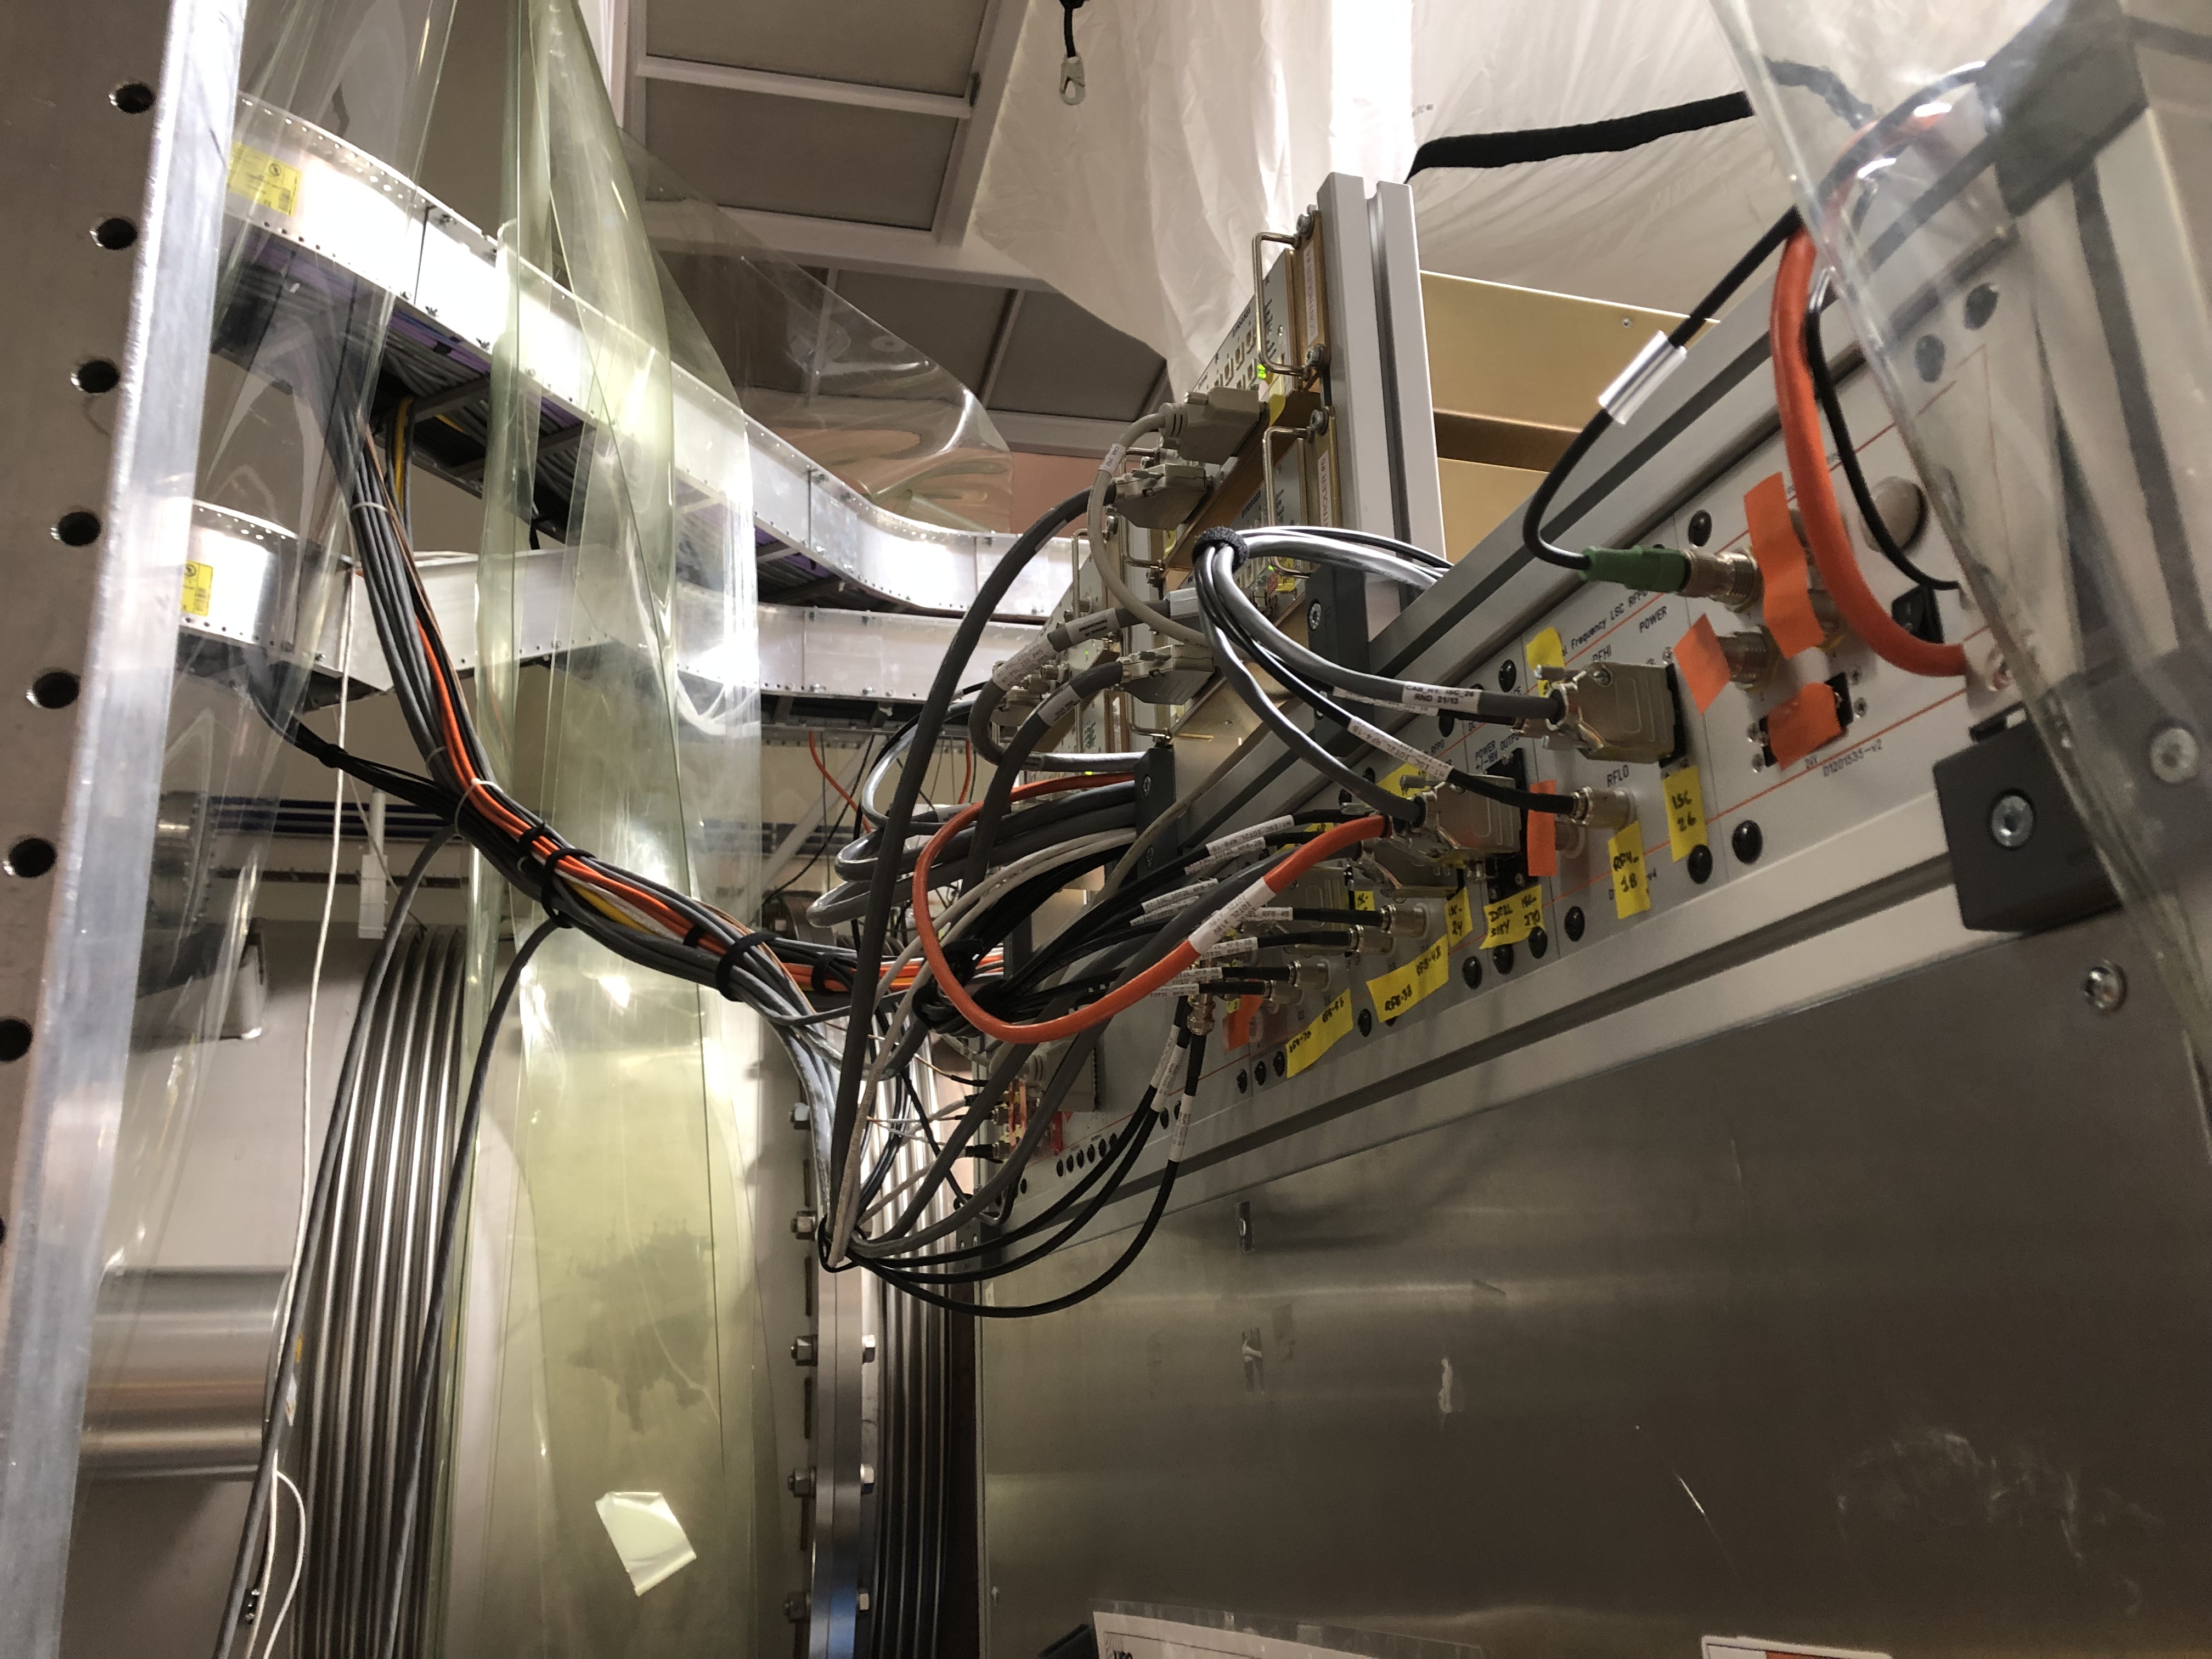
Following work done in 84115 to repopulate HAM1 with some optical components, today Oli and I placed the SLED in position and placed all the diodes, most (not LSC POP A ) are cabled. Photos taken from -Y side and +Y side attached.

Apart from LSC POP A, they are all cabled up according to the cables in D1000313 BOM googlesheet. LSC POP A has a heli-coil that needs replacing before we can install the RF cable so neither cable are currently installed. ASC REFL A and B are in the incorrect position to allow for beam profiling before moving the the final position. LSC REFL A and B may need to be moved slightly but we need more of the correct size dog clamps to allow that. 

Images attached to this report
Comments related to this report
corey.gray@LIGO.ORG - 09:49, Tuesday 29 April 2025 (84168)EPO

Tagging EPO for HAM1 table photos.

camilla.compton@LIGO.ORG - 12:51, Tuesday 29 April 2025 (84174)

Rahul, Gerado, Camilla 

We pulled the old helicoil and installed a new shorter helicoil into LSC POP A. All diode cables are now connected.

As we were running low on dog clamps, I swapped the bases of L2, M10 nd M12 to longer D1200683 mounting bases so that we can use the dog clamps where needed. Photos attached.

Images attached to this comment
H1 PSL
ryan.short@LIGO.ORG - posted 14:58, Monday 28 April 2025 (84154)
PSL 10-Day Trends

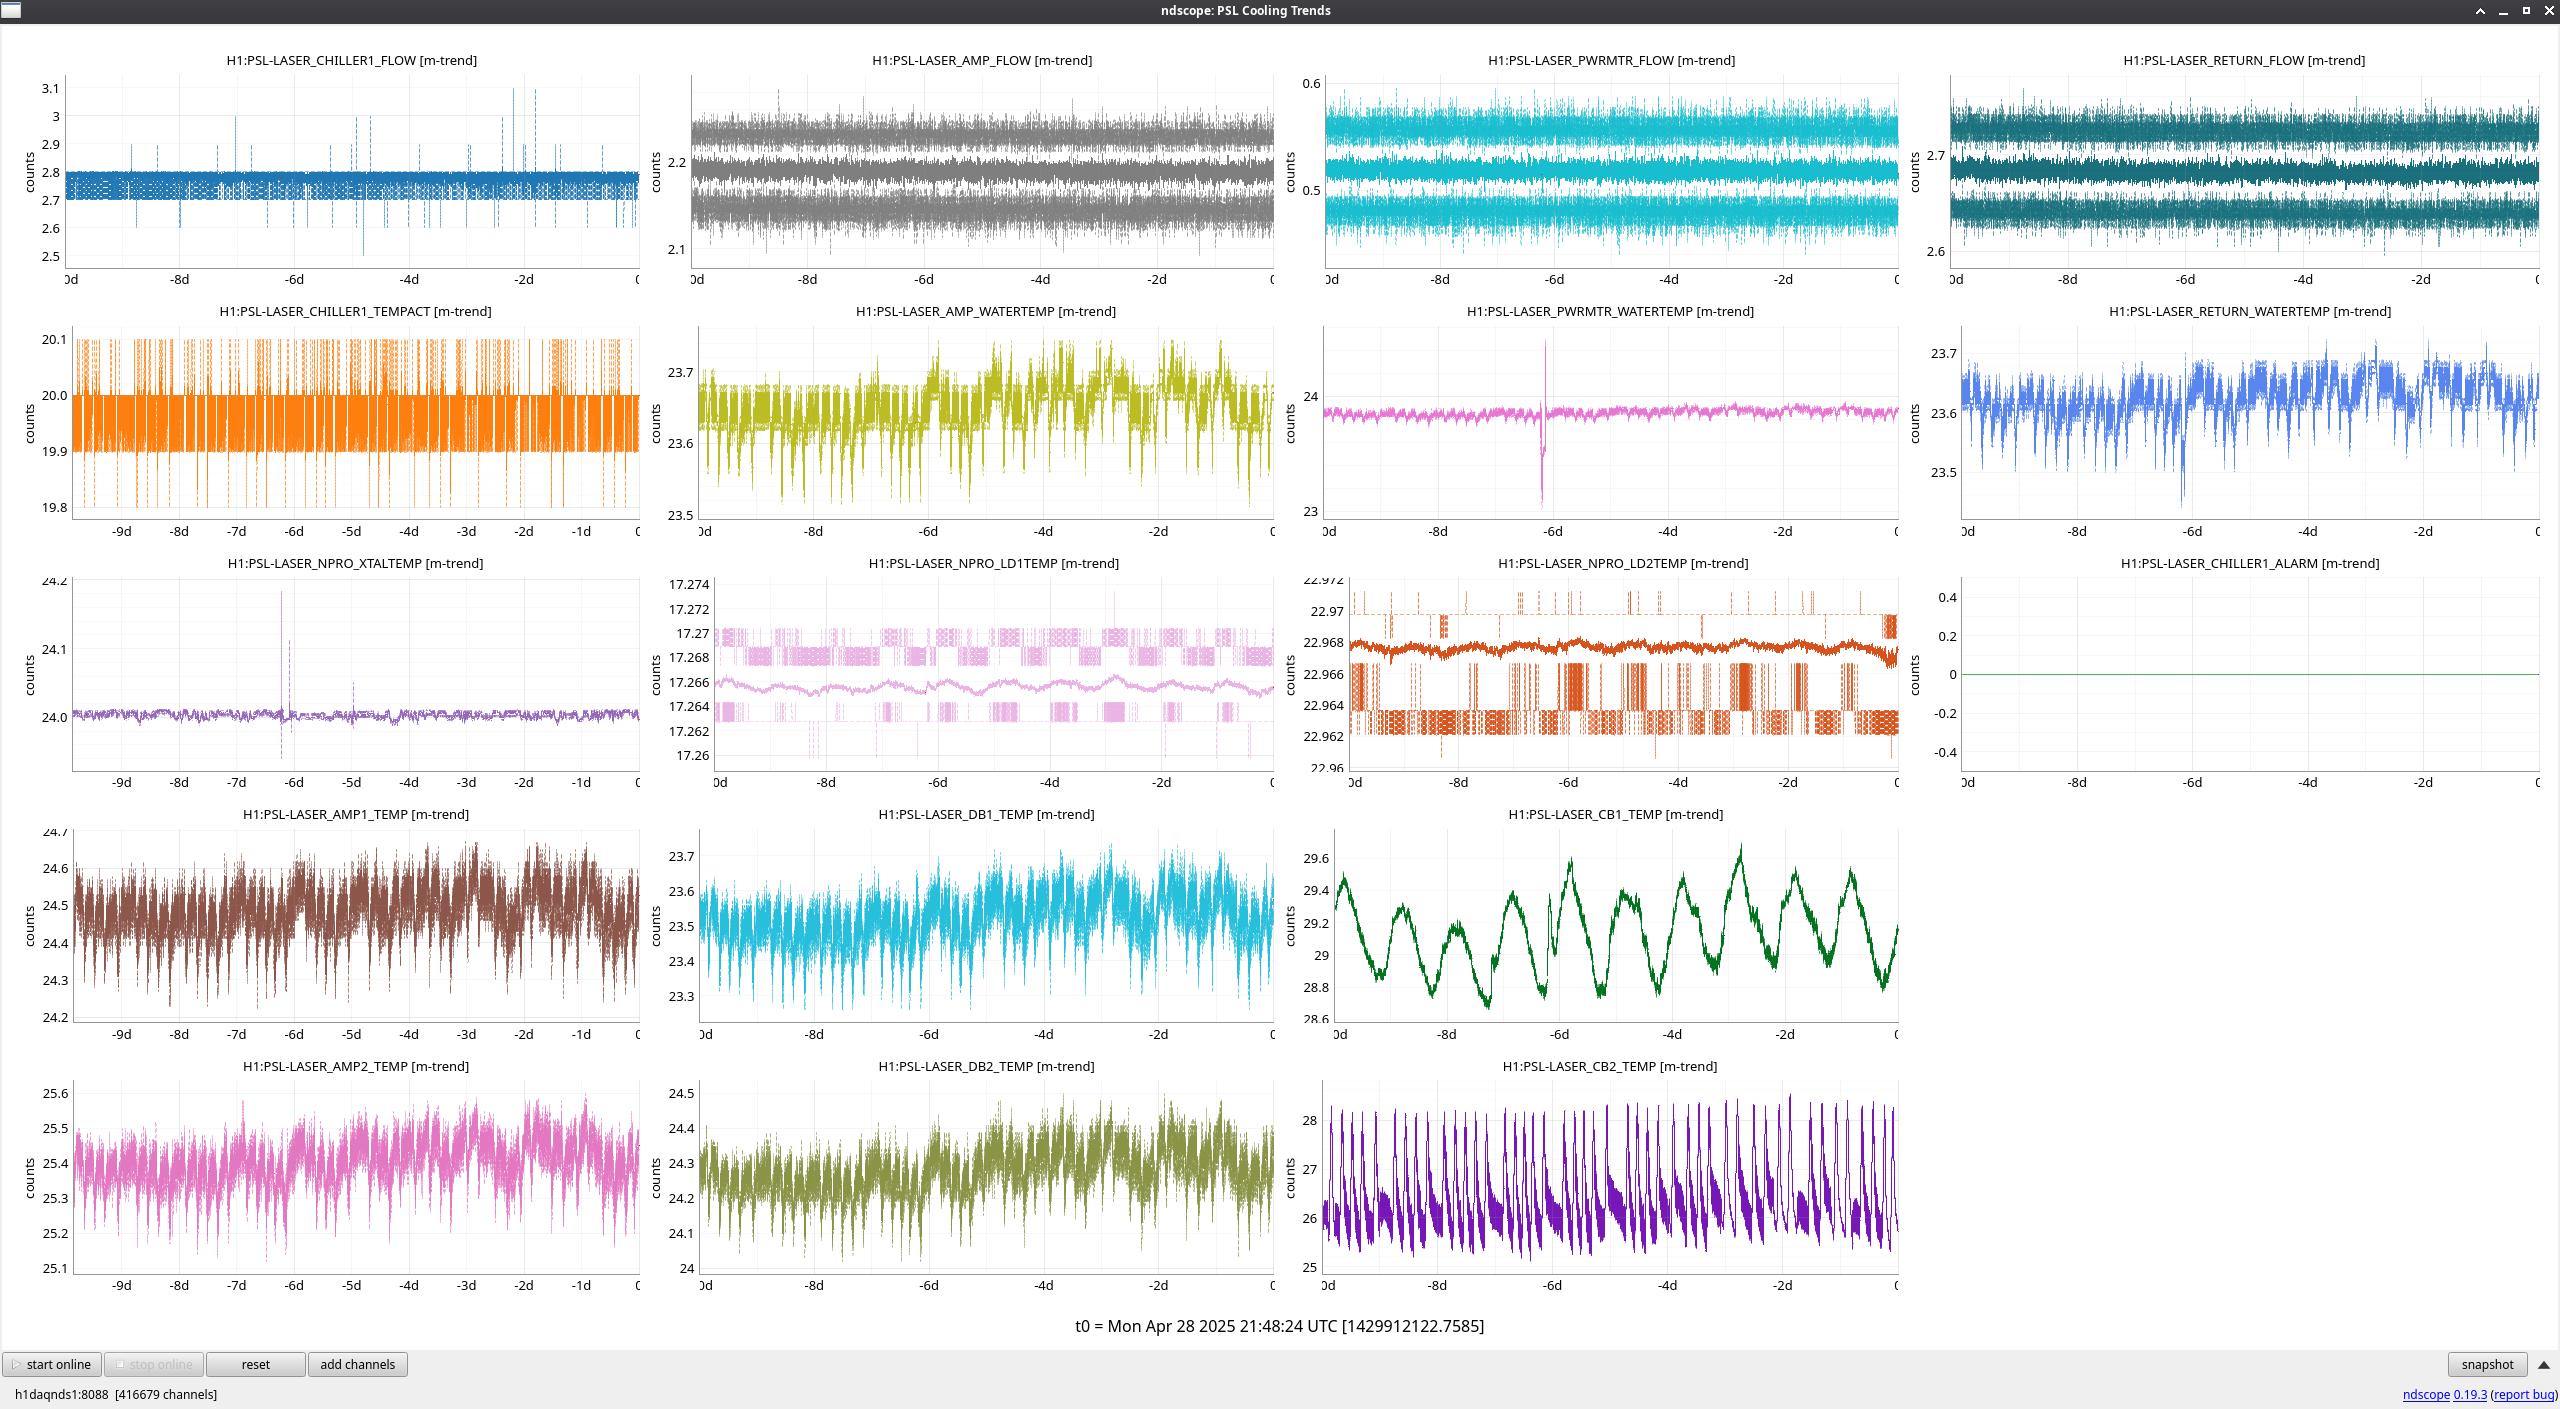
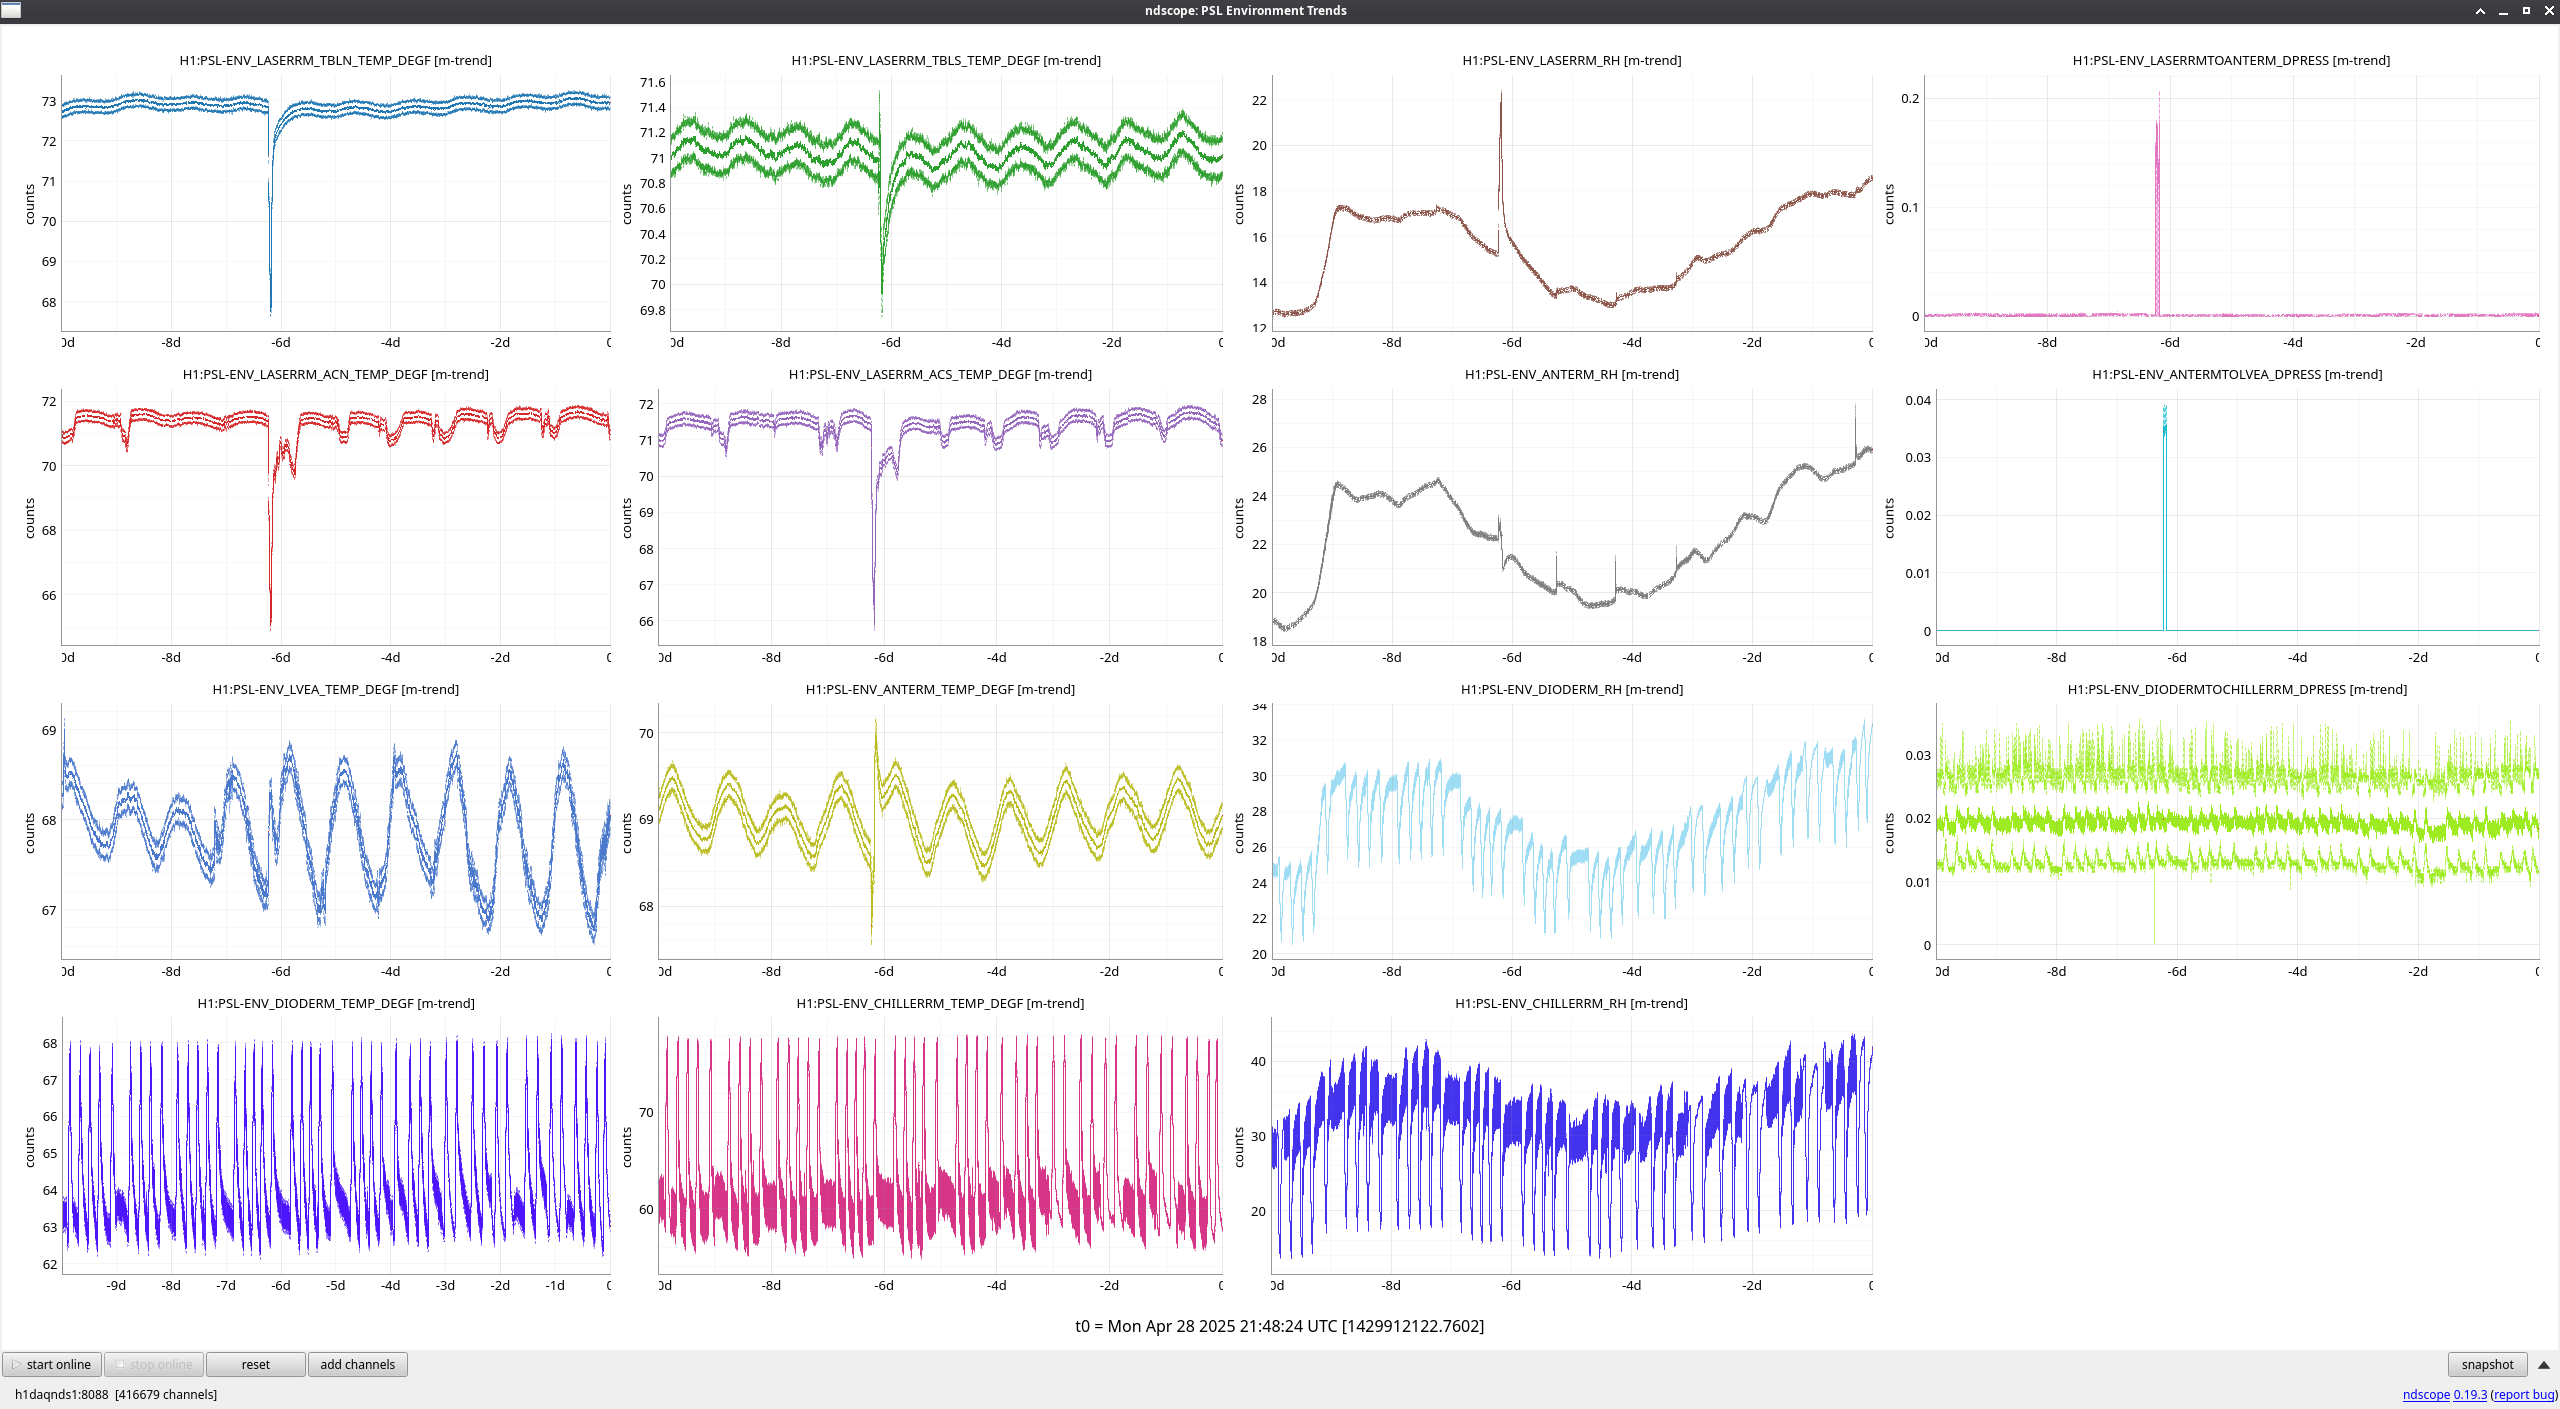
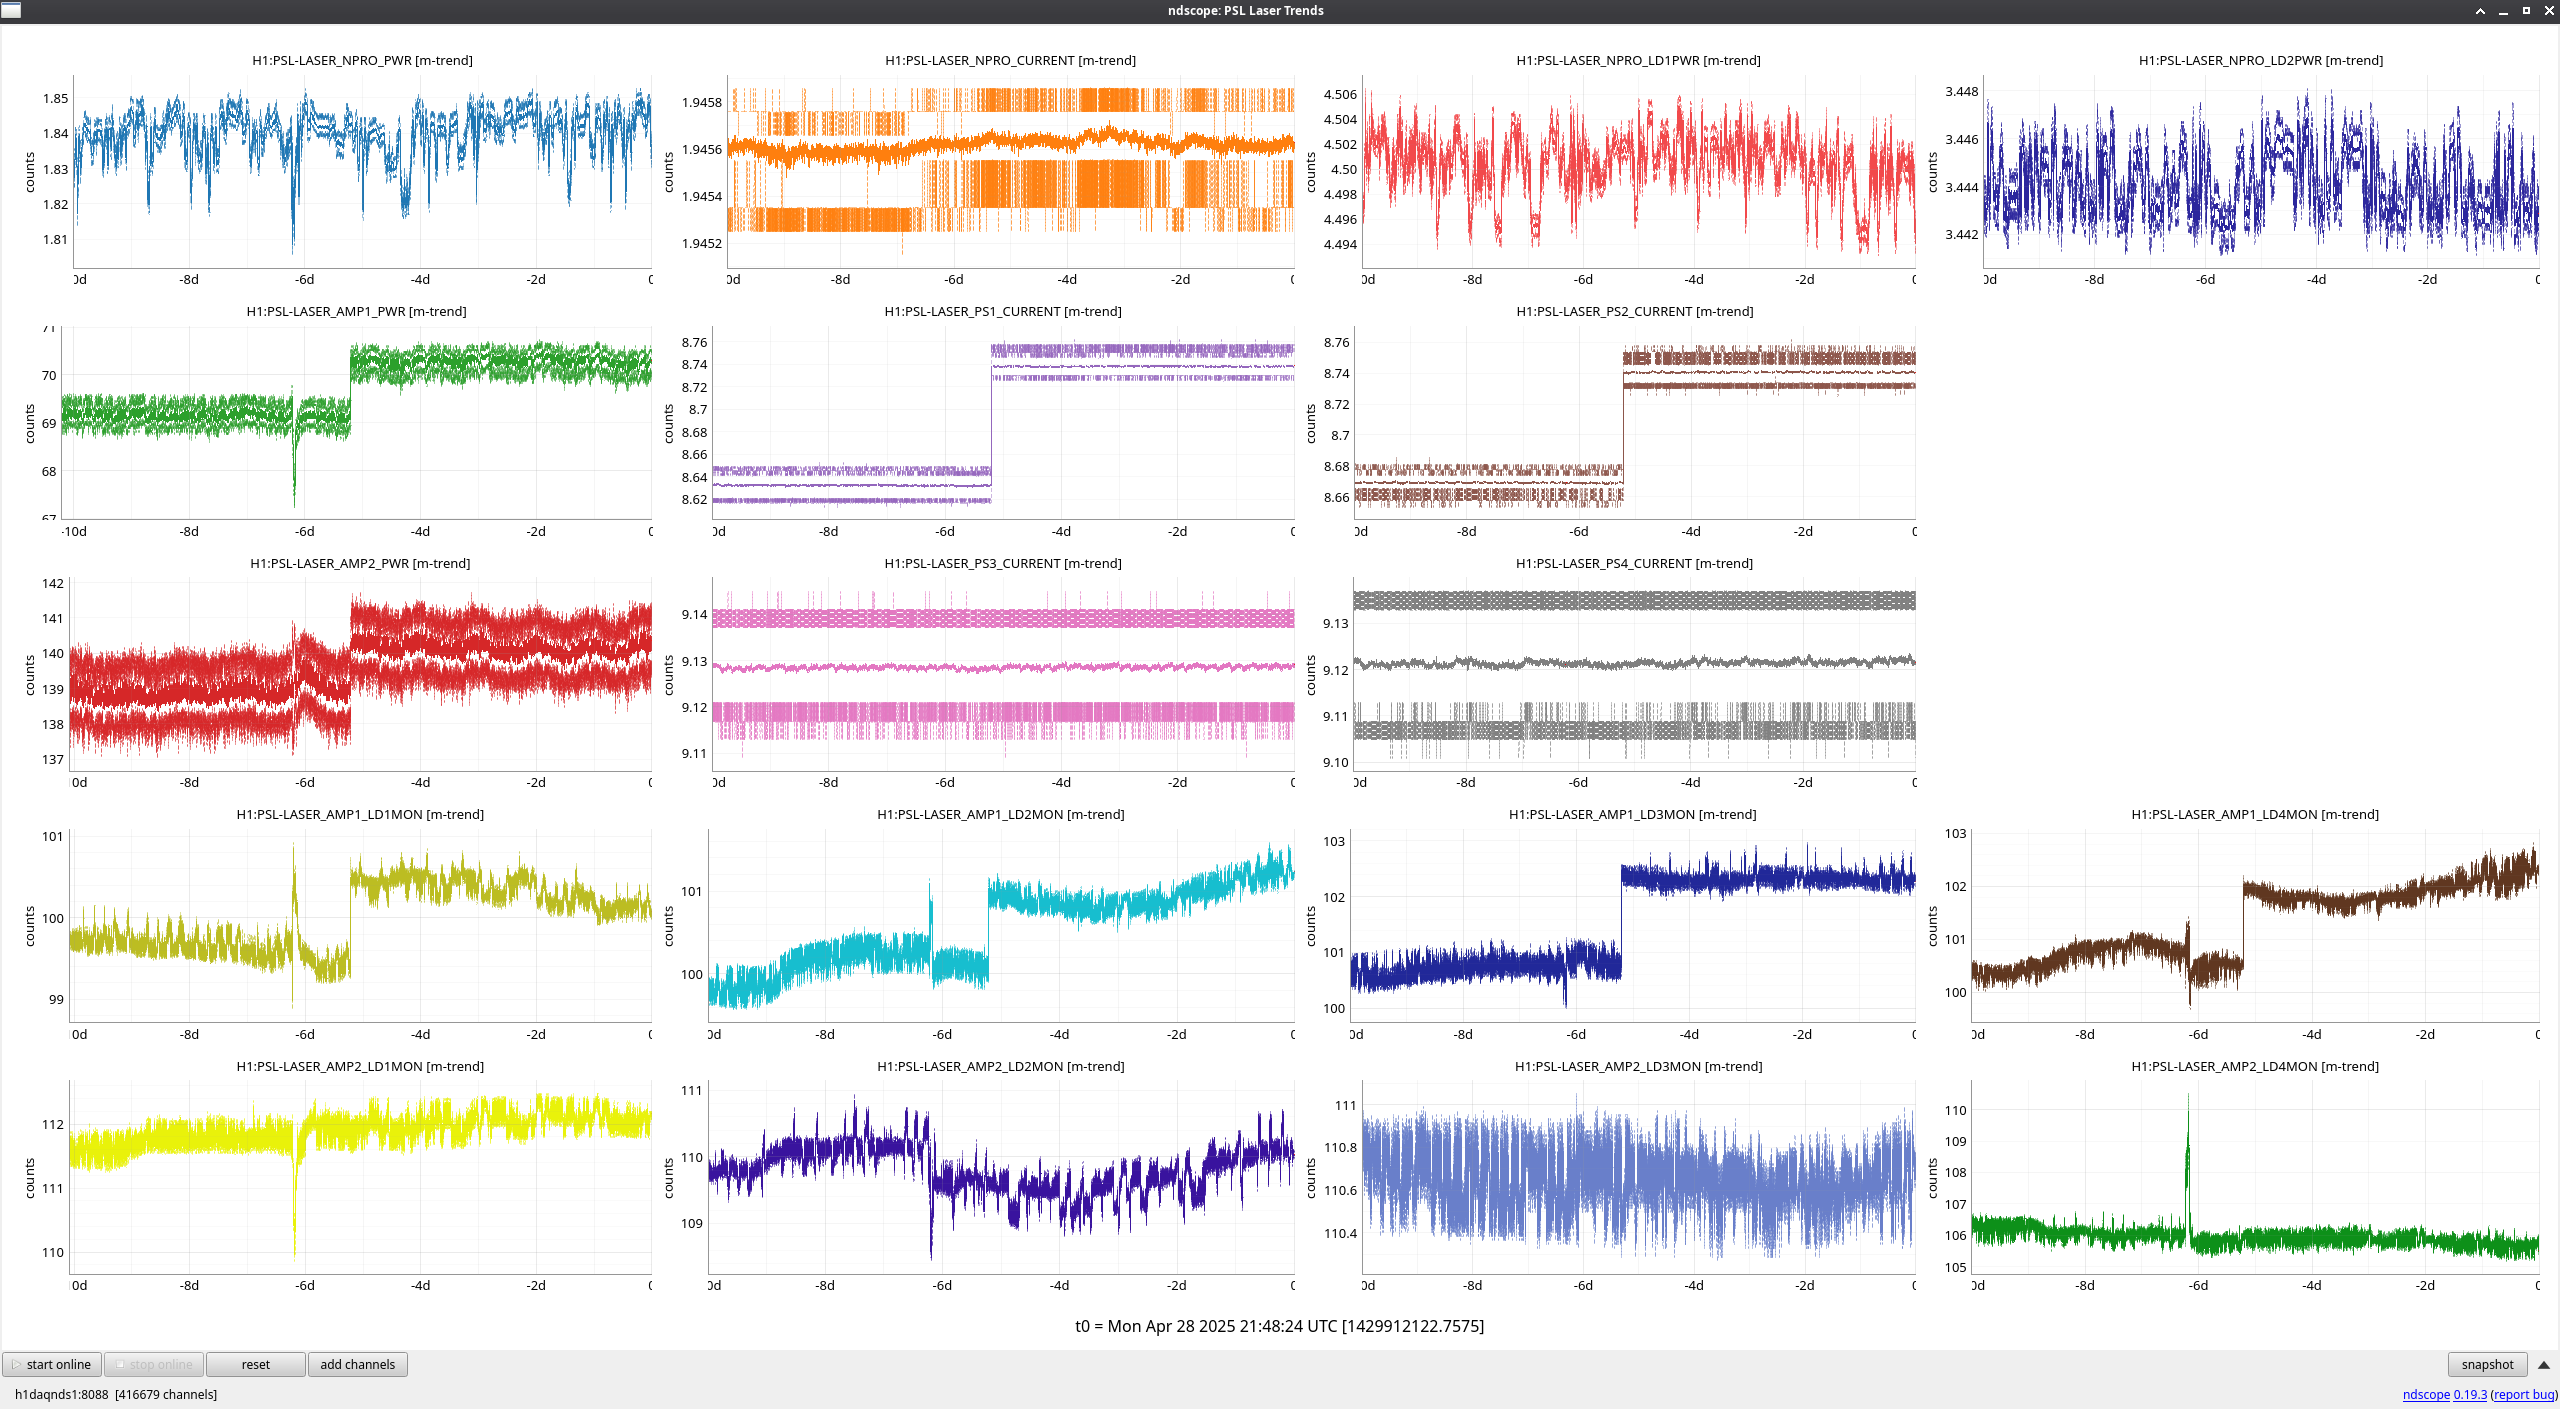
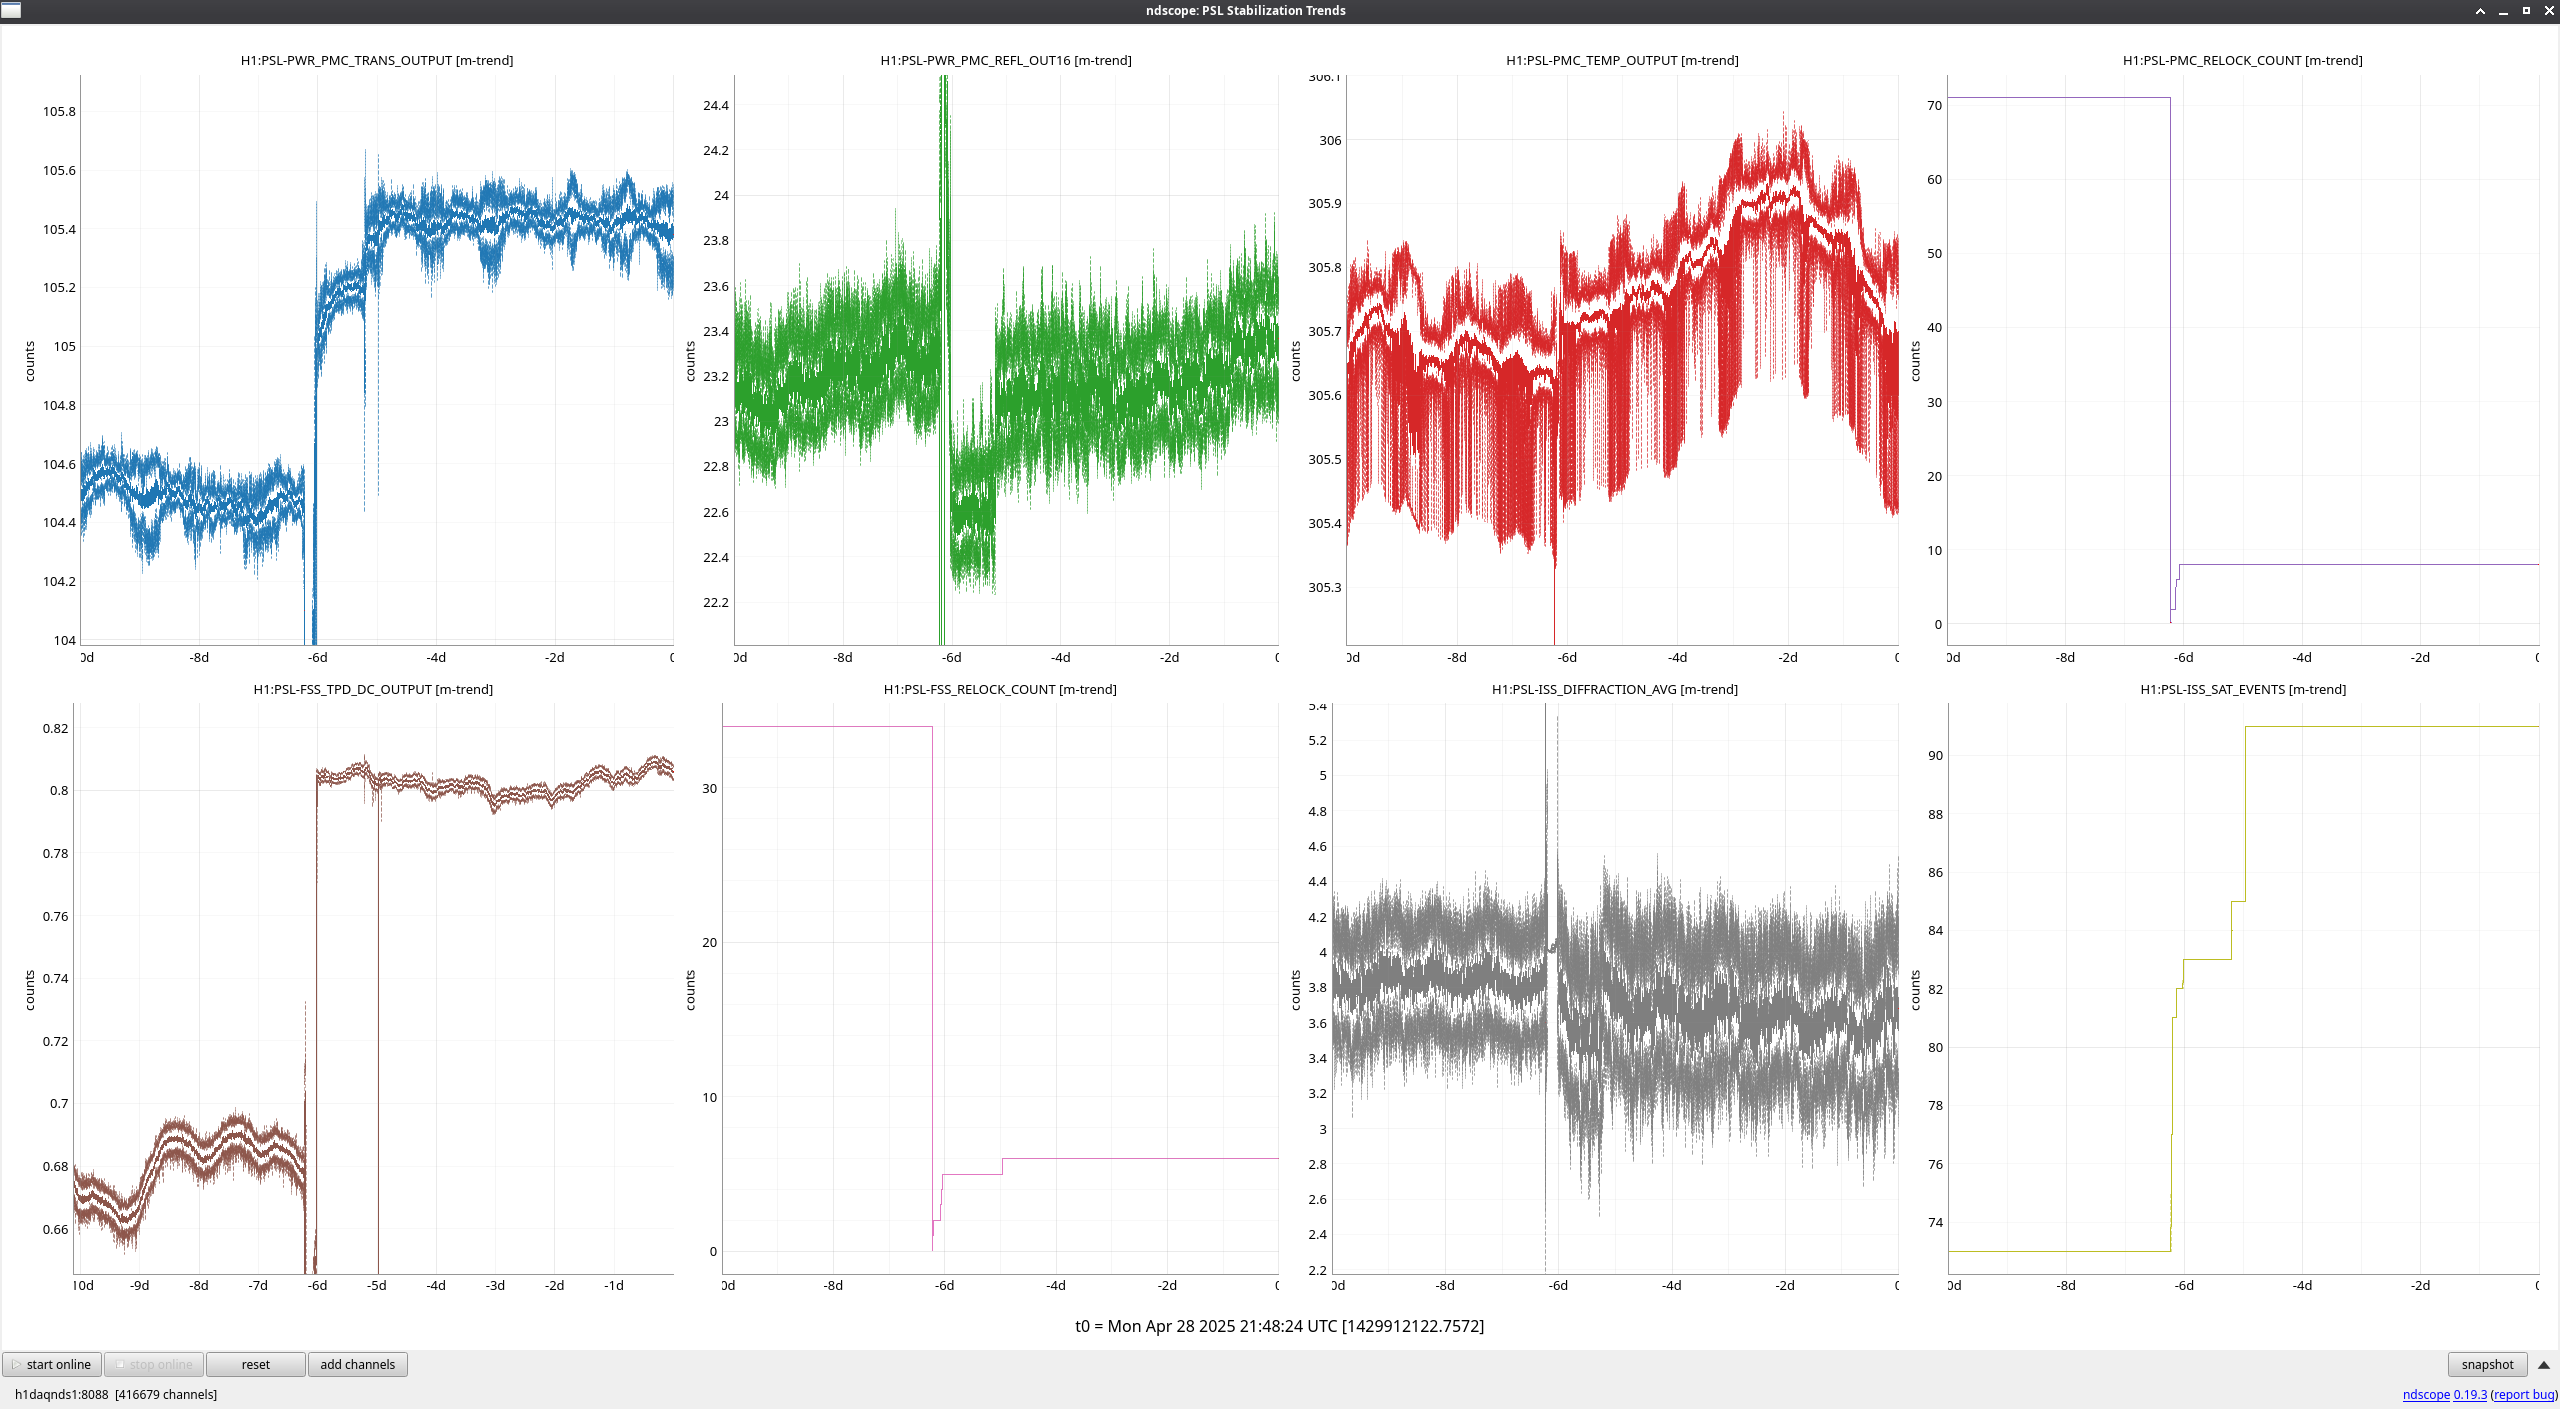
FAMIS 31083

Short list of PSL-related events over the past week are as follows:

Aside from these events, no other major changes of note.

Images attached to this report
H1 SUS (SUS)
ibrahim.abouelfettouh@LIGO.ORG - posted 14:46, Monday 28 April 2025 (84153)
Input Arm Pointing Alignment with HEPI Locked Comparison (Pre-vent and Post-pumpdown)

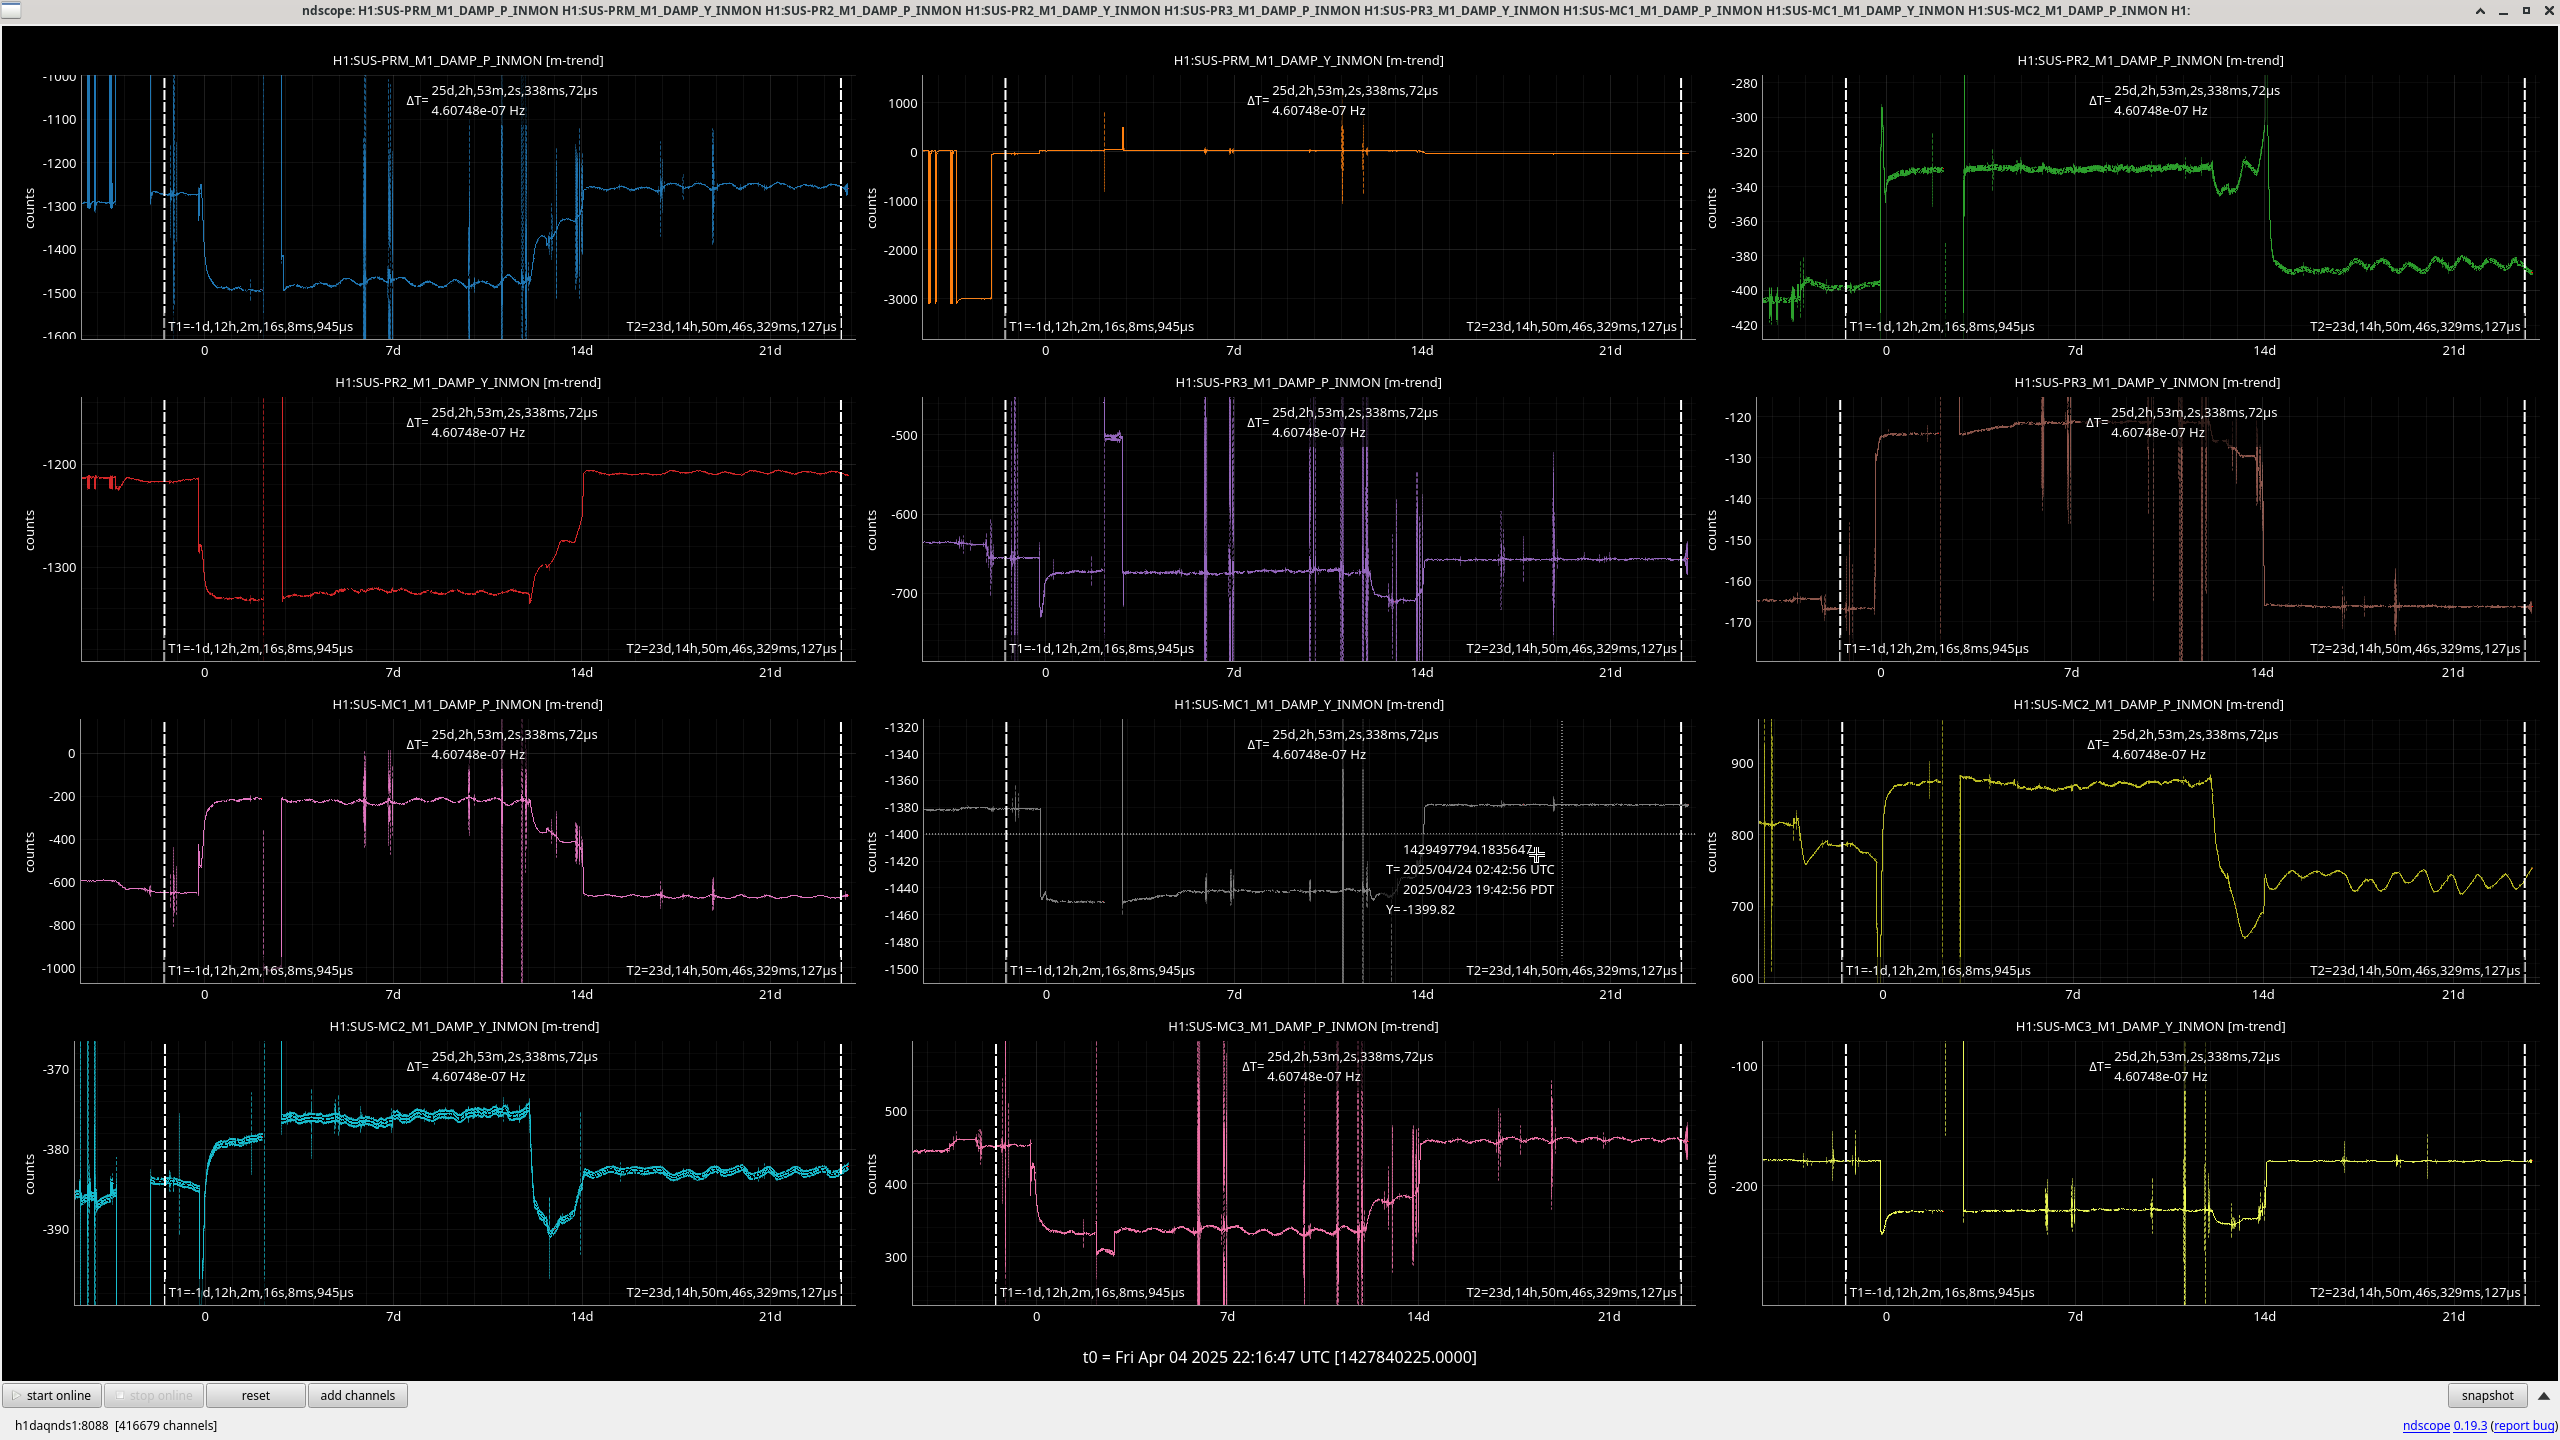
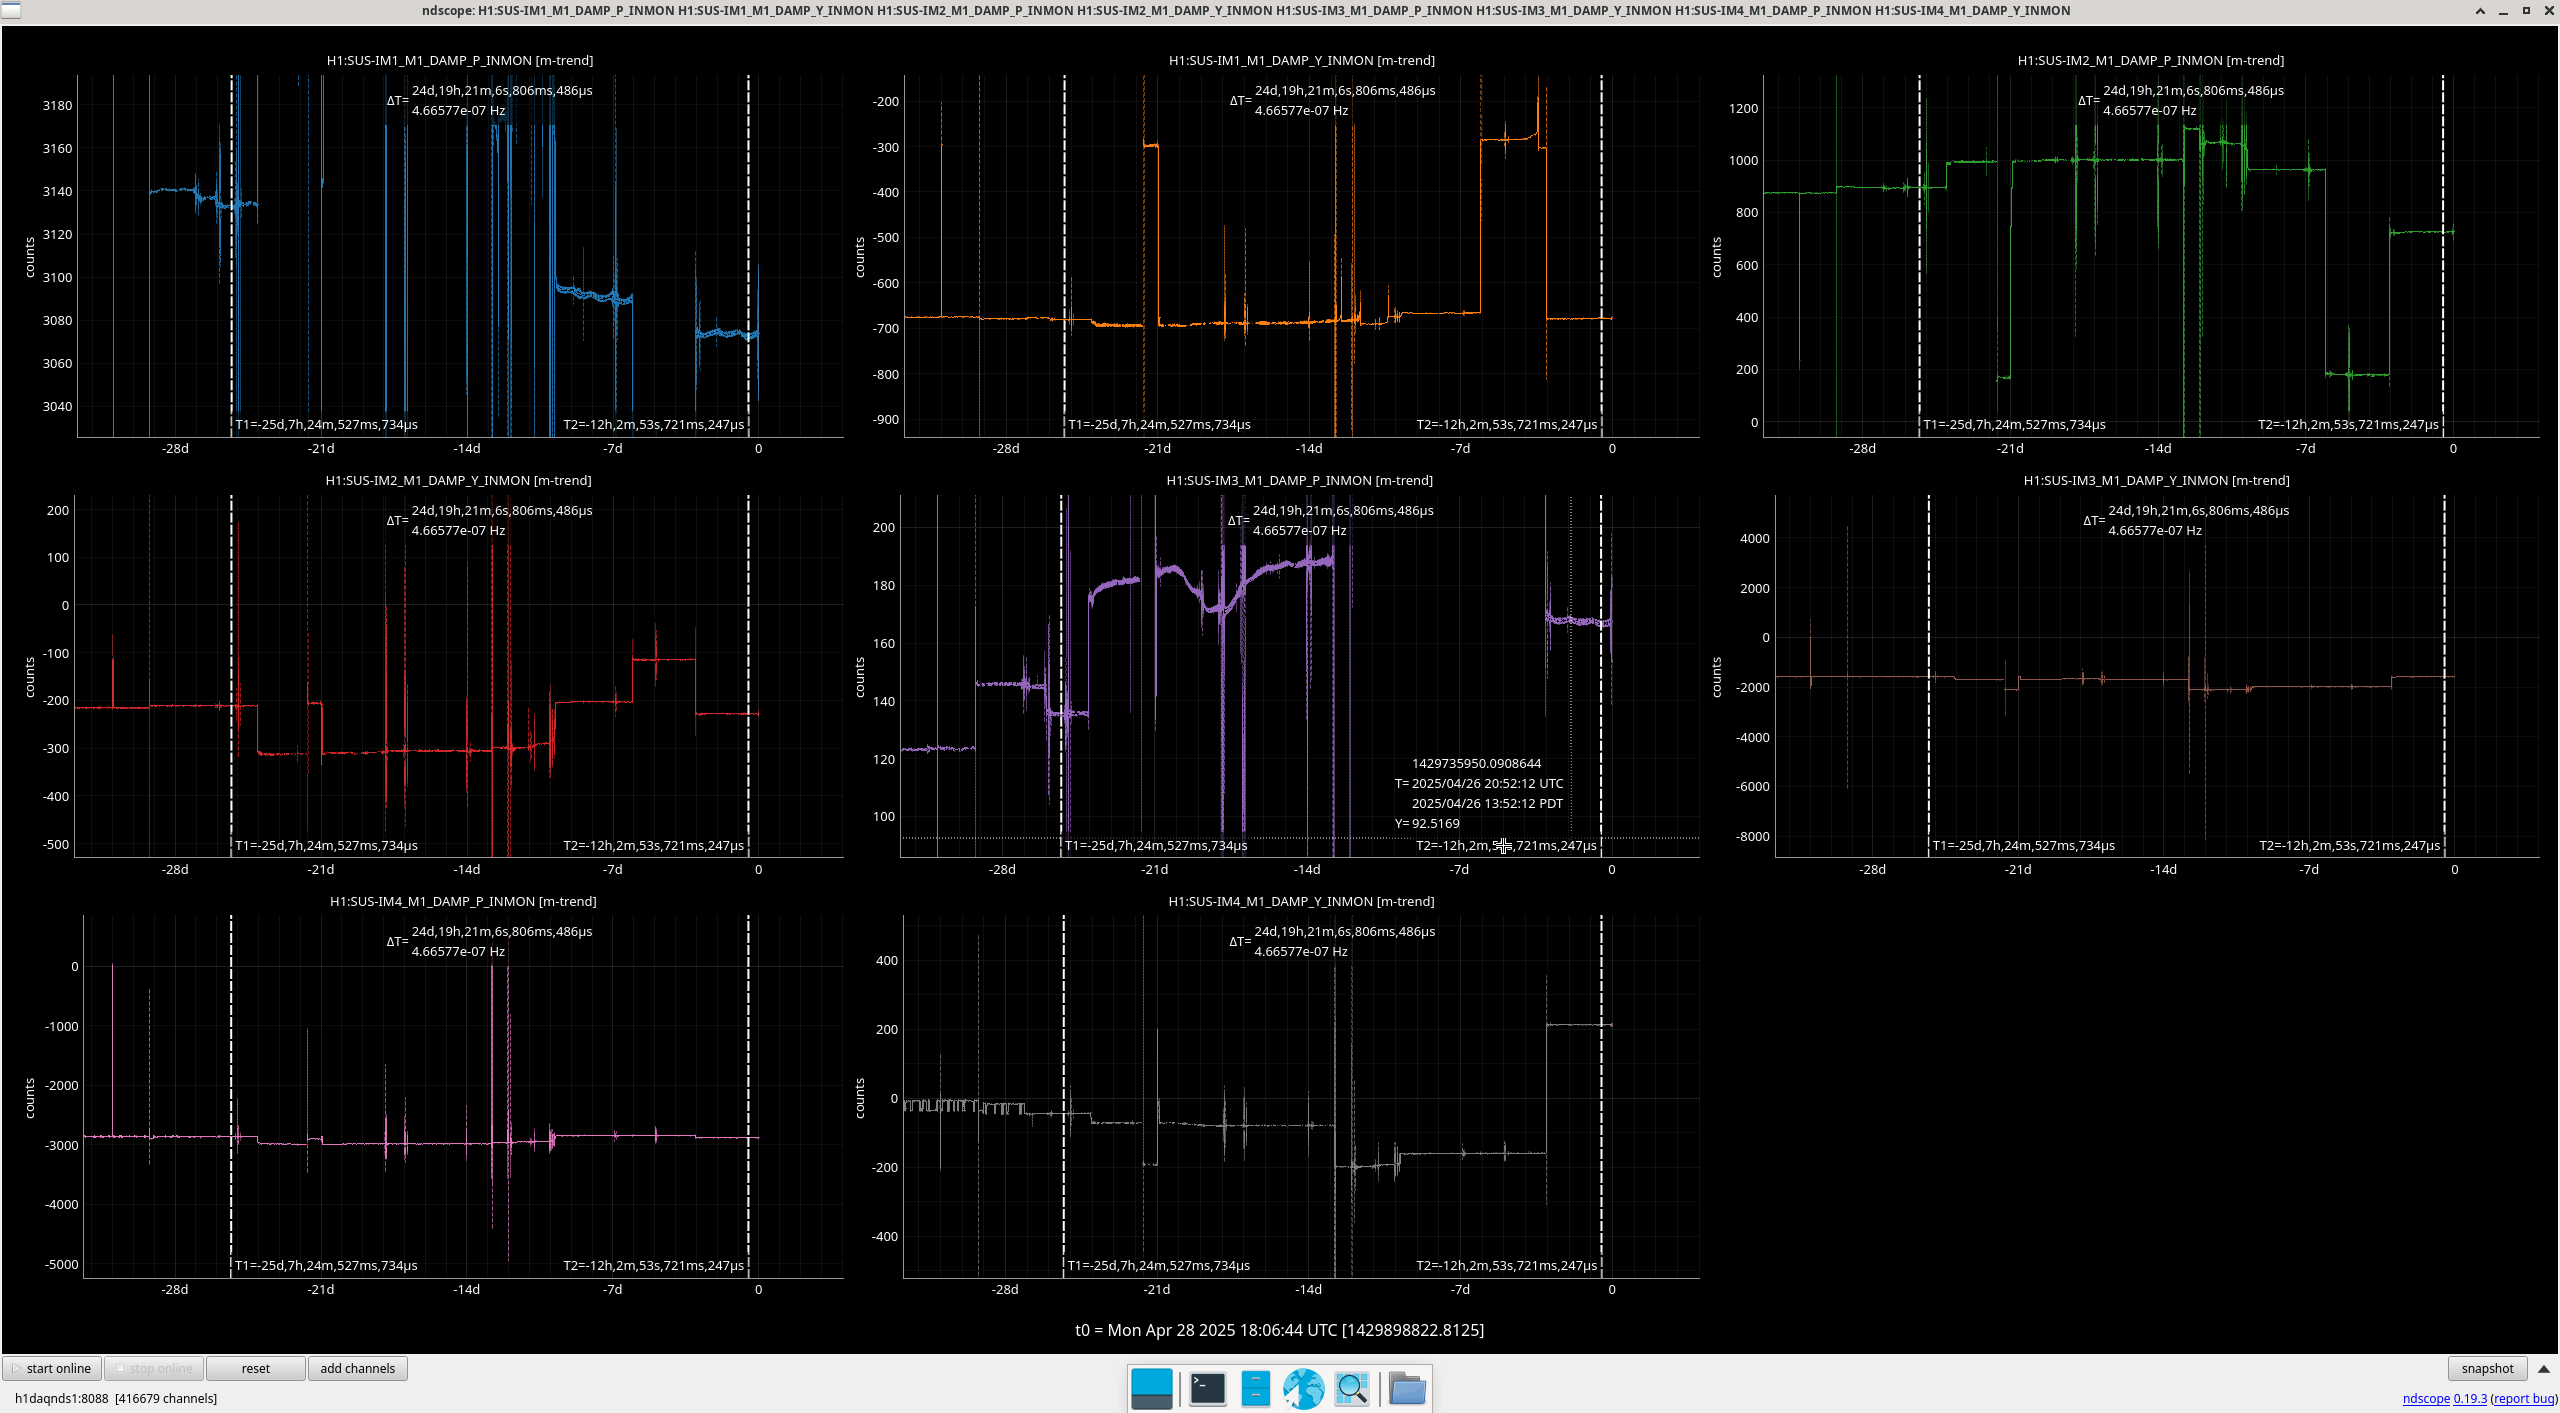
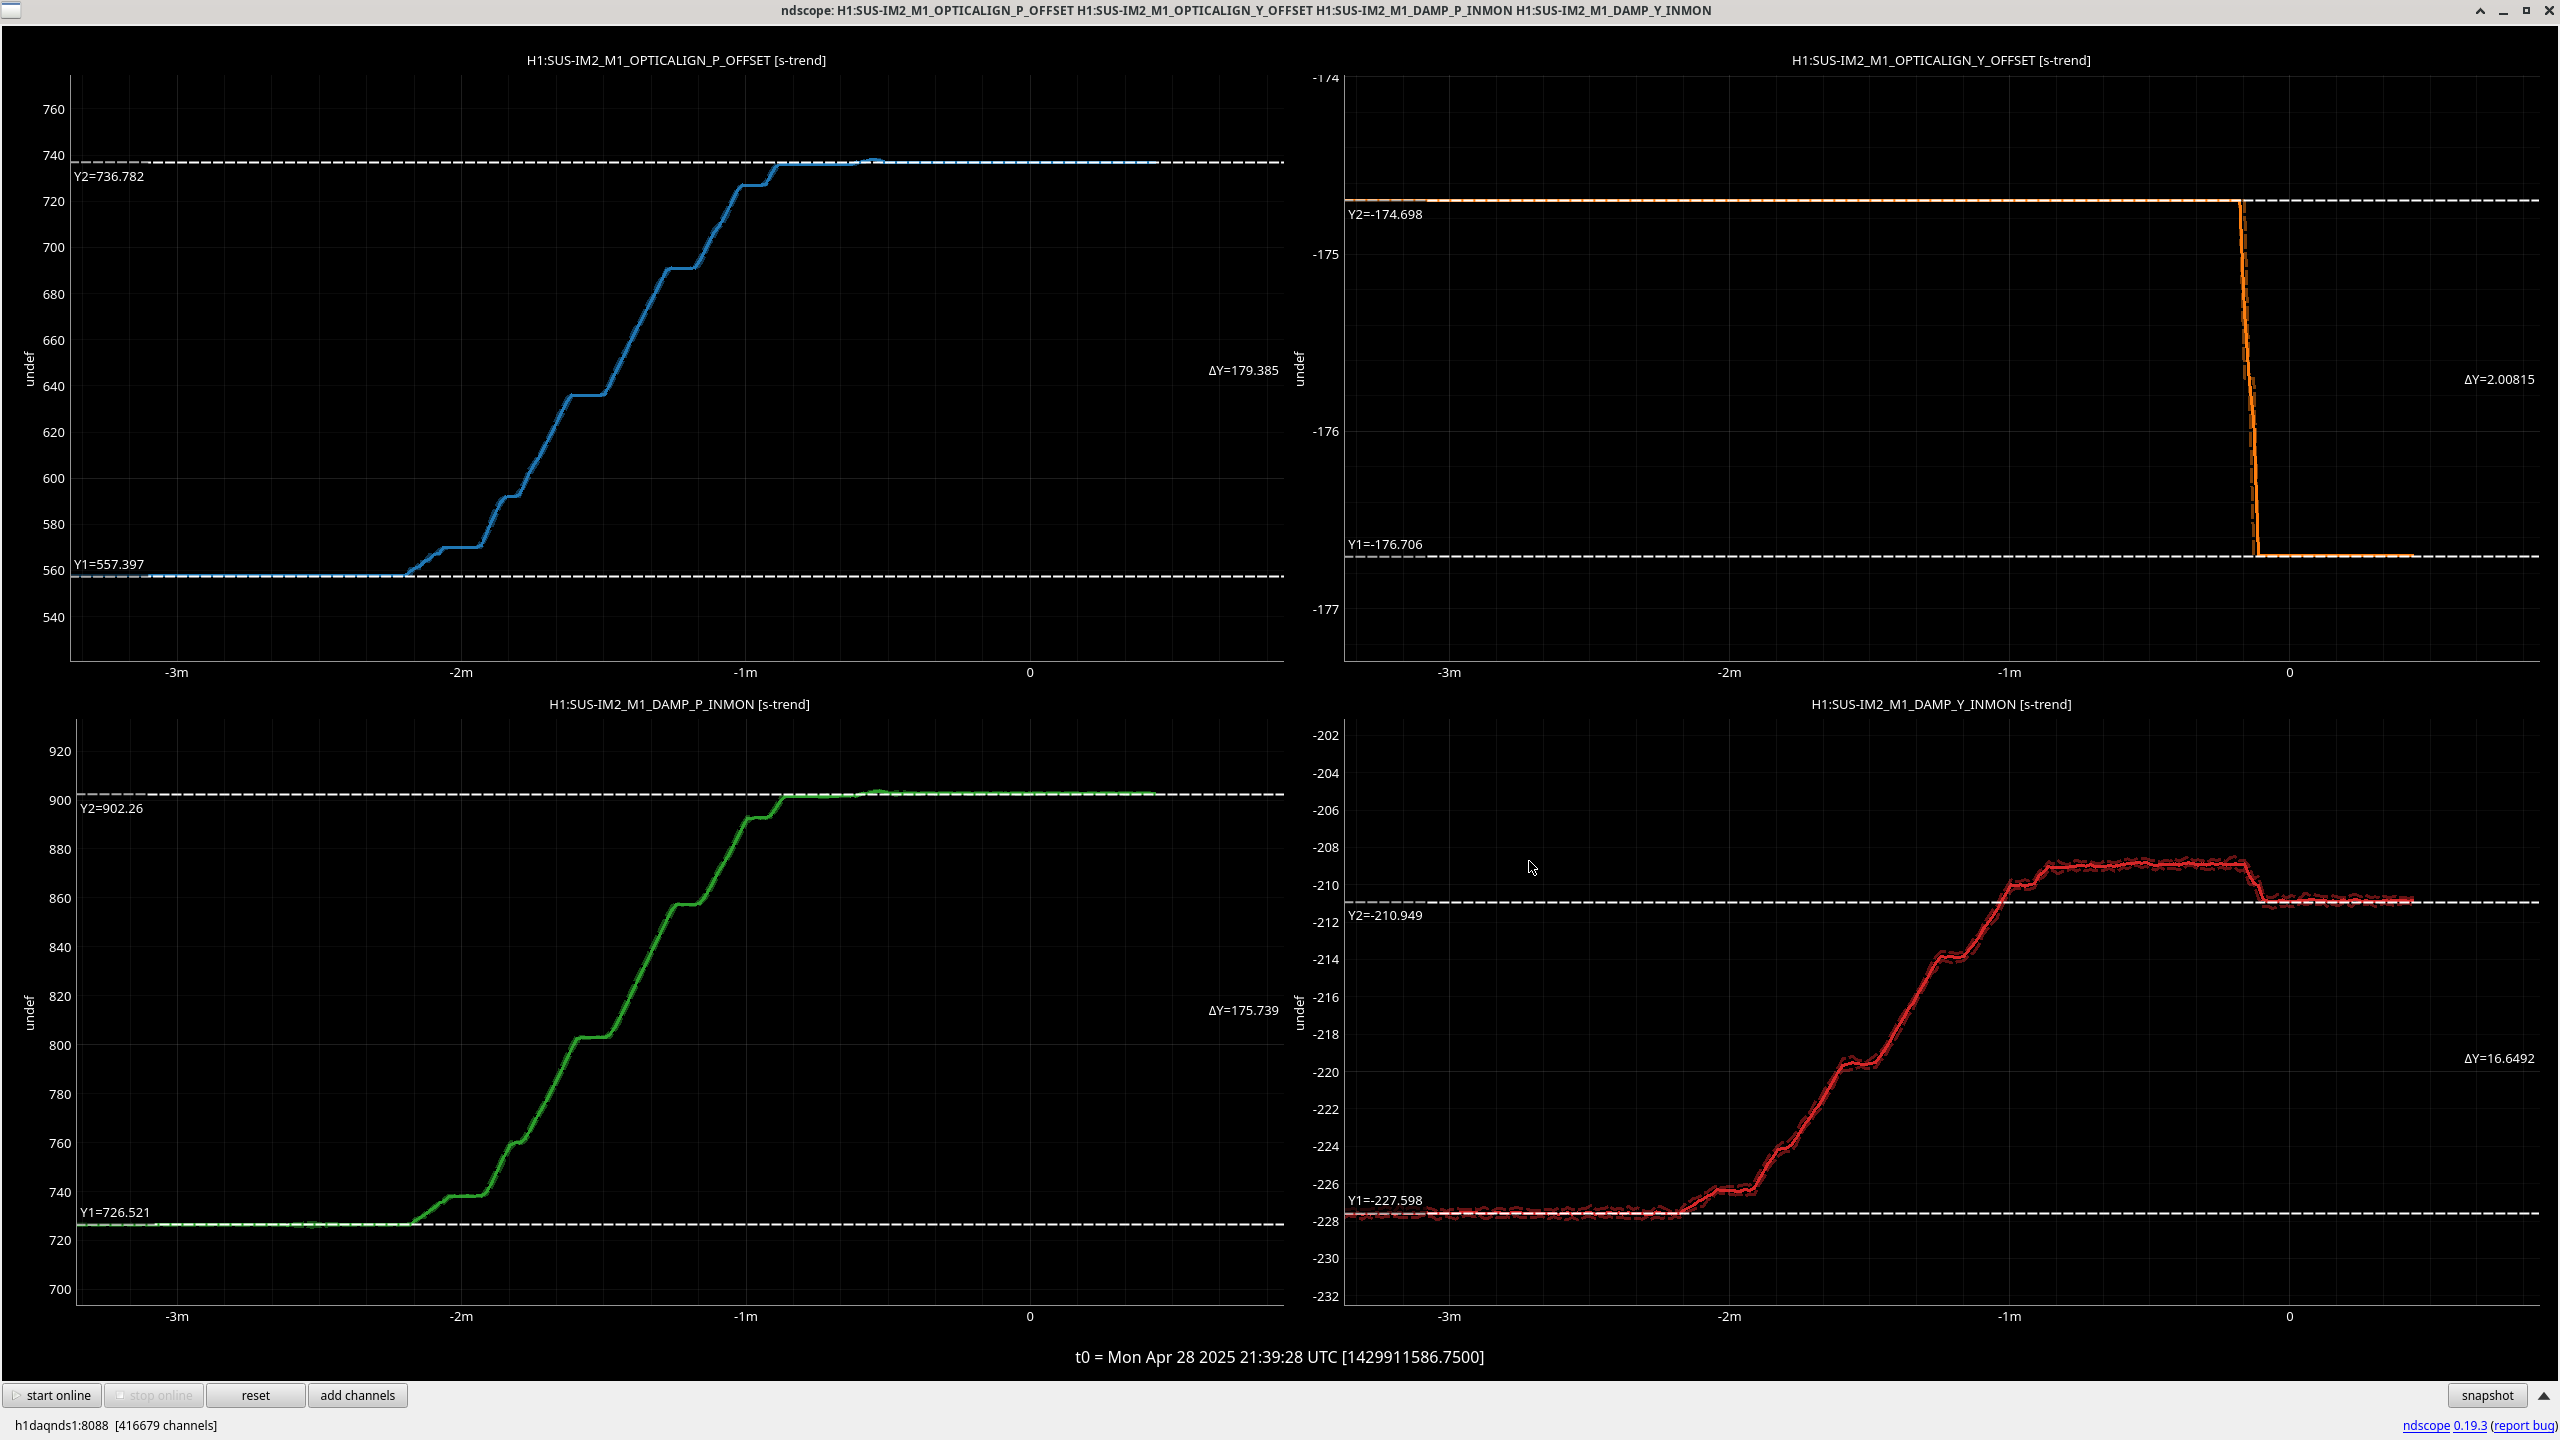
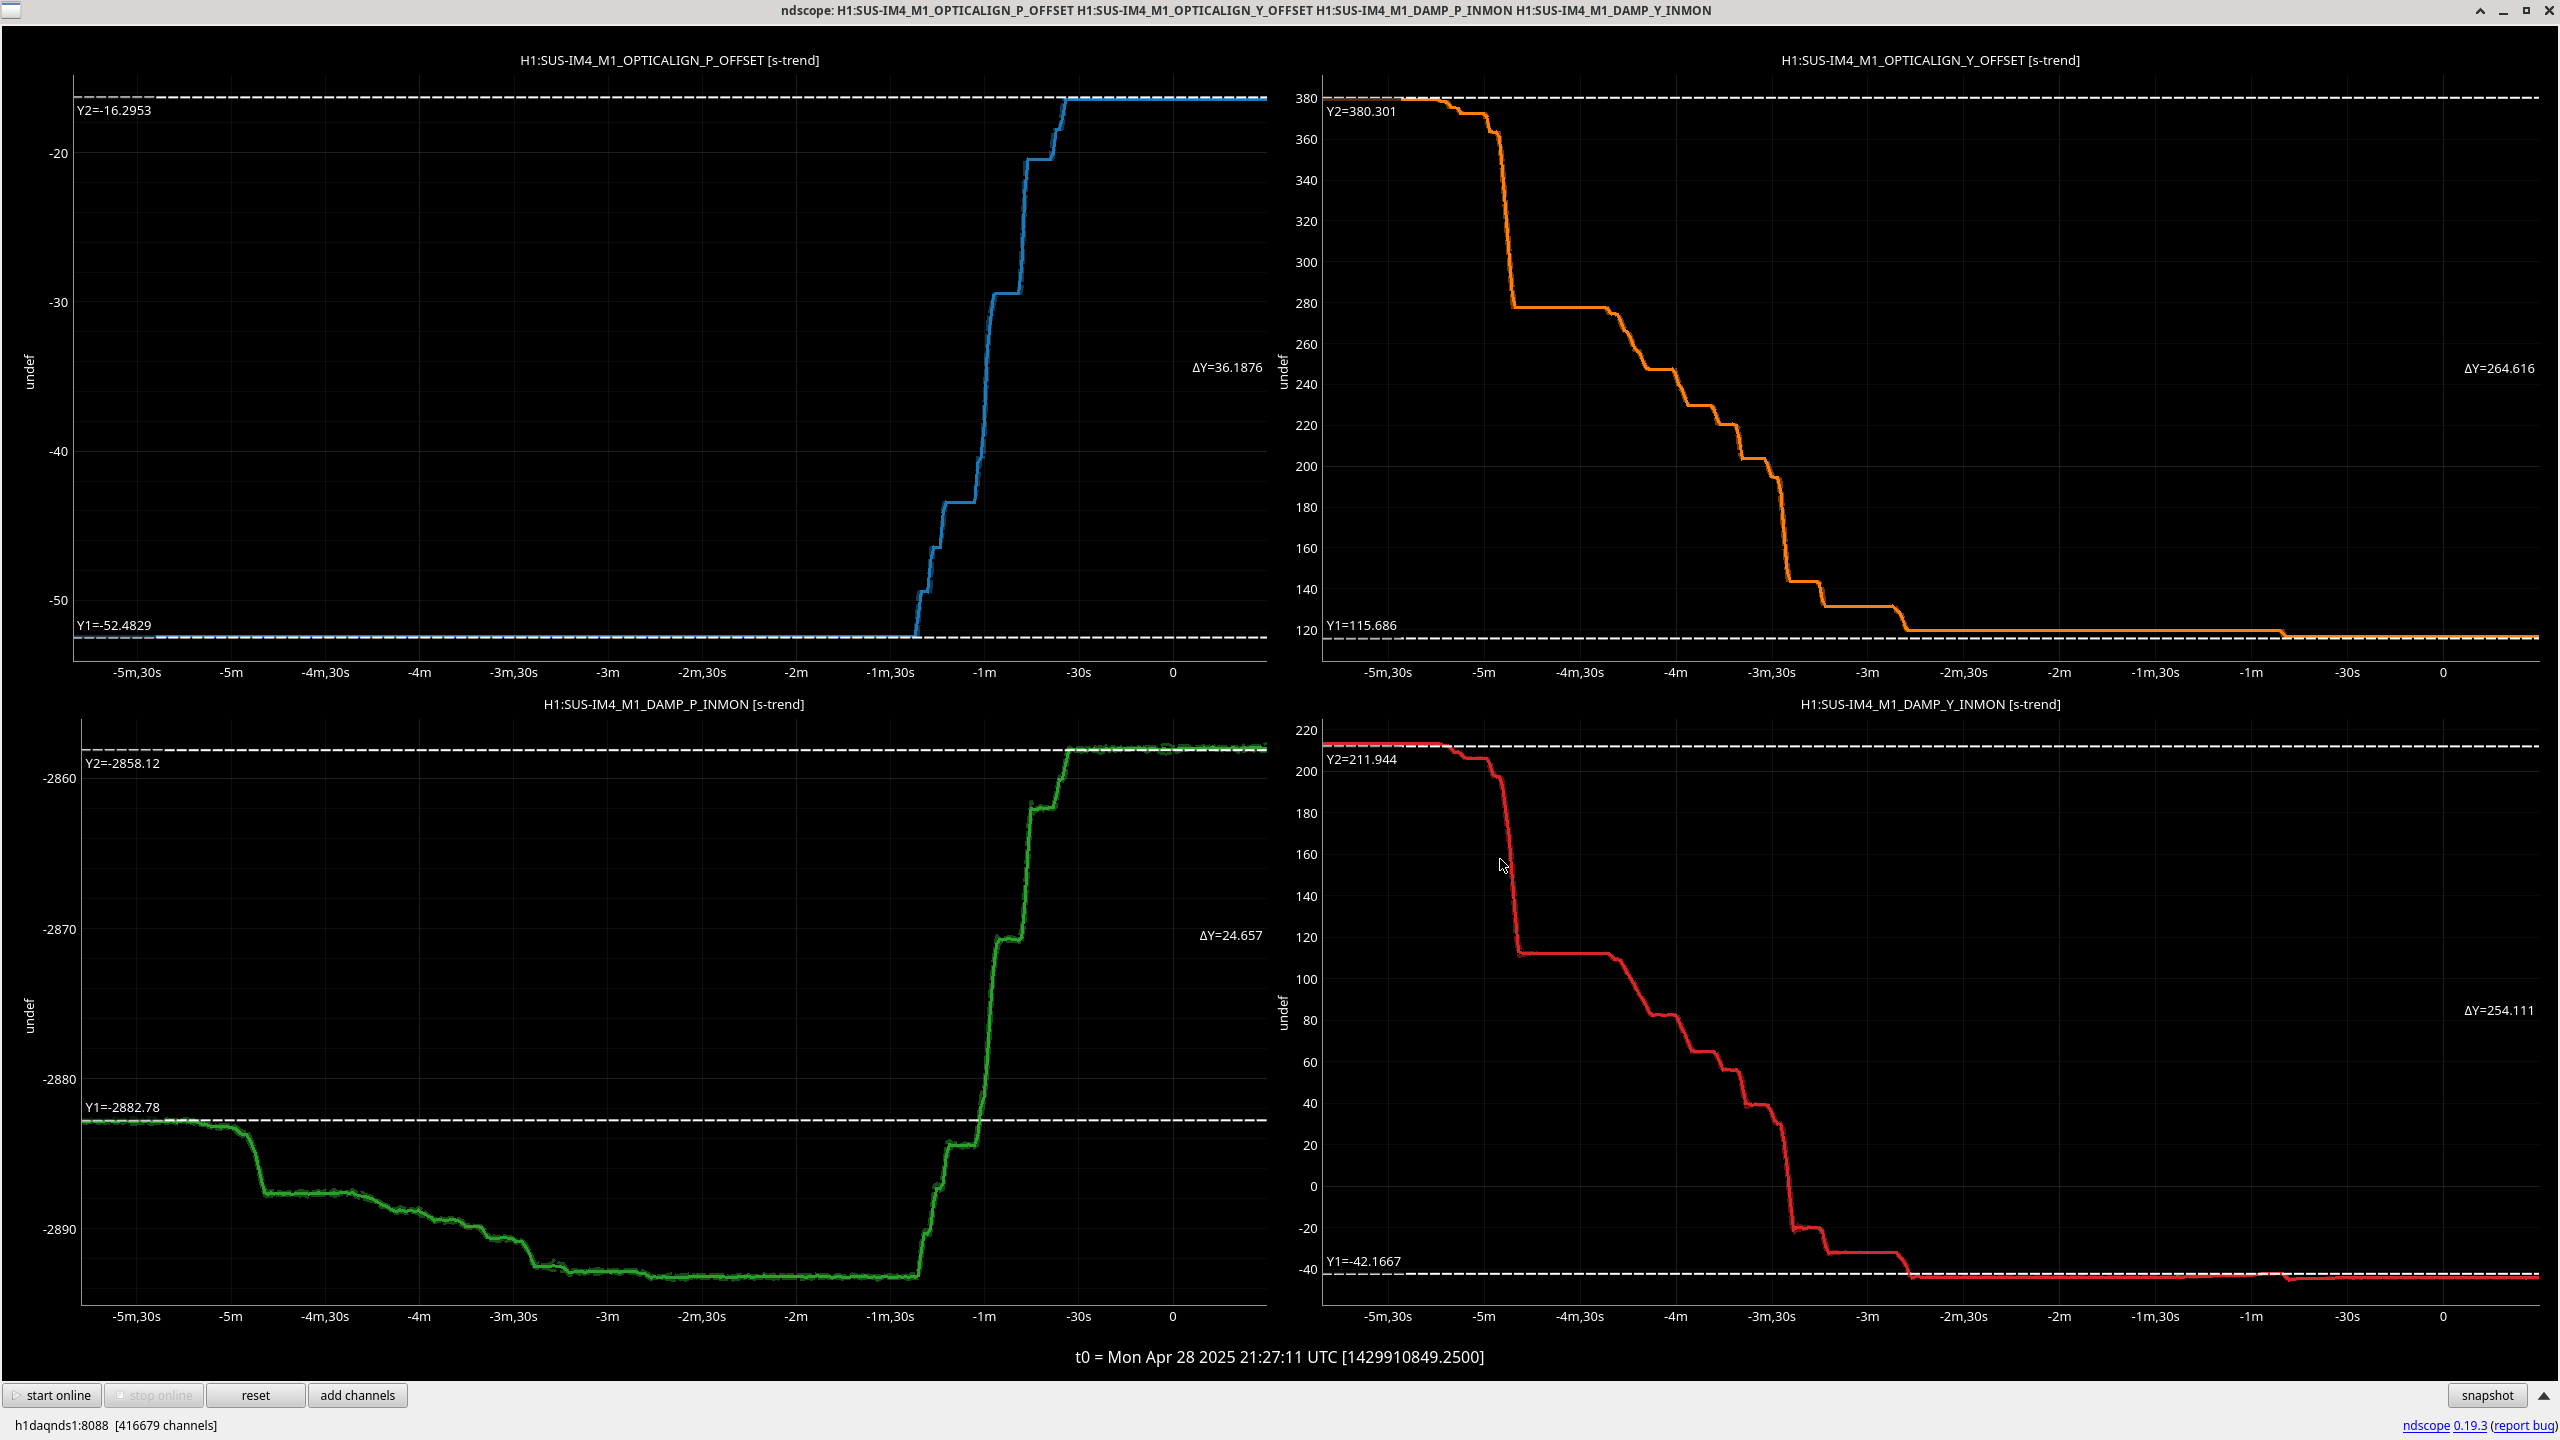
Input Arm alignment pointing for the HAM2 an HAM3 suspensions was re-checked after corner pumpdown. Since HEPI is locked currently, we wanted a time pre-venting where HEPI is also locked in order to be able to compare. I used the pointing values which follow the format: H1:SUS-{suspension}_M1_DAMP_{P or Y}_INMON.

HAM HEPIs LOCKED and CORNER (except HAM1) UNDER VACUUM - GPS TIME: 1427710424

Suspension Before Venting (urad) After Vent and Pumpdown (urad) Difference
IM1 P 3133.6 3073.2 -60.4
IM1 Y -682.8 -675.5 +7.3
IM2 P 903.2 723.0 realigned to 903.0 -180.2, -0.2
IM2 Y -211.6 -228.1 realigned to -210.9 -16.5, +0.7
IM3 P 135.5 166.8 +31.3
IM3 Y -1585.5 -1597.4 -11.9
IM4 P -2857.8 -2882.3 realigned to -2858.2 -24.5, -0.4
IM4 Y -44.6 212.5 realigned to -44.0 +257.1, +0.6
PRM P -1272.7 -1255.0 +17.7
PRM Y -31.9 -30.7 +1.2
PR2 P -398.1 -386.3 +11.8
PR2 Y -1216.6 -1208.4 +8.2
PR3 P -655.4 -657.1 -1.7
PR3 Y -166.8 -166.3 -0.5
MC1 P -646.9 -667.8 -20.9
MC1 Y -1381.0 -1378.2 +2.8
MC2 P 785.6 737.6 -48
MC2 Y -383.9 -382.7 +1.2
MC3 P 451.4 460.1 +8.7
MC3 Y -179.2 -179.3 -0.1

Most of these are very close and do not need to be adjusted, with only 2 being different by over 100 microradians. 45% of values have less than 10urad discrepancy. 85% have less than 50urad discrepancy. After speaking with TJ, I realigned two most egregious ones IM4 Y, and IM2 P to their pre-vent (HEPI Locked) values using the OPTICALIGN sliders. Screenshots below of plots used further show the pointing as well as the old to new value differences of the two suspensions that were aligned. After alignment, all values are under 100urad discrepancy and 95% are under 50urad difference.

Images attached to this report
H1 CDS
david.barker@LIGO.ORG - posted 14:09, Monday 28 April 2025 - last comment - 07:35, Tuesday 29 April 2025(84152)
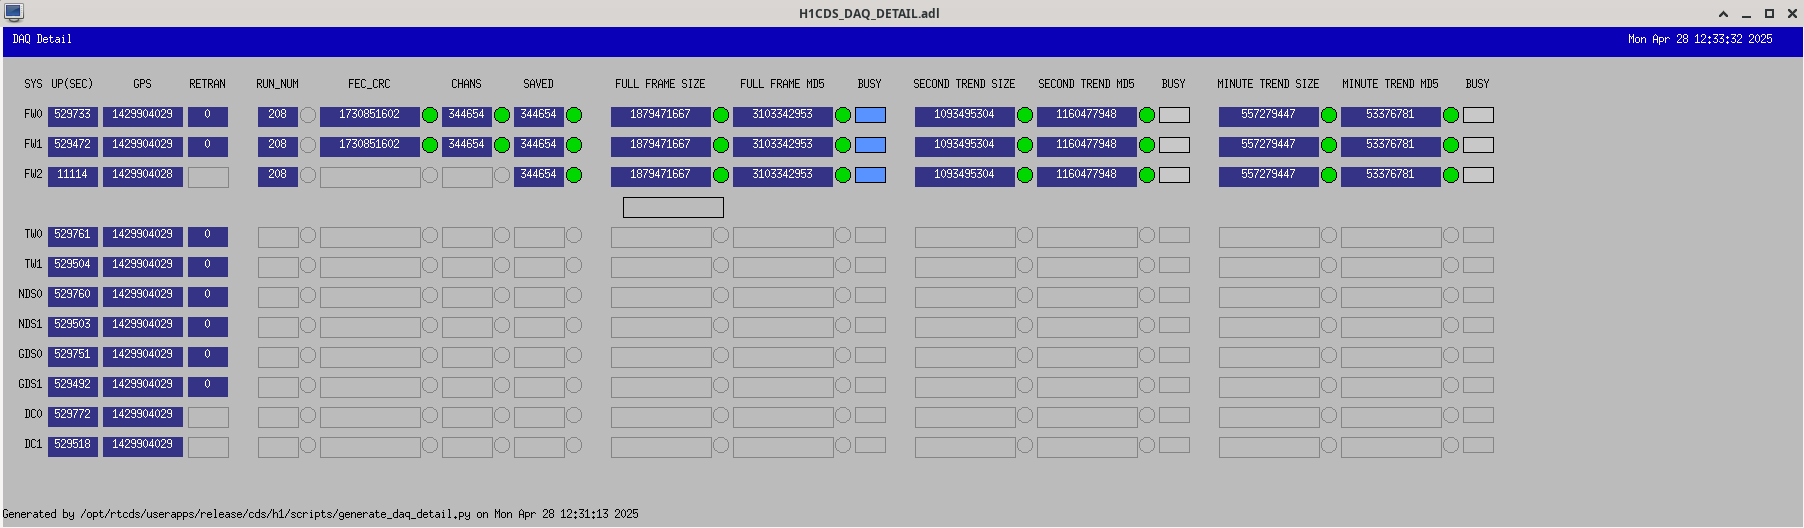
Added progress bars to DAQ Detail MEDM

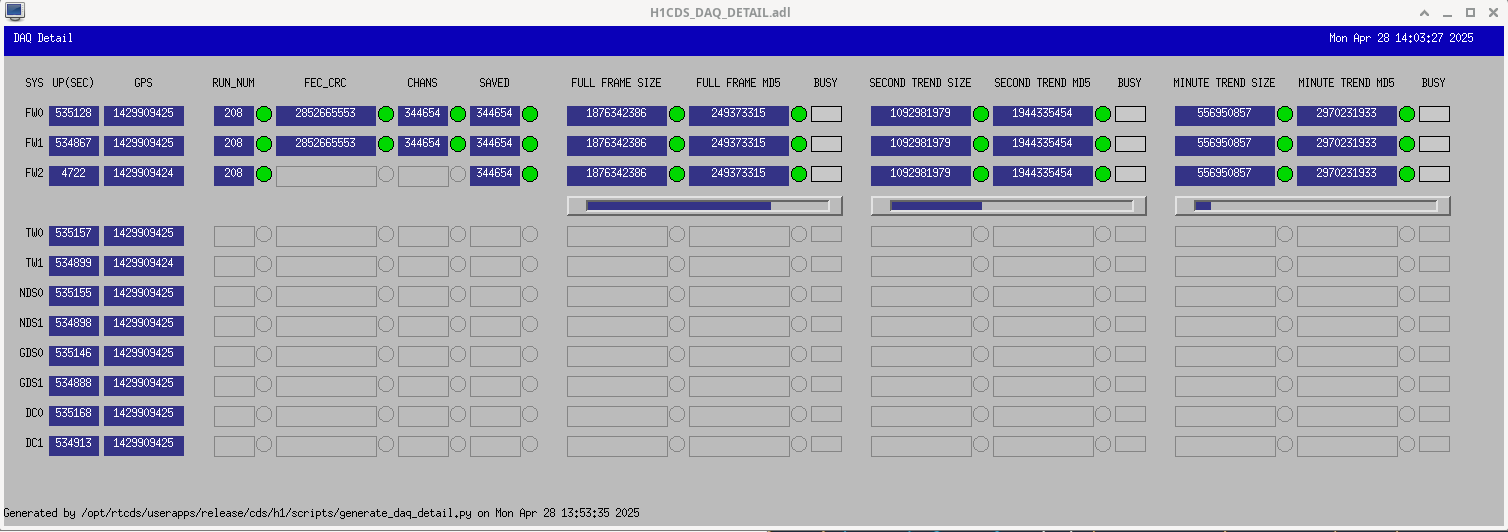
Jonathan, Dave:

The DAQ detail MEDM has been updated to show FW2's progress within the 64 second cycle for full frames, 600 second cycle for second trends and 3600 second cycle for minute frames.

When each progress bar reaches the end, the next data accumulation phase starts and the frame file writing begins.

A new run_number column has been added, along with a LED stack checking these all agree with each other.

The retransmission column has been removed.

Images attached to this report
Comments related to this report
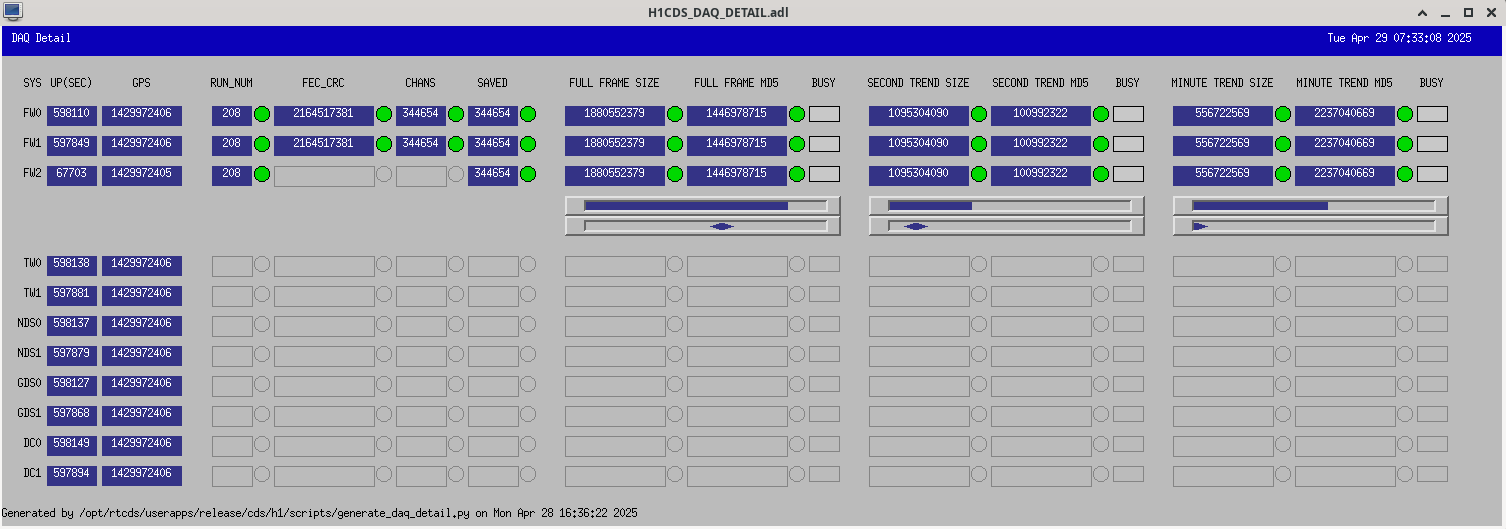
david.barker@LIGO.ORG - 07:35, Tuesday 29 April 2025 (84162)

As a test, I've added a second bar for FW2 showing the time it took to write the previous frame as a diamond. If the time to write exceeds the bar's span, e.g. > 64 seconds for a full frame, I have verified that a half diamond is shown on the right margin.

Images attached to this comment
LHO VE
jordan.vanosky@LIGO.ORG - posted 13:02, Monday 28 April 2025 (84151)
Morning Purge Air Checks 4-28-25

Morning dry air skid checks, water pump, kobelco, drying towers all nominal.

Dew point measurement at HAM1 , approx. -42C

Images attached to this report
H1 DAQ
jonathan.hanks@LIGO.ORG - posted 12:42, Monday 28 April 2025 (84150)
WP 12469 cont., Identical raw, second trend, and minute trend frames between new frame writer and old frame writers
h1daqfw2 is now producing identical raw, second trend, and minute trend frames to h1daqfw[01].  The issues mentioned in https://alog.ligo-wa.caltech.edu/aLOG/index.php?callRep=84132 have been resolved.

There are times where we expect there to be mismatches.  These are generally when data is missing, the daqd may replay recent data, where the new frame writer will write zeros.

We will continue tests on the frame writer, including software updates.  The next test is to watch the behavior of h1daqfw2 when h1daqfw0 & h1daqfw1 have a restart.  It is designed to automatically adjust its channel list and have no gaps in the frames and need no restart to accommodate the changes.
Images attached to this report
H1 ISC (VE)
camilla.compton@LIGO.ORG - posted 11:46, Monday 28 April 2025 - last comment - 17:09, Monday 28 April 2025(84149)
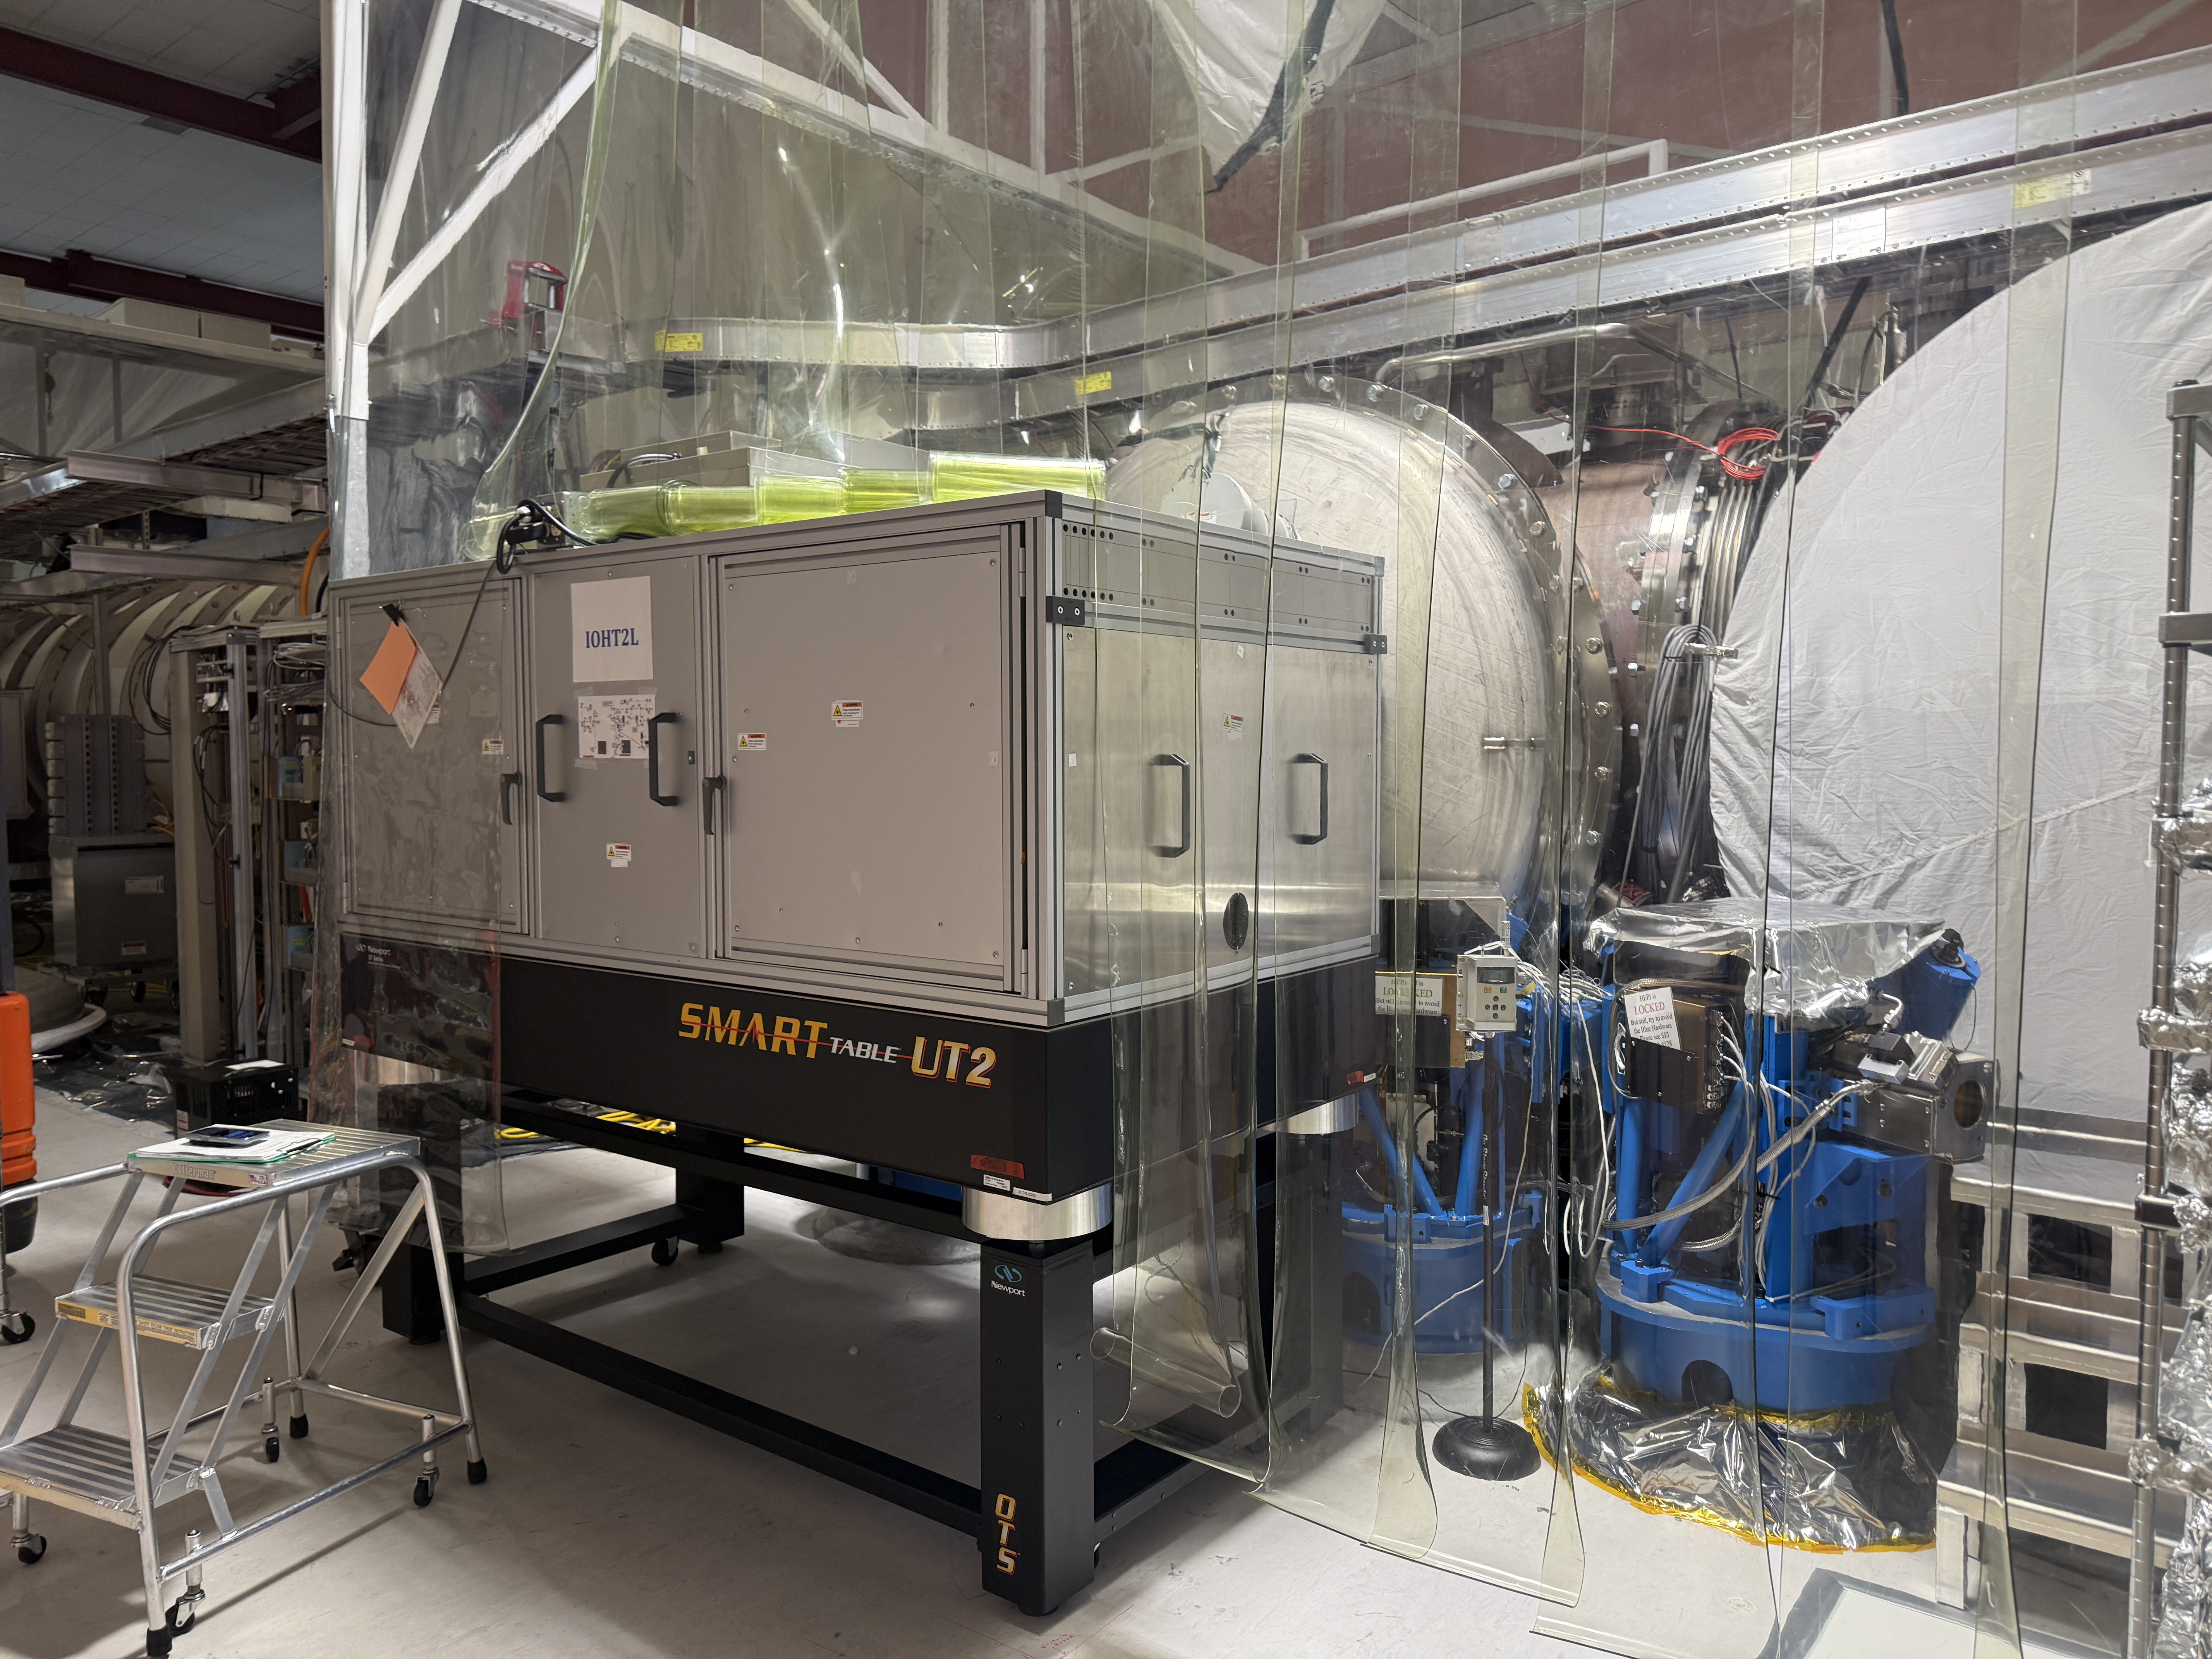
IOT2L moved back into place next to HAM2, bellows reattached, guillotines removed.

Randy, Mitchell, Tyler, TJ, Betsy, Oli, Camilla. WP#12444WP#12496, moved away from HAM2 in 83686.

We attempted to move IOT2L back into place on Friday but the cleanroom had been moved into the way of the final table position for ISI work and one of the casters of the table was stripping rubber off one side and kept rubbing so we paused.

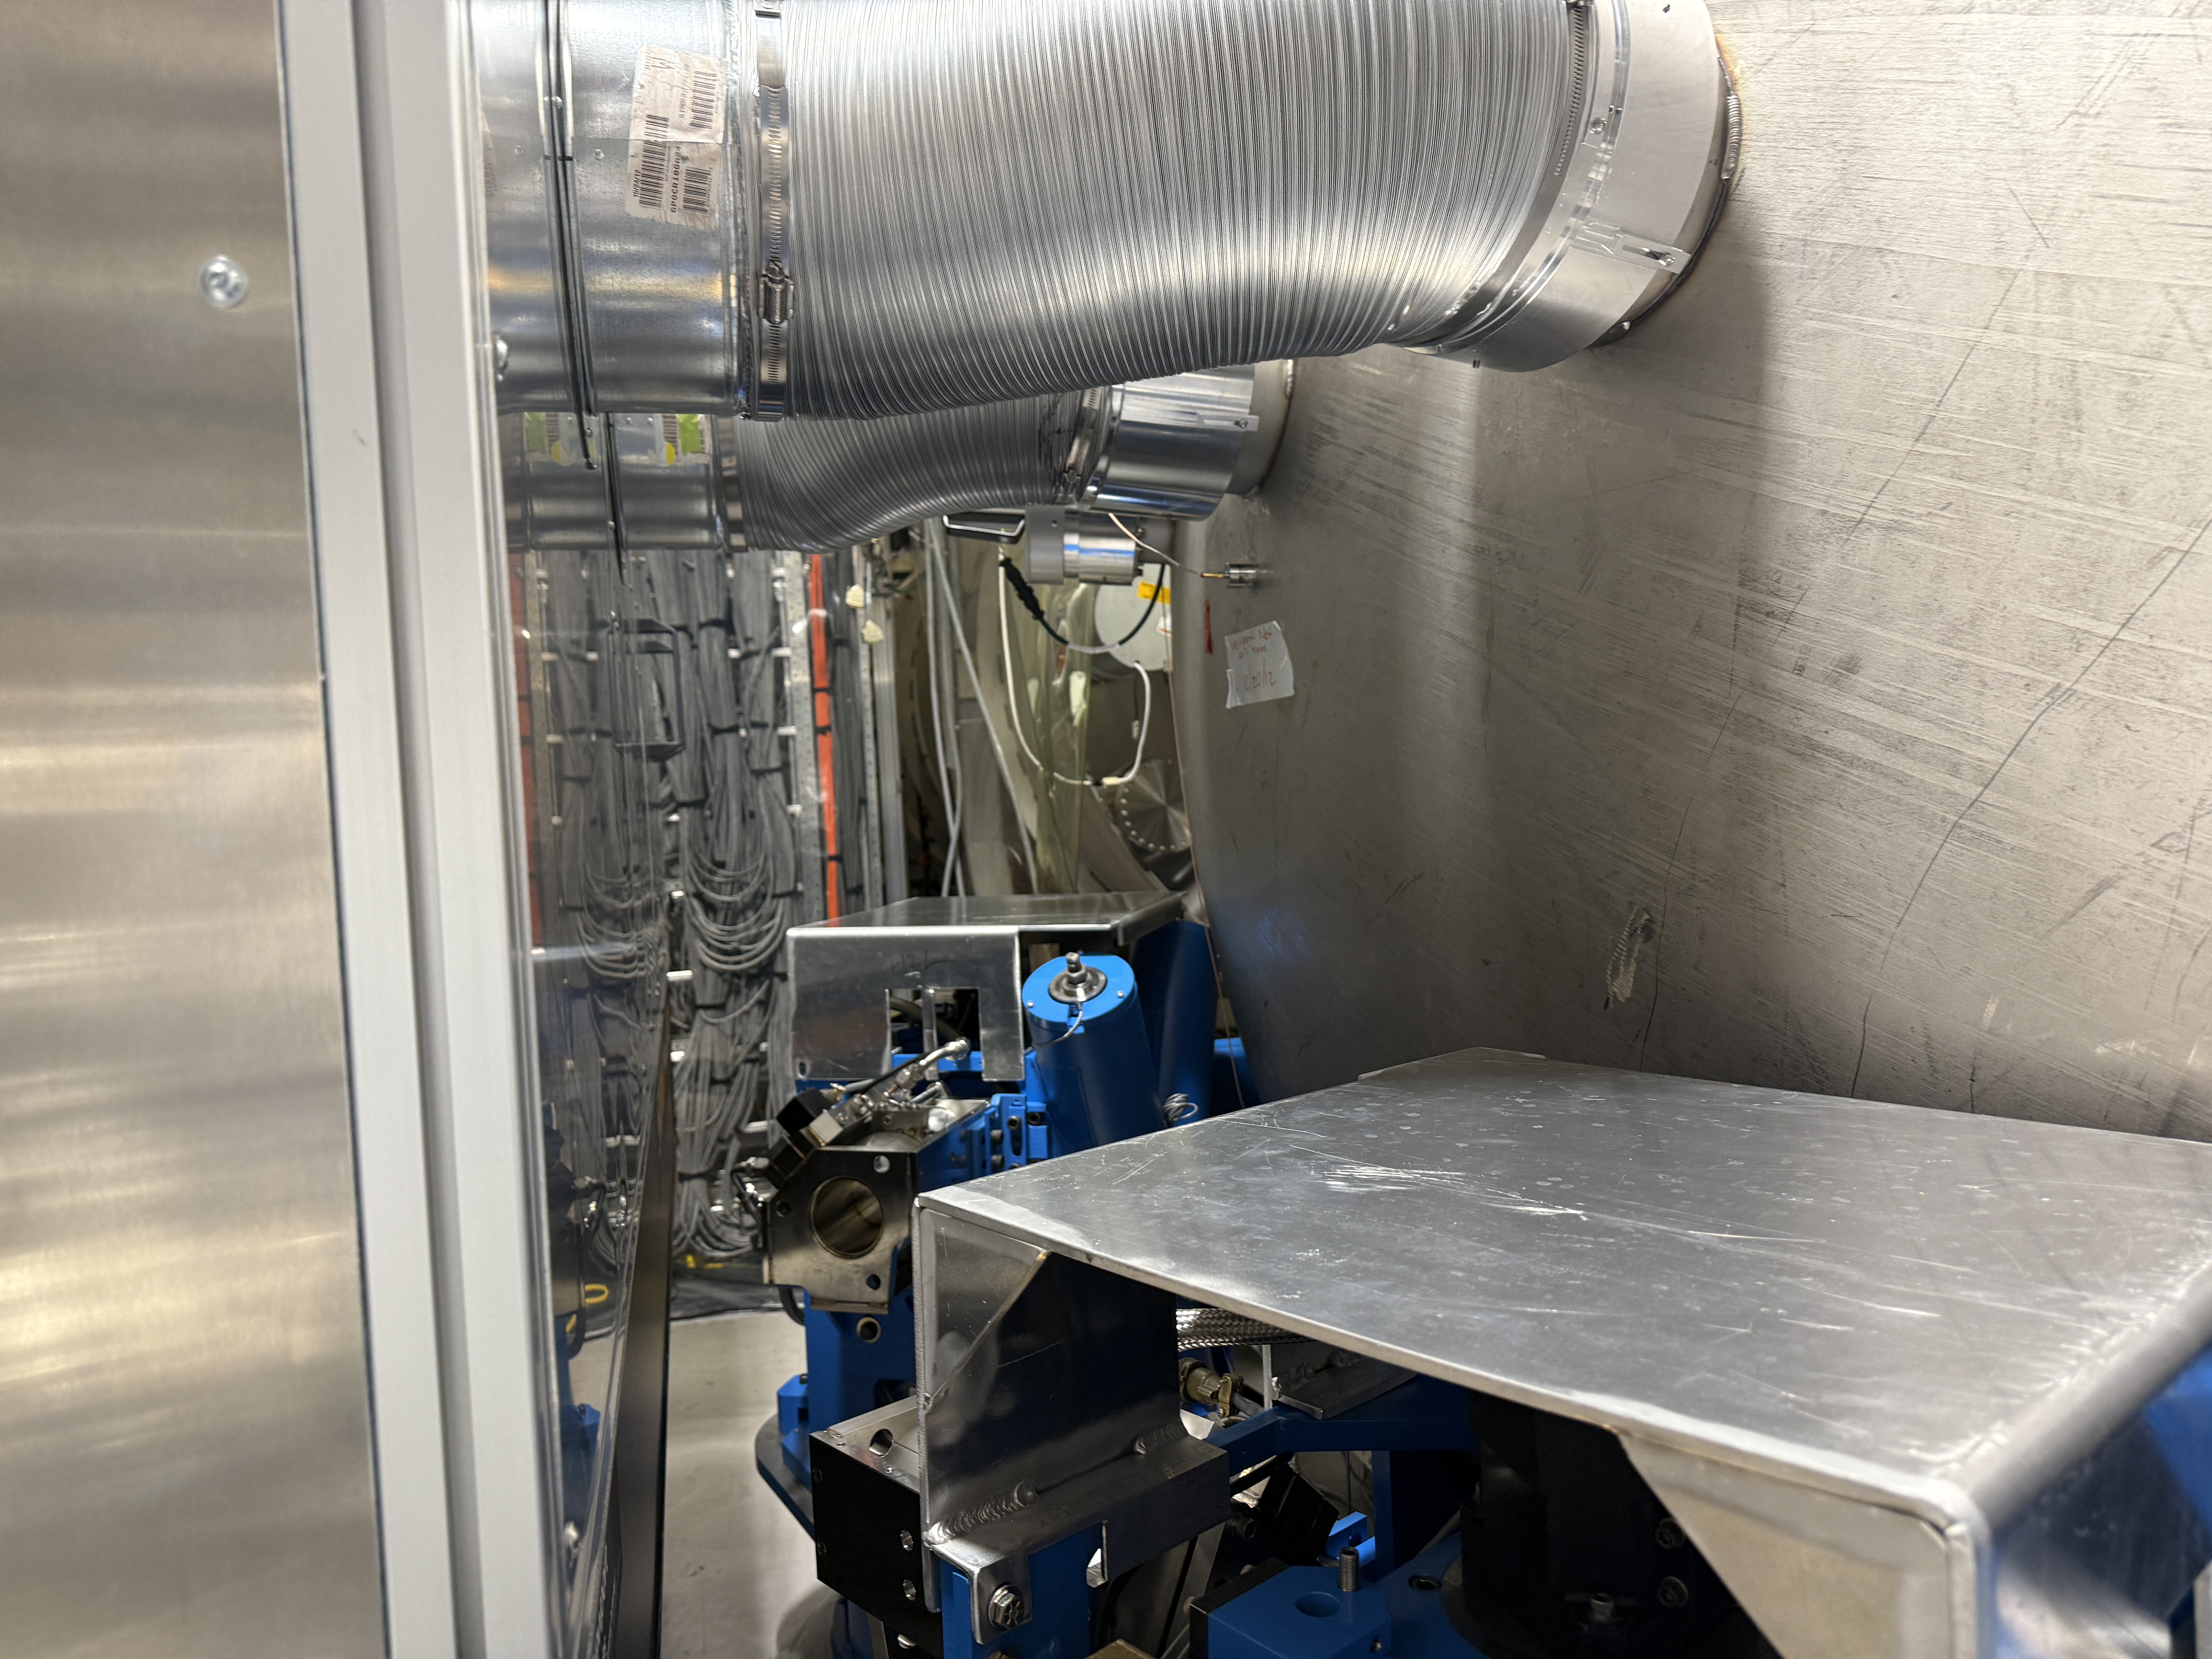
This morning the cleanroom was moved out of the way (+X by ~1-2 feet) and then Randy finished moving IOT2L into place with the help of the forklift. Once IOT2L's corners were over the markings made in 83296 and the height was correct, we re-attached the bellows, removed the guillotines and replaced the guillotine slot covers. Photos attached. The HAM2 VP furthest to -Y never had a guillotine slot cover, so one was added. 

Images attached to this report
Comments related to this report
filiberto.clara@LIGO.ORG - 17:09, Monday 28 April 2025 (84157)

Cabling to IOT2L completed.

F. Clara, M. Pirello

Images attached to this comment
H1 DetChar (DetChar)
ansel.neunzert@LIGO.ORG - posted 15:08, Thursday 23 January 2025 - last comment - 15:07, Wednesday 07 May 2025(82320)
Relationship between violin mode height and narrow spectral artifact contamination, revisited

Summary

Q: What is the relationship between the strength of violin mode ring-ups and the number of narrow spectral artifacts around the violin modes? Is there a clear cut-off at which the contamination begins?

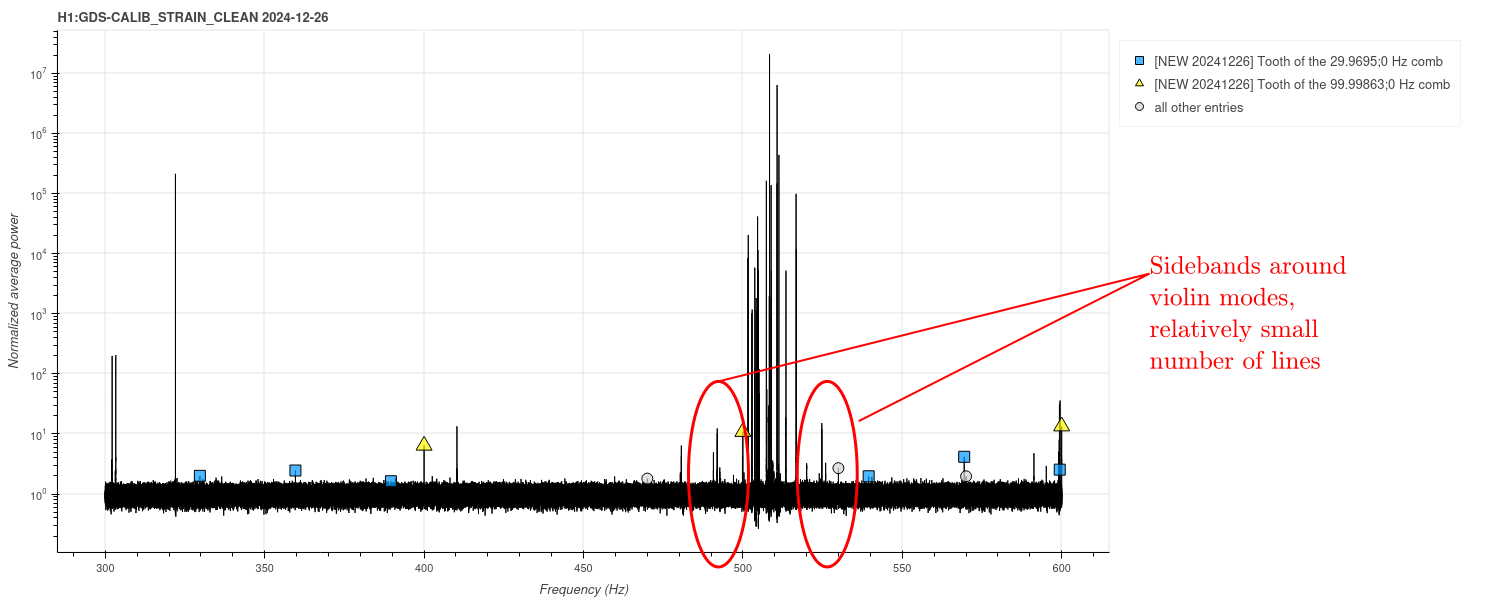
A: The answer depends on the time period analyzed. There was an unusual time period spanning from mid-June 2023 through (very approximately) August 2023. During this time period, the number lines during ring-ups was much greater than in the rest of O4, and the appearance of the contamination may have begun at lower violin mode amplitudes.

What to keep in mind when looking at the plots.

1. These plots use the Fscan line count in a 200-Hz band around each violin mode region, which is a pretty rough metric, and not good for picking up small variations in the line count. It's the best we've got at the moment, and it can show big-picture changes. But on some days, contamination is present, but only in the form of ~10 narrow lines symmetrically arranged around a high violin mode peak. (Example in the last figure, fig 7) This small jump in the line count may not show up above the usual fluctuations. However, in aggregate (over all of O4) this phenomenon does become an issue for CW data quality. These "slight contamination" cases are also particularly important for answering the question "at what violin mode amplitude does the contamination just start to emerge?" In short, we shouldn't put too much faith in this method for locating a cut-off problematic violin mode height.

2. The violin modes may not be the only factor in play, so we shouldn't necessarily expect a very clear trend. For example, consider alog 79825 . This alog showed that at least some of the contamination lines are violin mode + calibration line intermodulations. Some of them (the weaker ones) disappeared below the rest of the noise when the violin mode amplitude decreased. Others (the stronger ones) remained visible at reduced amplitude. Both clusters vanished when the temporary calibration lines were off. If we asked the question "How high do the violin modes need to be...?" using just these two clusters, we'd get different apparent answers depending on (a) which cluster we chose to track (weak or strong), and (b) which time period we selected (calibration lines on or off). This is because at least some of the contamination is dependent on the presence & strength of a second line, not a violin mode.

Looking at the data

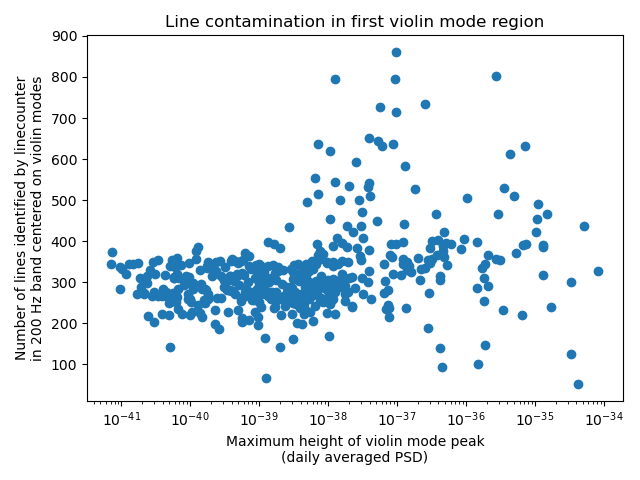
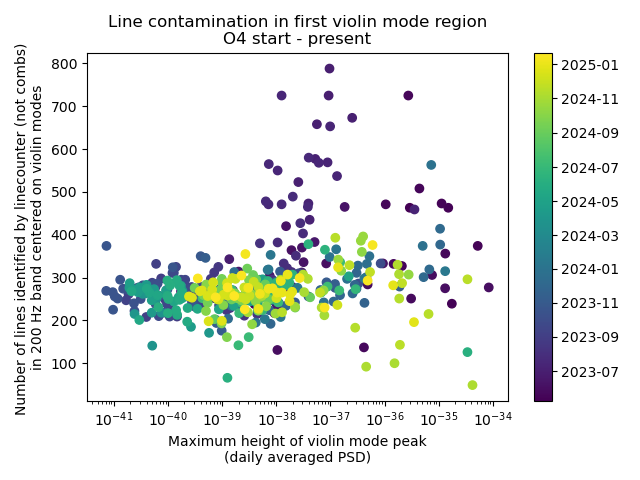
First, let's take a look at a simple scatter plot of the violin mode height vs the number of lines identified. This is figure 1. It's essentially an updated version of the scatter plots in alog 71501. It looks like there's a change around 1e-39 on the horizontal axis (which corresponds to peak violin mode height).

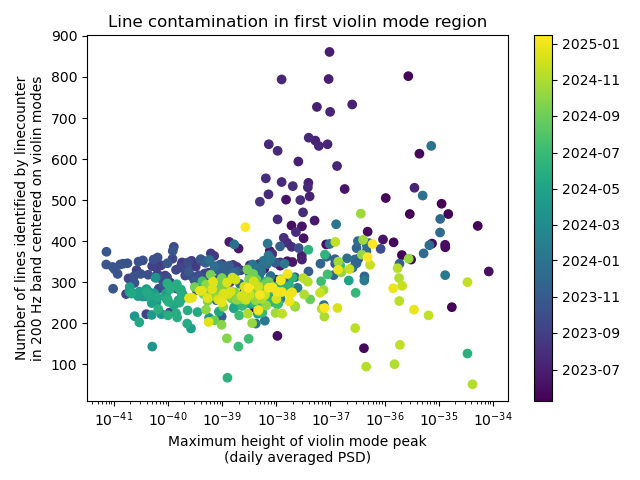
However, when we add color-coding by date (figure 2), new features can be seen. There's a shift at the left side of the plot, and an unusual group of high-line-count points in early O4.

The shift at the left side of the plot is likely due to an unrelated data quality issue: combs in the band of interest. In particular, the 9.5 Hz comb, which was identified and removed mid O4, contributes to the line count. Once we subtract out the number of lines which were identified as being part of a comb, this shift disappears (figure 3).

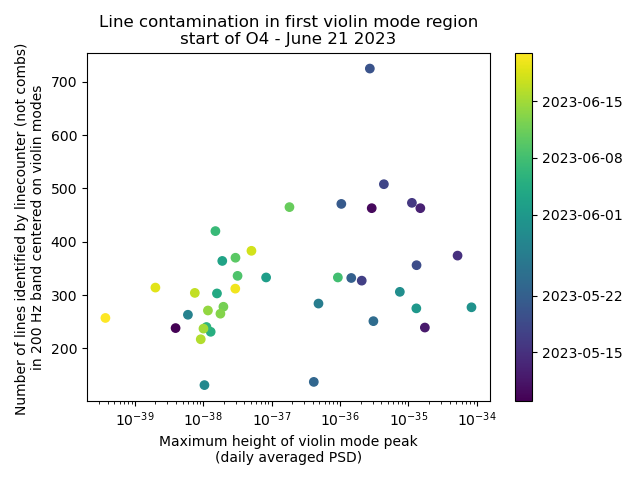
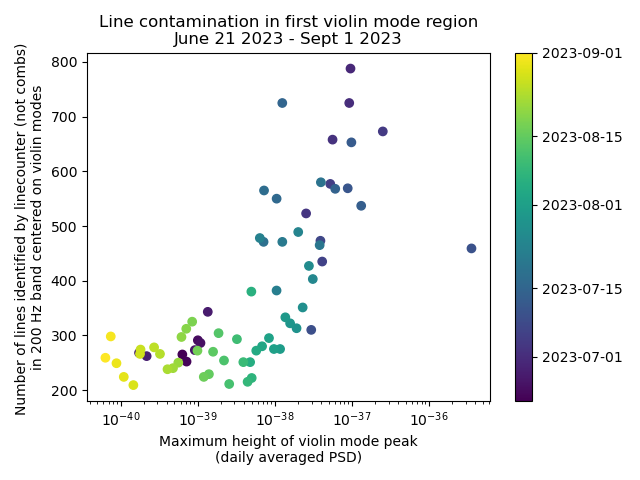
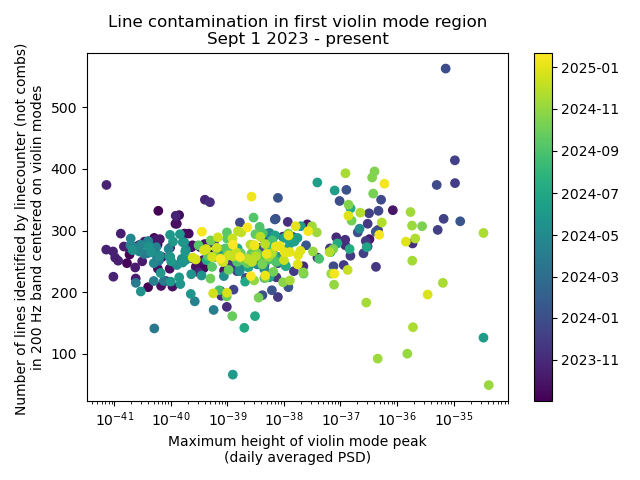
With the distracting factor of comb counts removed, we still need to understand the high-line-count time period. This is more interesting. I've broken the data down into three epochs: start of O4 - June 21, 2023 (figure 4); June 21, 2023 - Sept 1 2023 (figure 5); and Sept 1 2023 - present (figure 6). As shown in the plots, the middle epoch seems notably different from the others.

These dates are highly approximate. The violin mode ring-ups are intermittent, so it's not possible to pinpoint the changes sharply. The Sept 1 date is just the month boundary that seemed to best differentiate between the unusual time period and the rest of O4. The June 21 date is somewhat less arbitrary; it's the date on which the input power was brought back to 60W (alog 70648), which seems a bit suspicious. Note that, with this data set, I can't actually differentiate between a change on June 21 and a change (say) on June 15th, so please don't be misled by the specificity of the selected boundary.

Images attached to this report
Comments related to this report
kiet.pham@LIGO.ORG - 13:53, Friday 18 April 2025 (83997)DetChar

Kiet, Sheila

We recently started looking into the whether nonlinearity of the ADC can contribute to this by looking at the ADC range that we were using in O4a. 
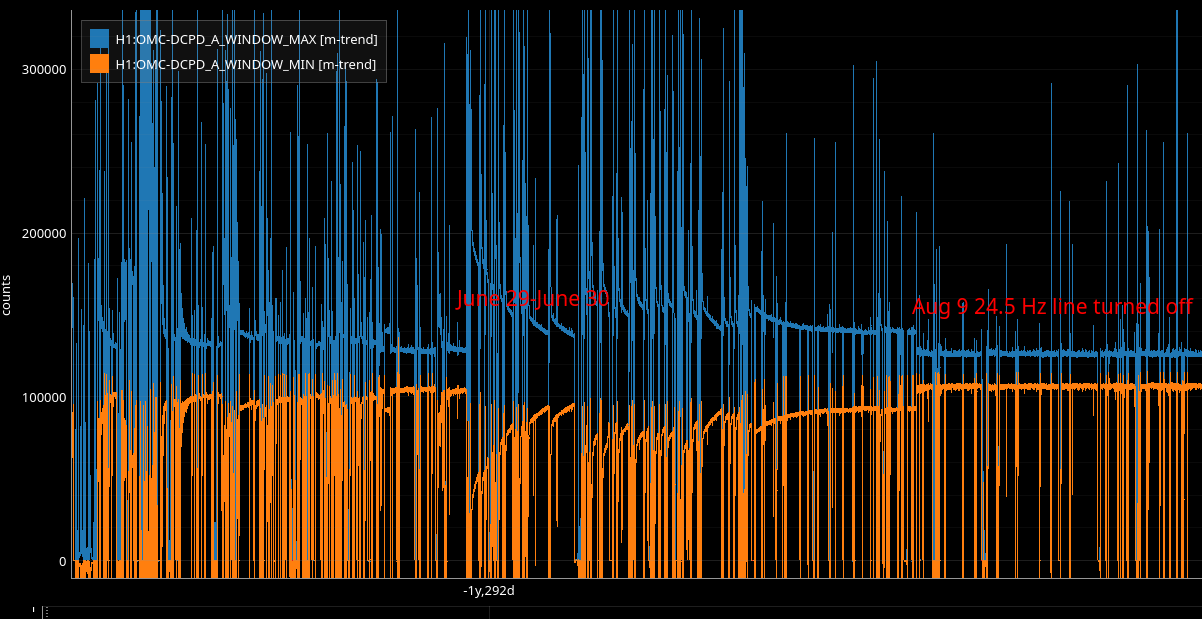
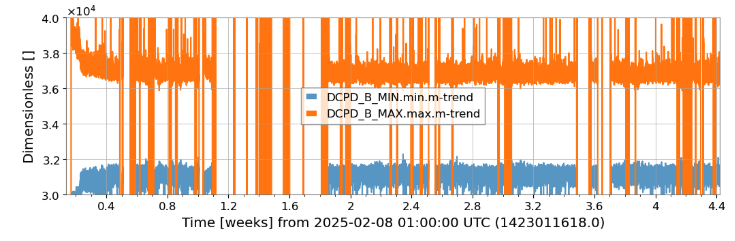
They are showed in the H1:OMC-DCPD_A_WINDOW_{MAX,MIN} that sum the 4 DC photodiodes (DCPD). They are 18 bits DCPD, so that channel should saturate at 4* 2^17 ~520,000 counts. 

Now there are instances that agree with Ansel report when there are violin mode ring up that we can see a shift in the count baseline.

Jun 29 - Jun 30, 2023 when the baseline seems to shift up and stay there for >1 months, Detchar summary page show significant higher violin mode ring up in the usual 500-520Hz region as well as the nearby region (480-500 Hz) 

Oct 9, 2023 is when the temporary calibration lines are turned off 72096, the down shift happened right after the lines are off (after 16:40 UTC)

During this period, we were using a~5% of the ADC range (difference between max and min channel divided by the total range - 500,000 to 500,000 counts), and it went down to ~2.5 % once the shift happenned on Oct 9, 2023. We want to do something similar with Livingston, using the L1:IOP-LSC0_SAT_CHECK_DCPD_{A,B}_{MAX,MIN} channels to see the ADC range and the typical count values of those channels.

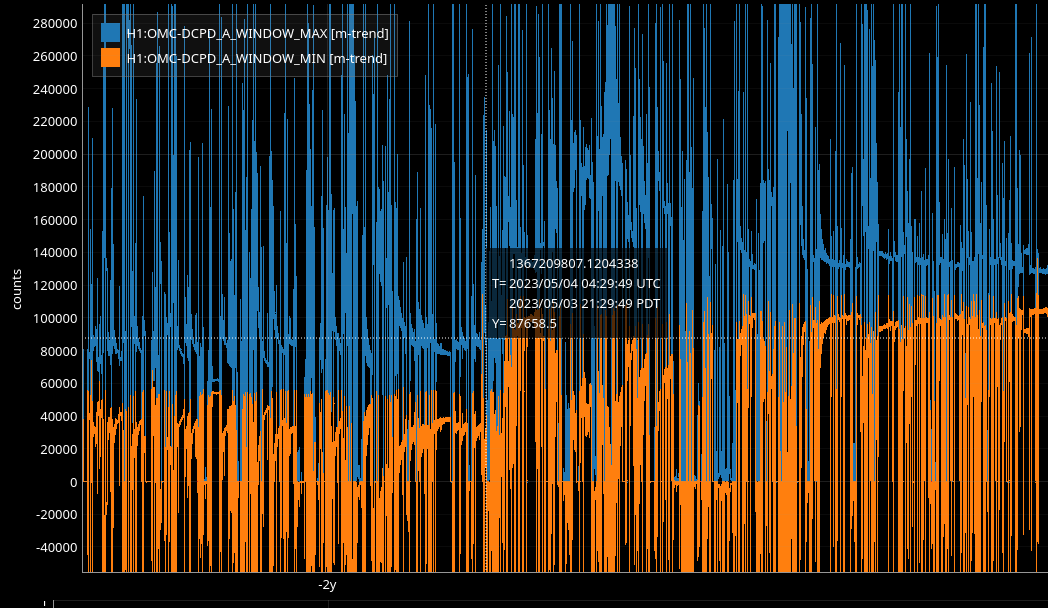
Another thing for us to maybe take a closer look is the baseline count value increase around May 03 2023. There was a change to the DCPC total photocurrent during that time (69358). Maybe worth checking if there is violin mode contaimination during the period before that. 


Images attached to this comment
kiet.pham@LIGO.ORG - 10:28, Tuesday 29 April 2025 (84136)DetChar

Kiet, Sheila

More updates related to the ADC range investigation: 

  • ADC ranges comparison between Hanford and Livingston: 
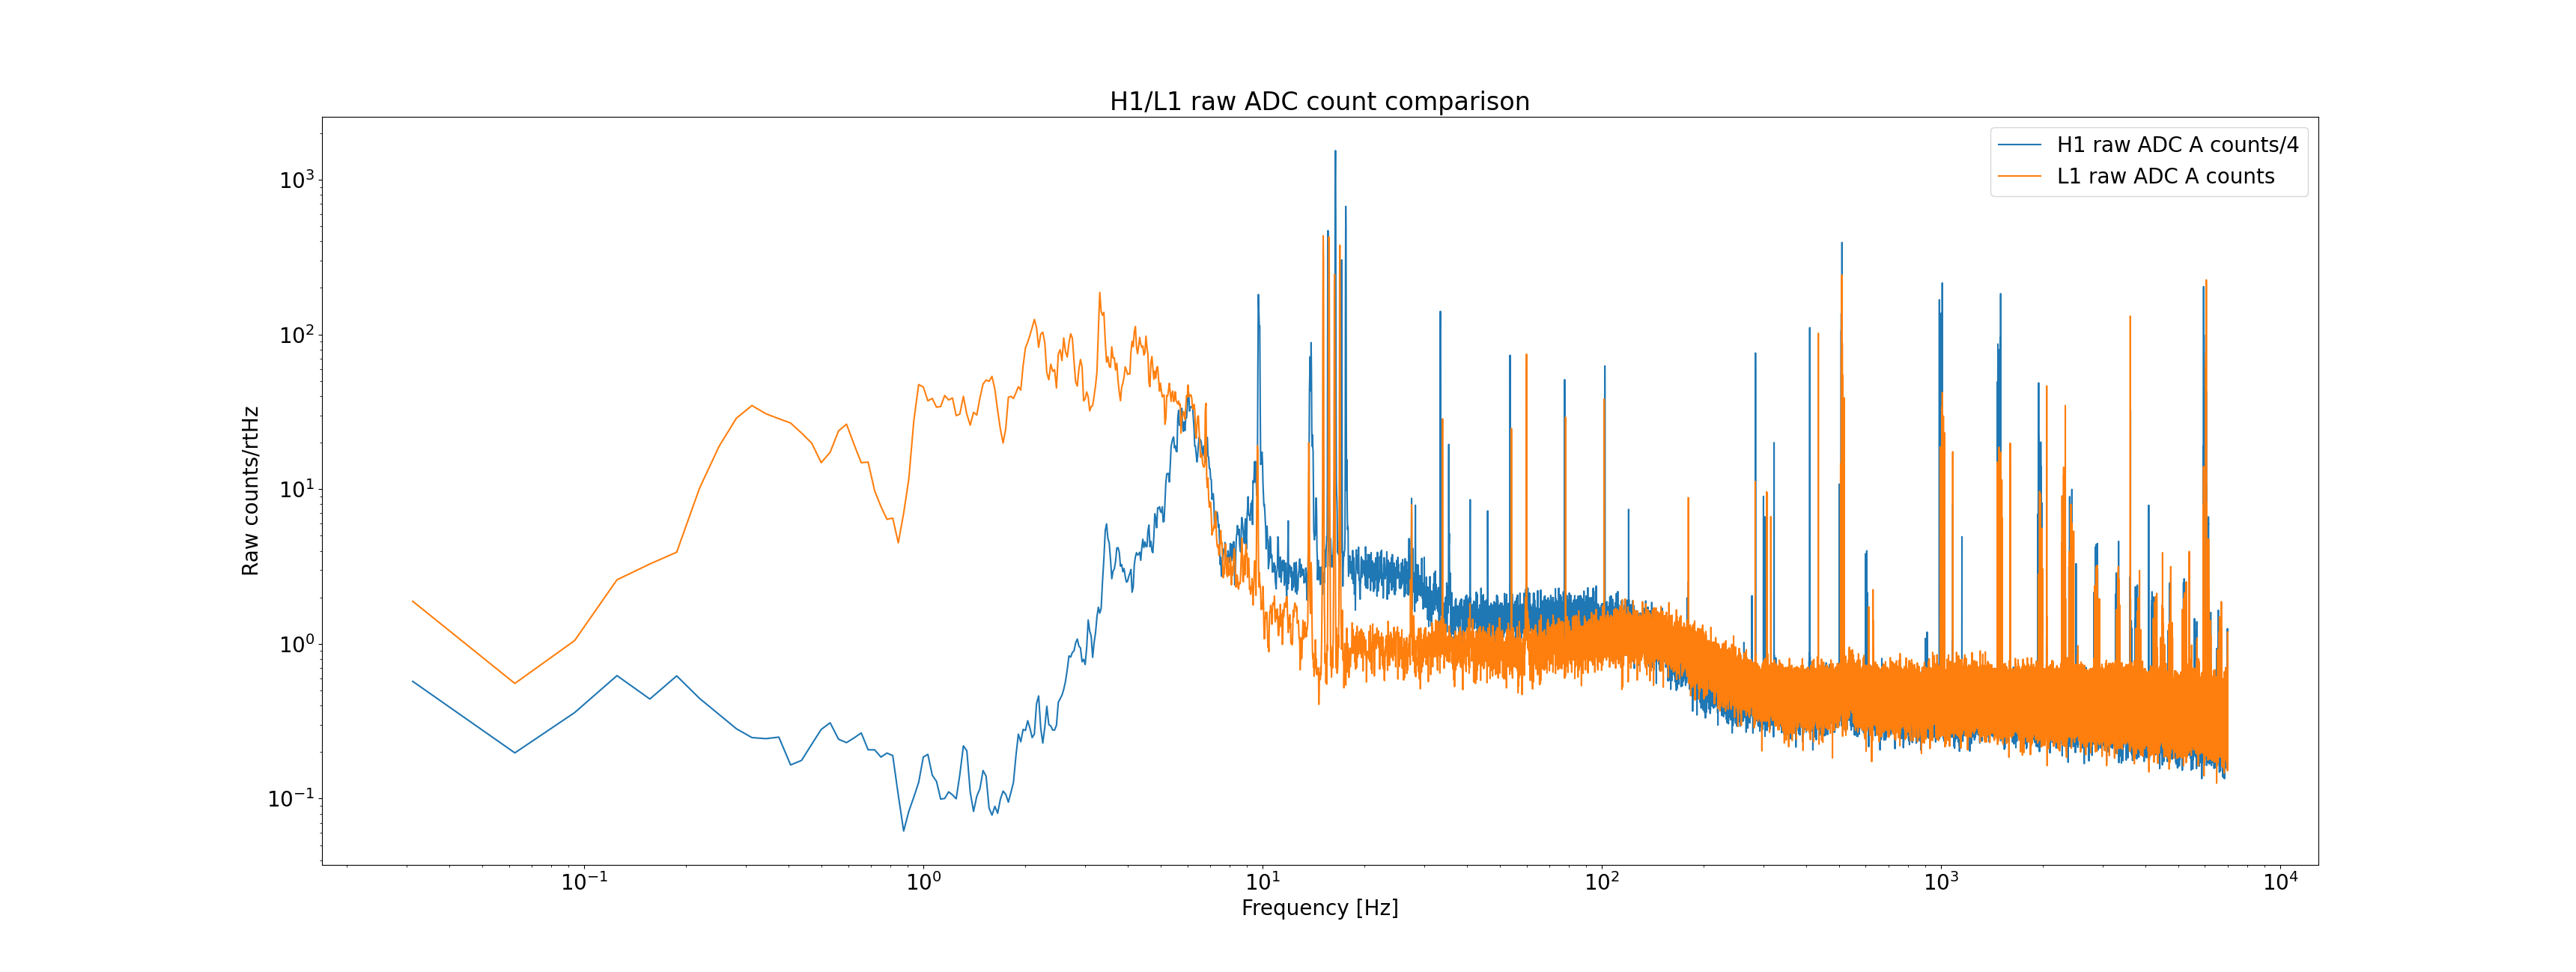
    • At Livingston we are using the L1:IOP-LSC0_SAT_CHECK_DCPD_{A,B}_{MAX,MIN} channels, which were not turned on until 1398035799; these channels saturate at 2^17 counts. 
    • At Hanford we are using the H1:OMC-DCPD_A_WINDOW_{MAX, MIN}, these channels saturate at 4 * 2^17 counts as they are sum over 4 DCPD
    • We looked through the data in Feb 2025 when the violin modes at Livingston were somewhat higher than usual. 
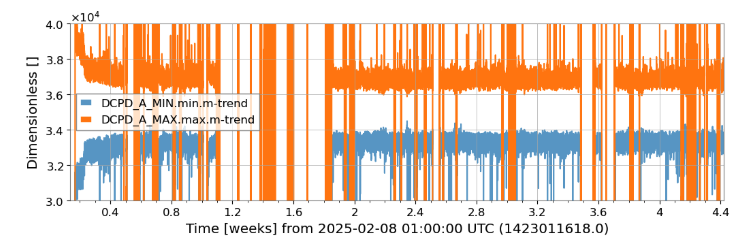
    • The range being used in compatible with Hanford (2-4%), and the count values are also similar as LHO counts/4 and LLO counts are in +- 5000 counts of each others.
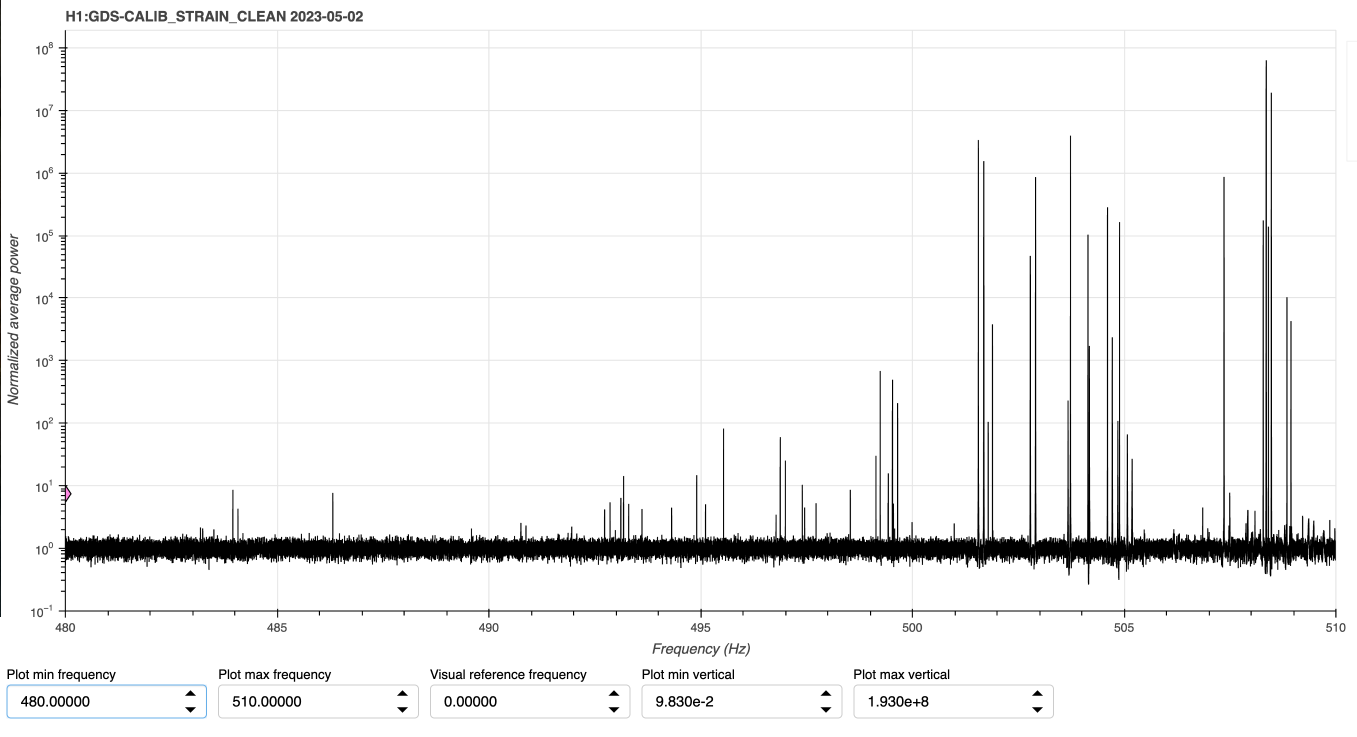
  • Comparing the comtaimination before the DARM offset change in ER15:
    • We saw hint of contaimination even before the change (Using Fscan spectrum of May 2nd) 

Further points + investigations:

  • Ansel pointed out that it was odd to have a significant shift in the baseline count value + range when the temporary calibration lines turned off as these calibration lines were not that different in height than other calibration lines (see plot in the Alog 83997)
  • Joseph from LLO gave us a spectrum comparison between H1, L1 raw ADC count, there is a notable difference in the higher order violin modes
    • To do: looking to periods of when the both (1st and 2nd) violin modes ring up and periods of only the first violin mode ring up to see the contaimination caused by the 2nd mode or higher down mixing
  • Evan pointed out that during the period of high contaimination (June 30th - Aug 9th; 2023), the range stayed between 7 - 20%; and LHO in general seemed to have higher rate of saturation + intermitten increase of the ADC range than LLO. 
    • To do: Selecting the periods of stable ADC range in LHO data, and run the average spectrum over those periods to see the level of contaimination, assessing the contribution of the periods with increase ADC range. 

       
Images attached to this comment
kiet.pham@LIGO.ORG - 15:07, Wednesday 07 May 2025 (84305)DetChar

Kiet, Sheila

Following up on the investigation into potential intermixing between higher-order violin modes down to the ~500 Hz region:

The Fscan team compiled a detailed summary of the daily maximum peak height (log10 of peak height above noise in the first violin mode region) for the violin modes near 500 Hz (v1) and 1000 Hz (v2). They also tracked line counts in the corresponding frequency bands: 400–600 Hz for v1 and 900–1000 Hz for v2. This data is available in the Google spreadsheet (LIGO credentials required).

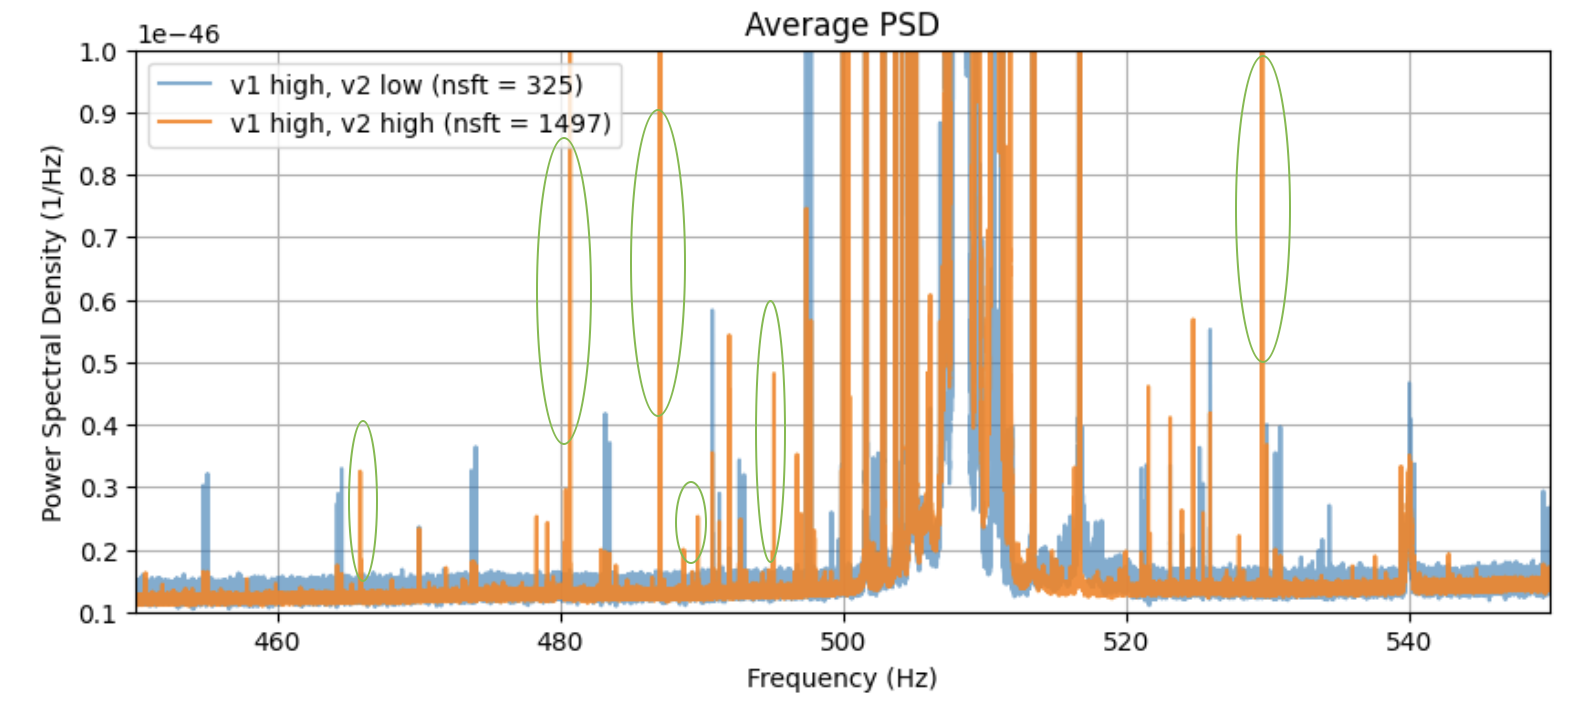
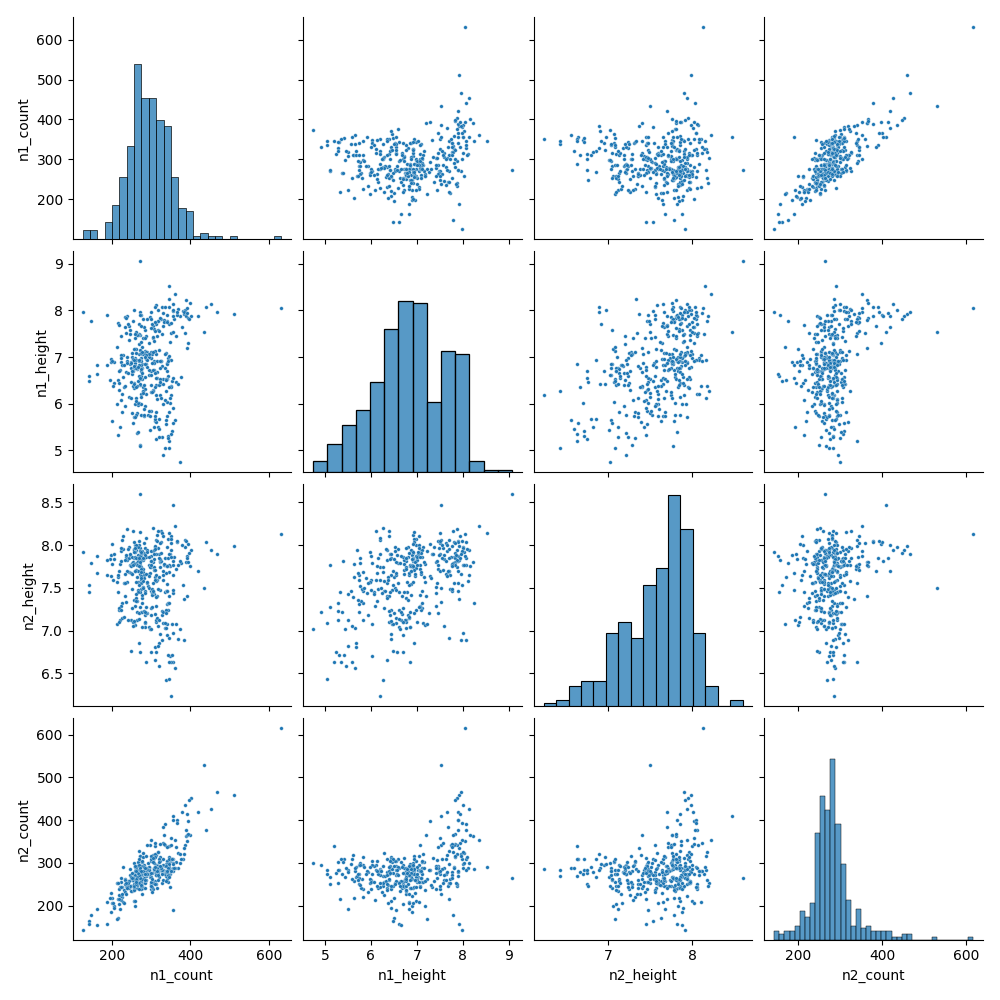
  • We identified dates when both violin modes were elevated (n1_height > 7; n2_height > 8) and when only the fundamental mode was elevated (n1_height > 7; n2_height < 8). For each case, we computed average PSDs using an FFT length of 1800 s. The study period spans from August 10, 2023, to January 14, 2025, starting when ADC counts stabilized after the temporary calibration lines at 24.4 and 24.5 Hz were turned off (see alog  72096)
    • The psds comparisons is shown in vmodes_psds_comparison.png.
      • Note that the number of averages differs between the cases; there are significantly fewer days with only v1 elevated, which explains why the [v1 high, v2 low] spectrum appears noisier in some regions. However, similar features are still present in the [v1 high, v2 high] case.
      • Notably, there appears to be more spectral content in the 450–550 Hz range when both modes are elevated, with certain lines showing significant power (highlighted in green).


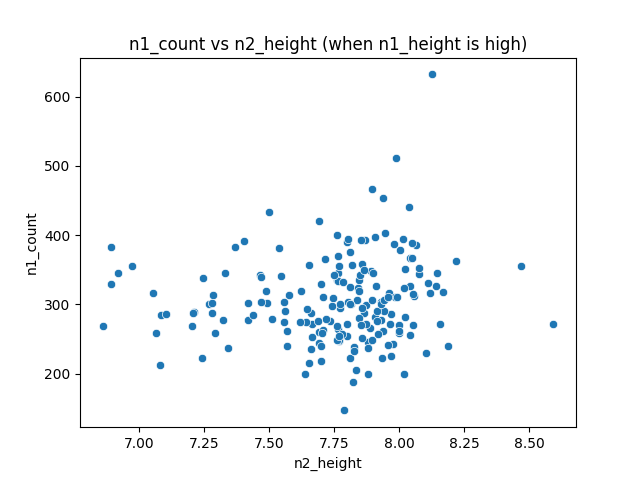
  • Daily Fscan data around the violin modes is summarized in Pairwise_scatter_plots.png , where n1_height and n2_height are the max peak heights of v1 and v2, and n1_count and n2_count are the corresponding line counts. There appears to be a threshold in violin mode amplitude beyond which line counts increase (based on {n1_height, n2_height} vs. {n1_count, n2_count} trends).
  • We also ploted how n1_count varies with n2_height when n1_height is high in n1_count_vs_n2_height_when_v1_high.png

Next: We plan to further investigate the lines that appear when both modes are high, the goal is to identify possible intermodulation products using the recorded peak frequencies of the violin modes.

Images attached to this comment
Displaying reports 7281-7300 of 89028.Go to page Start 361 362 363 364 365 366 367 368 369 End