(Sheila, Evan, Keita, Nic, Kiwamu, Alexa)
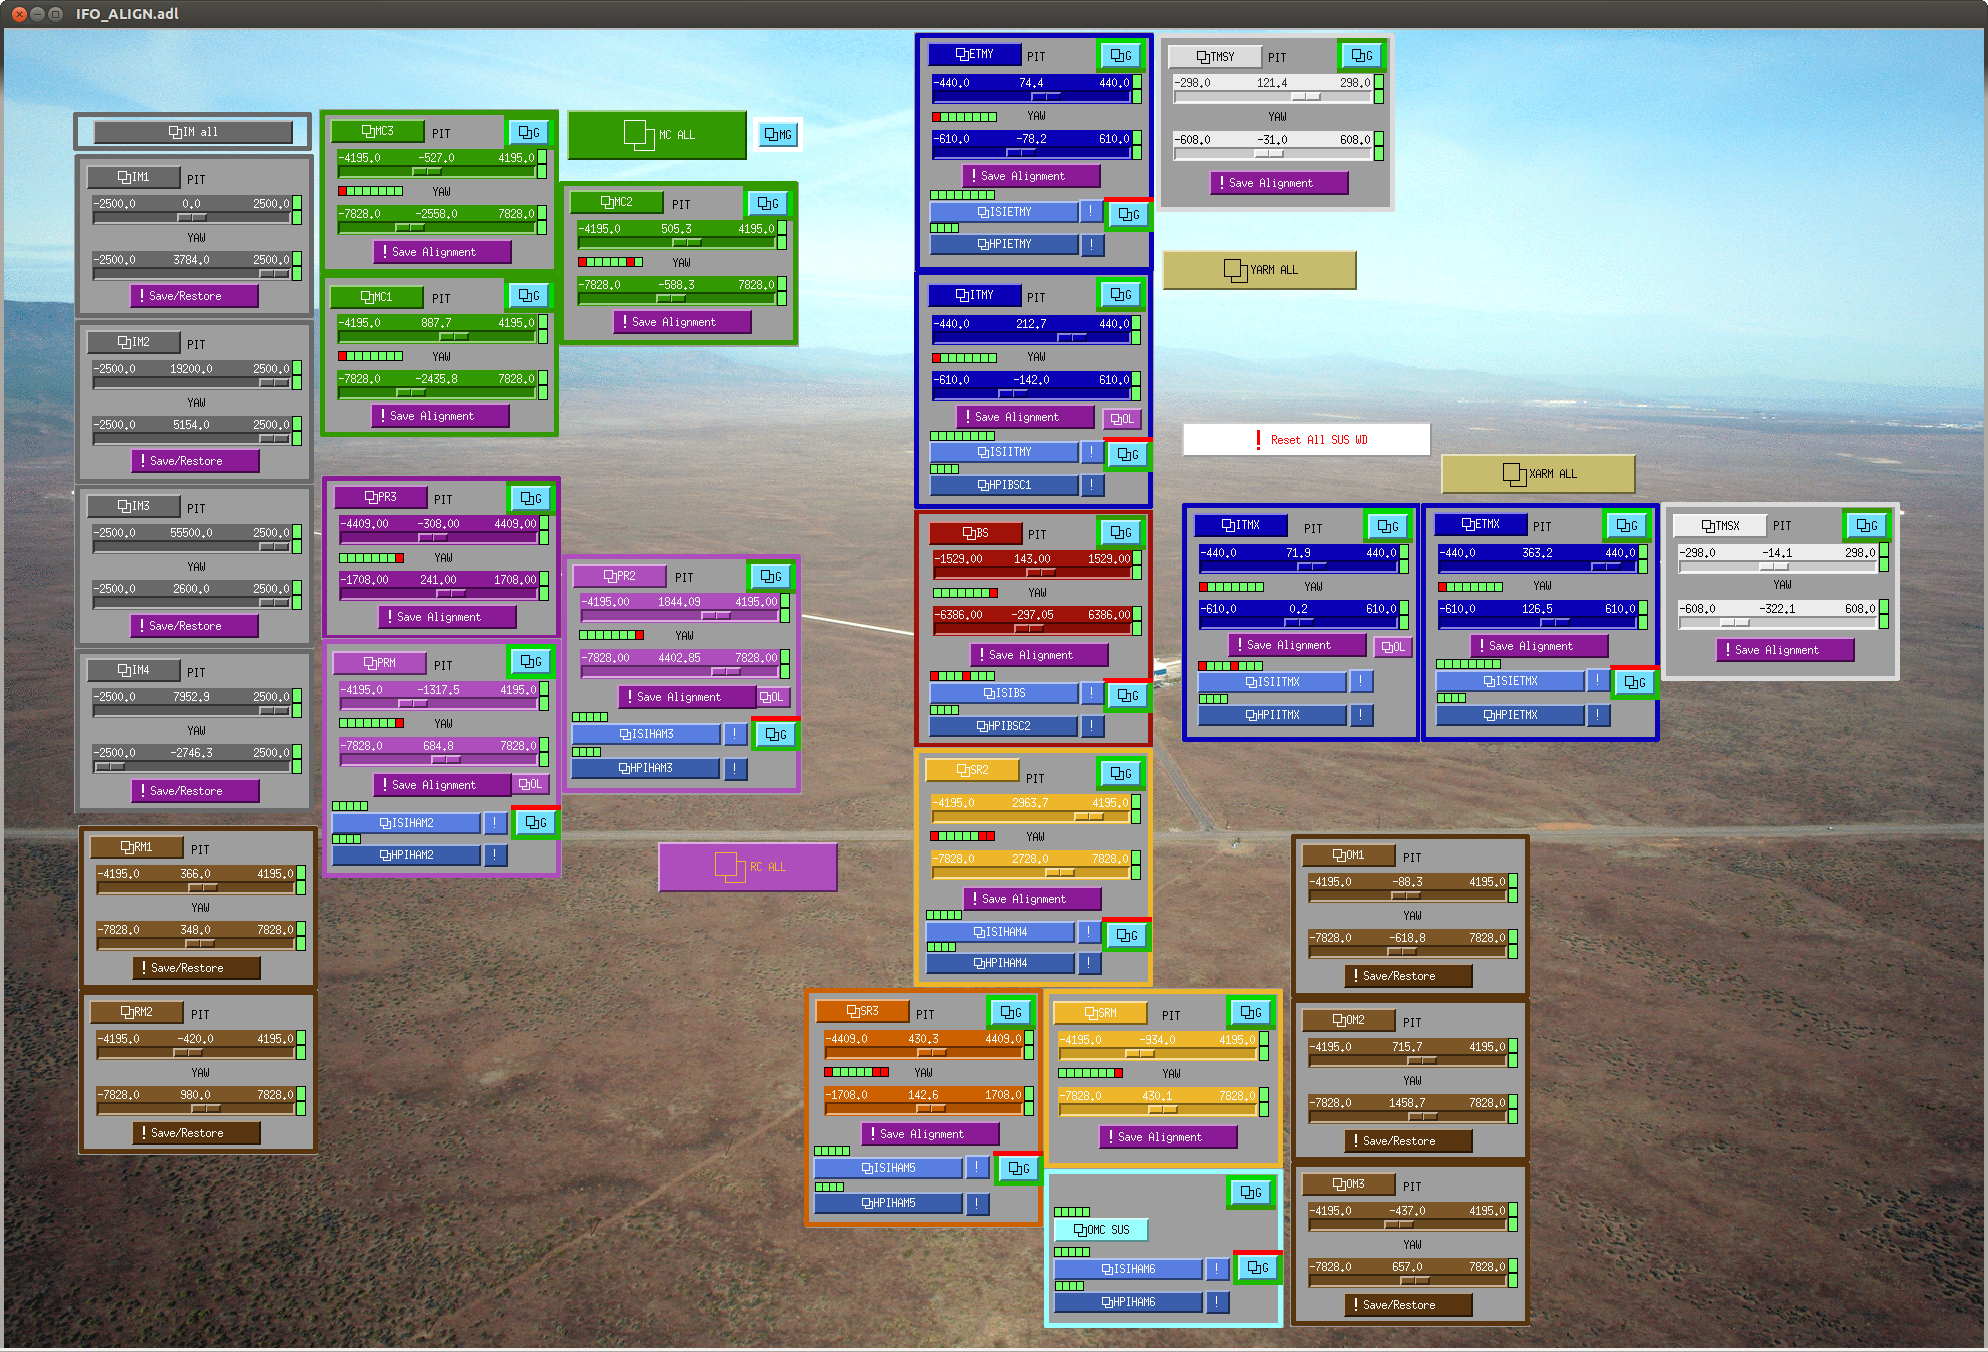
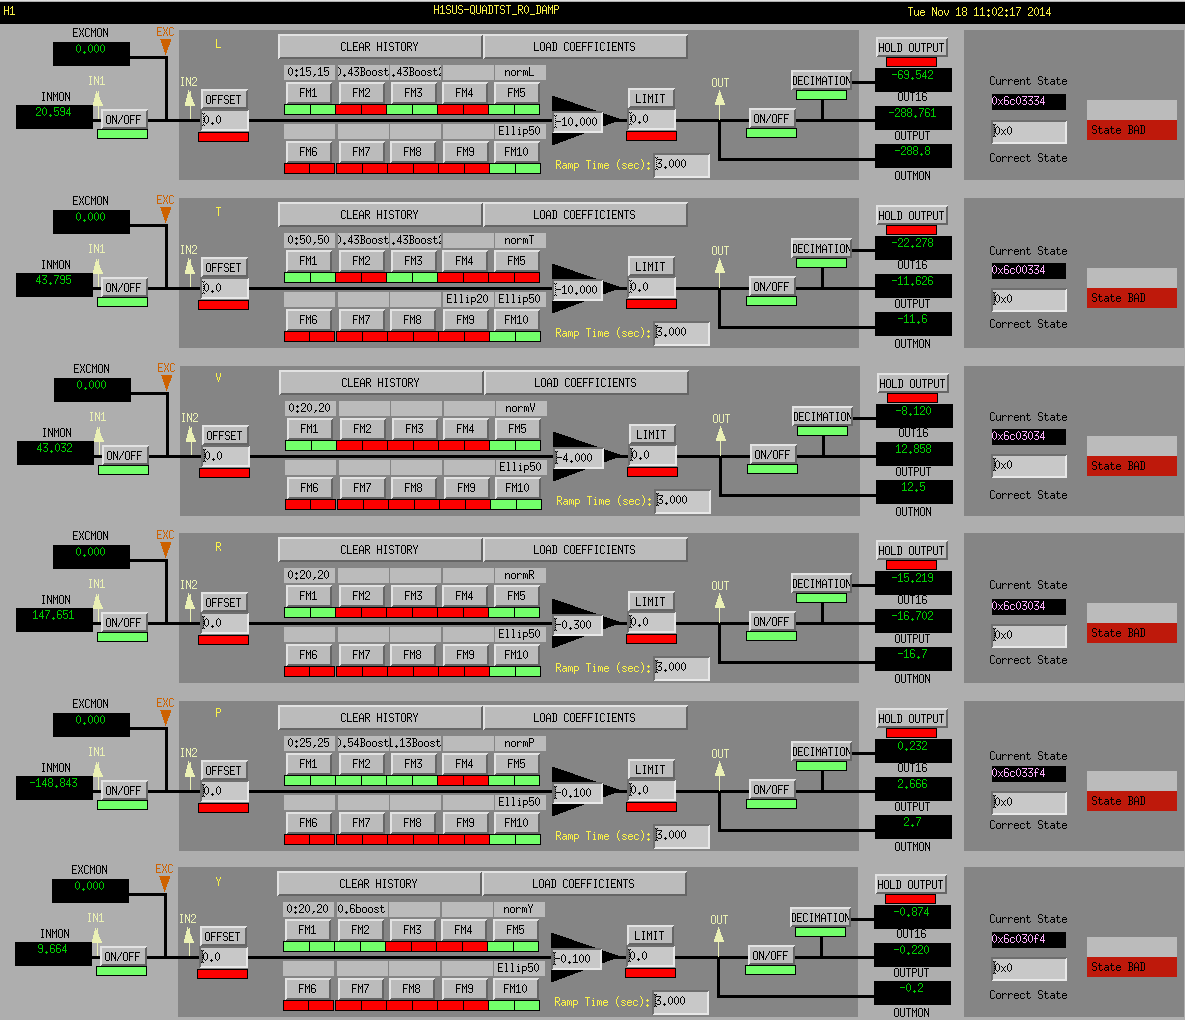
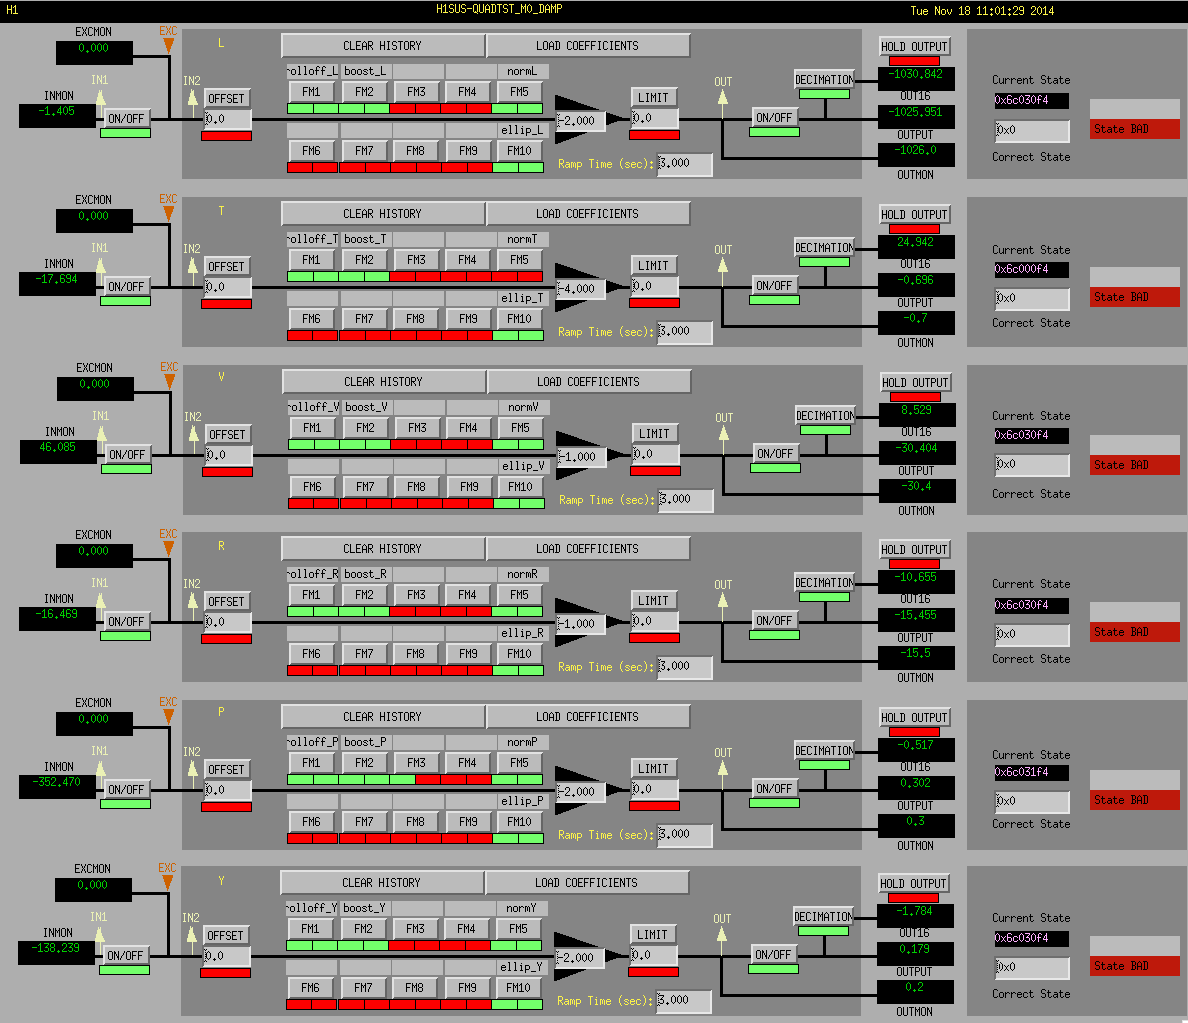
We locked the IR to the x-arm and adjusted PR3 until we achieved the good IM4 alignment specificed in alog 15109. We adusted the HAM3 picometers to restore the ALS green trans beam on ISCT1; I used the camera reference position that we had previously found (alog 15072) and ensured a high build up in TRX. We then aligned MICH on the dark fringe and PRM using PRX lock. Not surprisingly, we had to move PRM a lot. SRM was also aligned, with SR2 and SR3 in the old configuration. Attached is a screen shot with the current alignment values. The POP sled was aligned as noted in Keita's alog 15116.
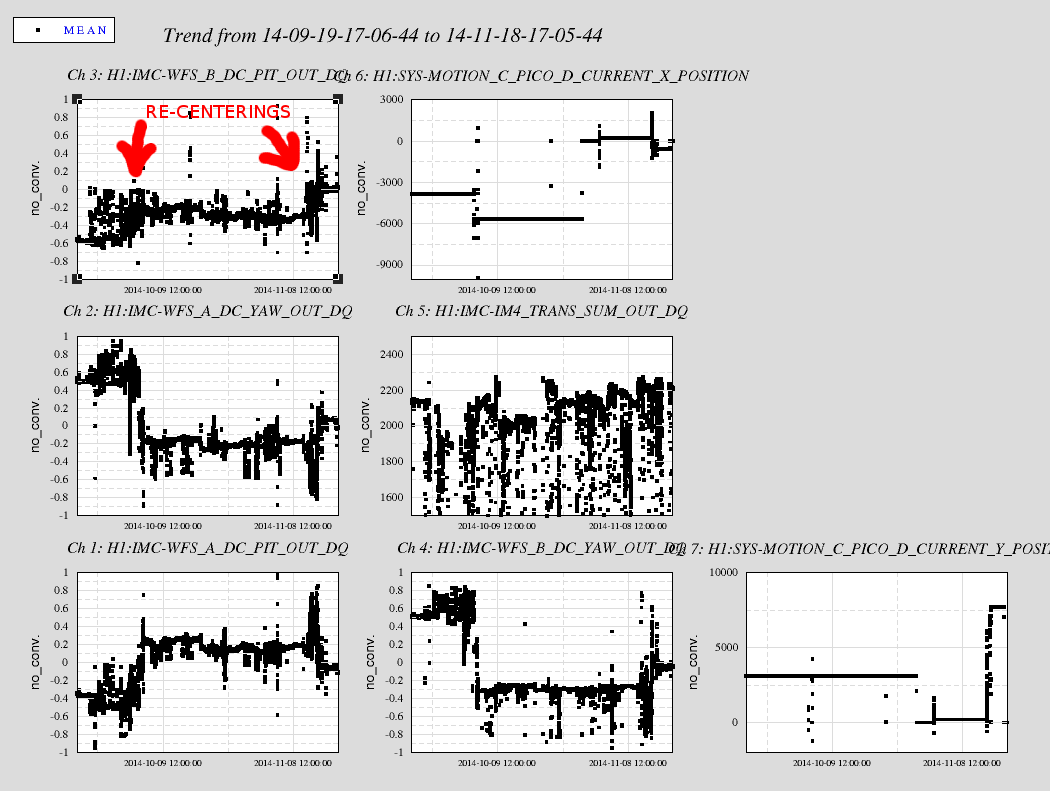
We were able to lock PRMI on the sideband, and acheived 260 cnts build up. Our best build up had been between 260-399 cnts as seen by a trend Keita had taken over the span of 3 weeks. We feel okay about our current build up.
Sheila and Evan marked a new IM4 trans beam on the wall in the LVEA. It seemed the beam hadn't moved all that much from the old position (from June); maybe a few millimeters.
We adjusted the ALS alignment on ISCT1; we got 0 dBm for COMM beatnote, and 6 dBm for DIFF beanote.
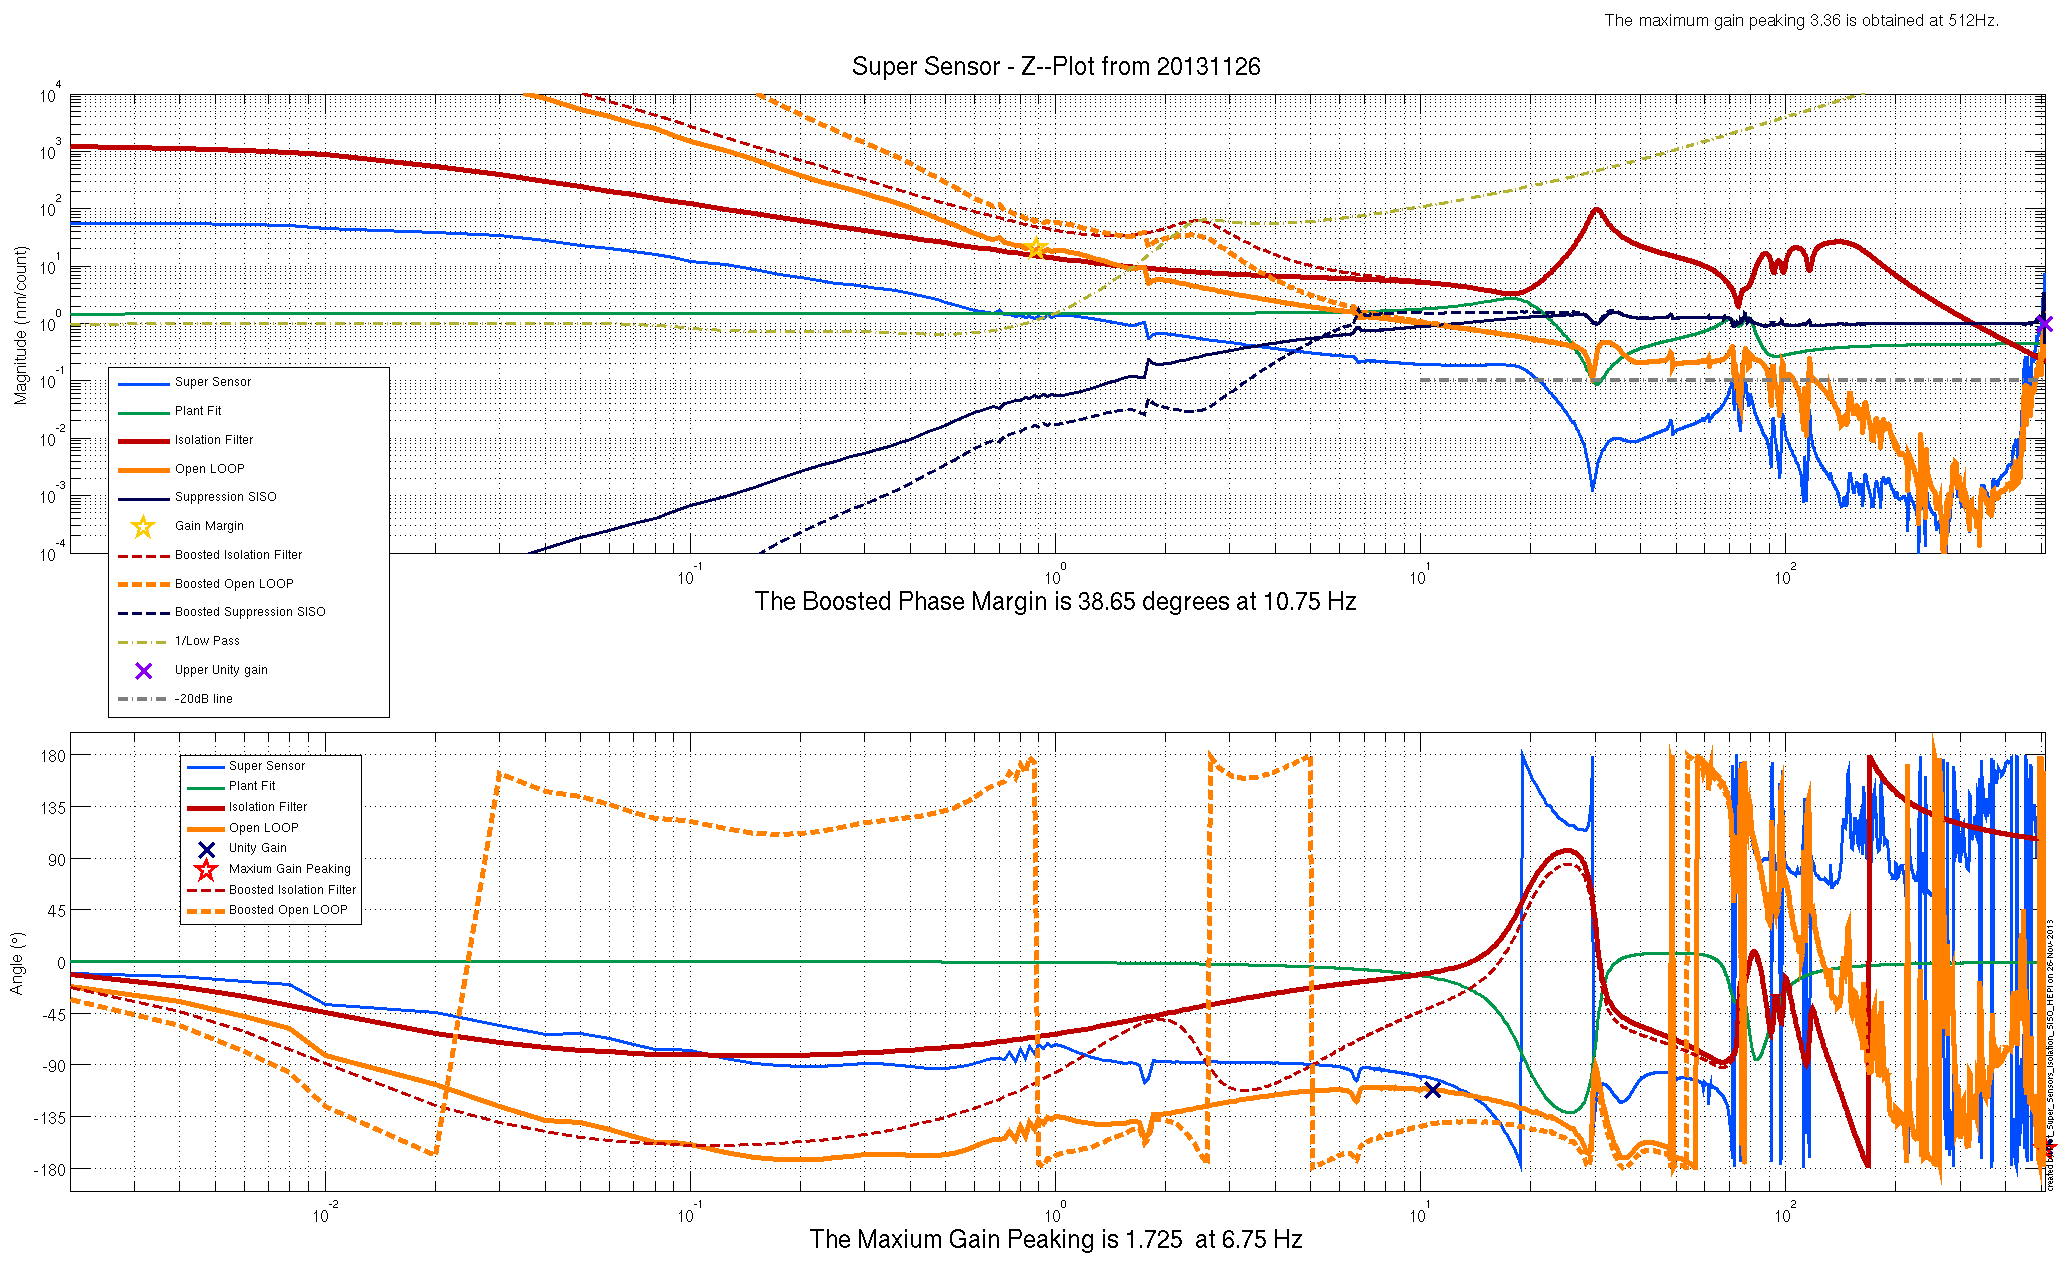
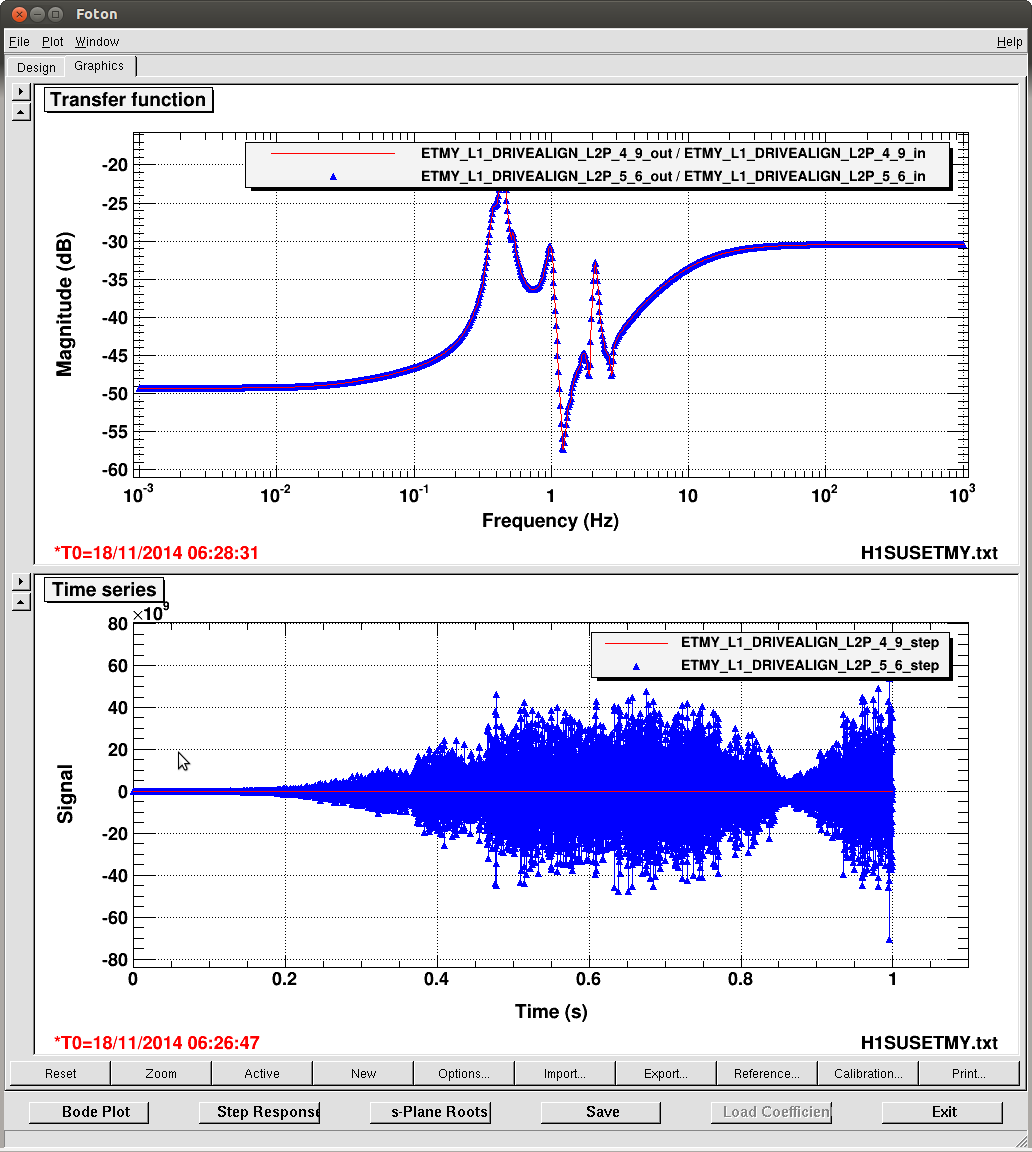
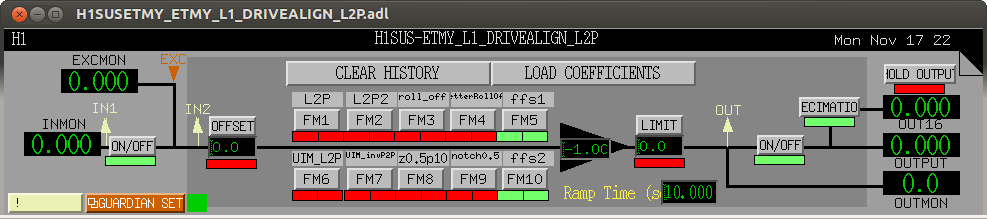
ALS DIFF locked right away. The UGF was 7 Hz, with 70 deg phase margin. The in loop RMS was 0.2e-3 um/srtHz at 0.1Hz. This was with feedback to ETMX only. We then tried feeding back to both ETMX and ETMY L1 stage with Jeff's new EY L1 L2P filters engaged (FM6, FM7); however this did not work. The L2P filters output a huge value 1e+20 and we saturated the DAC immediatly. FM7 has a step response of 10^18 ! Also, are we supposed to leave Arnuads invP2P filter engaged? We must have rung up a mode around 10 Hz. Nic and Kwamu fixed this (see their alog 15118).
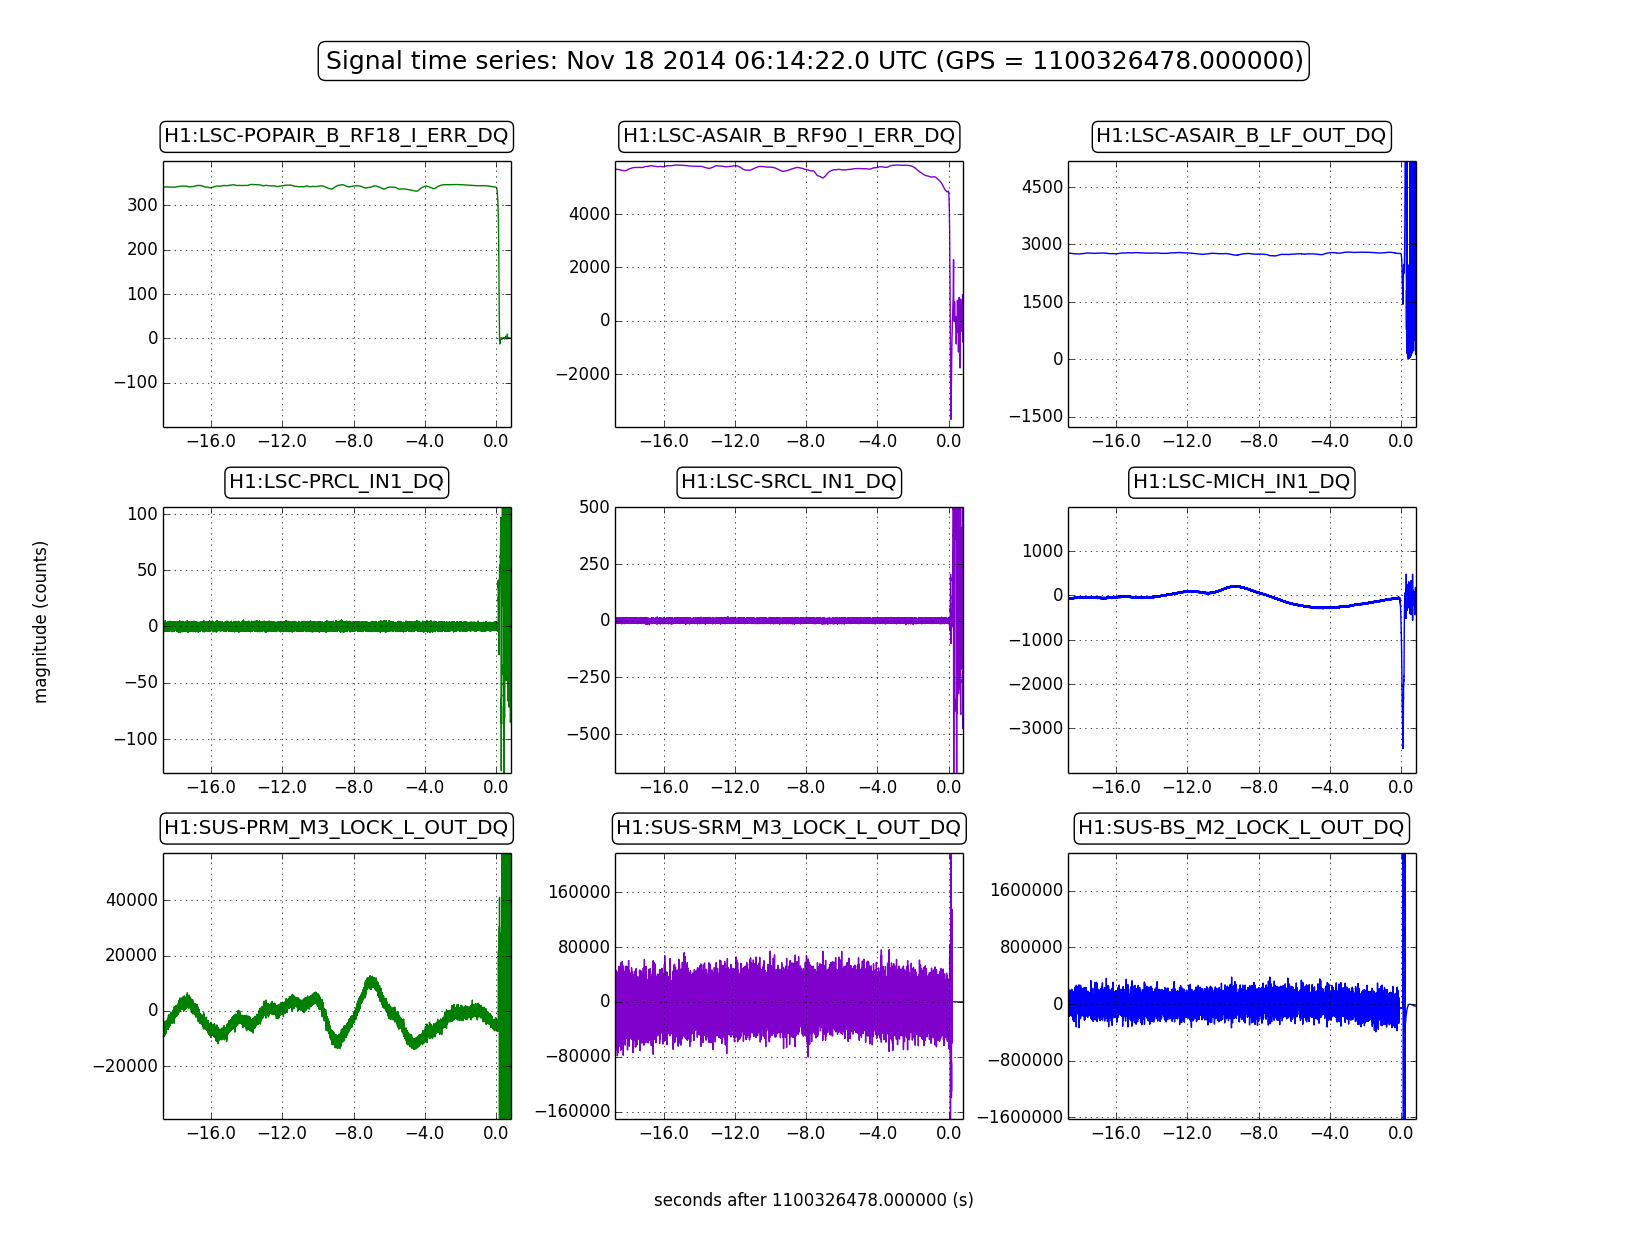
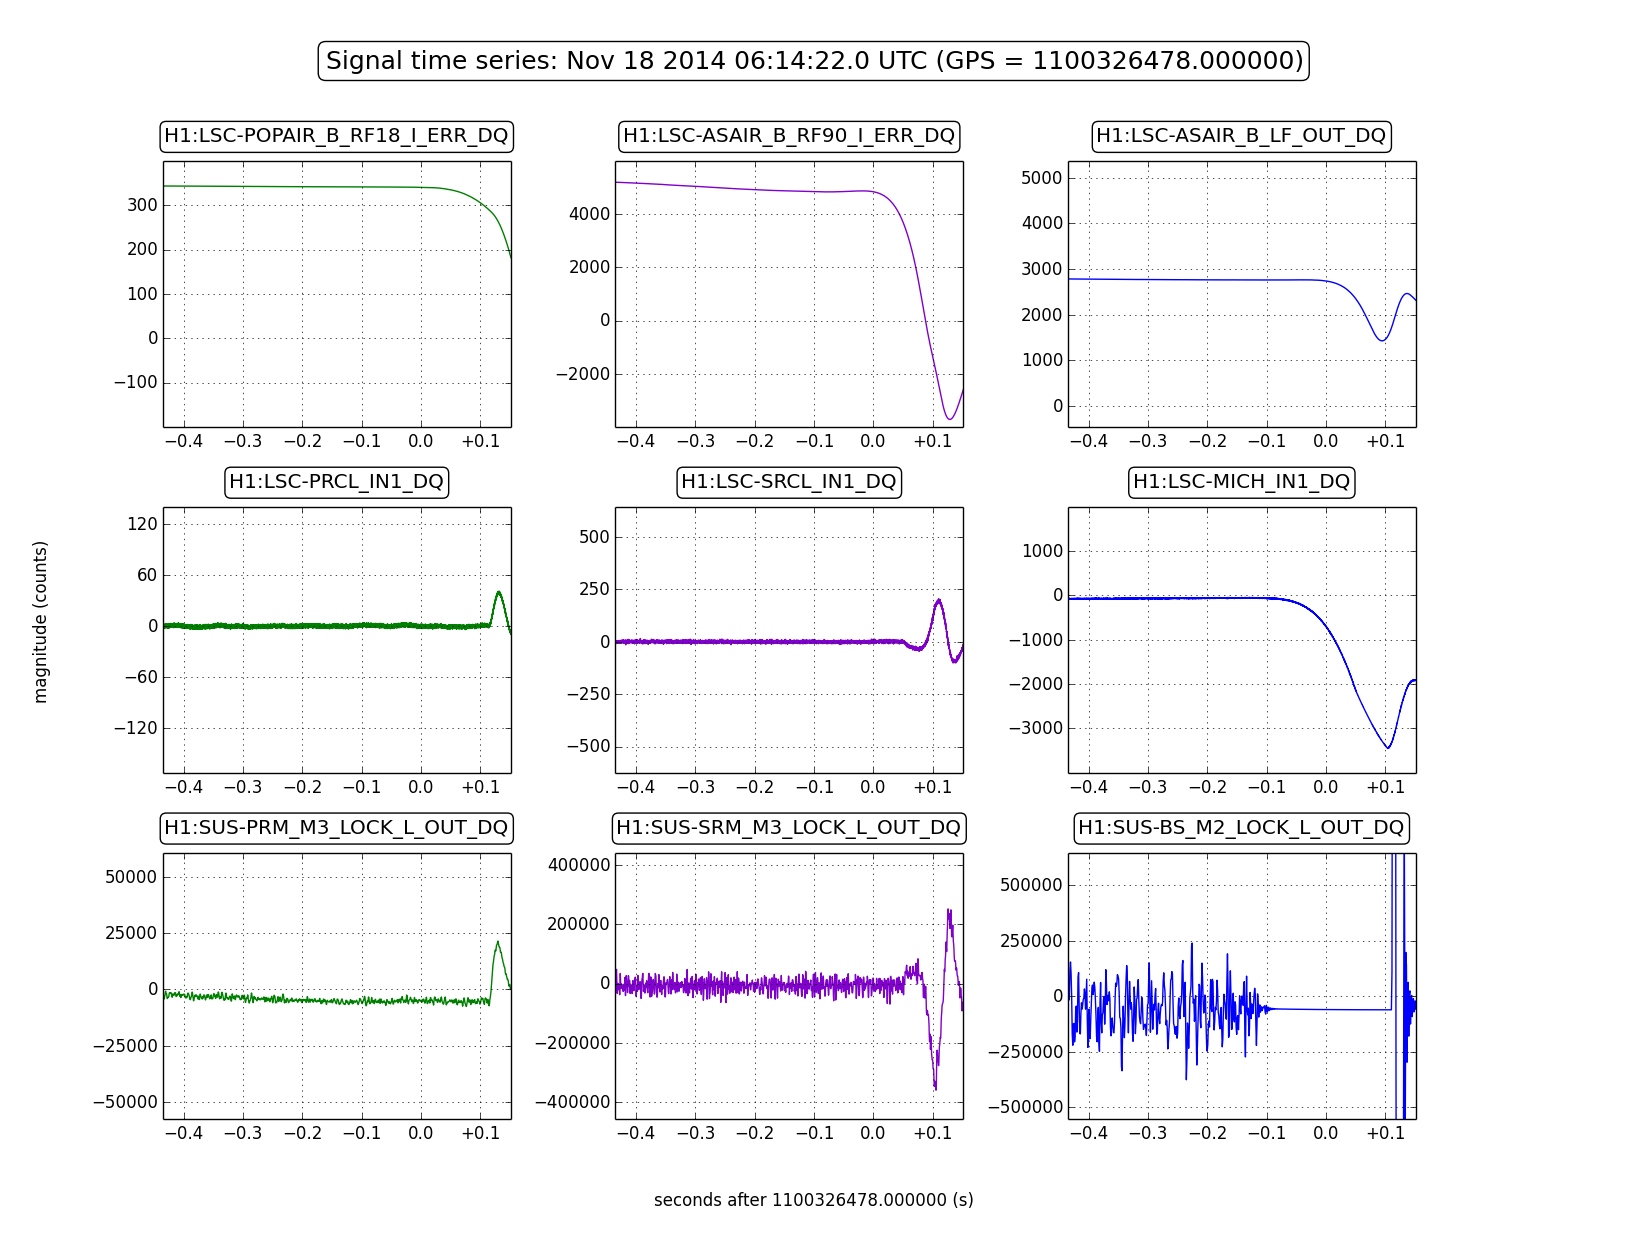
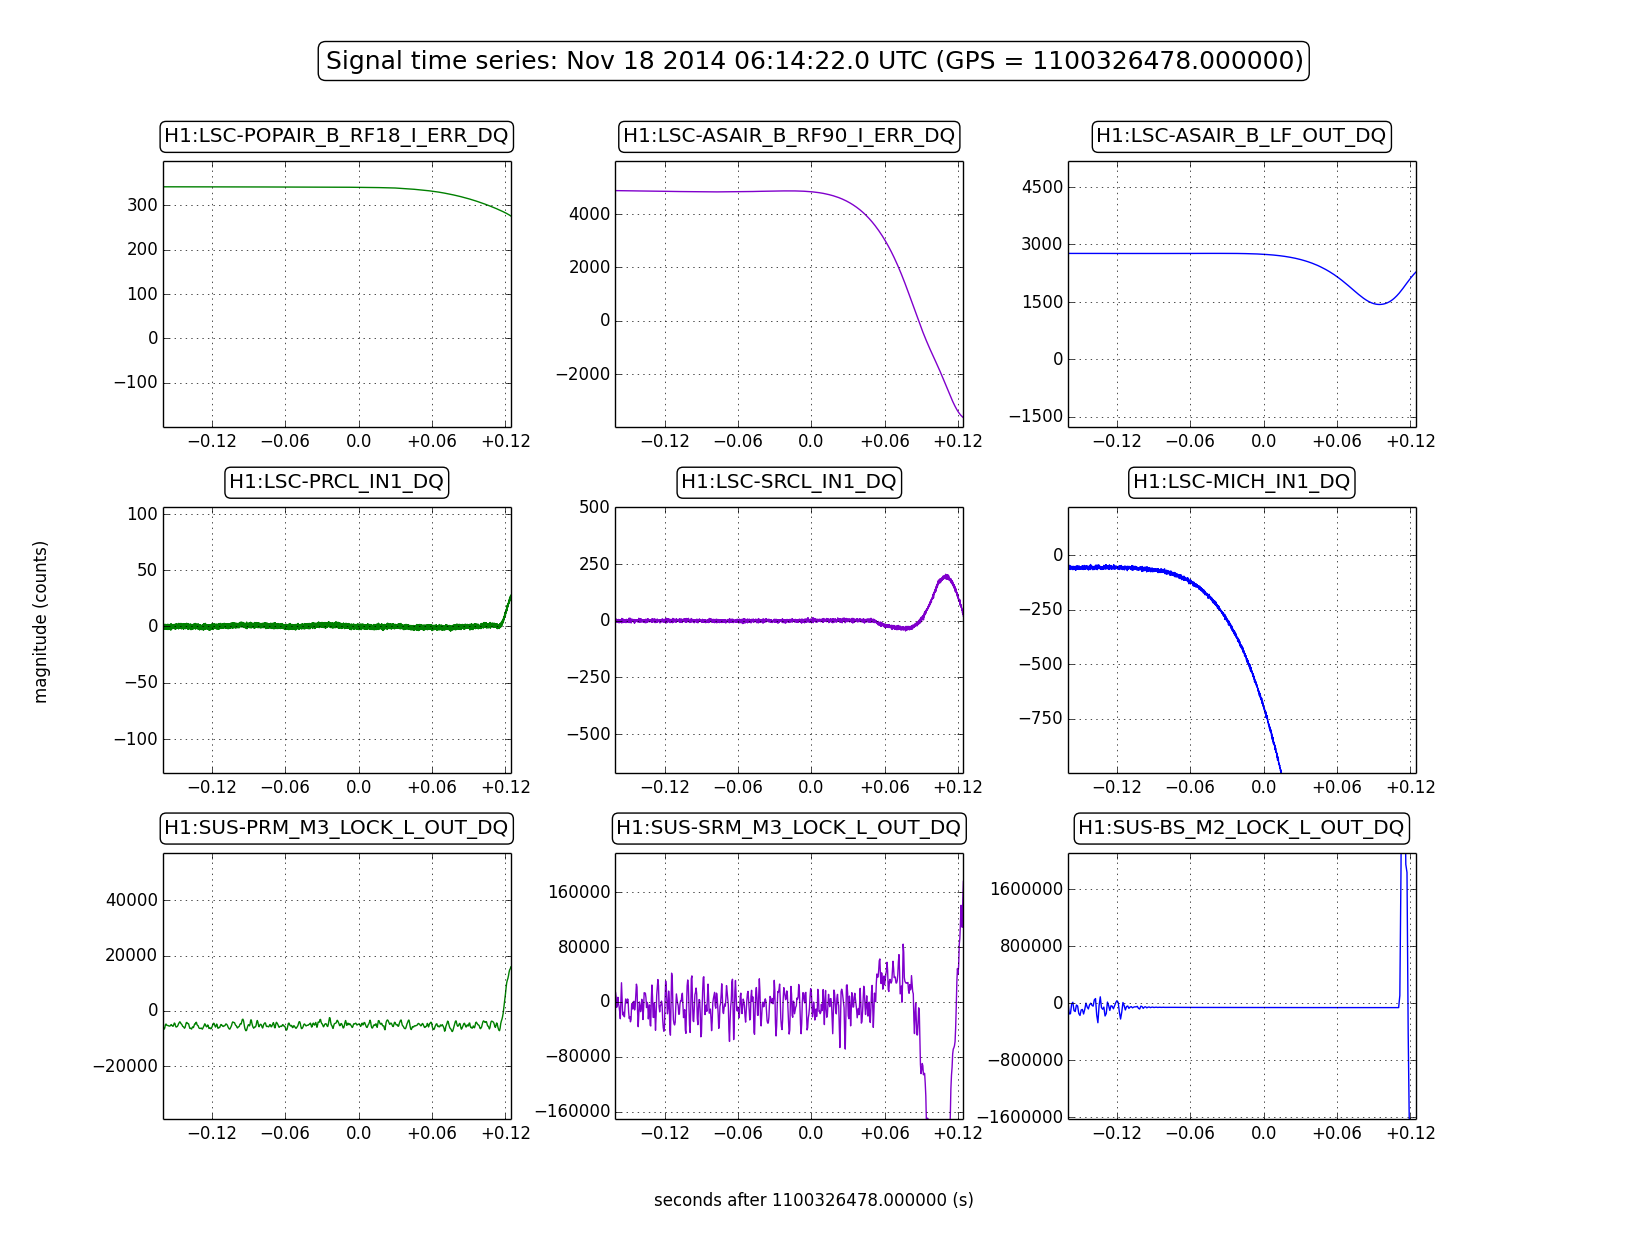
We locked DRMI 1f with the ASC wfs engaged. POPAIR18 measured 343cnts, and ASAIR90 measured 5731. It appeared to be the best DRMI "moment of [Sheila's] life." DRM1 1f lock time Nov 18, 2014 6:07 UTC. We transitioned to 3f flawlessly at ~ Nov 18, 2014 6:12 UTC. We lost lock at Nov 18, 2014 6:14 UTC.
Then we tried locking DRMI with the arms 500 Hz IR off resonance. At first, the DRMI alignment did not look as good; when we engaged the wfs the build up increased dramatically but we would lose lock when the build up got high. We deduced that the gain of the loops had to decrease with the precense of the arms. We reduced MICH gain from 5 to 4 to obtain a 15 Hz UGF. PRCL we reduced from 22 to 11. At some point the alignment looked good and the lock was stable for a bit, but we lost lock trying to measure the SRCL loop gain. We got tired...