08:00 PSL is DOWN - sent e-mail to D Cook, P King and R Savage
08:00 3IFO team is in the LVEA
08:01 the LVEA is in the bifurcated LASER hazard state
08:15Fil, Aaron and Manny out to EX
08:30 Rick called me and walked me through restarting the PSL frontend laser.
09:00 Jody into the LVEA
09:12 Jody ou of the LVEA
09:20 Mitchell out of th LVEA
10:10 Karen into EY
10:30 Cris into EX
10:35 Patrick and Richard working on Beckhoff system for Mids and Ends
10:36 D Barker informed me of a DAQ restart at 12:00P
10:41 Karen heading back from EY
10:53 Karen heading out to MY
11:02 Cris at MX
11:07 Patrick and Richard are done working on Beckhoff
11:35 Jeff and Andres out of LVEA - LVEA returned to full LASER hazard
11:36 Gerardo and Kyle out to LVEA
11:40 Karen leaving MY
11:50 Kris back from MX
12:04 Gerardo and Kyle out of the LVEA
12:13 DAQ restart delayed- waiting for EY update
12:21 DAQ restarted at 12:25
12:35 Fil, Aaron and Manny back from EX
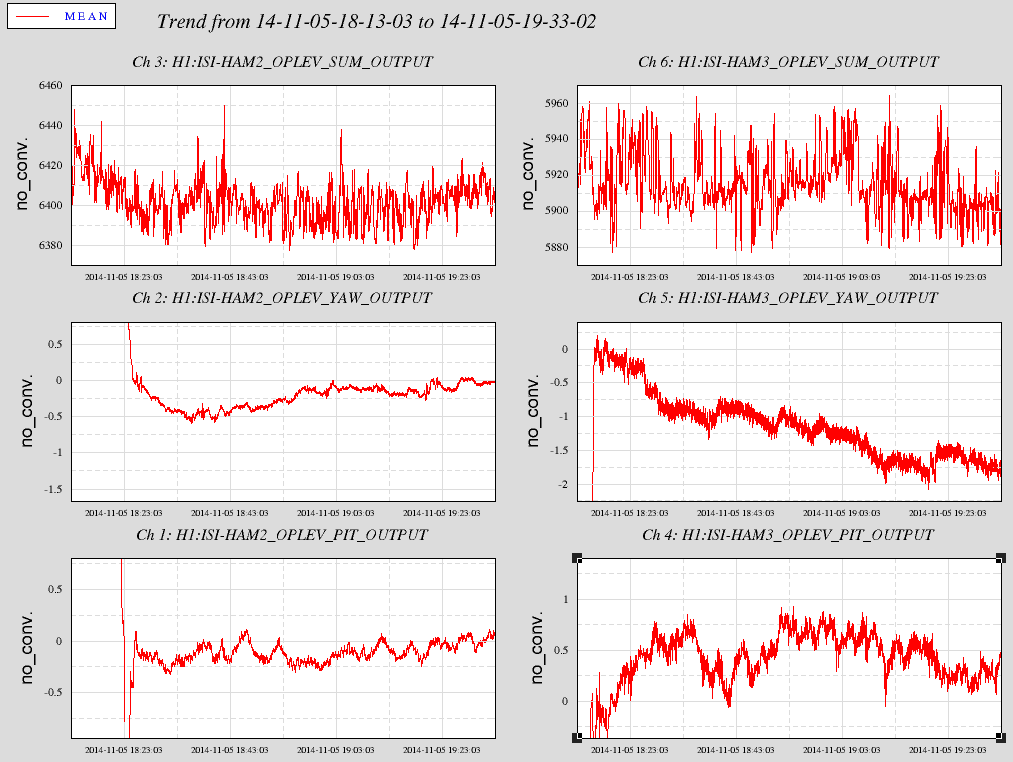
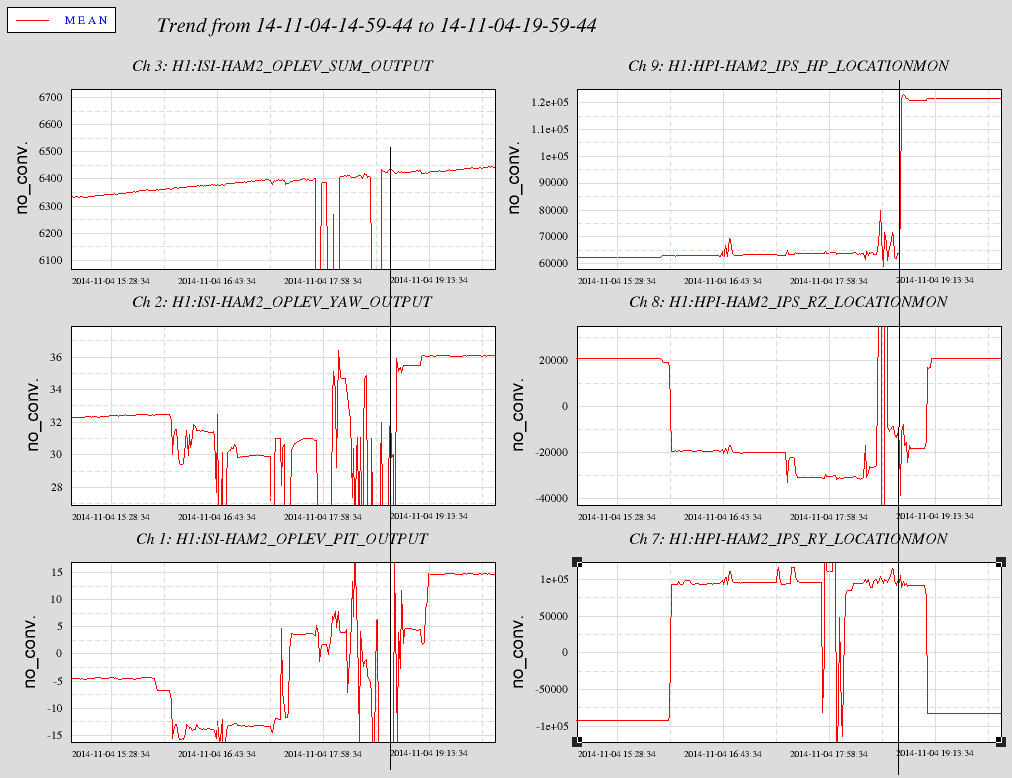
13:13 HAM2,4,5 ISI WDs tripped
13:20 Travis in LVEA w/comm appr
13:22 WDs in HAM 2,4,5 reset after ISIs settled down
13:25 Dan into LVEA w/comm appr
13:53 HEPI WD accumulators cleared - HAM2 (2) and HAM5 (348) none were incrementing at the time.
13:55 CP-7 on H0VE_SITE_OVERVIEW.adl screen was alarming earlier in the day and now has remained red since right before lunch.
13:57 Travis out of LVEA
14:12 Dan into LVEA to execute LHO WP #4942
14:30 Joe into the LVEA w/comm appr - checking batteries in foklift
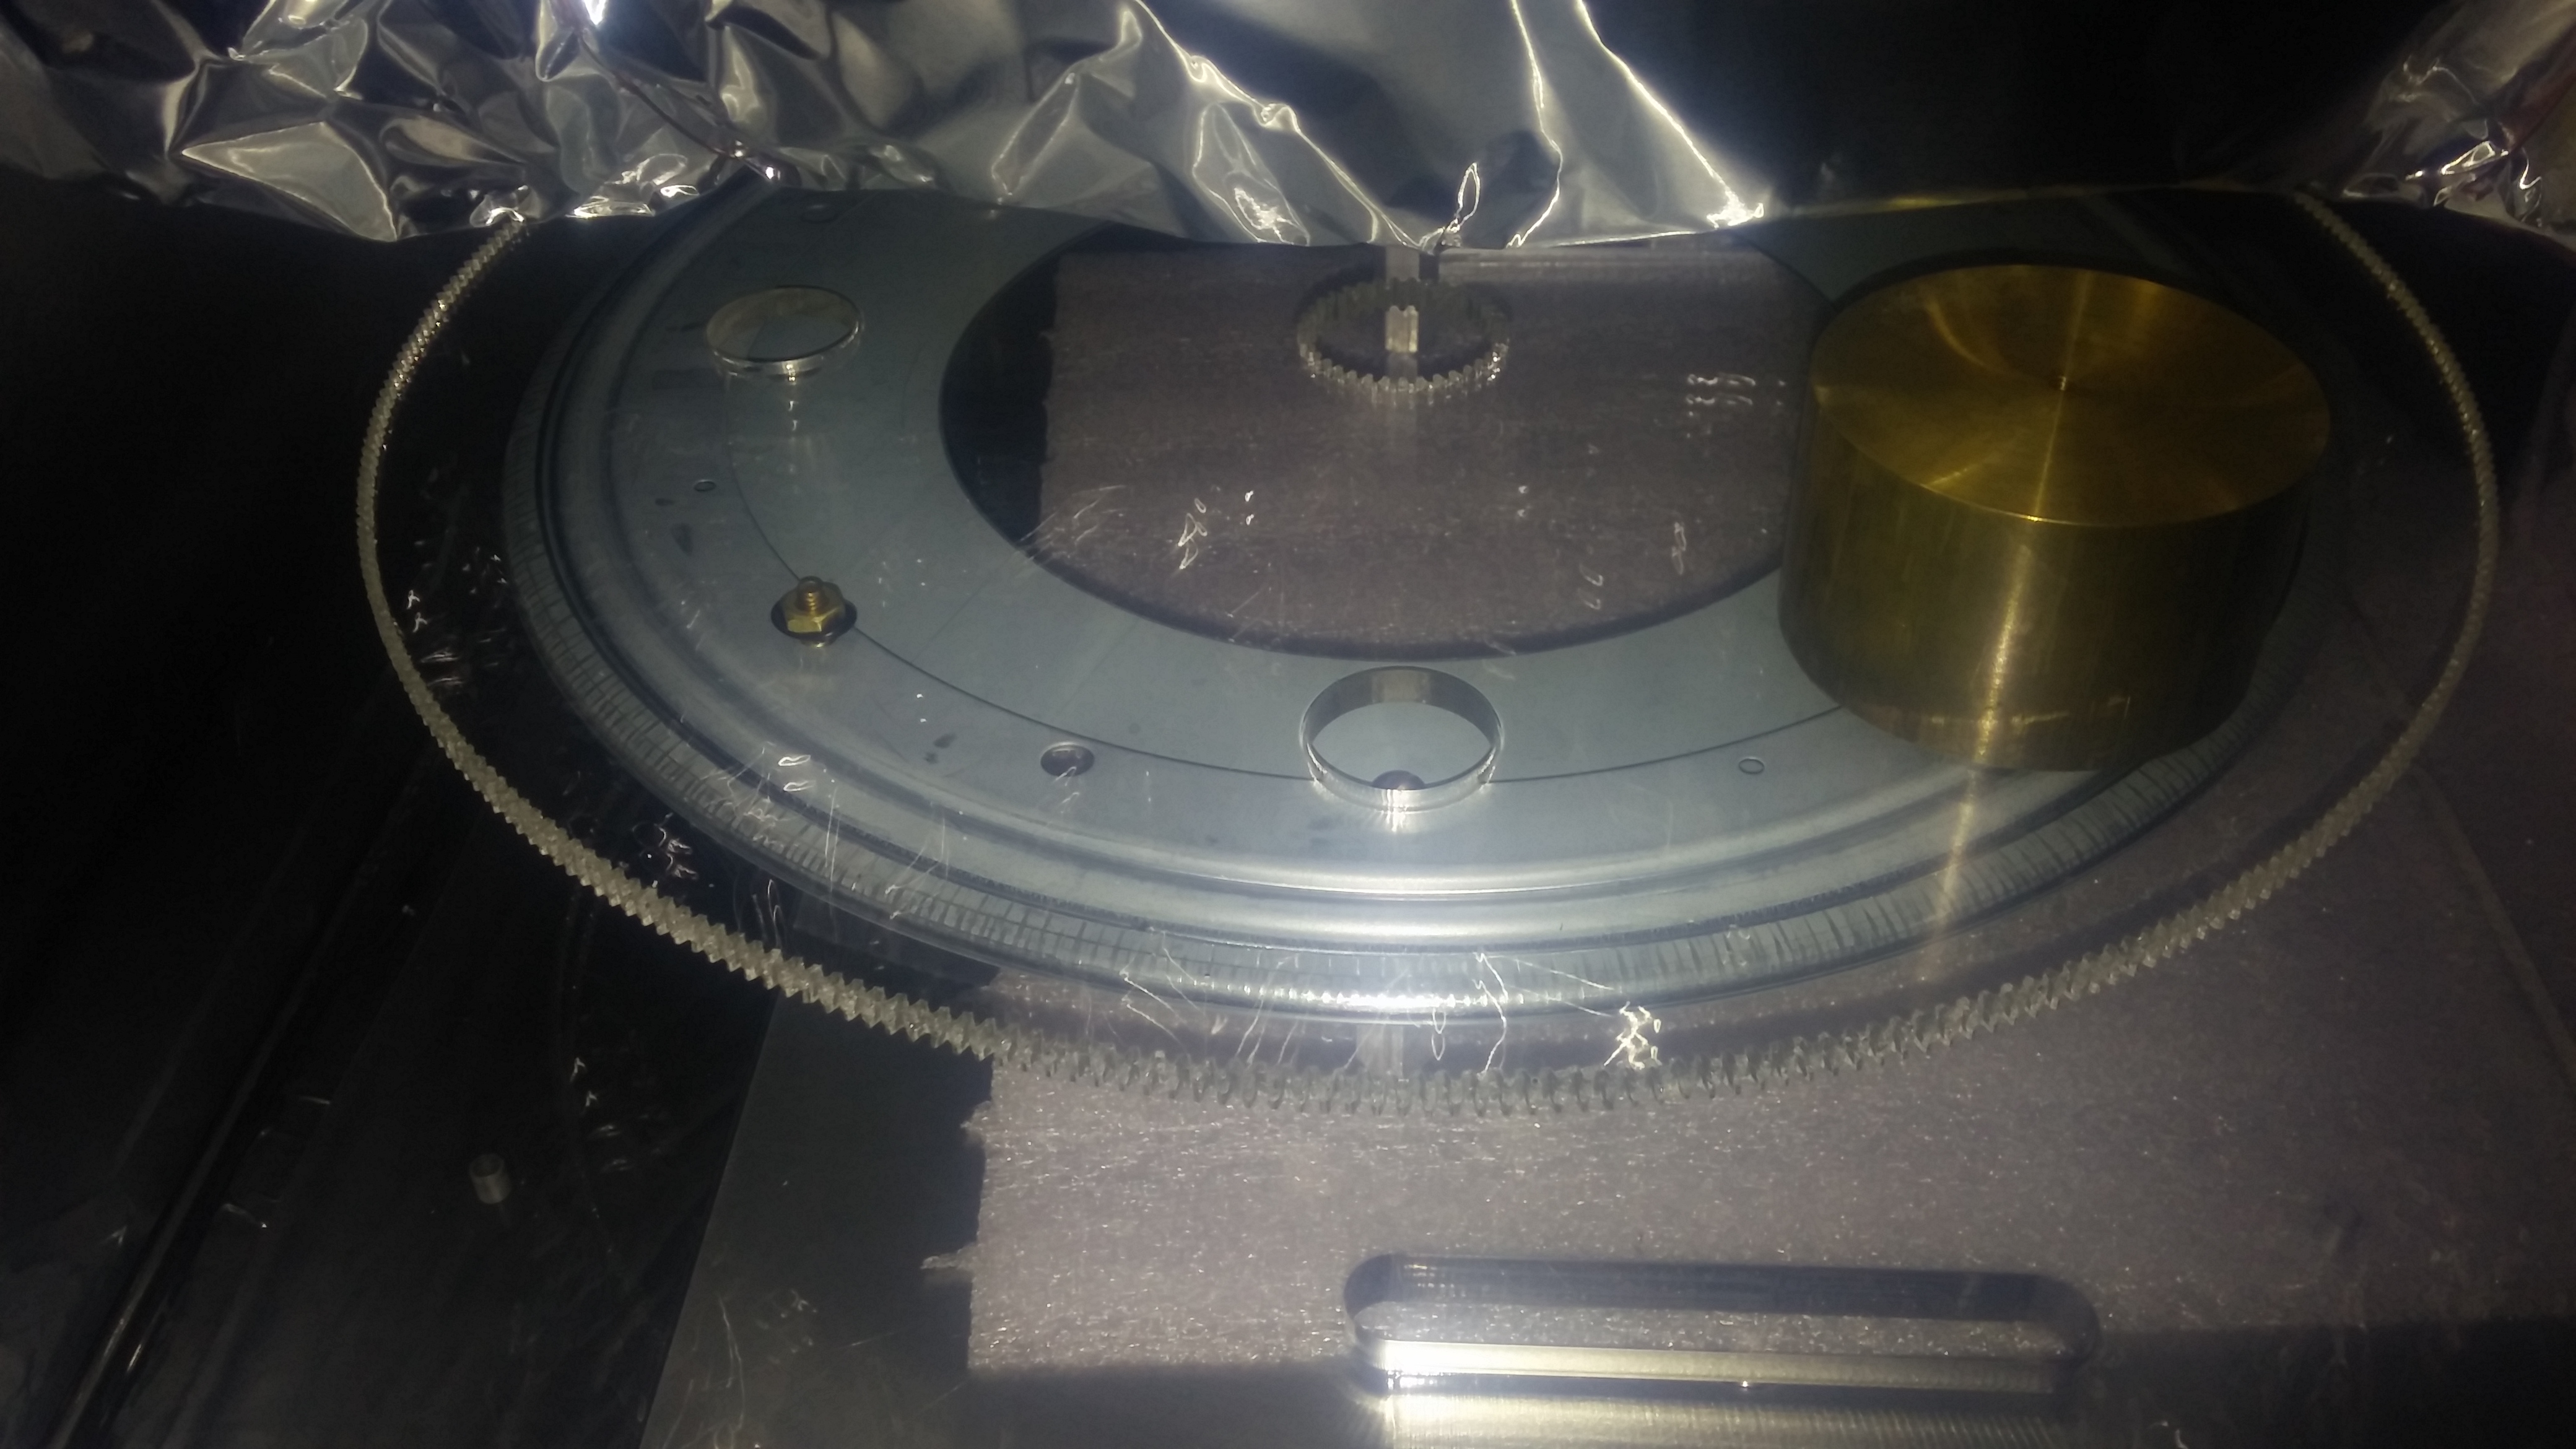
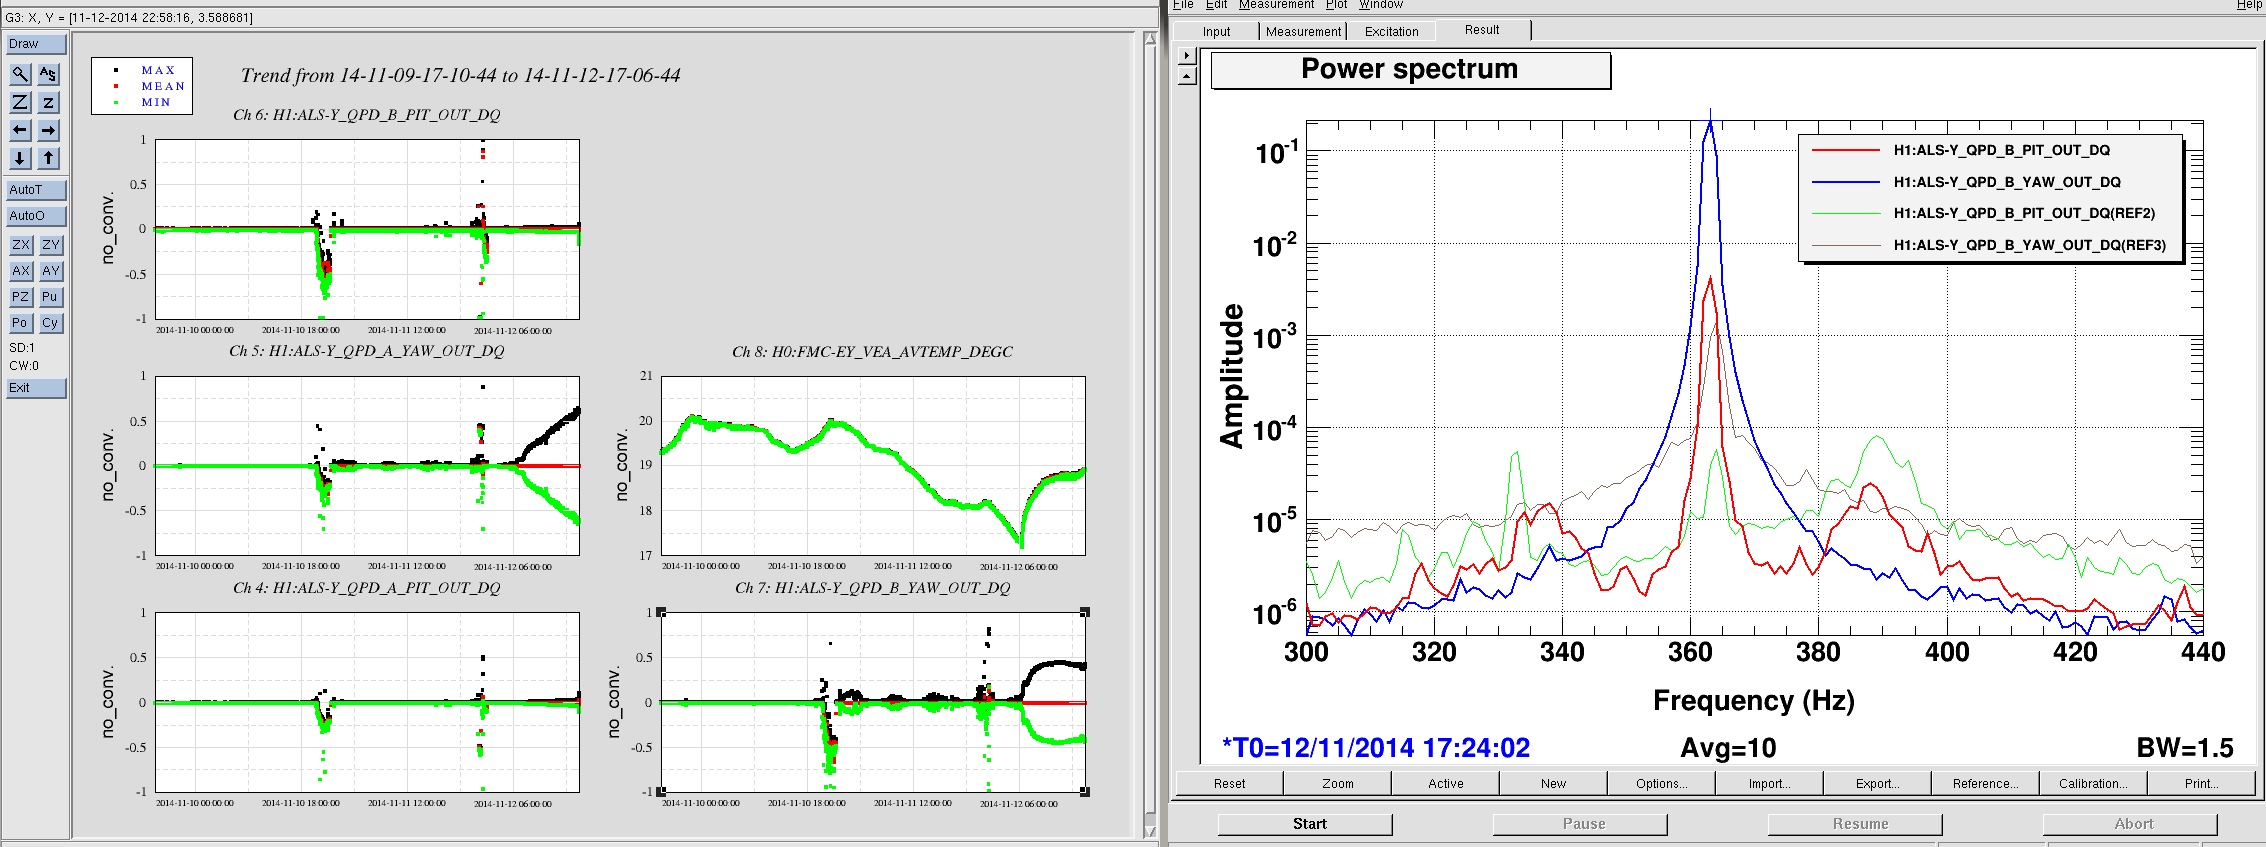
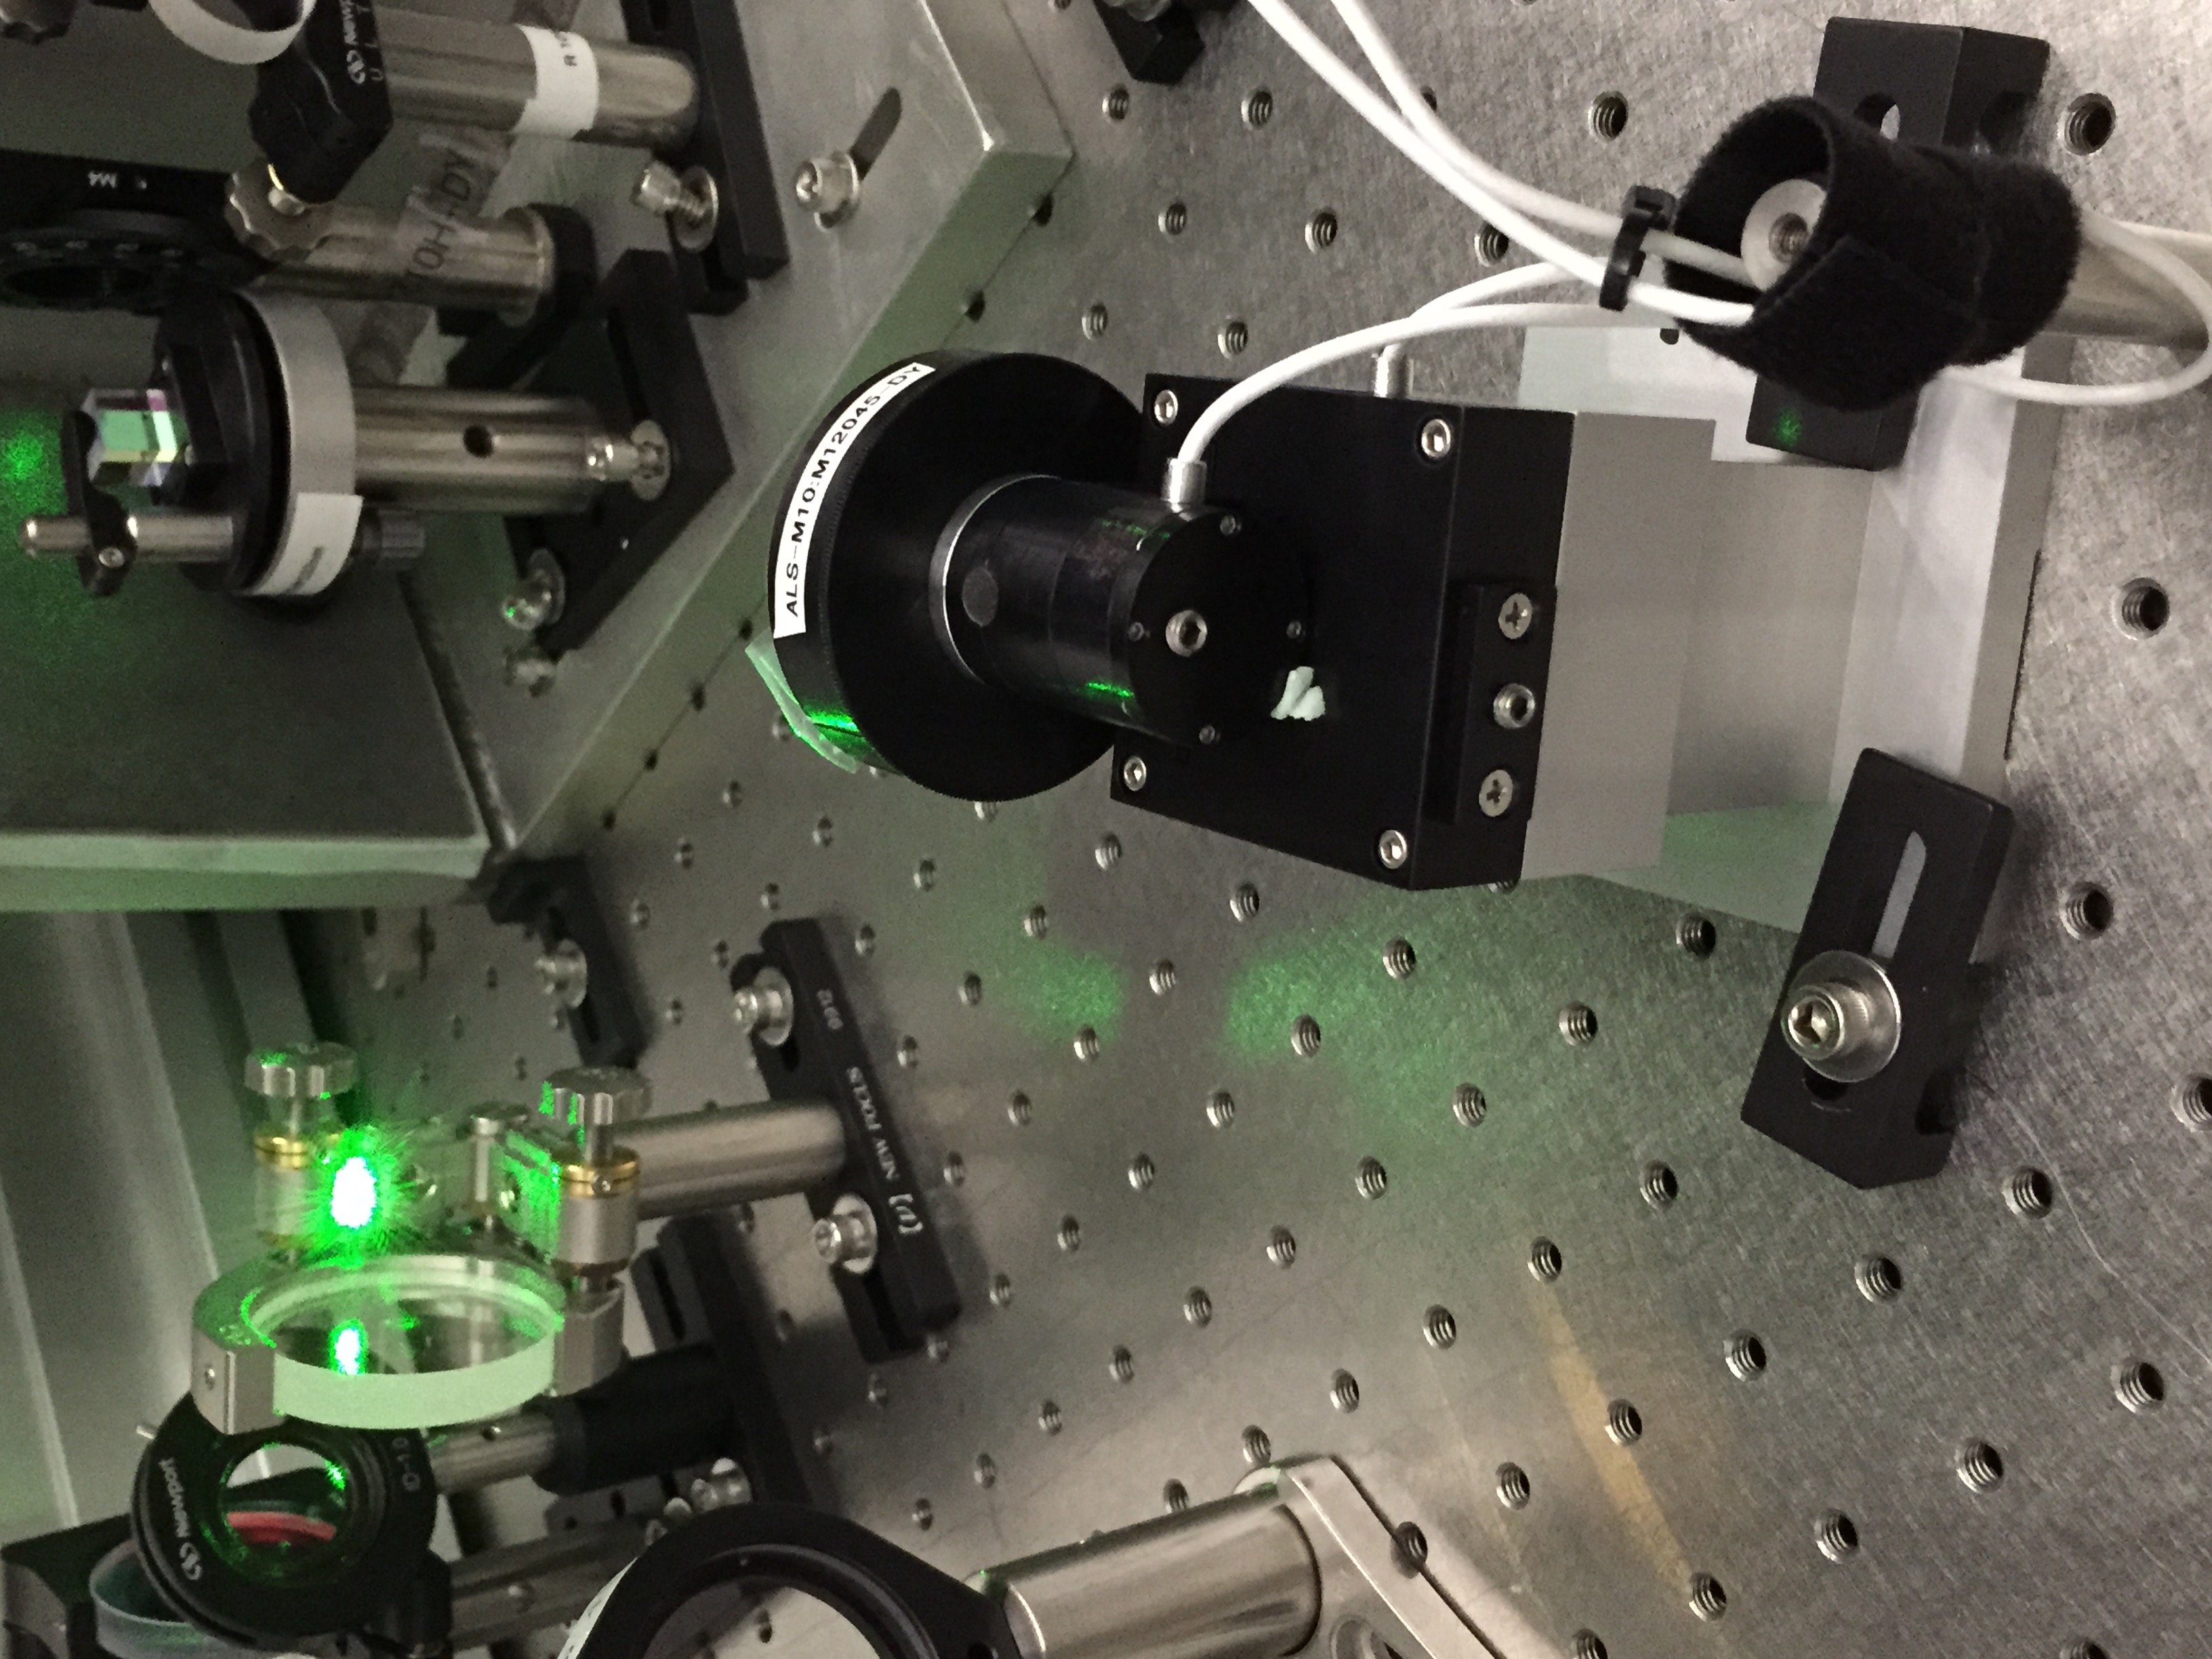
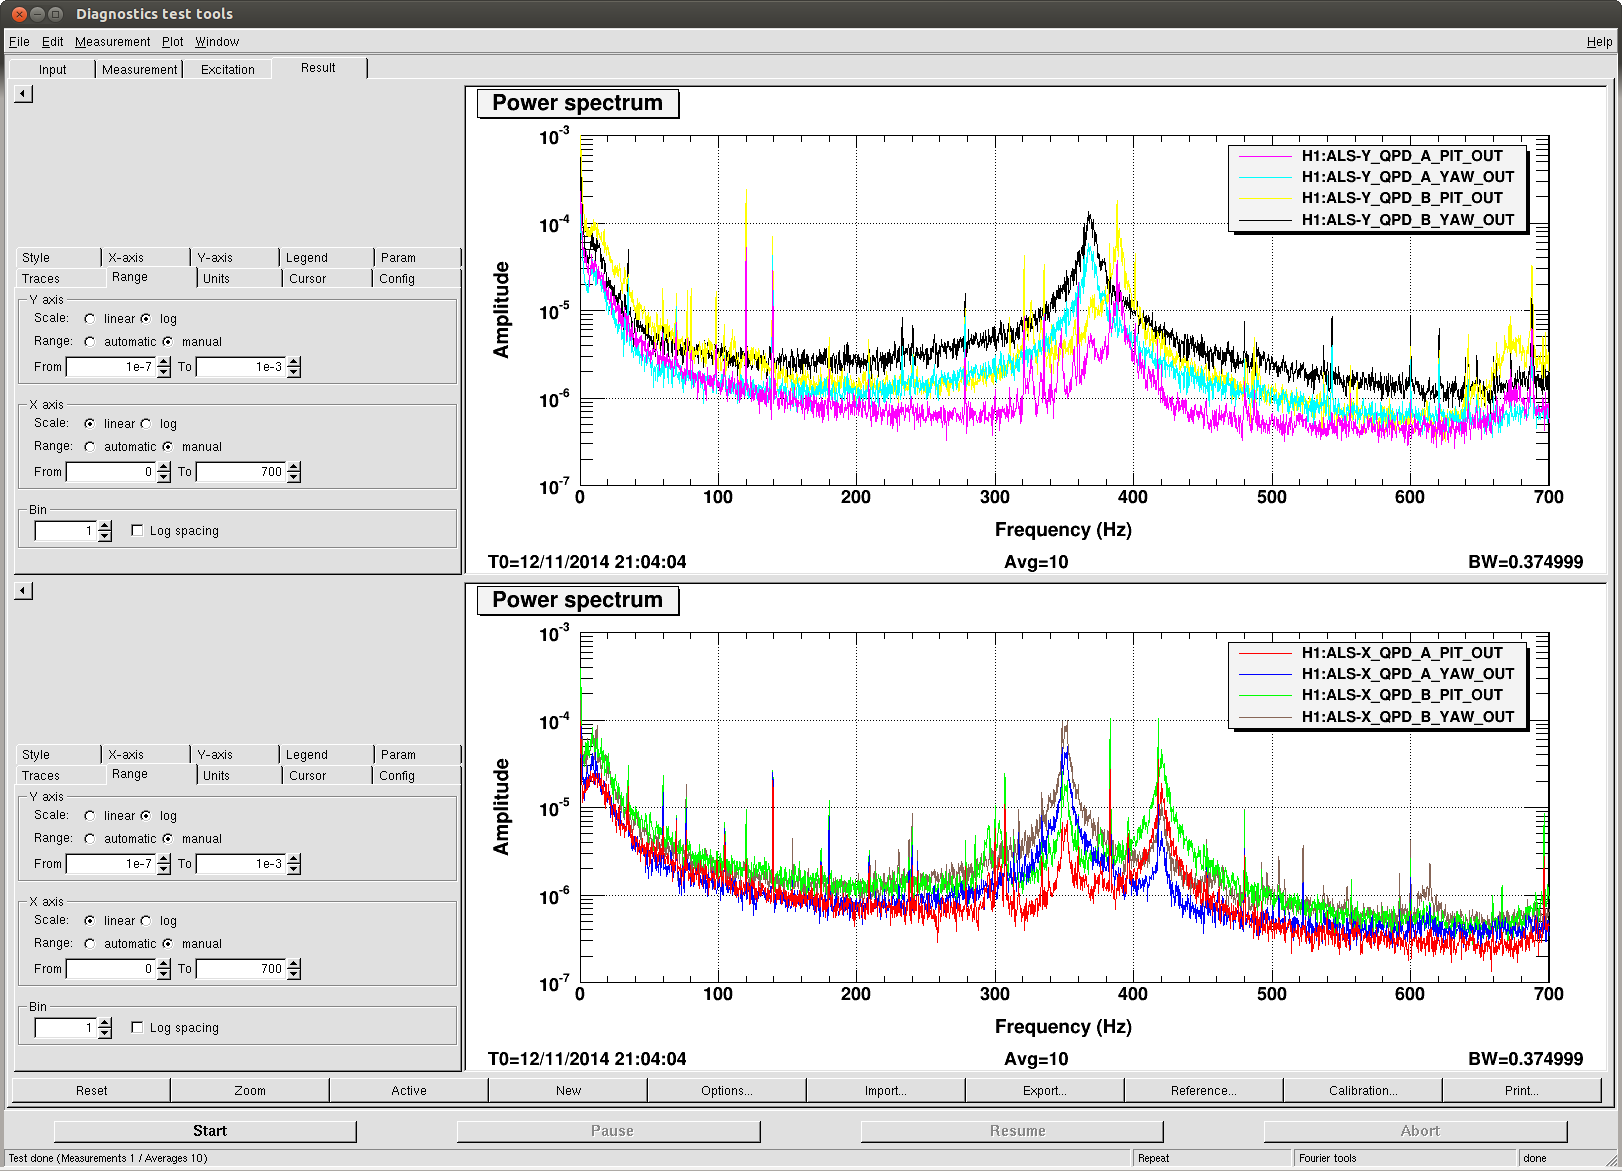
14:39 Sheila and Evan to End Y to investigat a problem wih the ALS
14:45 Joe out of the LVEA.