Our range is lower than usual, and it appears that the overall DARM noise changed somewhat coincident with the calibration update (see log 83088). The calibration update has improved the calibration accuracy at some frequencies and worsened it in others, namely, calibration error below 40 Hz has reduced from +-4% to within 1%, but calibration error above 50 Hz has increased from within 1% to 2-3% (I am eyeballing these values off the plot in the linked alog).
I took Jeff's calibration transfer functions from the linked alog and I applied them to the GDS-CALIB_STRAIN_NOLINES channel from a time just before the calibration update and a time after. I used our new range difference calculation method to compare the range from before the calibration change to the range after.
Method:
I chose a "before" time, when the GDS CLEAN range appeared to be around 160 Mpc and an "after" time from this past weekend. I used times that started after 3 hours of lock to ensure we were thermalized. I was careful to look for times with no large glitches, and used median averaging to calculate the PSDs.
before time = 1423272193 (Feb 10 12:22:55 PST)
after time = 142495718 (Mar 2 05:26:08 PST)
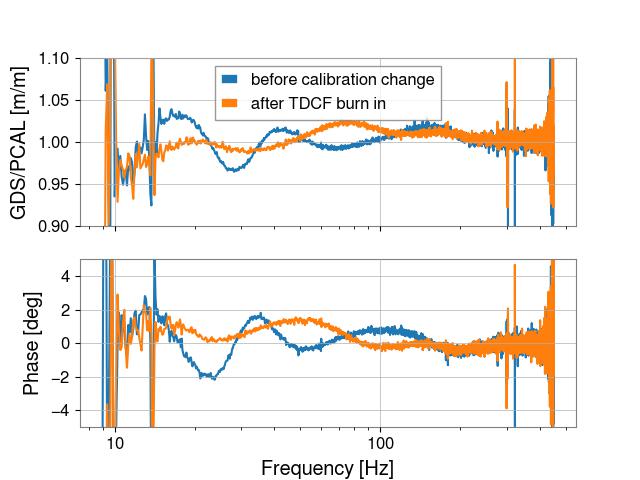
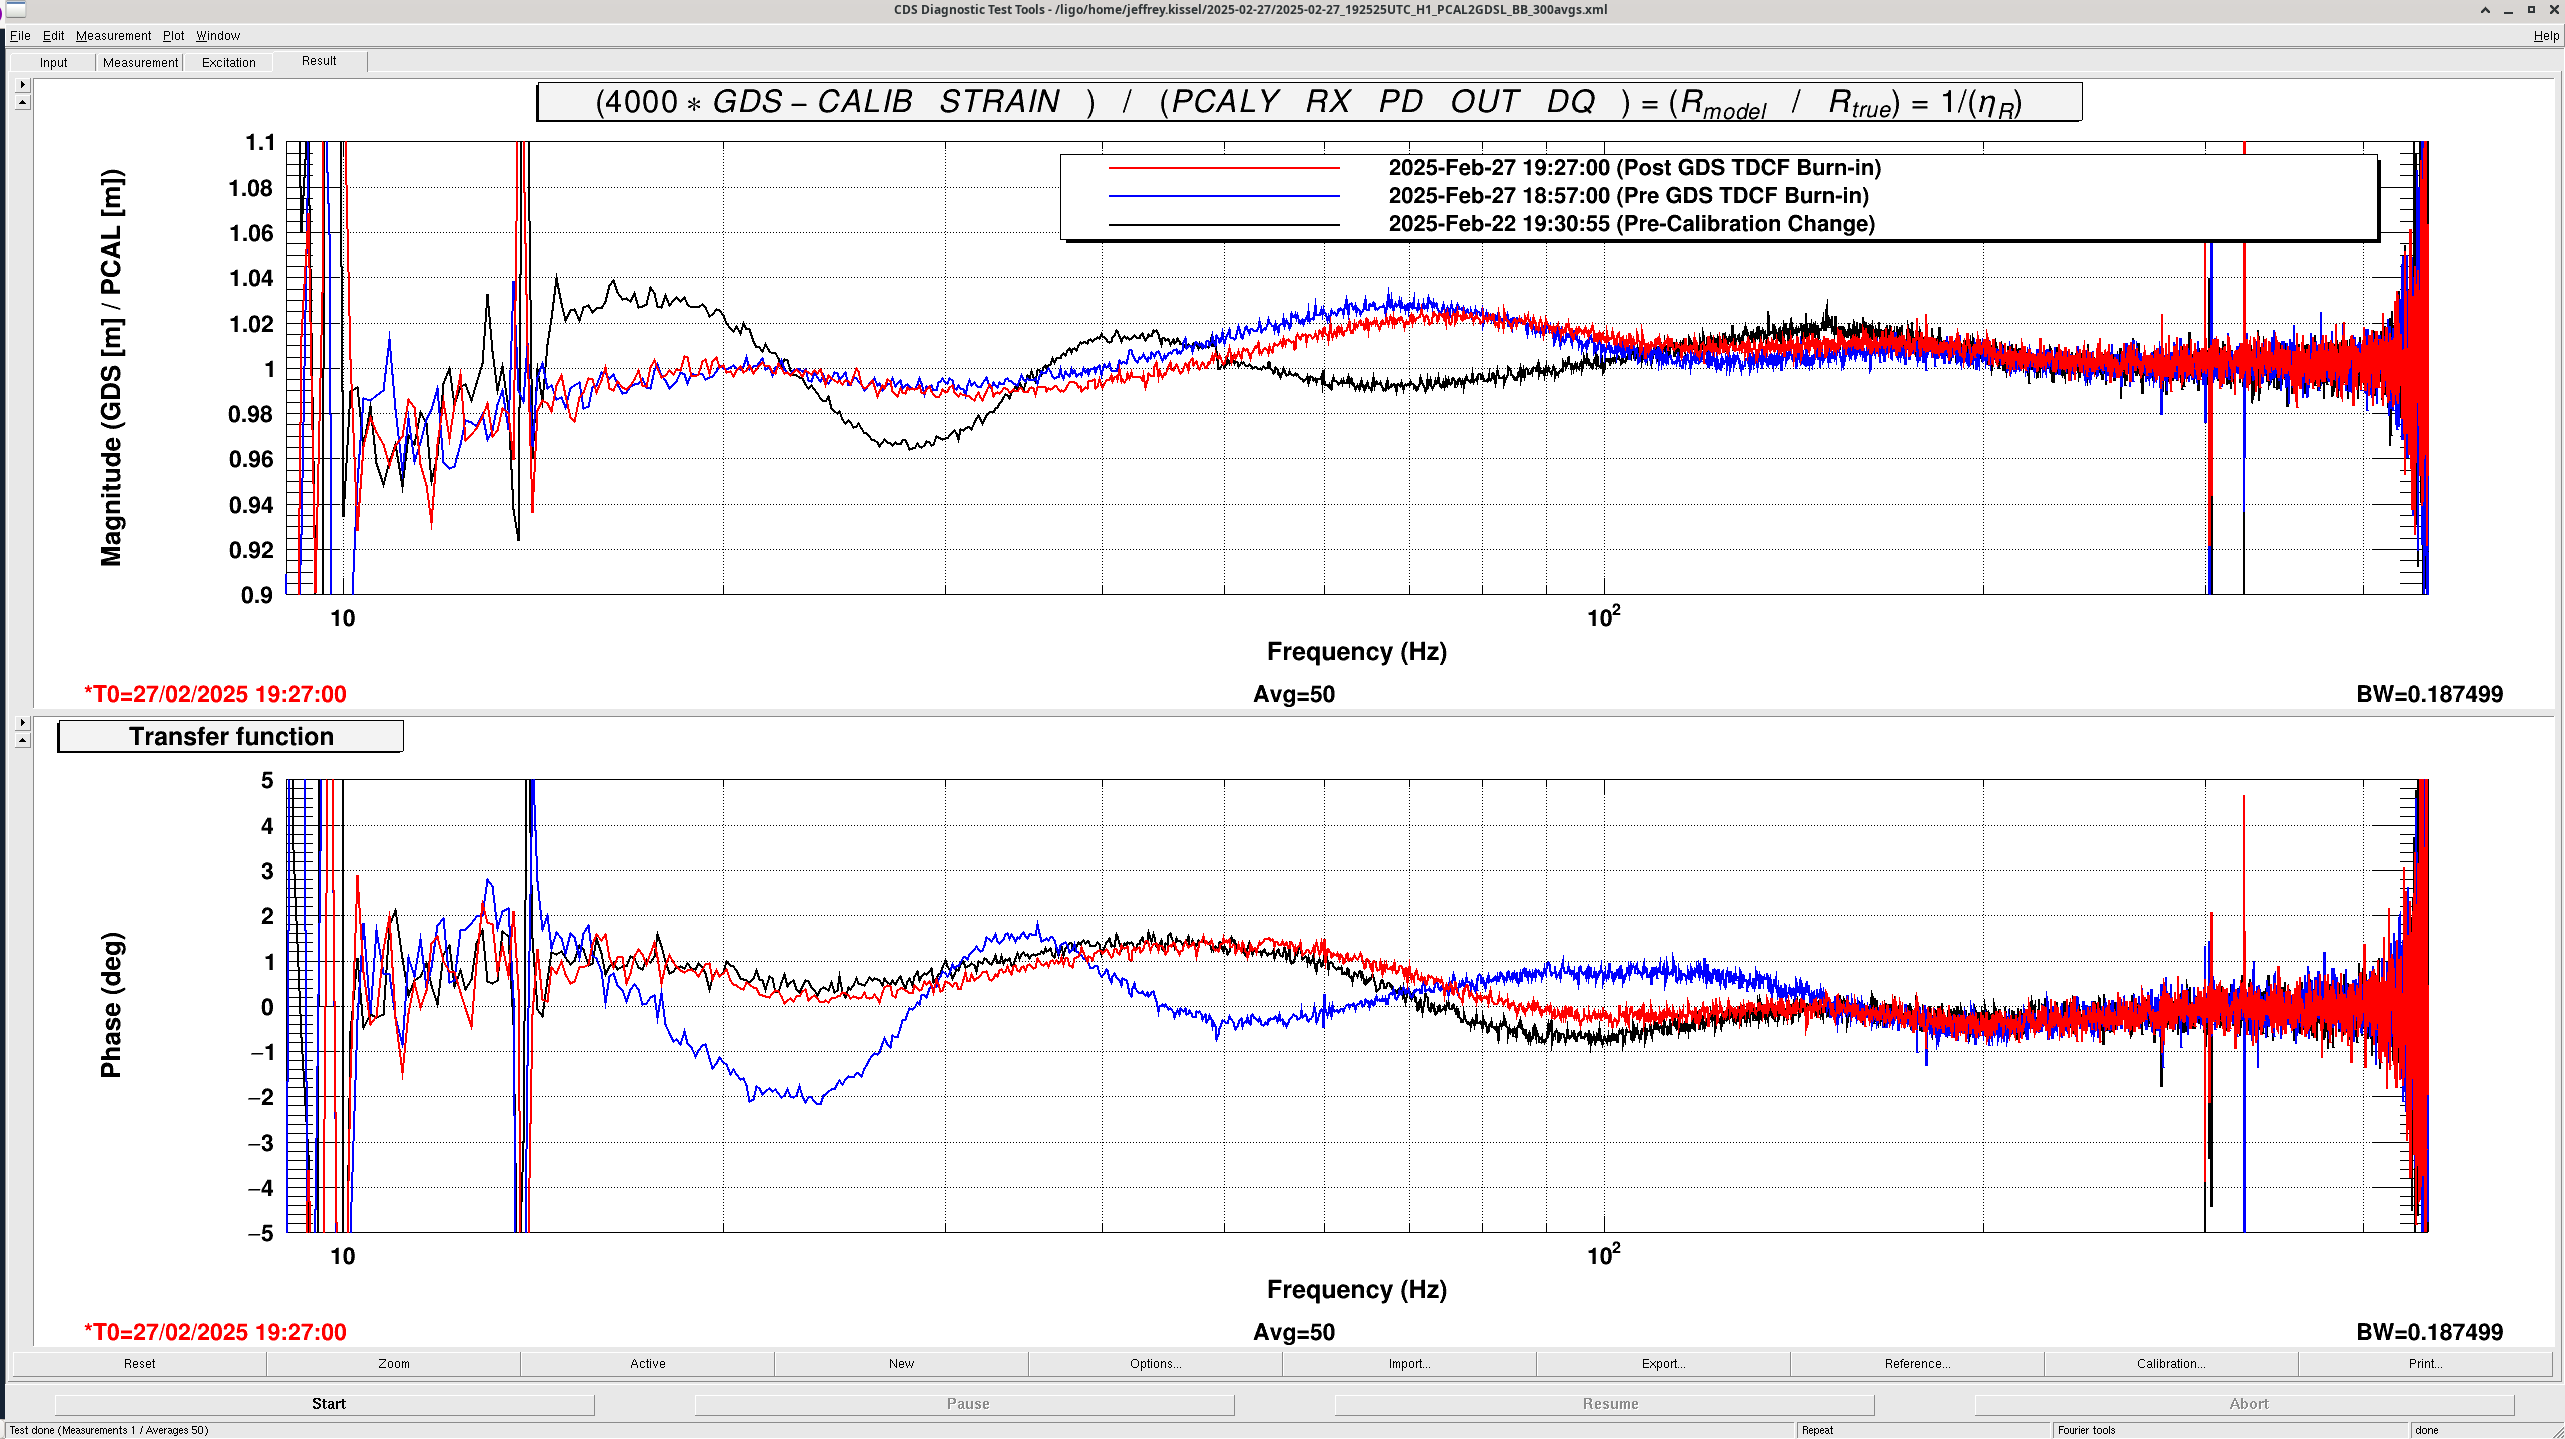
I exported the transfer functions shown in this plot (**when exporting, I noticed that the refs used for the phase got mixed up, I believe the blue phase trace corresponds to the black magnitude trace and vice versa**). For the "before" time, I used the black trace labeled "Pre-calibration change" and for the "after" time I used the red trace labeled "Post GDS TDCF Burn-in".
I pulled 30 minutes of data from the times listed above, and used GDS-CALIB_STRAIN_NOLINES for my calculations.
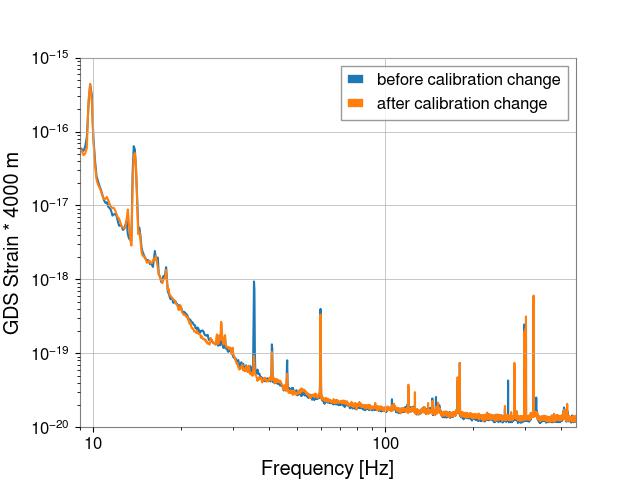
The "uncorrected" data is simply GDS-CALIB_STRAIN_NOLINES * 4000 m (that is, calibrated strain converted into meters with no Pcal correction)
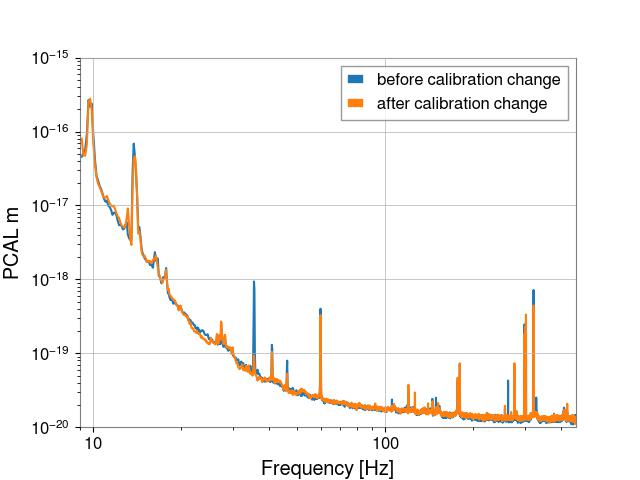
The "corrected" data is (GDS-CALIB_STRAIN_NOLINES * 4000 m) / pcal transfer function, where the pcal transfer function is the R_model / R_true exported from the DTT template above.
The PCAL transfer function is only well-measured from about 9 Hz to 450 Hz, so I cropped the PSDs to those frequencies. Finally, I used the normalized range difference method to calculate the cumulative range difference between the before and after calibration update times for both the "uncorrected" and "corrected" data.
Results:
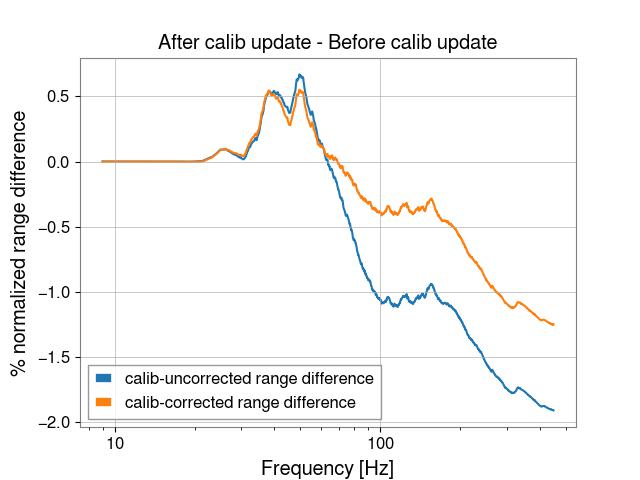
I believe these results indicate that there is excess noise present in DARM that is unrelated to the calibration change, see first attached plot. I converted the result into a percent difference, because the overall Mpc units refer to the integrated range from only 9-450 Hz, so it's not really comparable with our sensemon range calculation. This plot shows that the range increased about 0.5% between 30-50 Hz, which is present in both the uncorrected and corrected calibrated strain. However, above 50 Hz, the range is worse, and it's here where the difference in the old and new calibration is also evident. Without applying the pcal correction, the range is lower is by nearly 2%, but only about 1% with the pcal correction.
Since this is a frequency dependent effect, it is difficult to say what our overall sensmon range would be if we still had the old calibration and/or we didn't have this excess noise. However, I think it is fair to say that our excess noise has reduced our range by about 1% and the new calibration by another 1%.
I also added a plot that compares these two times, the first is GDS-CALIB_STRAIN_NOLINES * 4000 m and the second is (GDS-CALIB_STRAIN_NOLINES * 4000 m) / pcal transfer function.


