(Borja)
First of all let us compile the chronological time information of the measurements and the discharge runs:
* Measurement 1 (before any discharge): took place between UTC (2014-08-07 07:00:00) and UTC (2014-08-07 08:25:00).
* Discharge run 1: between UTC (2014-08-07 19:15:00) and UTC (2014-08-07 19:44:00).
* Measurement 2 (after 1st discharge run): between UTC (2014-08-8 18:00:00) and UTC (2014-08-8 19:30:00)
* Discharge run 2: between UTC (2014-08-08 20:48:00) and UTC (2014-08-08 21:38:00).
* Measurement 3 (after 2nd discharge run): between UTC (2014-08-10 00:00:00) and UTC (2014-08-11 02:00:00)
* Ion pumps in ETMY station was turned ON at UTC 2014-08-11 16:44:00. Notice from this entry that the ion pumps were OFF between discharge 1 and discharge 2 maybe that is why we see a charge reduction after each of these discharges. However the first charge measurement done above (before any discharge run) was done after several days of having the ion pumps on so why the ETMY had not bigger charge?
* Measurement 4 (2nd measurement after 2nd discharge run): between UTC (2014-08-11 20:31:17) and UTC (2014-08-11 23:00:00)
* Measurement 5 (3rd measurement after 2nd discharge run, this measurement is reported in this entry below): between UTC (2014-08-12 17:17:00) and UTC (2014-08-12 19:09:00)
Yesterday ETMY charge results (Measurement 3) were telling us that the ETMY was charging again since the 2nd discharge took place. What is charging the ETMY then? There are 6 mechanisms (that we can think of at the moment) that would cause ETMY charging and that they are different to the original MIT charging measurements, these are:
1) Green light (through 2 photon process). MIT measurements did not include green light tests. But the green light is not on at the moment.
2) The rubber stops on the reaction mass (seismic stoppers) with silica tips through silica to silica friction. The MIT tests did include these rubber stops and they did not observe any noticeable effect on the charging. Certainly they are installed in the ETMY reaction mass so they could be playing a role in the ETMY charging but it is hard to believe they would charge the mass so much in only 1 day.
3) LED illuminators that were turned on from the first discharge run to see effect on the ETMY surface. They have not been turned off since (although there is no reason to keep them on at the moment apart of testing the current charging hypothesis). Again it is hard to believe that a broad angle not extremely bright LED can charge so much a mass in only 1 day.
4) First contact. For the original MIT tests the masses were not covered with first contact. It is not secret that then removing the first contact layer the mass is charged. But no first contact has been applied or removed for the length of the discharging measurements.
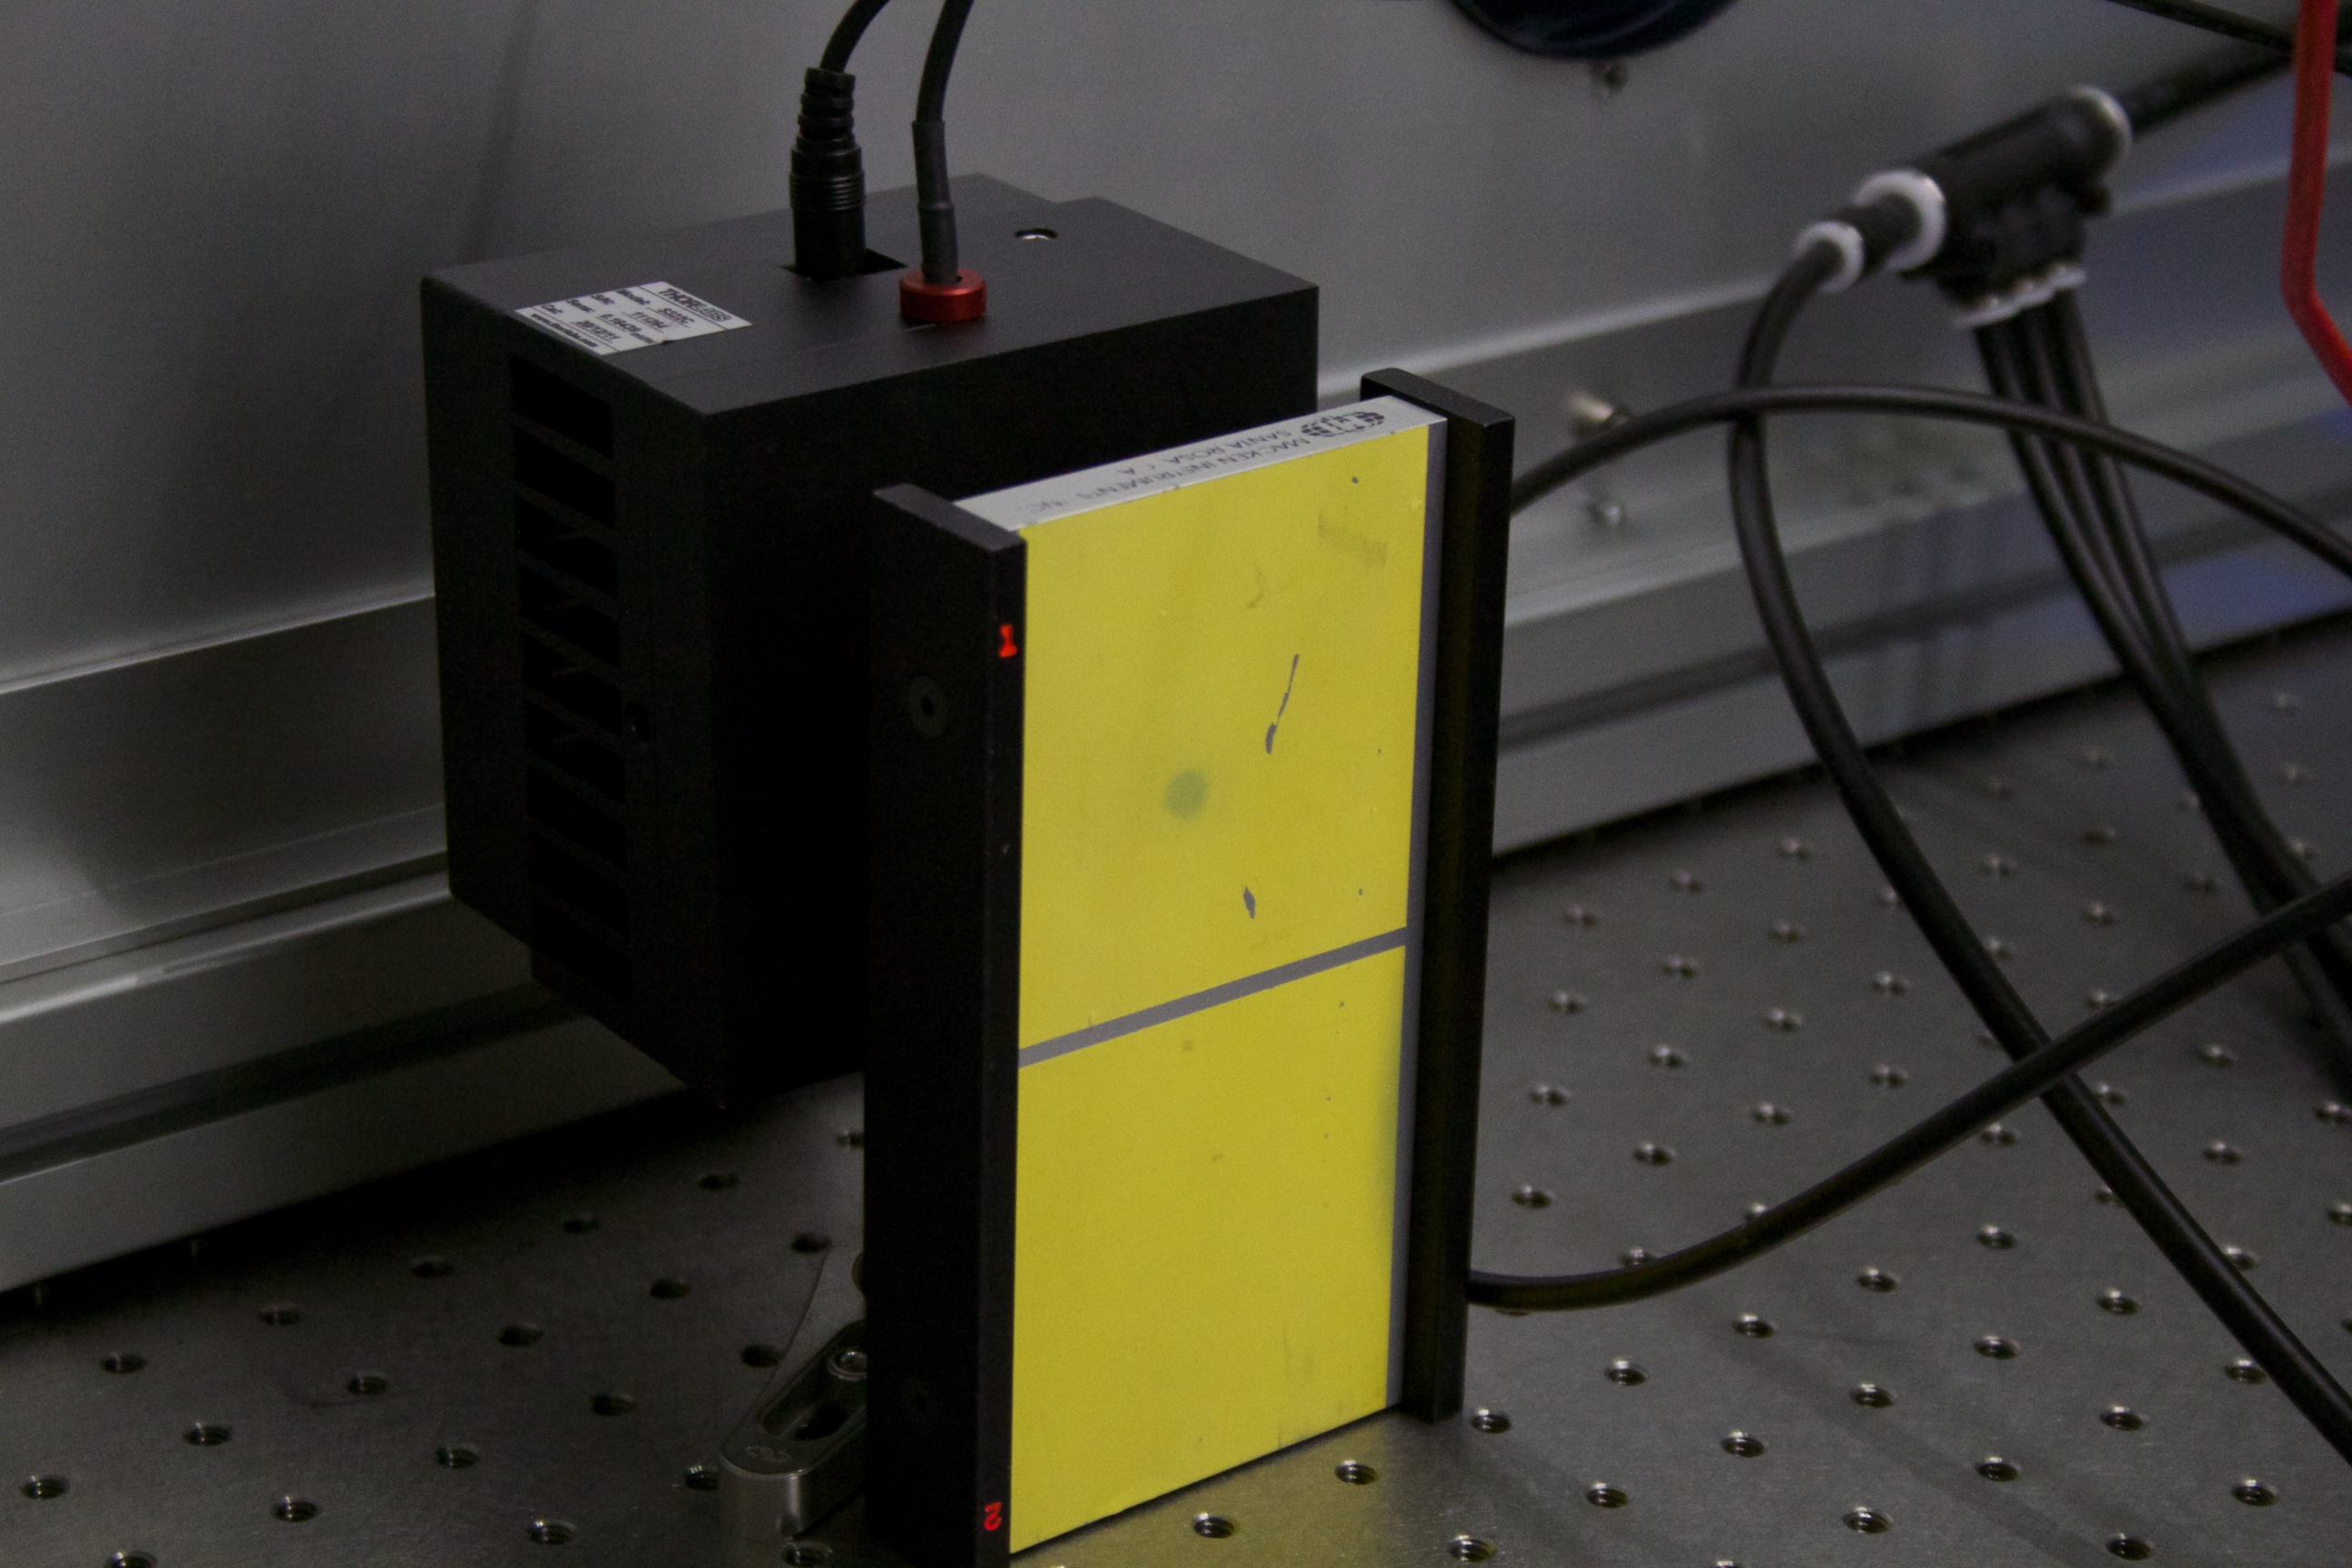
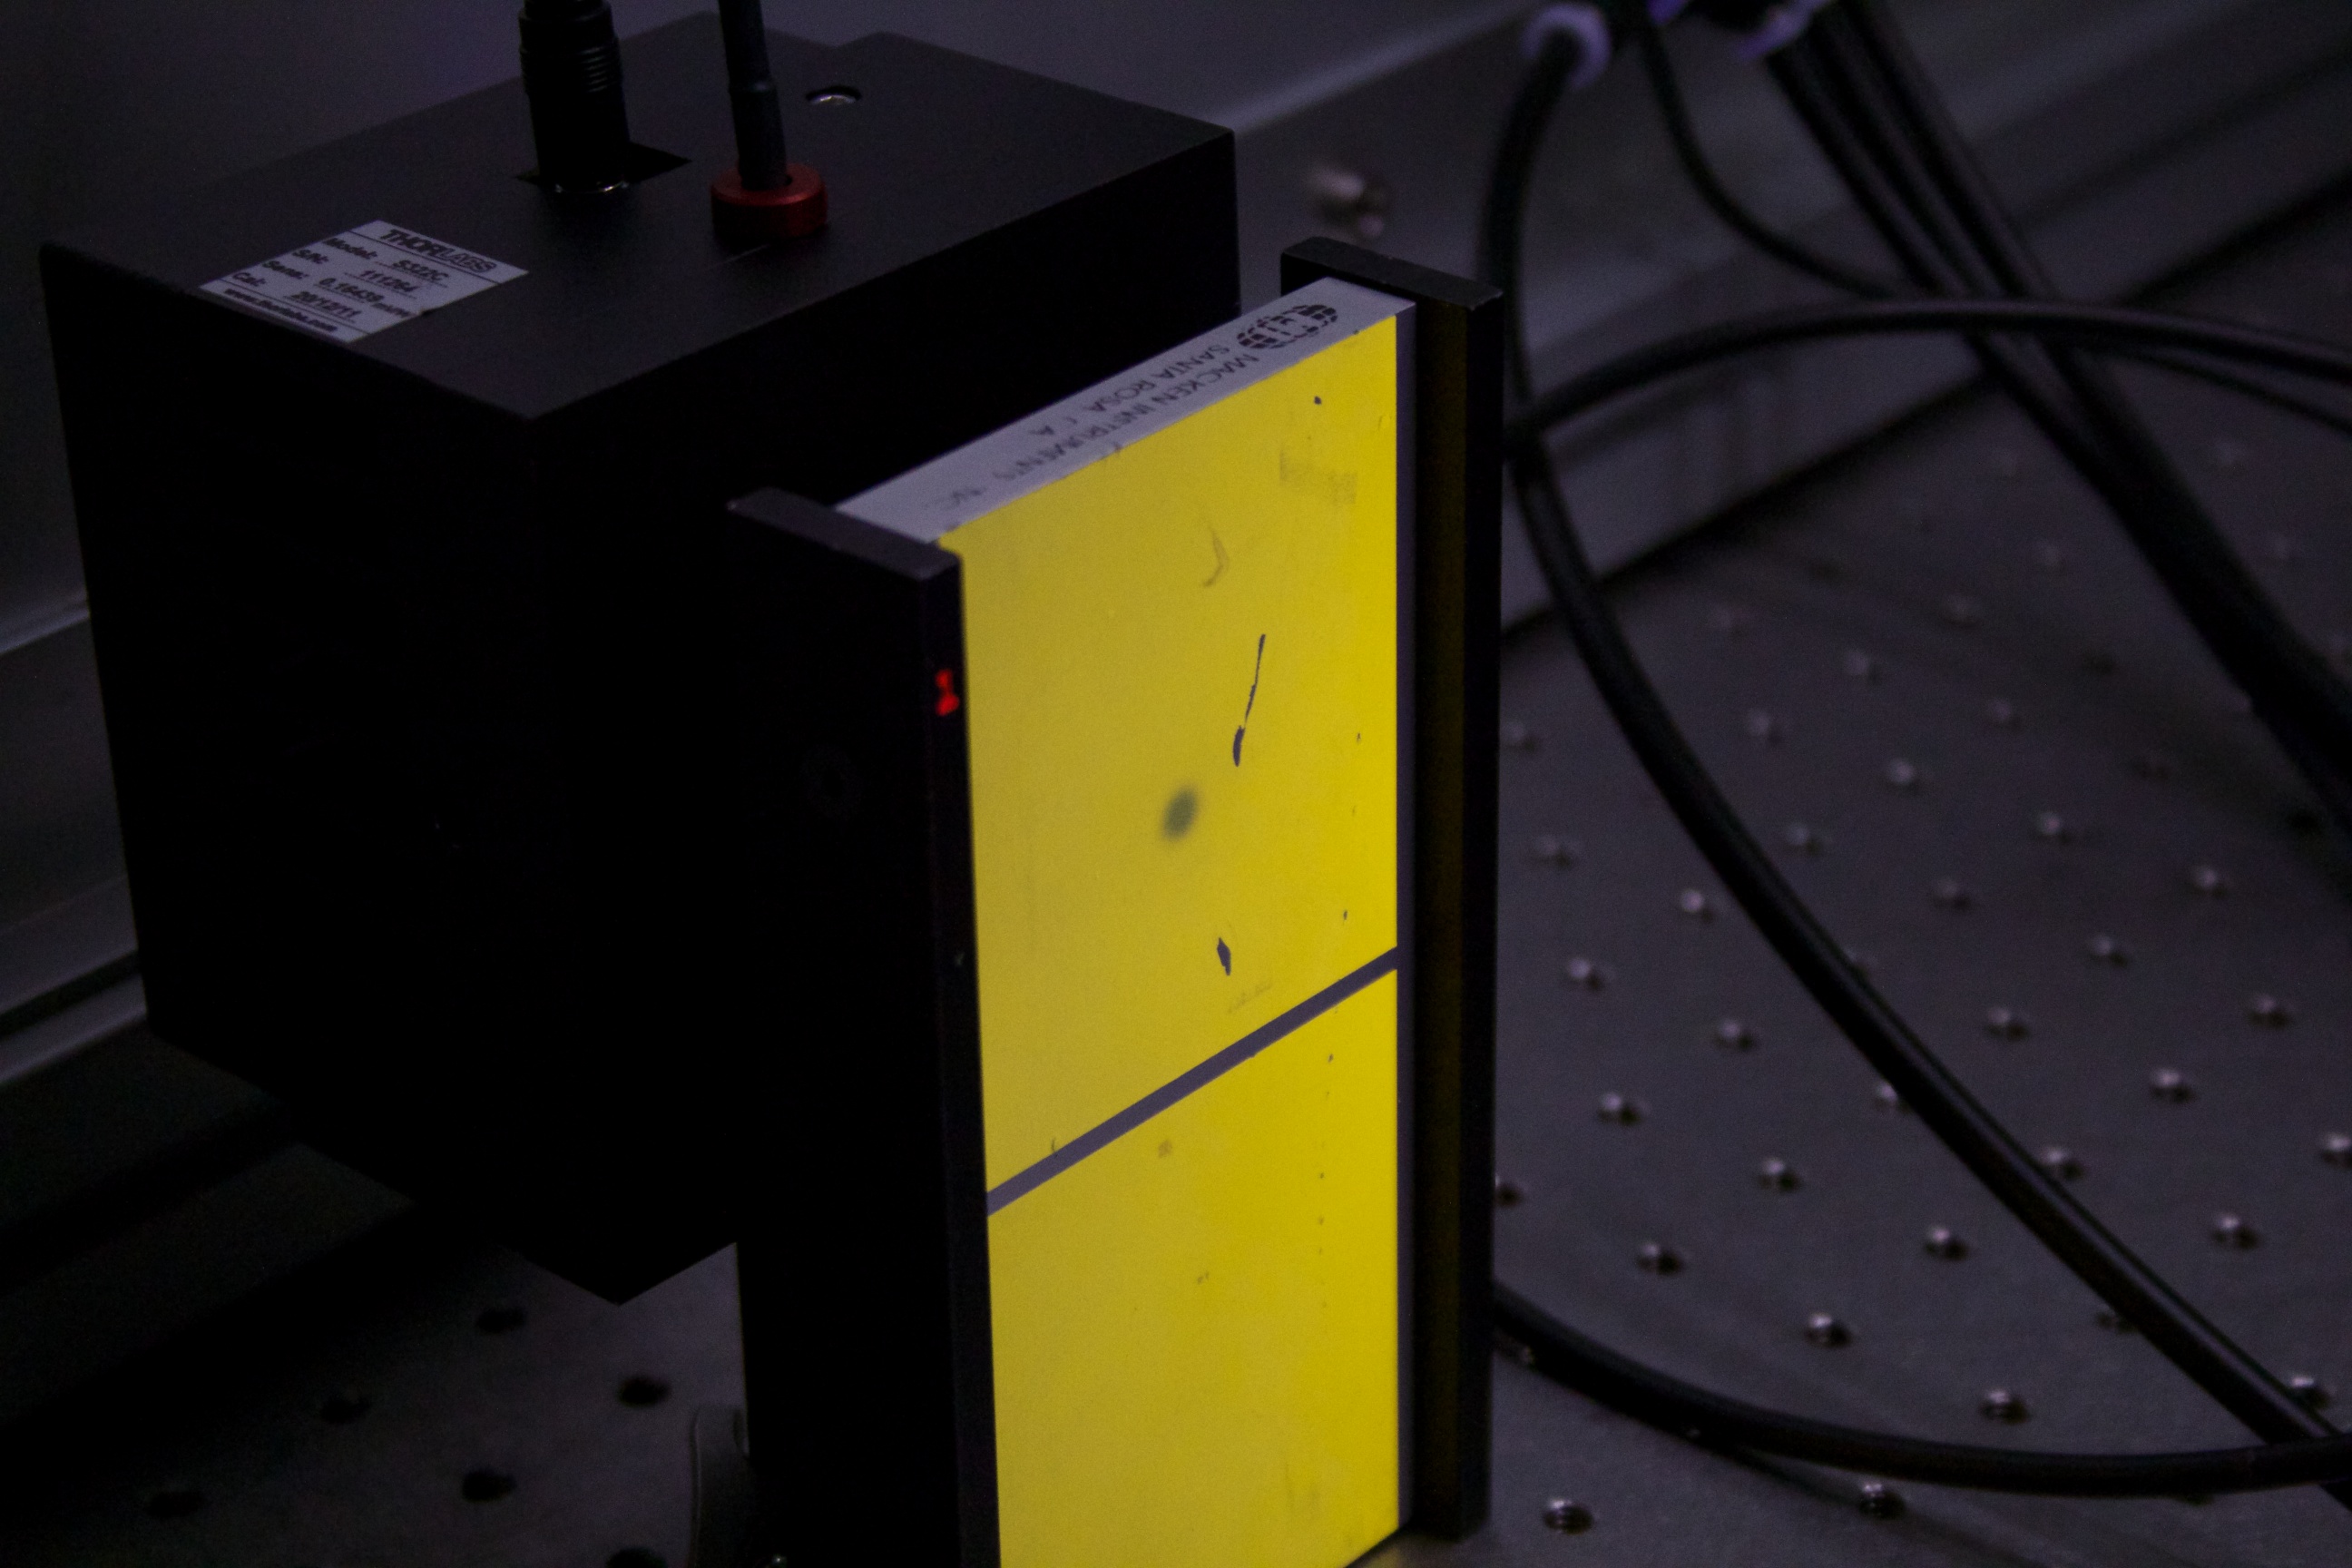
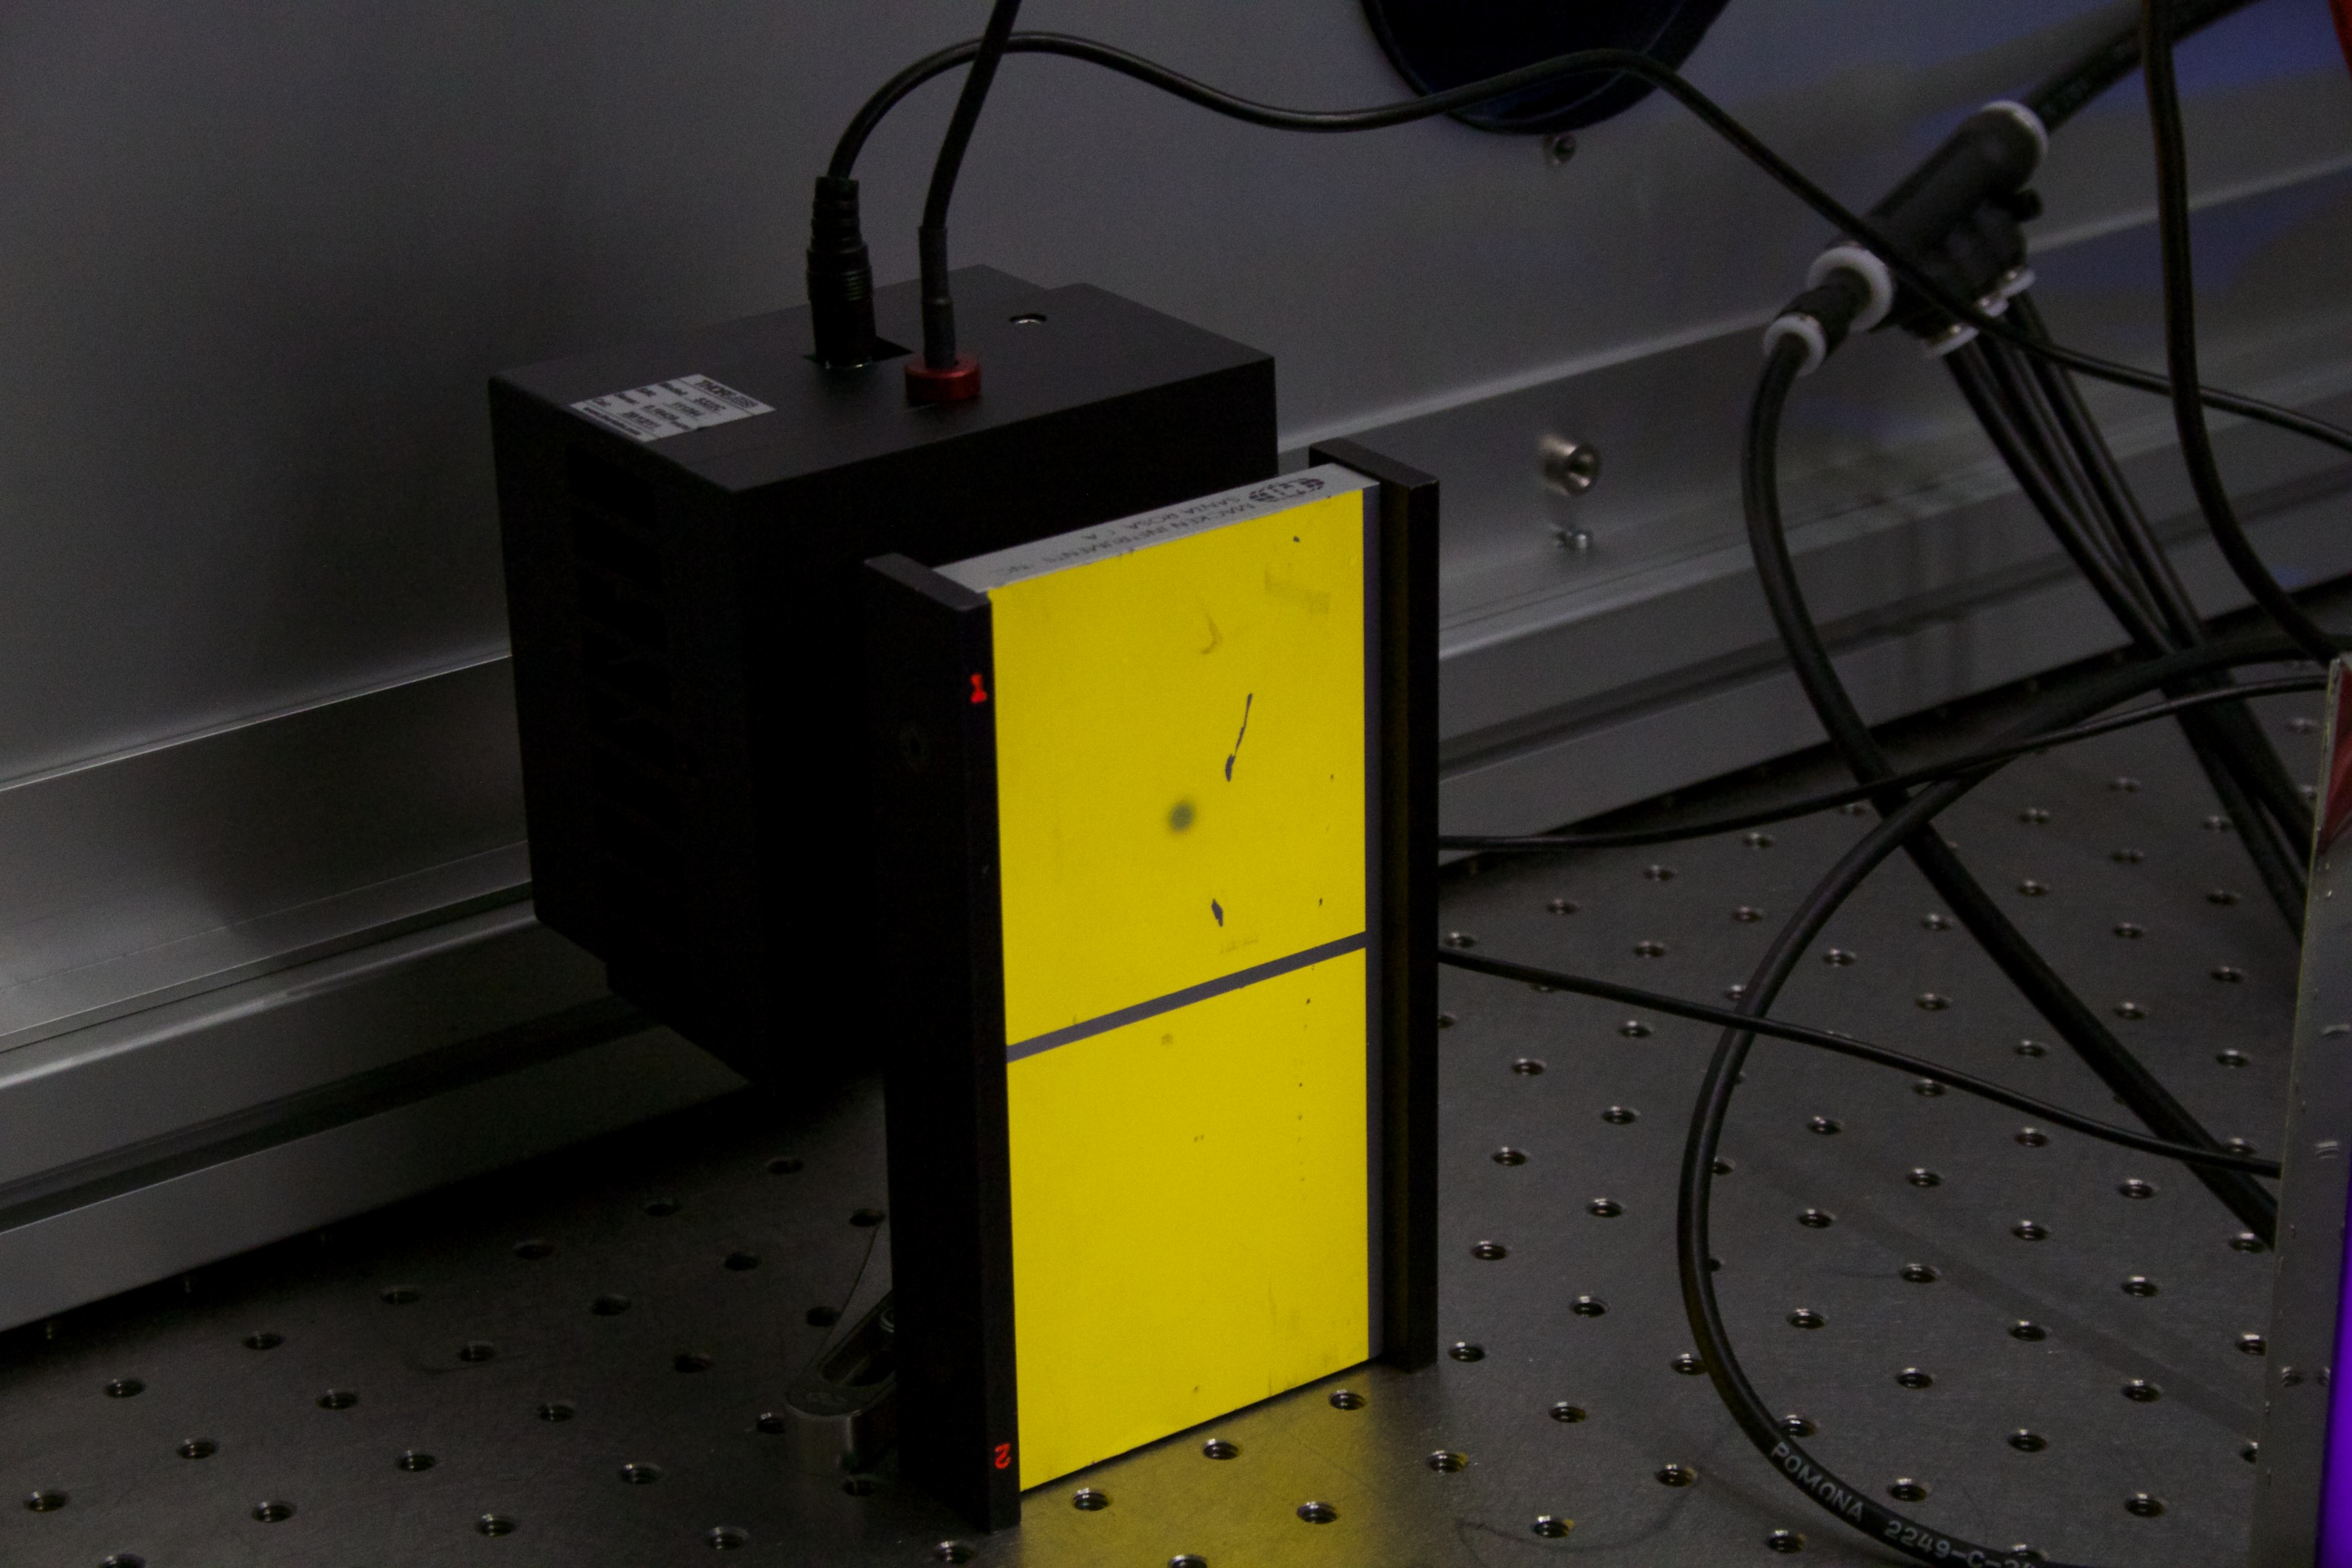
5) Discharge gage (aka 'cold cathod') this is the very low pressure sensor at the ETMY tank (BSC10). It operates in a similar fashion to an ion pump in which uses ion to pump out some air to sense the pressure. The amount of ions this one uses is considerably smaller than the ion pump (see below) however it is much closer to the ETMY mass.
6) Ion pumps. This is a new game player. The MIT ion pumps were not used during their tests, so there is not measurement of their effect on the mass charge. Torsion experiments with fused silica fibres indicate that ion pumps do cause considerable charging. As I have describe above this is consisten with what we have seen. The ion pumps were OFF between discharge runs and in both cases we measured charge reduction on the ETMY, however after they were turned on they ETMY started to charge again (notice that the LED iluminators were ON during the 2nd discharge and never turned OFF yet so if it was the iluminator charging the ETMY then why we saw charge reduction one day after the discharge?). The only think that may not agree with the ion pump being the charger is why the first measurement (Measurement 1) shows such small charging levels while the ion pumps were ON for days before that measurement took place?
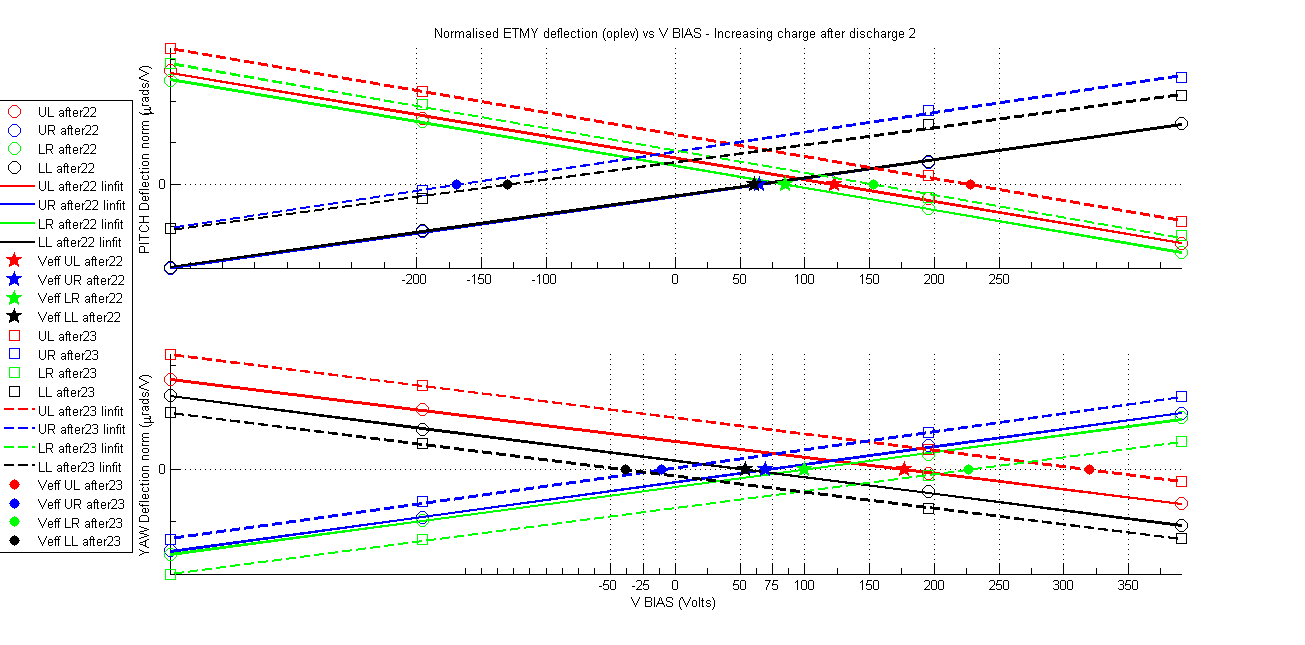
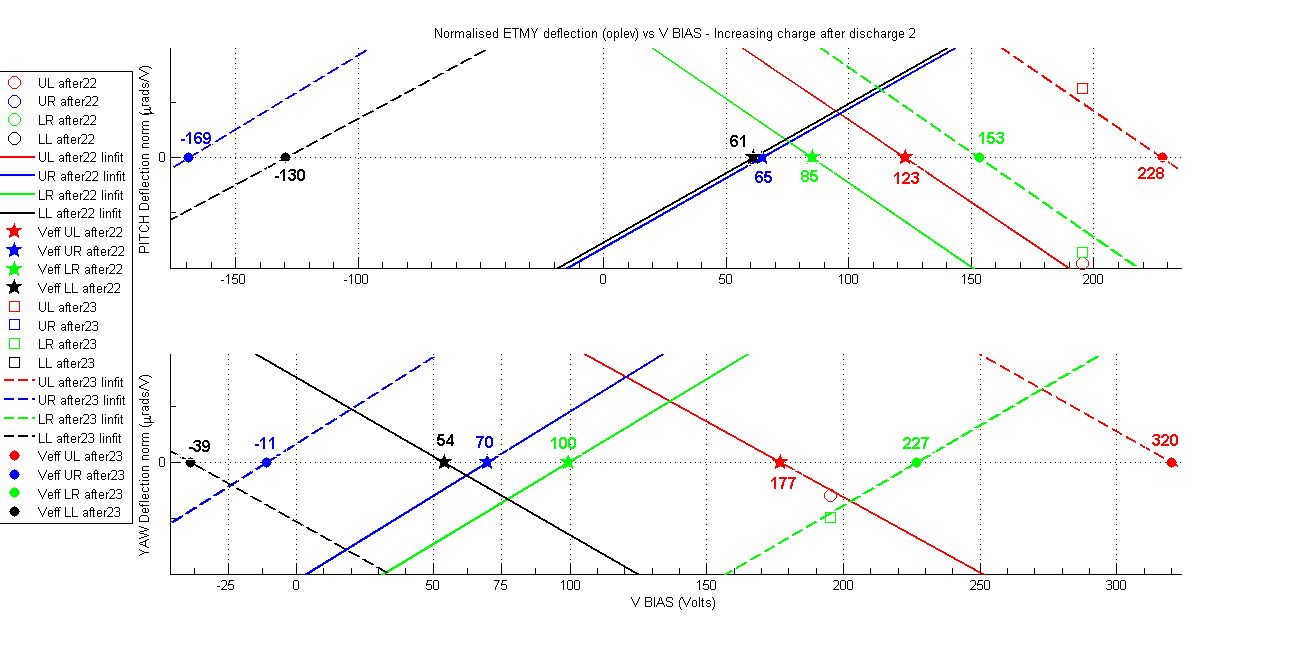
However let's see now the results of today's measurement (nothing was changed respect to yesterday's measurement) there is only 1 day different in the measurement, see notes with the measurement values attached here as well as the plots of Normalized pitch and yaw deflection vs. VBIAS comparing measurements of today (identified in the legend as ending with 23) with the ones from yesterday (identified in the legend as ending with 22), I have also plotted a zoom version looking at the Veff (or zero crossing of the deflections. I show next the table summary with red for yesterday's results and green for today's. It is clear that the EMTY has charged considerably, which again seems to confirm the ion pump charger hypothesis.
|
|
UL after22
|
UL after23
|
UR after22
|
UR after23
|
LL after22
|
LL after23
|
LR after22
|
LR after23
|
|
Veff PITCH [V]
|
123
|
228
|
65
|
-169
|
61
|
-130
|
85
|
153
|
|
PITCH slope [10-7 µrad/V]
|
-2.565
|
-2.606
|
2.1605
|
2.305
|
2.154
|
2.053
|
-2.612
|
-2.635
|
|
Veff YAW [V]
|
177
|
320
|
70
|
-11
|
54
|
-39
|
100
|
227
|
|
YAW slope [10-7 µrad/V]
|
-2.178
|
-2.226
|
2.428
|
2.489
|
-2.271
|
-2.215
|
2.374
|
2.308
|
Still there is one more variable in all this charging measurement game. Remember that one of the ESD quadrants could not be driven (quadrant LL) because its driving signal was going through the ESD low pass filter box, designed to filter the ESD BIAS frequencies above 1Hz, and the driving signal for these measurements is at 4Hz. This was solved before yesterday’s measurements, however are we sure that this change has not caused a different electric field configuration on the ETMY therefore making it incomparable with any other previous measurement? I had tried to run another measurement by bringing the cable configuration to the original case however between some power glitches bring the CDS down and affecting the suspensions controls at end station together with the higher seismic noise due to the sand storm has so far made this measurement impossible as the SNR is too low.
At the moment the ESD cables are as per the old configuration.