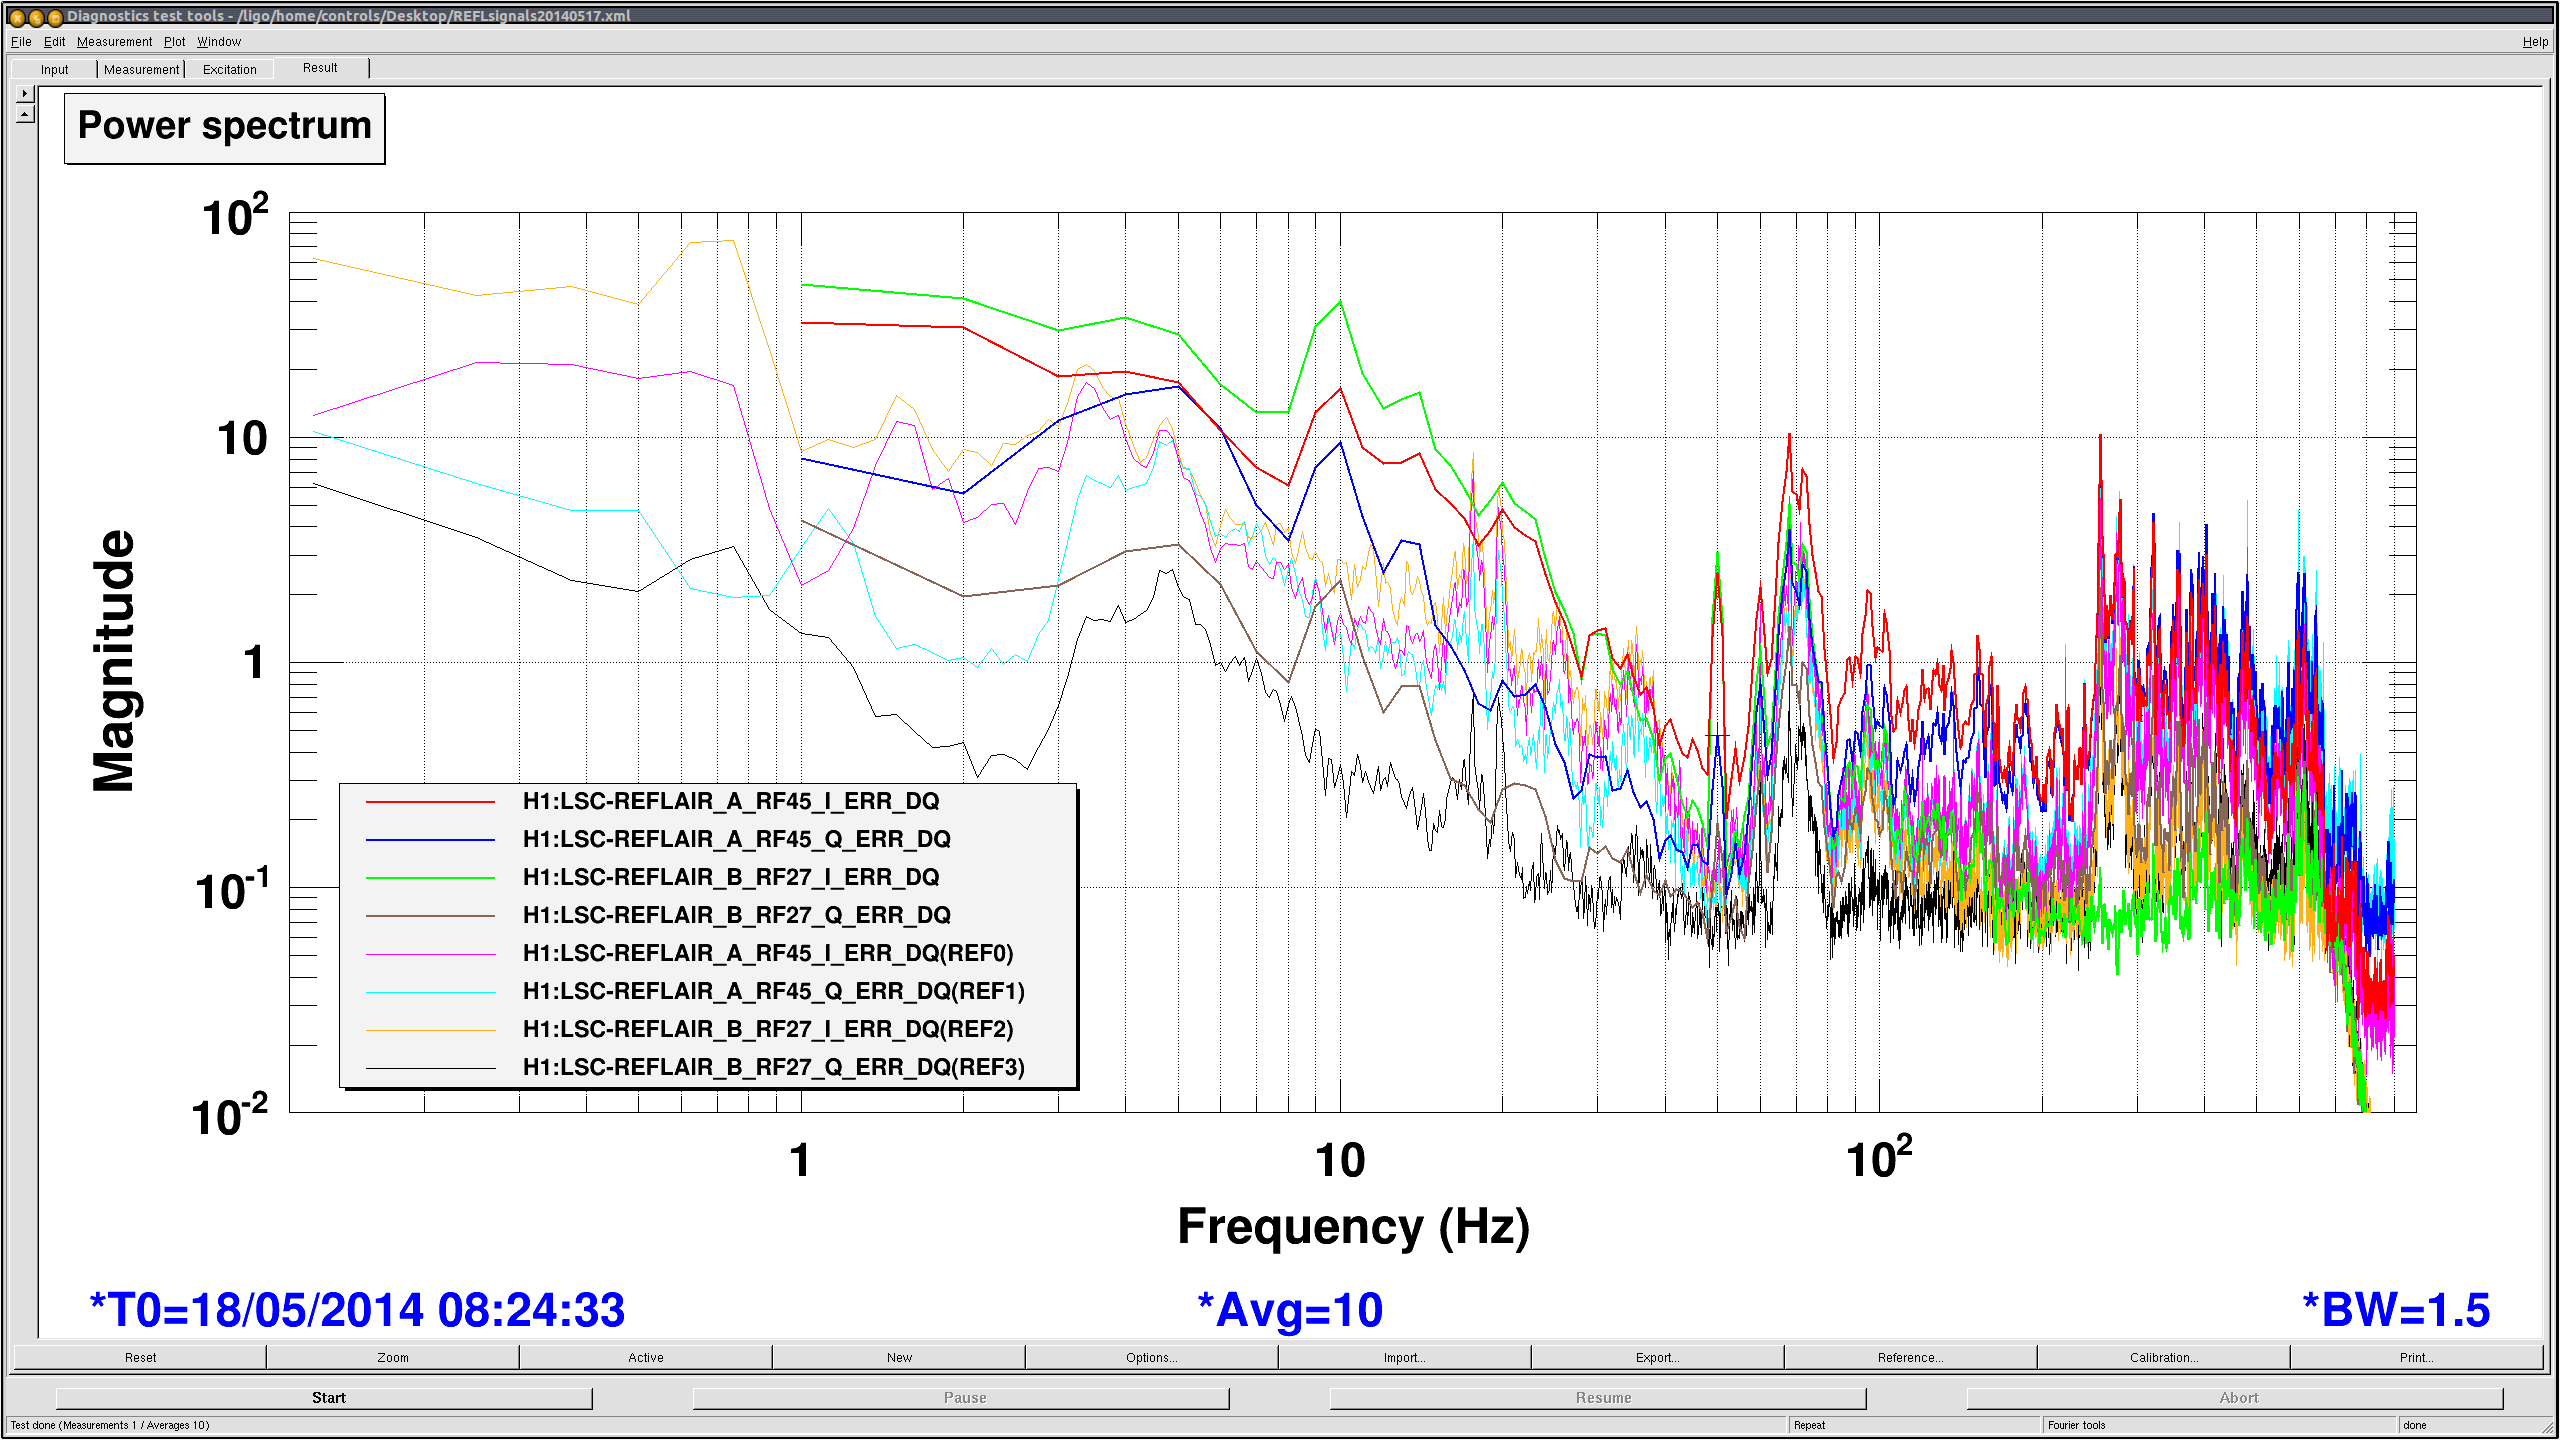
On friday night, the wind was high(~25mph), and the arm was hard to lock. Although the angular motion of the test masses was not particularly different than on a quiet night. First attachement shows the oplev spectra from friday night, when the wind was ~25mph. second attachement shows spectra from yesterday night with a 5mph wind.
To note :
- RMS of ETMY (blue curve) in pitch and yaw are consistently higher, even though the ISIs are in the same config (level 3 controller and Tbetter blends on St1 and St2 except for Rx and Rz)
- ITMX (pink curve) seems to perform better, but it's actually because the oplev beam is offcentered from the qpd, sitting mostly on S4 quadrant. SUM is ~5900

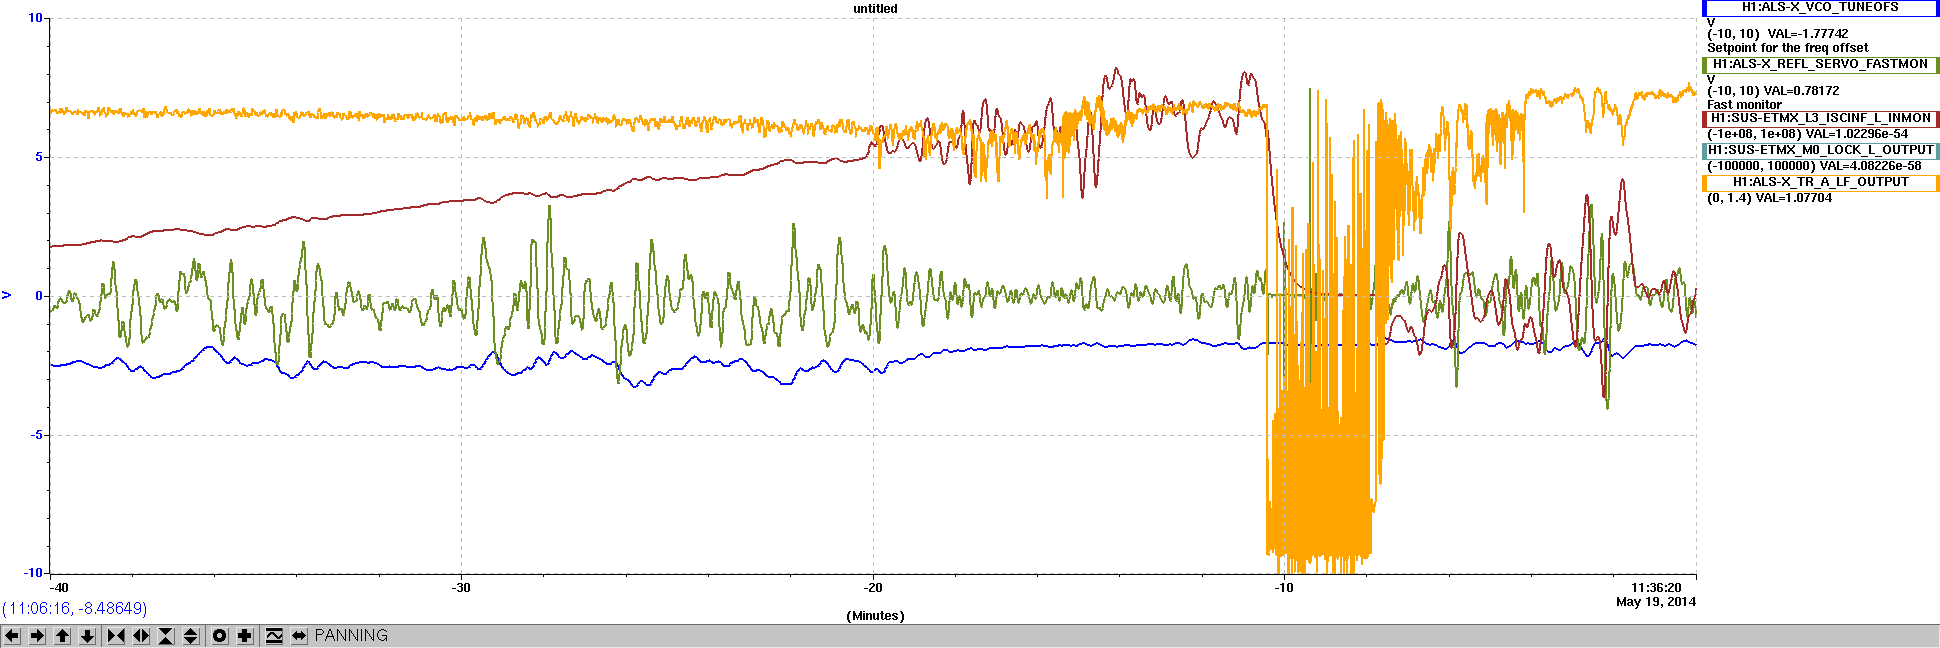
We tracked down the problems we had in the past windy nights to be related with the ALS tidal tuning , but it is still good to make these plots with the OpLEv signals.
However, I think your plots didn't turn out the way you wanted to. There is only YAW in the second attachment.
Also, it would be easier to make a comparison if you put windy/quiet curves for each DOF in the same plot. Thanks!
thanks for noticing!
Attached are some other plots :
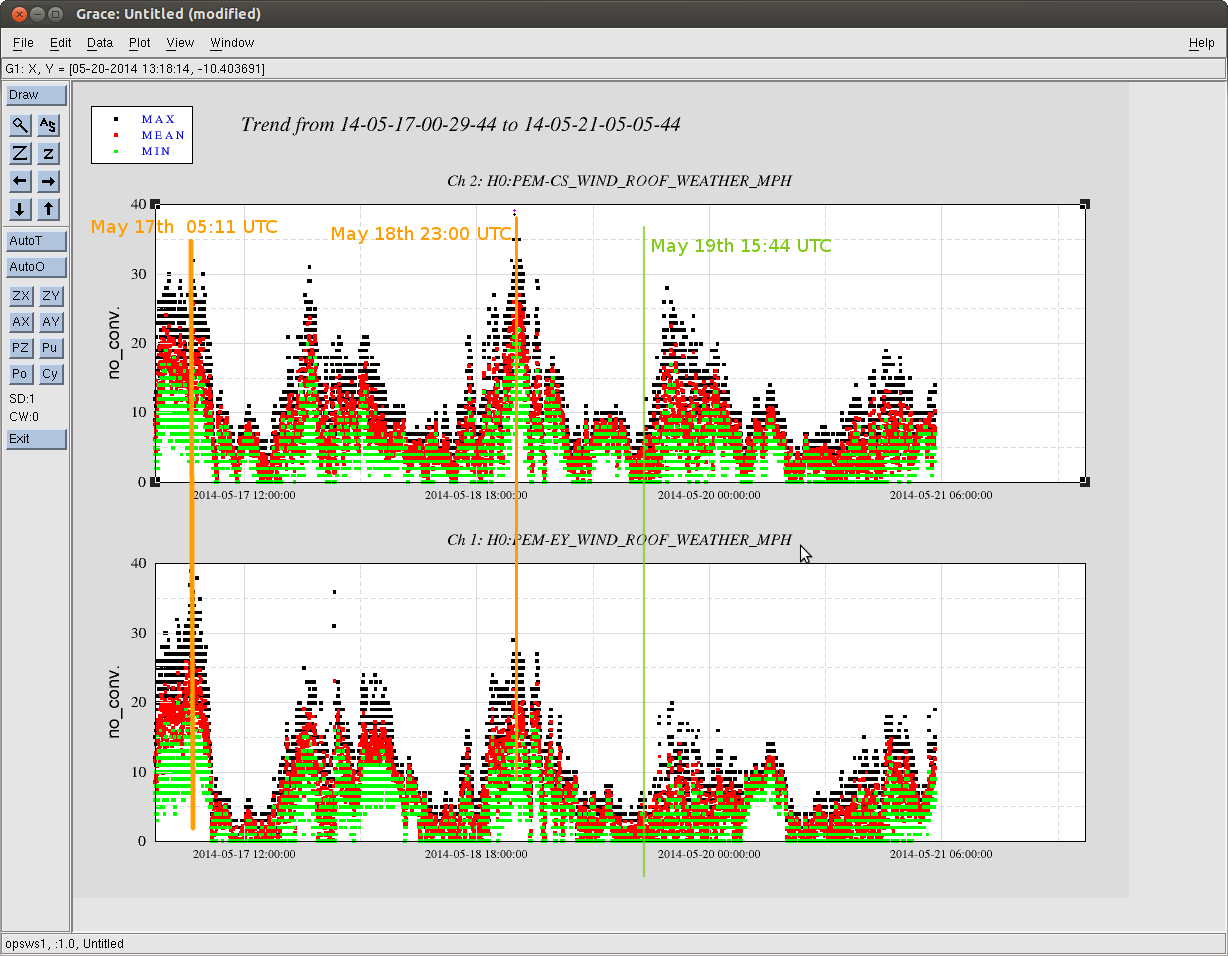
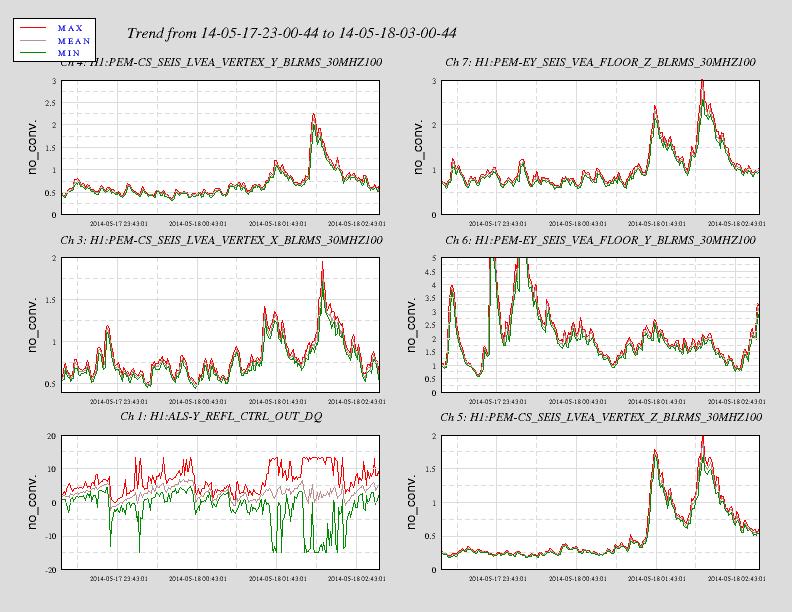
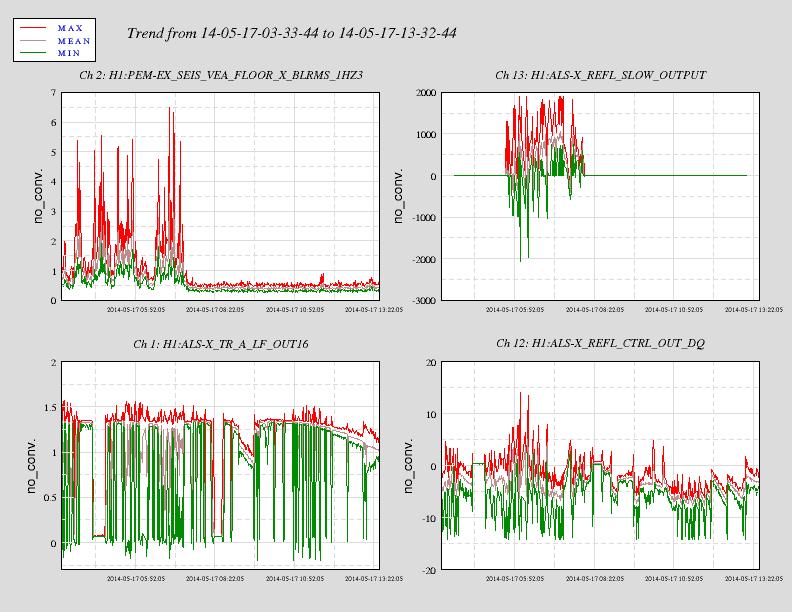
1. wind at corner and endy stations between may 17th/may 20th. High winds references are marked in orange, low winds is in green
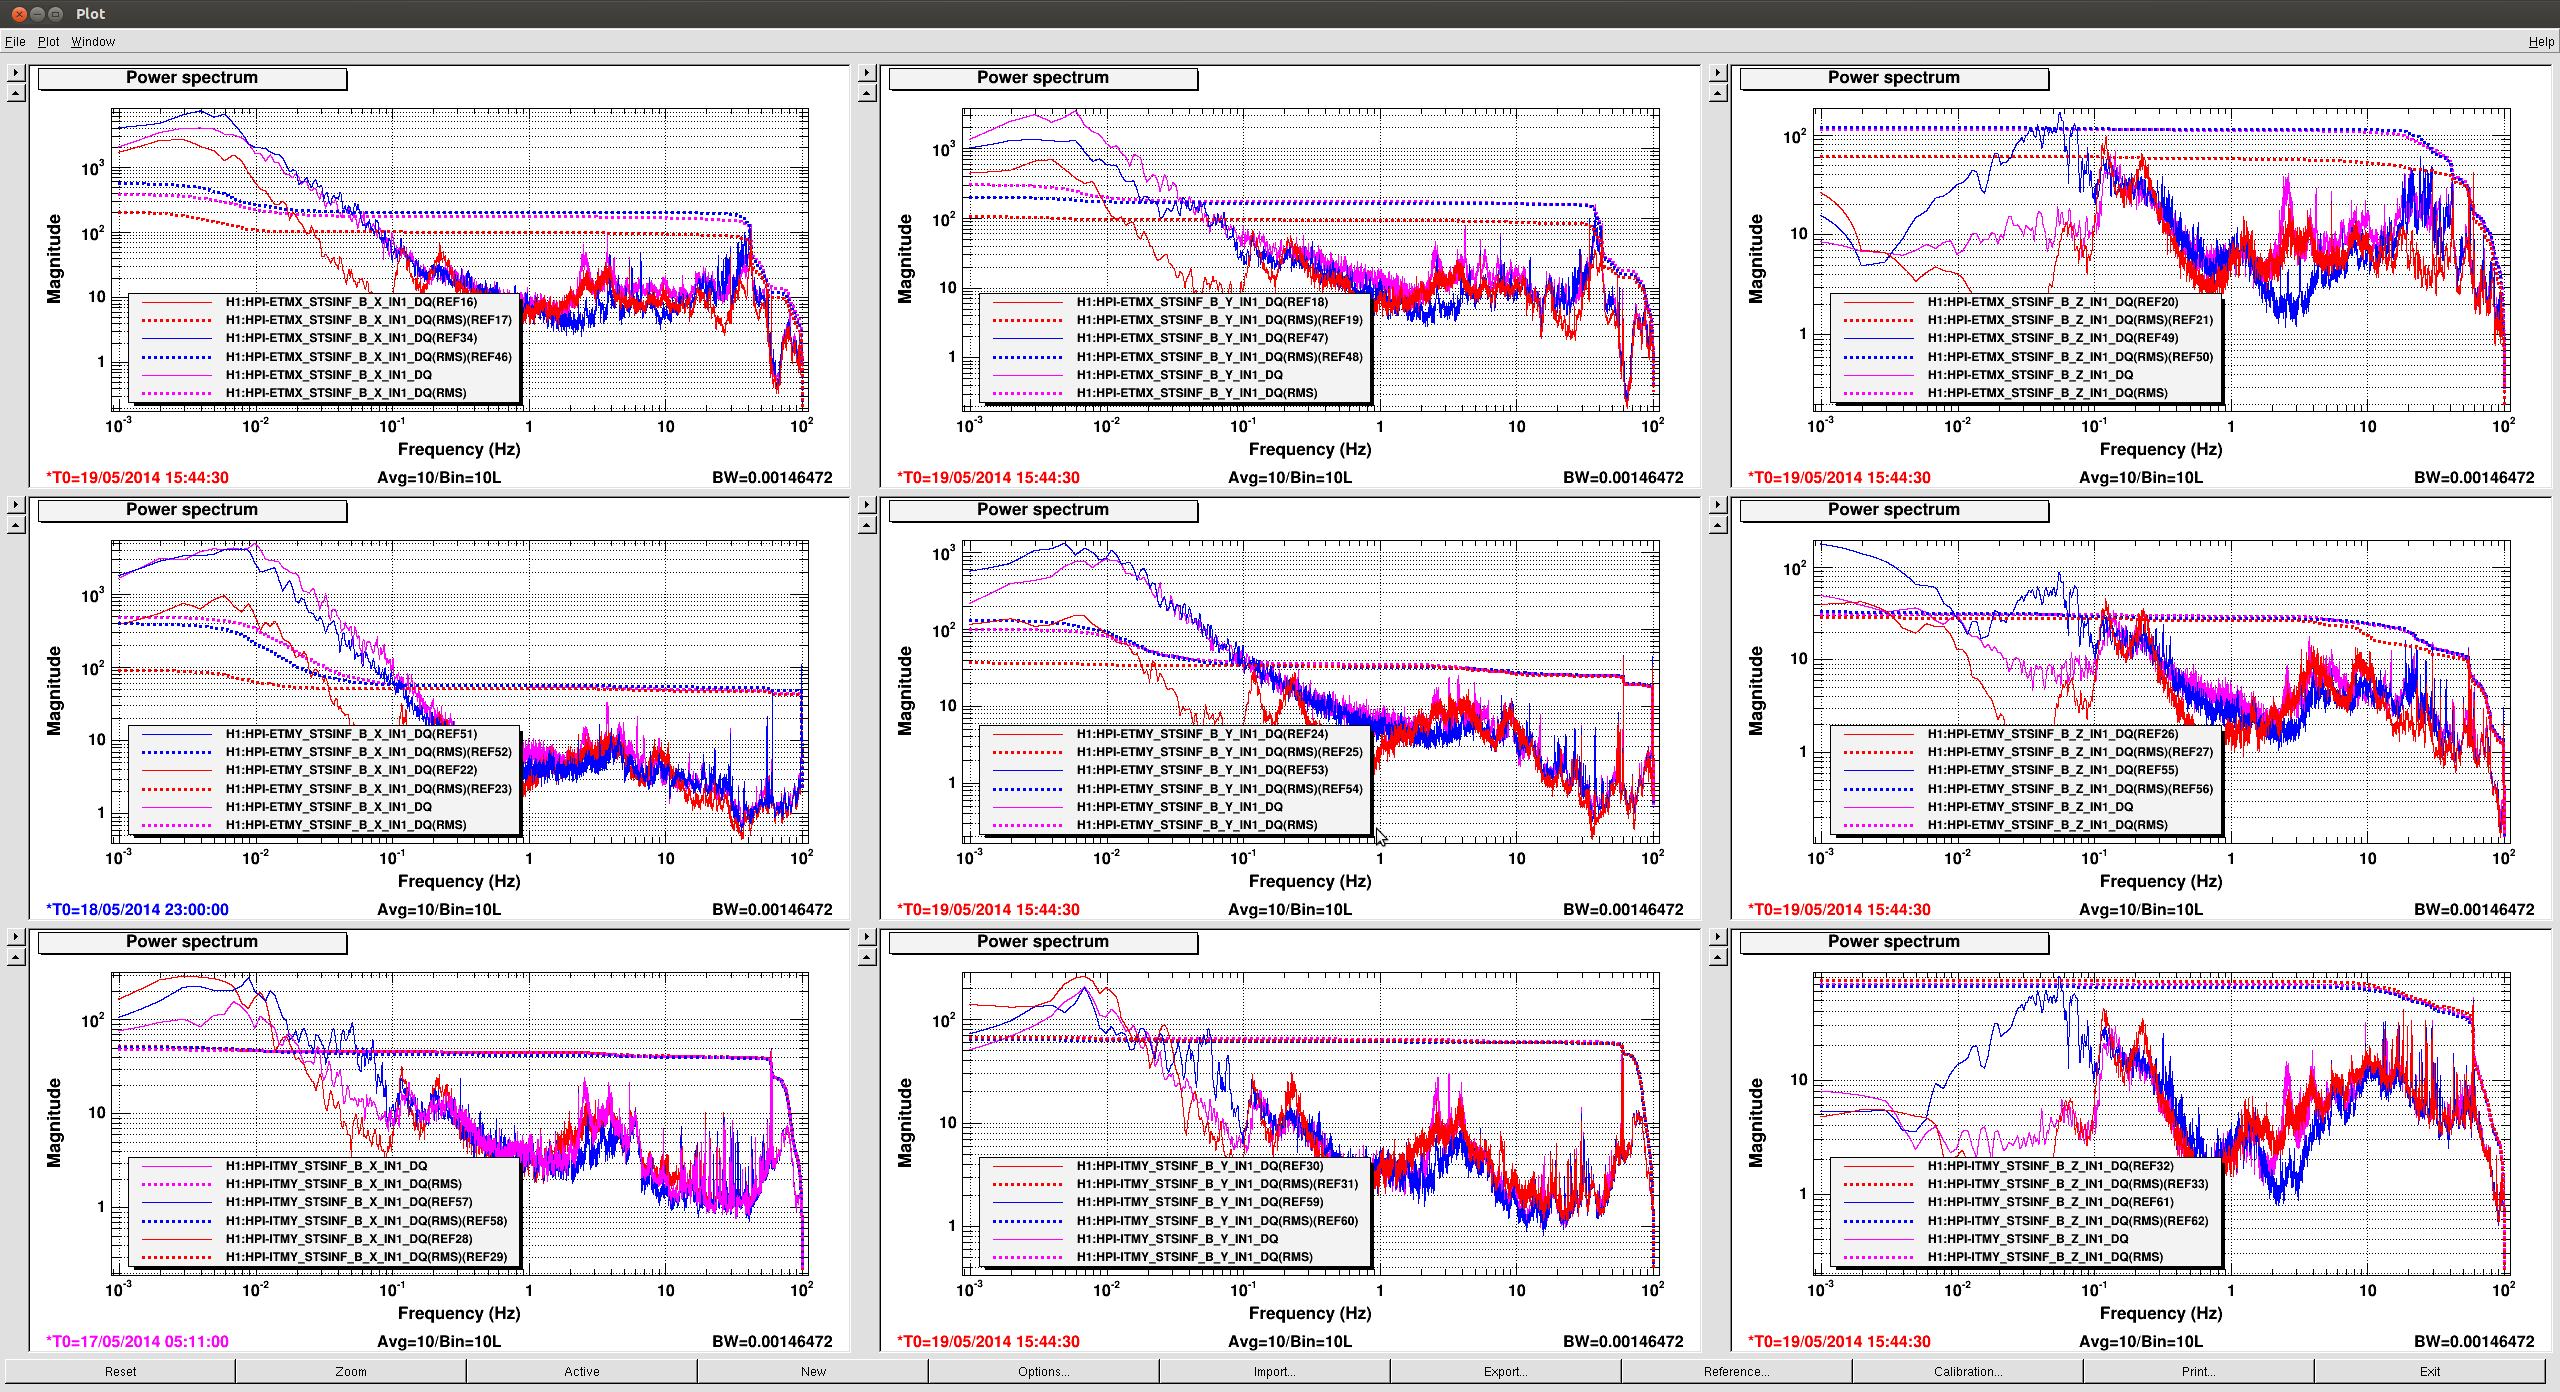
2. Spectra comparison of ground sensors (HEPI STS) at end and corner stations with different winds. Blue and pink curves are during high winds (blue = may 17th, pink = may 18th). Red is during low winds (may 19th). From top to bottom rows : ETMX ETMY and ITMY. From left to right : X Y Z degrees of freedom.
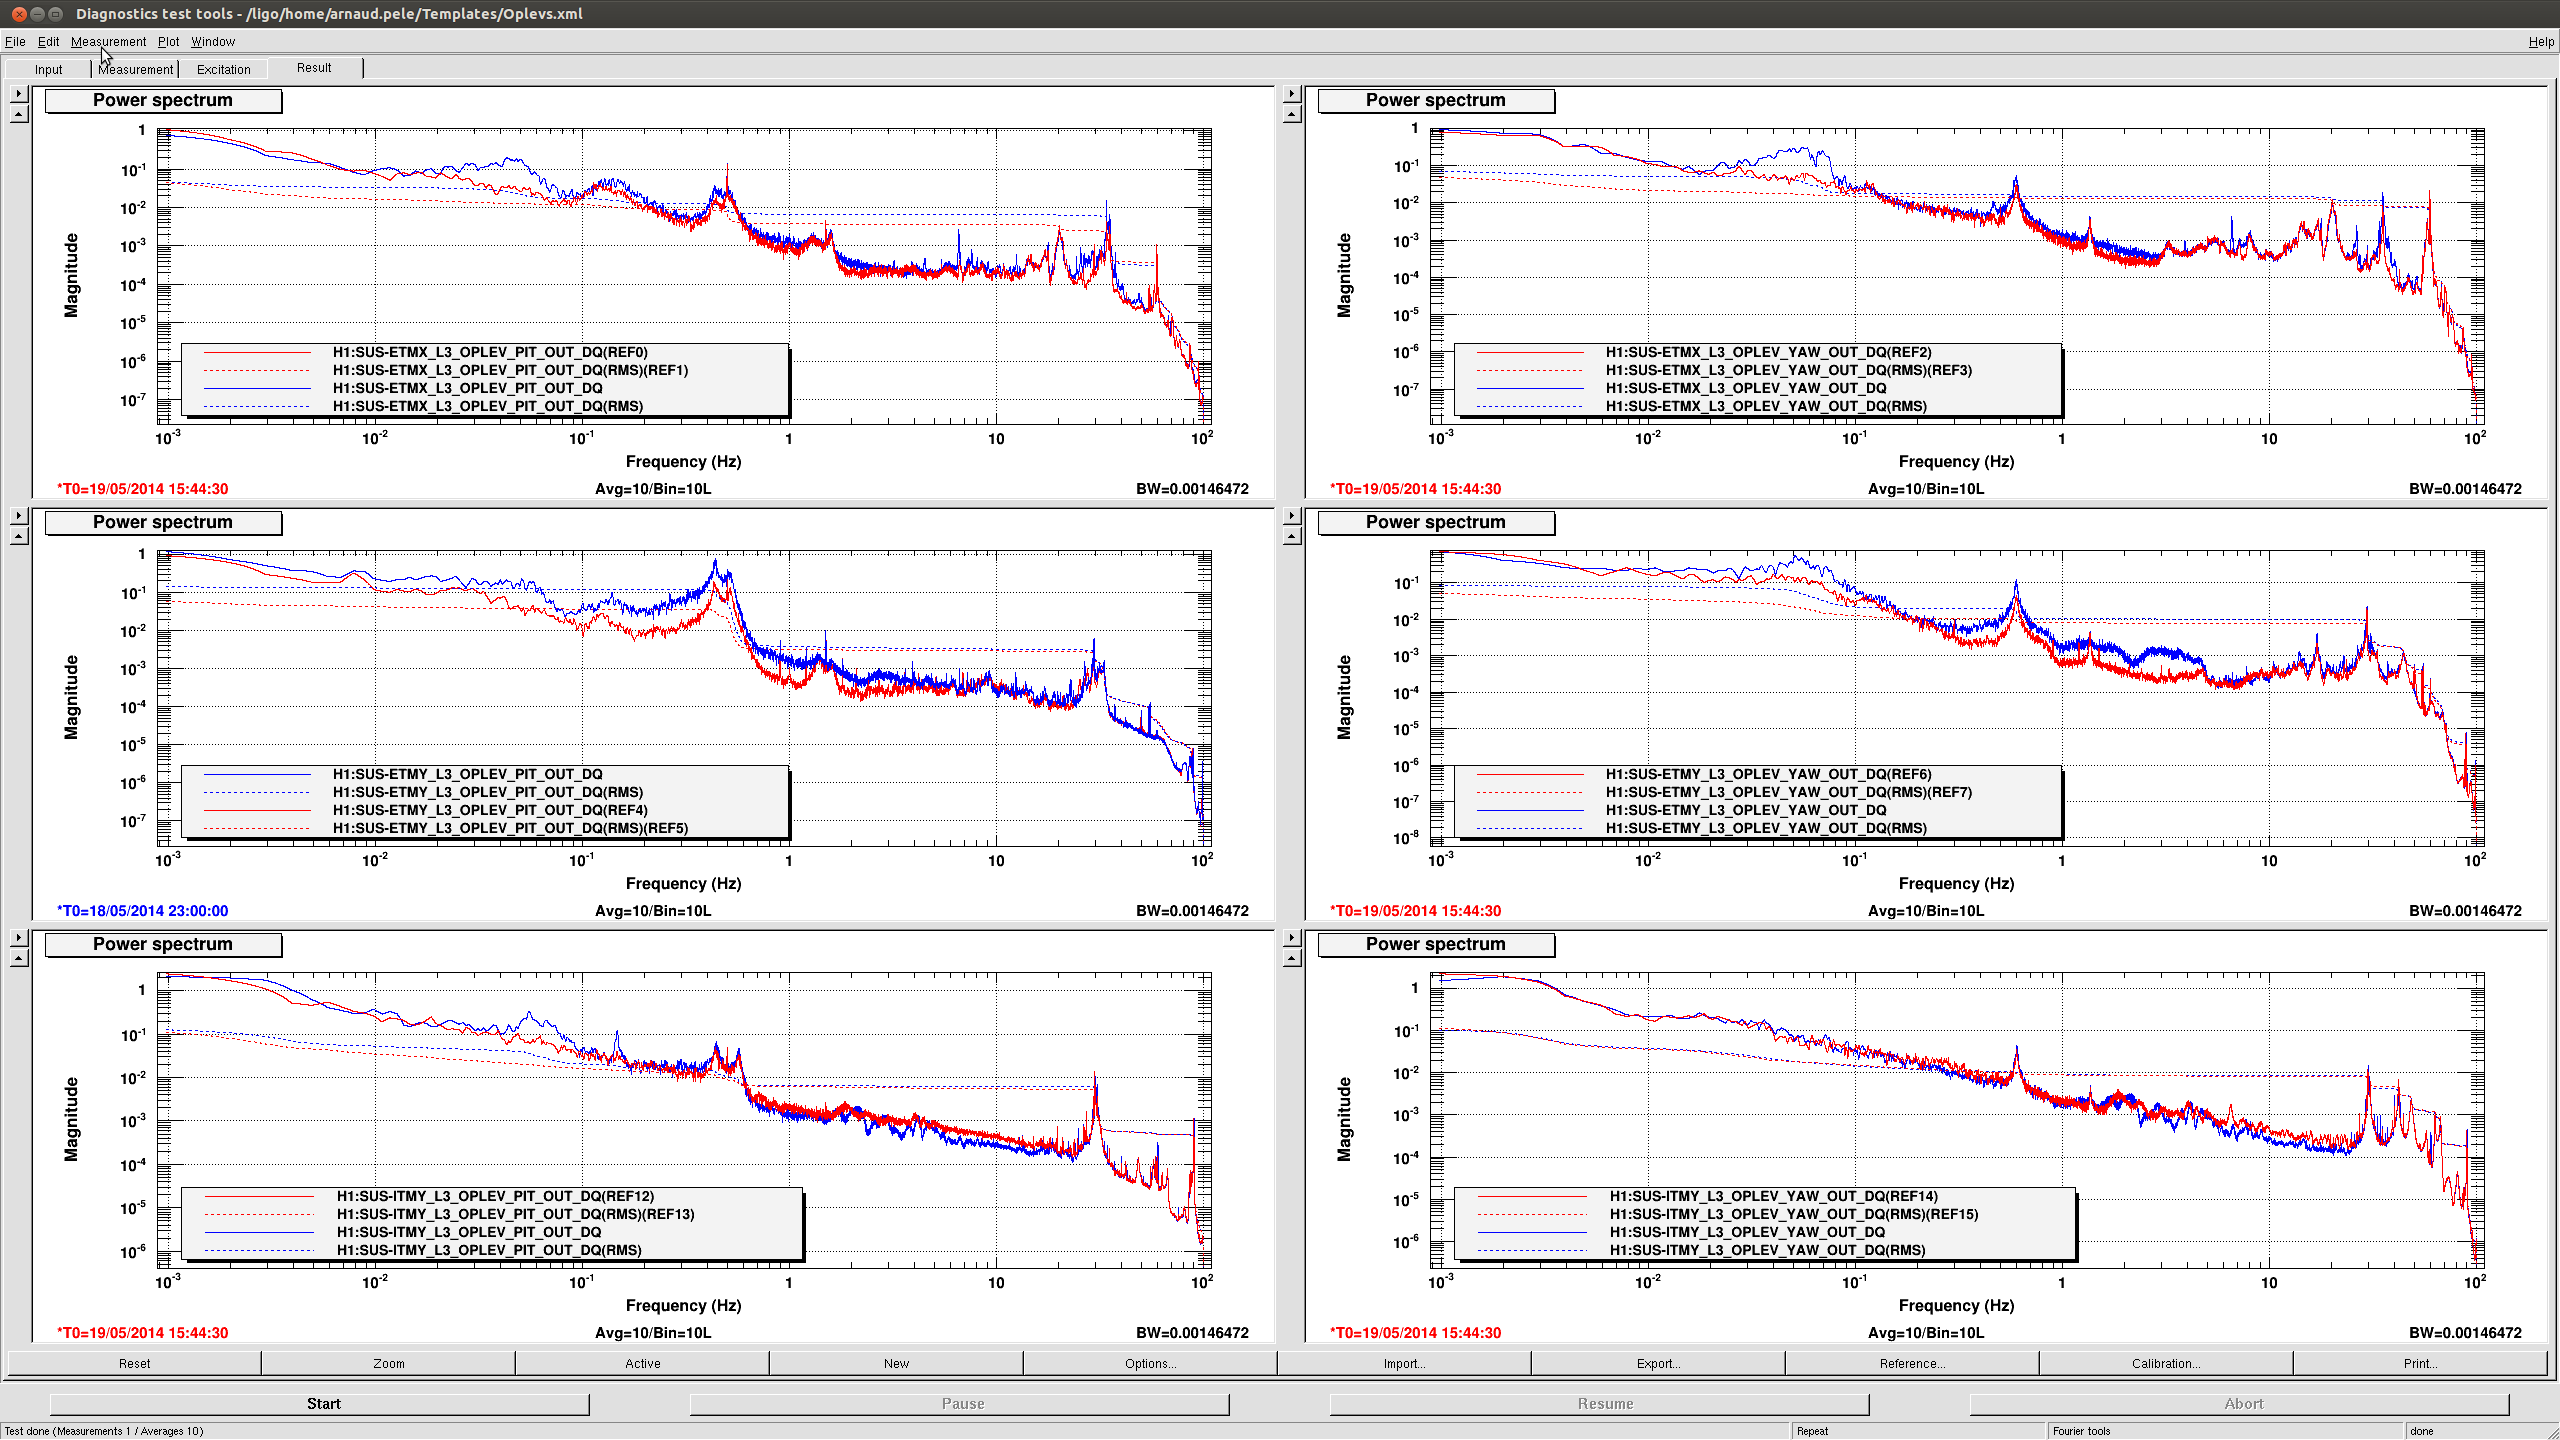
3. Spectra comparison of oplevs during high winds (may 18th blue curve) and low winds (may 19th red curve) for ETMx ETMy and ITMy top to bottom. Left column is pitch, right column is yaw.