J. Kissel, at the prodding of S. Dwyer, A. Effler, D. Sigg, B. Weaver, and P. Fritschel
Context
The calibration of the DC alignment range / position of the ITMY CP, aka CPy, has been called into question recently under the microscope of "how misaligned is the ITMX CP, and do we have the actuation range to realign it?" given that it's been identified to be a cause of excess scattered light (see e.g. LHO:82252 and LHO:82396).
What's in question / What Metrics Are Valid to Compare
Some work has been done here LHO:77557 to identify that we think CPy is misaligned "down" i.e. in positive pitch by 0.55 [mrad] = 550 [urad]
Peter reminds folks, in LHO:77587 that the DC range of the top mass actuators should be 440 [urad] and estimates that drives ~45 [mA] through the coils, pointing to my calibration of the coil current readbacks from LHO:77545.
But in that same LHO:77587, he calls out that
- Slider
- OSEMs
calibrations into [urad] disagree by a factor of 1130 / 440 = 2.5x. #YUCK1.
And Daniel points out that there's a factor of 2x error in my interpretation of the coil current calibration from LHO:77545. #YUCK2.
Note -- there's conversation about the optical lever readback disagreeing with these metrics as well, but the optical lever looks at the HR surface of the main chain test mass, so it's a false comparison to suggest that this is also "wrong." Yes, technically the optical lever beam hits and reflects some portion of all surfaces of the QUAD, but by the time this spots all hit the optical lever QPD, they're sufficiently spatially separated that we have to chose one, and the install team works hard to make sure that they've directed the reflection off of the test mass HR surface onto the QPD and no other reflection. That being said, the fact hat these optical lever readings of the test mass have been identified to be wrong in the past as well (see LHO:63833 for ITMX and LHO:43816 for ITMY) doesn't help the human sort which wrong metrics are the valid ones to complain about in this context. #FACEPALM
So, yes, a lot of confusing metrics around there, and all the one's we *should* be comparing disagree -- and seemingly by large factors of 2x to 4x. So let's try to sort out the #YUCKs.
Comparing the big picture of all the things that "should" be the same
#YUCK1
In our modeling and calibrating, we assume
(1) All ITM Reaction Chains have the same dynamical response (in rotation, for the on-diagonal terms, that's in units of [rad]/[N.m])
(2) All OSEM sensors on all have been normalized to have the same "ideal" calibration from ADC counts to [um].
(3) All mechanical arrangements of OSEMs are the same, so we can use the same lever arm to convert an individually sensed OSEM [um] into a rotation in [urad], and vice versa that a requested [N.m] drive in the EULER basis creates the same Force [N] at each OSEM coil, and
(4) All OSEM top-mass actuator chains are chains are the same, (with 18 or 20 bit DACs and QTOP coil drivers, and 10x10 magnets), so the same DAC counts produces the same force at the OSEM's location.
In order the check "are the same sensors / actuators reporting different values for (ideally) the same mechanical system," I used our library of historical data and allquads_2025-02-06_AllITMR0Chains_Comparison_R0_Y-Y_TF_zoomed.pdf
However, for pitch, we do see a good bit of difference in
allquads_2025-02-06_AllITMR0Chains_Comparison_R0_P-P_TF_zoomed.pdf.
Of course, we're used to looking at these plots over many orders of magnitude and call what we see "good enough" to make sure the resonances are all in the right place.
If I actually call out the DC magnitude of the transfer functions in the comparisons, you do actually see several factors of two, and differences between our four instantiations of the same suspension:
ITM R0 P2P TF DC magnitude
Model 0.184782 Model/Meas L1ITMY / Others
Meas
L1 ITMX 0.0675491 2.7355 ~3x 1.4028
L1 ITMY 0.0939456 1.9501 ~2x 1
H1 ITMX 0.0517654 3.5696 ~3.5x 1.8305
H1 ITMY 0.0947546 1.9501 ~2x ~1
So, there is definitely something different about these -- ideally identical -- suspensions. I think it's an amazing testimate to the install teams that both L1 and H1's ITMY have virtually identical DC magnitude (and AC transfer functions).
Of course, "ideal," in terms of mechanics is muddled by cables that are laced thru the UIM / PUM / TST stages -- we've seen (from LONG ago) that specific (most) arrangements of the cables can stiffen the reaction chain, and setting the cables in such a way that they do *not* influence the pitch dynamics is hard -- see LHO:1769, 2085 and LHO:2117. I attach the R0 P2P plot plot from LHO:2117 that shows how much influence the cabling *can* have.
I had the impression that this was only an impact on the "3rd" mode of the transfer function, but when you actually look at it with this "factors of two at DC" in mind,
the data clearly shows cabling impact on the DC stiffness as well, and again factors of two are possible with different cable arrangements.
So, in PITCH when we request the actuators to push these suspensions at DC, we may get a different answer at the optic i.e. the compensation plate, or CP.
This may be some source of the disagreement between OSEM *sensors* and requested drive from the OSEM coil sliders.
Resolving how much current is being driven through the coils, as reported by the FASTIMON or RMSIMON channels
#YUCK2
(A) At H1, can confirm that all the QUAD's top masses, both main chain and reaction chain are using QTOP coil drivers, as designed, with no modifications -- see the e-Travelers within the "Quad Top Coil Drivers" serial numbers listed as related to H1 SUS C5 (S1301872)
(B) I was about to make the same claim of L1, but in doing the due diligence with L1 SUS C5 (S1105375), I see that the S1000369 Quad Top Driver was modified to give more drive strength on ITMY R0 F1,F2,F3 - the pitch and yaw coils, and there's no follow-up record suggesting it was reverted. The work permit from Stuart Aston mentioned in LLO:28375 indicates a request to increase the strength by 25%. The action is also documented by Carl Adams and Michael Laxen in LHO:28301. It would be helpful to confirm if this mod is still in place, and if not, then the e-Traveler should be updated with record of the reverting. I'm guessing the mod is still in place, because there's mention of the serial number that was originally there being swapped in elsewhere in 2019 -- see LLO:46238.
(C) That being said, I can at least make the statement confidently that all QUAD TOP Coil Drivers in play are using the same, original noise monitor circuit D070480.
(D) Looking back all the content on the DCC page, Daniel's right about my mis-calibration of the coil driver current monitor from LHO:77545.
This darn monitor circuit will be the death of me. The error comes in during a misunderstanding of how the single-ended output of the current monitor circuit is piped into our differential ADCs, namely the line
* "single-ended voltage piped into only one leg of differential ADC" factor of two its DB25 output J1 in the interconnect drawing
because of which I added the factor of
2 [V_DF] / 1 [V_SE]
to the calibration.
If you look at interconnect drawing you can see that the "F" (for FAST I MON) and "S" (for Slow RMSIMON) single-ended voltages are piped into the output DB25's positive pins, and the negative pins are connected to 0 V.
This is a big unusual, because typical LIGO differential ADC driver circuits copy and invert the single-ended voltage and pipe the original single-ended voltage to the positive leg and the negative copy to the positive leg, such that V_SE = V_{D+} = - V_{D-}.
Comparing these two configurations,
(i) piping a signal ended voltage into only one leg, and 0V into the other
(V_{SE} - V_{REF}) - (0 - V_{REF}) = V_SE
(ii) copying and inverting the single ended voltage yields,
(V_{SE+} - V_{REF}) - (V_{SE-} - V_{REF}) = (V_{SE} - V_{REF}) - ( - V_{SE} - V_{REF}) = 2 V_{SE}
So, I'd used the (ii) configuration's calibration rather than (i), which is the case for the current monitors (and everything on that noise monitor board).
The corrected the RMSIMON calibration is thus
calibration_QTOP [ct/A] = 2 * 40.00 [V/A] * (10e3 / 30e3) * 1 * (2^16 / 40 [ct/V])
= 4.3691e+04 [ct/A]
or 43.691 [ct/mA]
or 0.0229 [mA/ct]
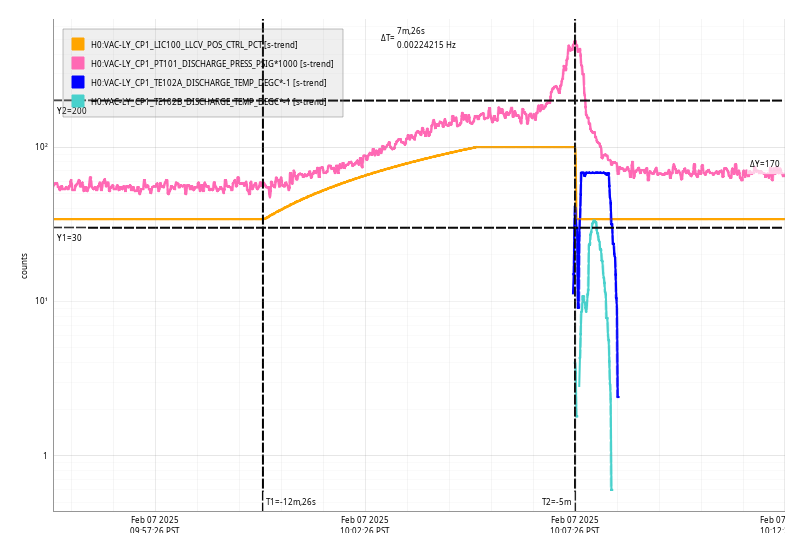
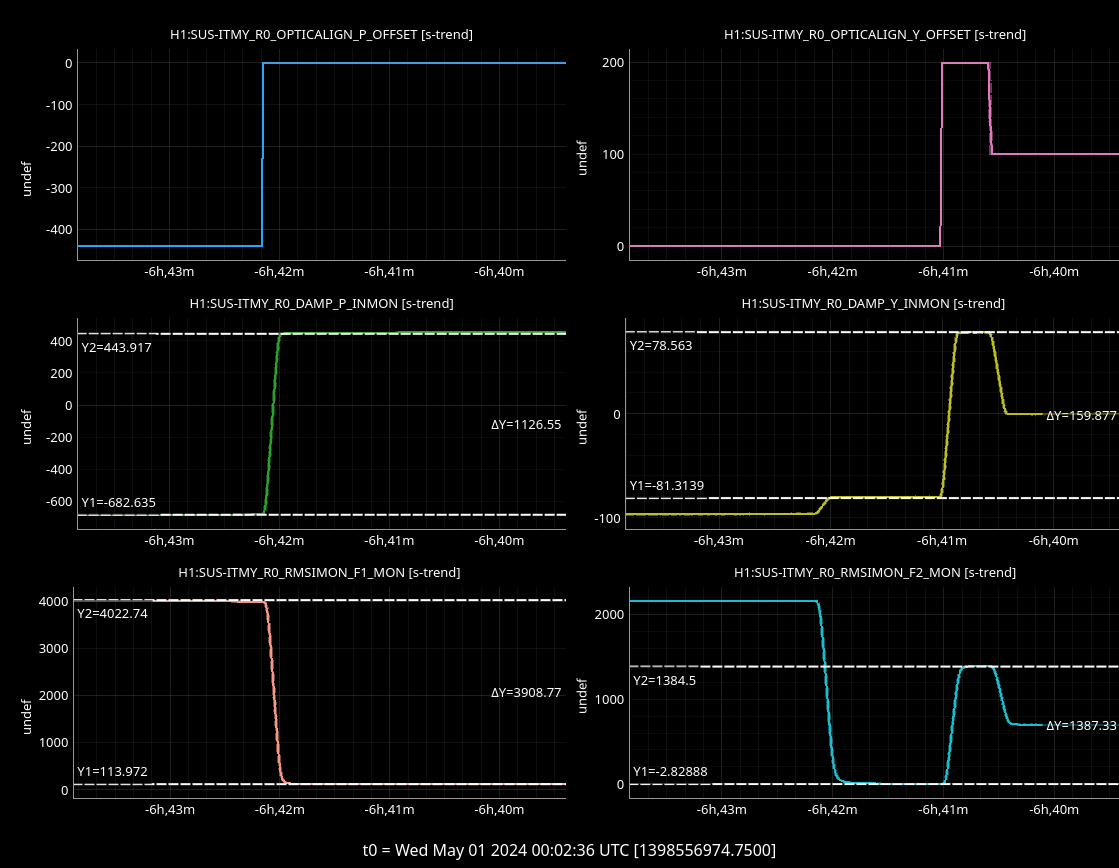
Taking the values Peter shows in the F1 RMSIMON in his ndscope session in LHO:77587,
Slider [urad] RMSIMON [ct] RMSIMON [mA]
440 4022.74 92.0732
0 113.972 2.6086
Delta 3908.77 89.4646
So, we're already driving a lot of coil current into the BOSEMs, if this calibration doesn't have any more flaws in it.
I'd also like to super confirm with LLO that they've still got 25% more range on their ITMY QUAD top coil driver, 'cause if they're consistently using any substantial amount of the supposed range, than they've been holding these BOSEMs at larger than 100 [mA] for a long time, which goes against Dennis' old modeled requirement (see LLO:13456).
I'll follow-up next Tuesday with some cold-hard measurements to back up the model of the coil driver and its current monitor.

