The green team had some sucess today.
We saw that there is a large wandering peak (similar to what we have seen in the IMC alog 10289 alog 10327) in COMM PFD Imon. This PFD chassis is directly under the diff RF doubler, by disconnecting the 79MHz input from this doubler we saw the peak become much smaller. We are leaving this unplugged since we don't need it yet. (Alexa has some movies of the two wandering peaks)
The Xarm guardian is working, at least the states up to LOCKED_W_SLOW. We didn't test the dither alingment states since the dither alignment isn't really working anyway.
The COMM PLL slow feedback to the IMC VCO had low bandwidth, which was limited by the randomization in the VCO servo library. Daniel edited the low noise VCO library, the servo now has two modes, internal where the frequency comparator is used for an error signal, and external, meant for use with the COMM PLL. The bandwidth is now limited to about 1 Hz, by the VCO response. Right now we have the gain setting for the COMM PLL slow feedback set to 14000Hz/V, and the ugf of the IMC VCO servo set to 0.8Hz. This seems stable. We also turn this off after the COMM handoff now.
We found a few gremlins in the COMM handoff- with the change to LSC input matrix our script was no longer setting the matrix element. For some reason the fast path was disabled in the REFL servo. Both of these things could be solves with state control code or for the time being by improving the script/writting a guardian. Now we are reliably doing the COMM handoff, which is stable for ~20 minutes to a half an hour right now. I've just committed the handoff and down scripts to the svn.
We rewired the REFL_DC_BIAS, so now it is routed into the CM board input 2
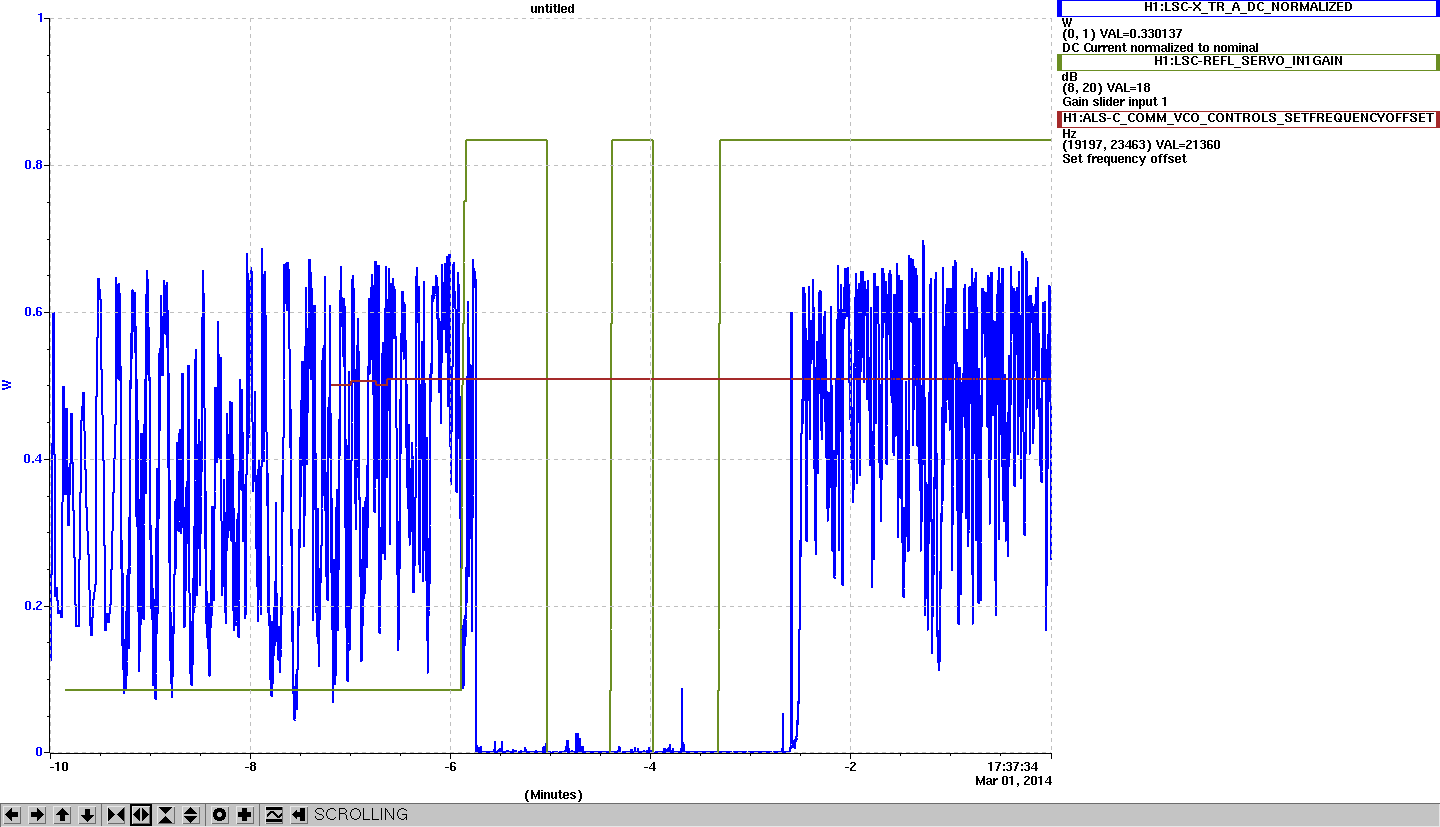
Once we had this locked we started looking at the IR transmission. When the alignment is good, we stay within about 160Hz (the transmitted power wanders over the peak back and forth, but doesn't move as far as we have seen some nights. We have seen that the amount of noise we see depends on the alingment.
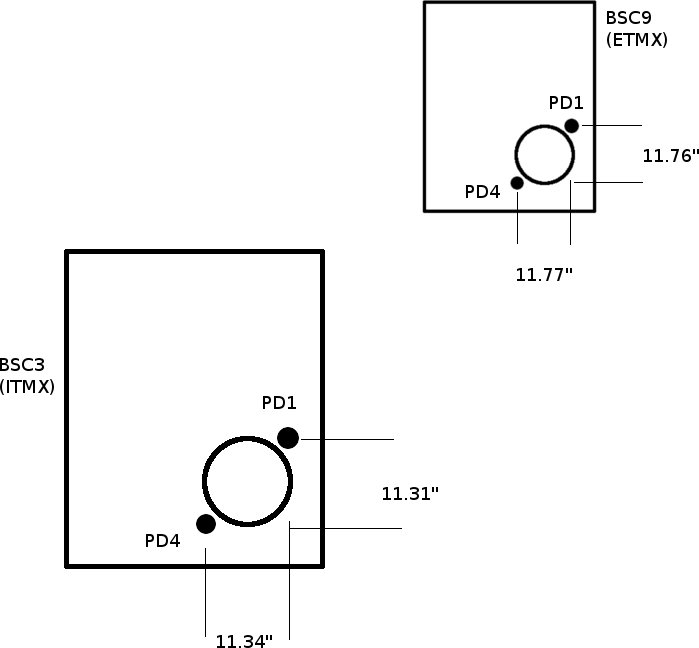
We found the IR resonance, moved the ETM in YAW, and found the resonance again. We made three measurements like this and got 400Hz/urad. When the alingment was worse this measurement got harder.
It seems clear we need a good alingment to have a chance of locking COMM on resonance.
Right now COMM has been locked for half an hour.


The switchport for the Comtrol has been down since Friday afternoon. The Comtrol box is probably unplugged/powered off.