Alexa, Daniel, Sheila
We normalized the refl PDH error signal, and saw that we can stay in the linear range of this signal with only ALS COMM locked.
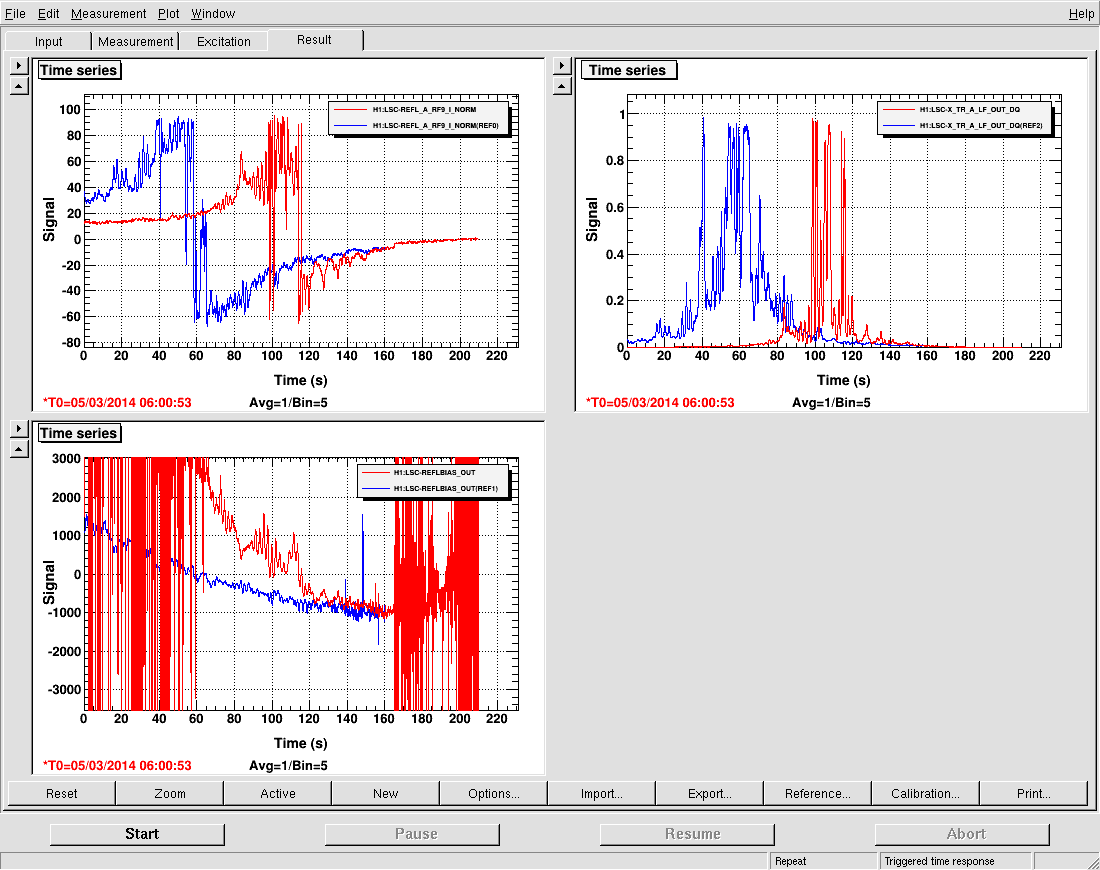
We first normalized LSC-X_TR_A_LF by adding a gain of 0.000154 so that the tranmission peak is at roughly 1. We set LSC-REFLBIAS to REFL_A_RF9_I over the transmitted power (LSC-X_TR_A_LF). The first screen shot is the PDH, the transmitted power, and the normalized error signal as we move the COMM VCO set frequency. In the red trace we moved the frequency by 2kHz; meanwhile, in the blue trace we moved half as fast over 1kHz. We used Alexa's equation from alog 7054 to roughly calibrate the signal: 80Hz cavity pole/150 counts pp of the PDH signal=0.533Hz/count.
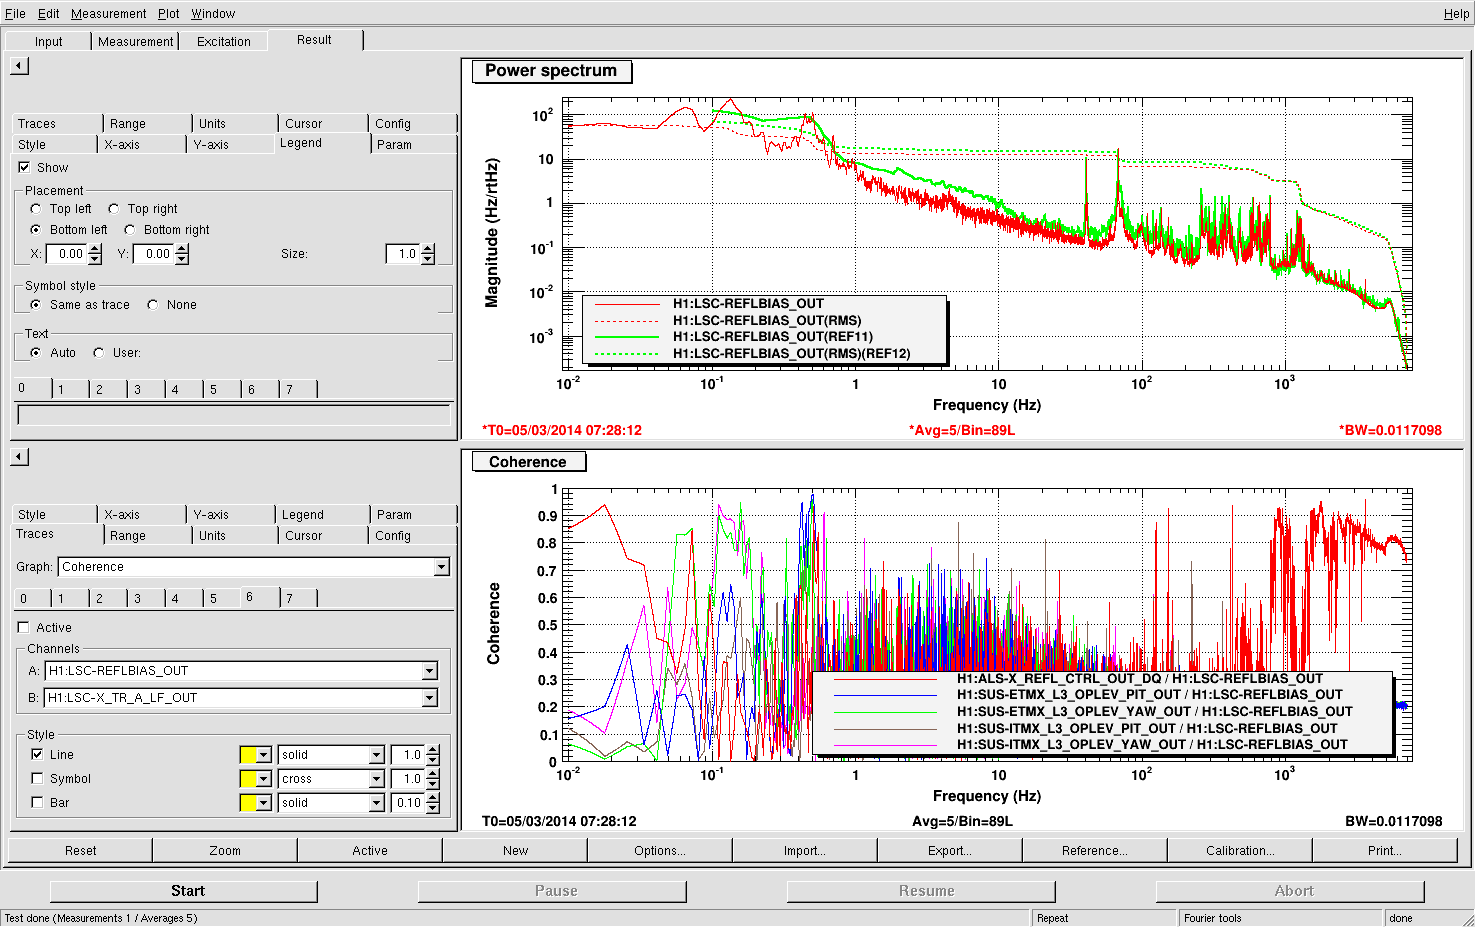
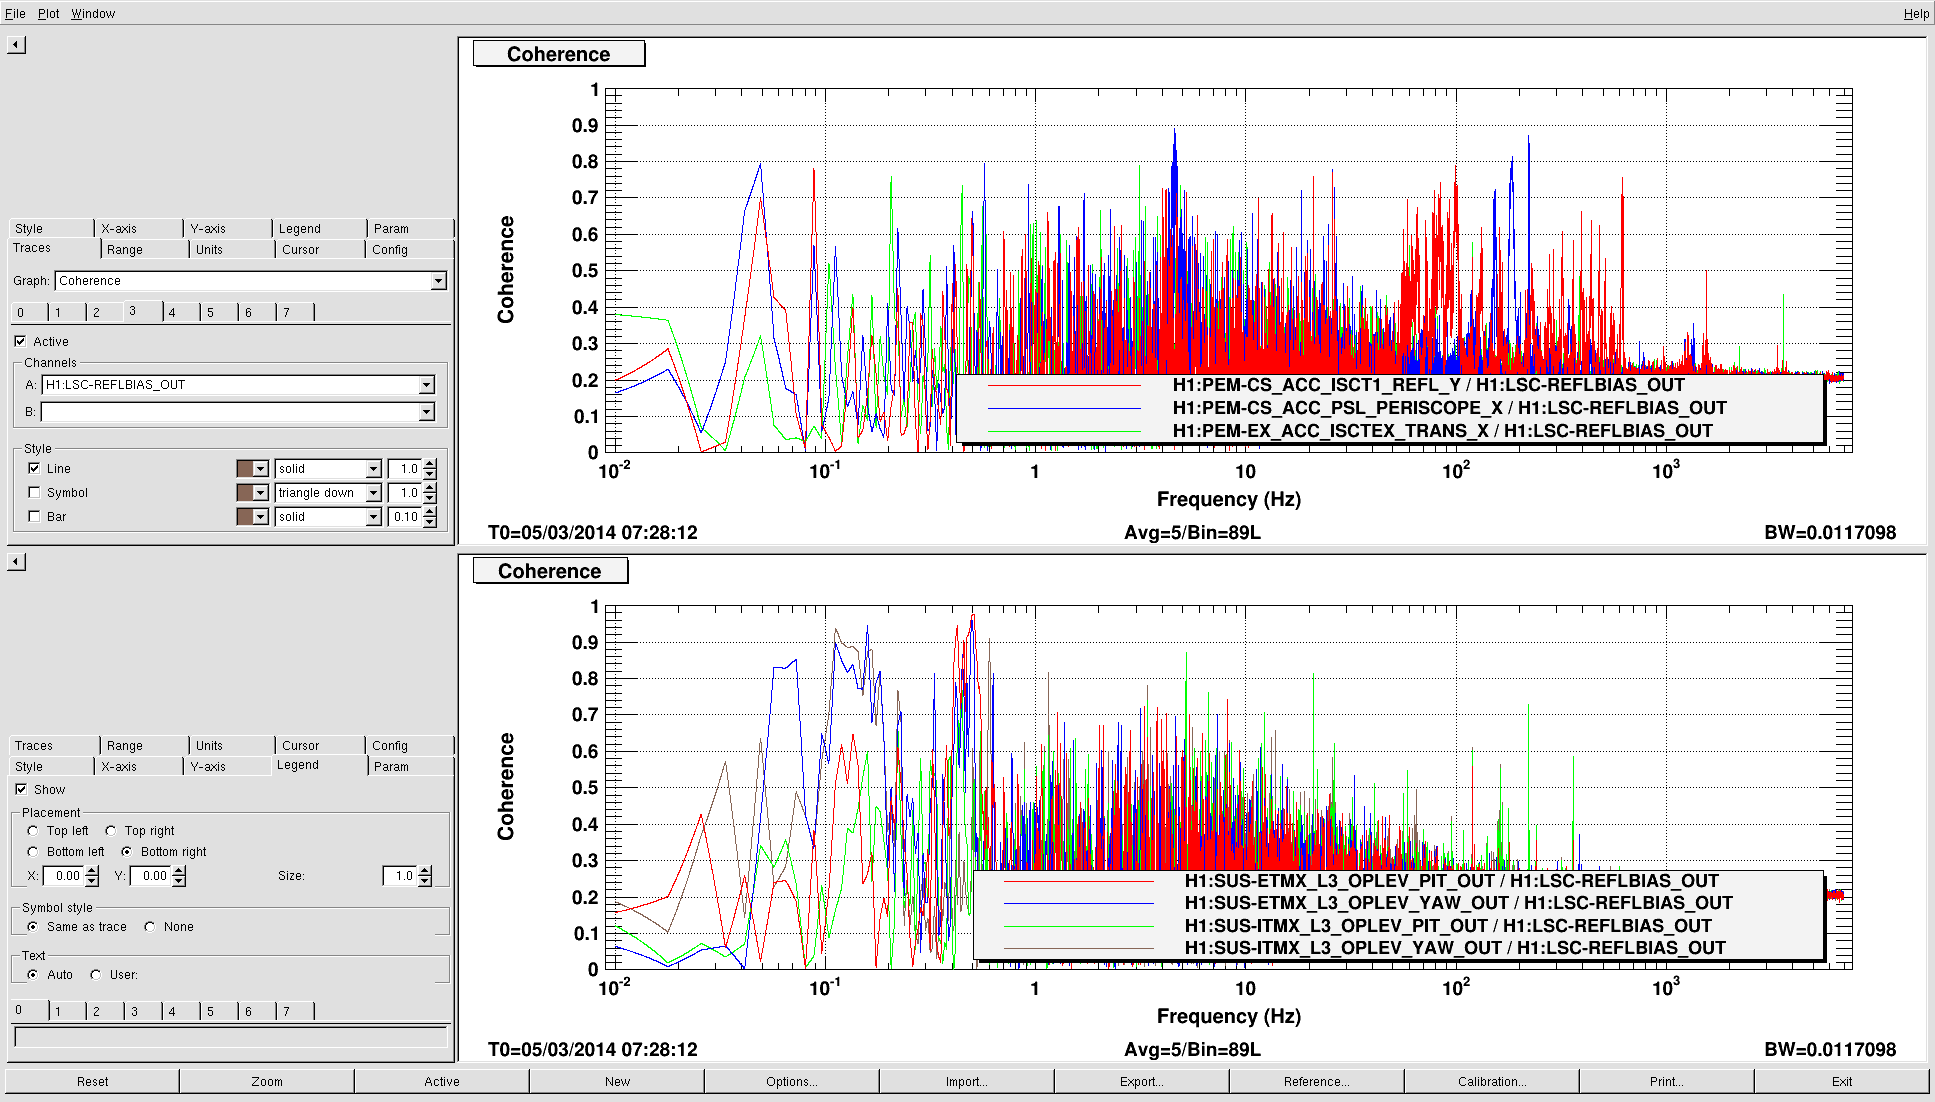
We put this gain into the REFL_BIAS filter, we will do a more carefull calculation in the morning. With this calibrated error signal we were able to measure an out of loop spectrum of the noise between the arm cavity and the PSL. Attached are some of the spectra that we took. In the top panel the green trace is a reference with the cleanroom over HAM1 on, in the red trace we turned the cleanroom off and Alexa tried to tune up the arm cavity alignment by maximizing the green transmitted power. This realingment clearly helped at low frequecies, and reduced the coherence with the ETMX PIT oplev.
The RMS we measured is completely dominated by low frequency noise that changed, probably because the alignment was drifting. The RMS down to 0.1 Hz varied from 30Hz-70Hz, we also measured an RMS of 58Hz down to 0.01 Hz.
We saw coherence with the end station PDH reflected signal above 1kHz, coherence with the PIT oplevs (mostly ETMX, which currently has level 2 controlers on Stage 1 and damping only on stage 2) around the PIT resonances (0.4-0.5 Hz), and coherence with YAW OpLevs from 0.04-0.5 Hz. We also looked for coherence with some of Robert's PEM sensors, we have coherence from the periscope on ISCT1 from about 50-100Hz, as we kind of expected.
Tonight the noise is much worse than it was on saturday, the transmitted power was not stable at all over time. This might be because we don't have as good of an alignment, or be because the arm cavity motion is larger because of the problems with ETMX ISI. We also measured the spectrum with higher and lower gains in the COMM board, higher gain did not seem to help, which is different from the situation on saturday alog 10439 .