What has been done so far :
- Filters were installed in the lockin demodulator and were tuned for a 10Hz signal excitation.
*9:11Hz bandpass for the optical lever signal
*1Hz ellip low pass and 20Hz notch for the demodulated I and Q signals
- Lock2Osem matrix filled to excite the pringle mode of the second mass from the pitch oscillator (UL, LR = 1 LL, UR=-1)
- Sent a 10Hz, 50000cts signal from the oscillator, to excite the pringle mode of M2, but I couldn't see the demod Q and I changing when modifying the coil gains, so I quit after few iterations
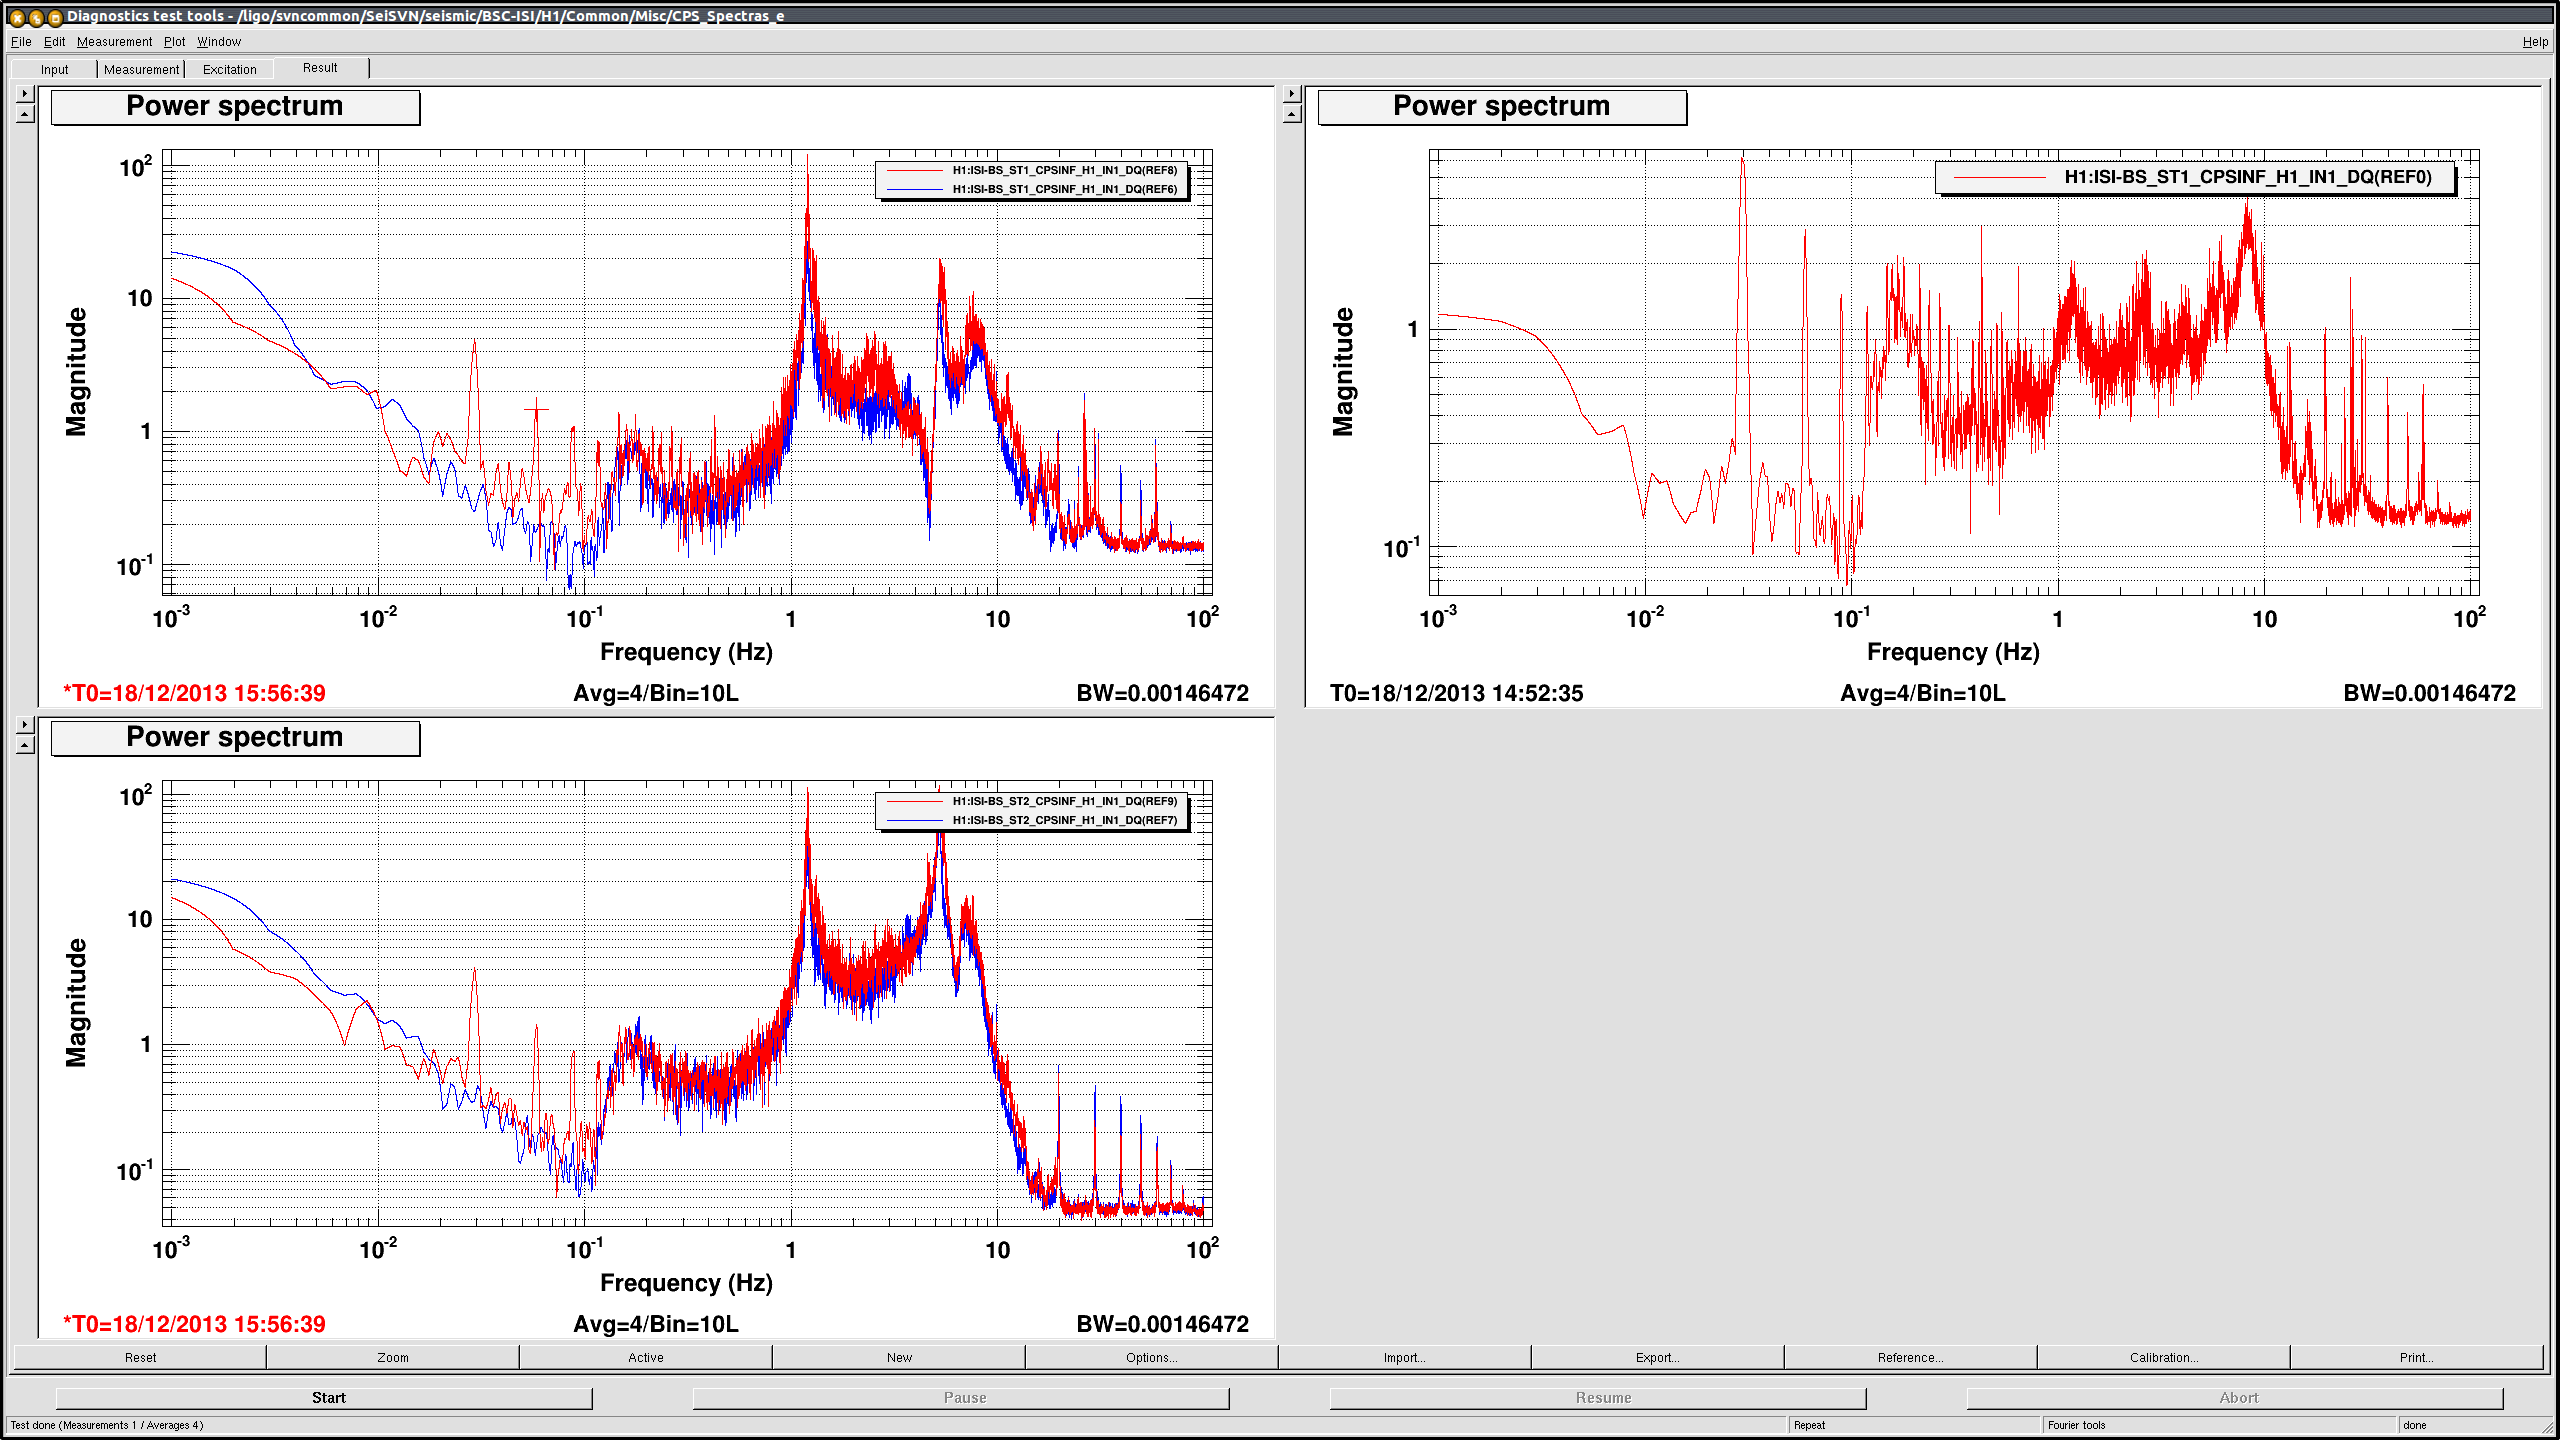
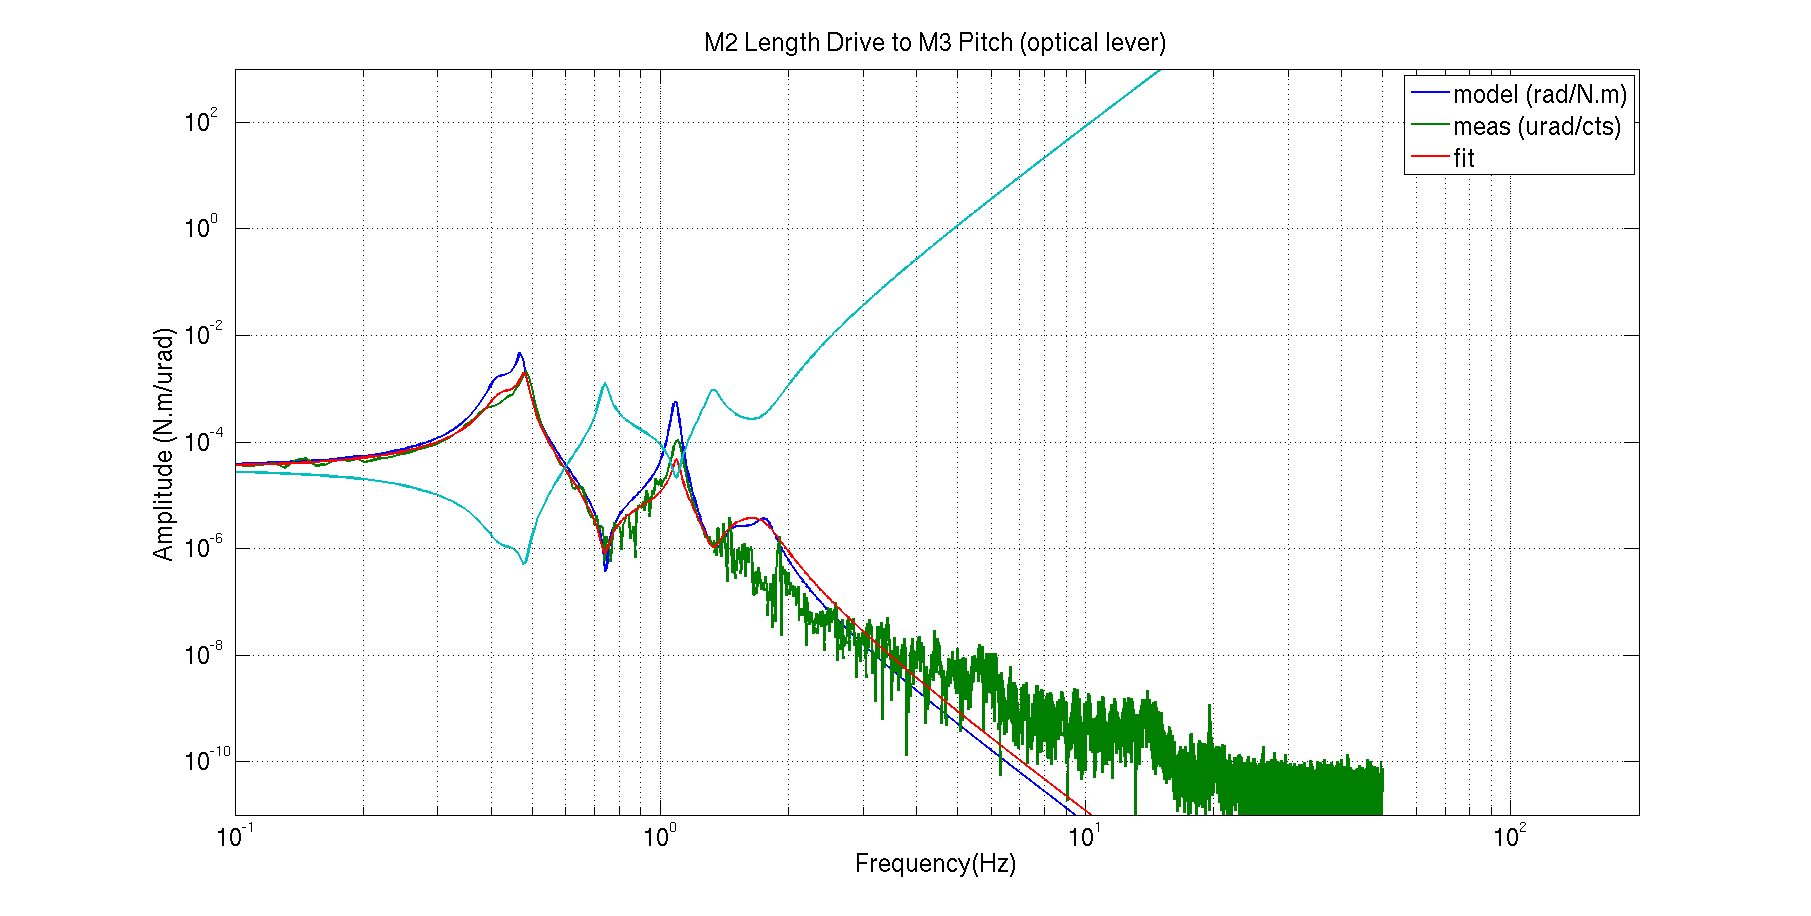
- M2 length to M3 Pitch transfer functions, without coil balancing. It matches the model below 2Hz, cf attachement. The signal/noise ratio of the tf is too low above that. I had to divide the model supposed to be in rad/N.m by 100 to match with the op lev TF, and I'm not sure where this factor comes from. The red curve is a fit of the modeled tf, and the cyan is the inverted tf.
What I intented to do this evening is to install this inverted filter in the L2P M2 drivealign matrix, take a new L2P TF and compare it with the previous one, to see the improvement., but didn't have time to finish.
If anyone wants to take over :
Script live in /SusSVN/trunk/BSFM/H1/BS/Common/Scripts/L2Pdecouplingfiltersdesign.m
TF data is in /ligo/svncommon/SusSVN/sus/trunk/BSFM/H1/BS/SAGM3/Data

The two diodes were swapped (H1:PSL-PERISCOPE_A_DC had the signal from PD3, and vice versa) I swapped the cables for now. I calibrated this based on my measurements in alog 8963,
The power before pick off (POWERMON) channel is calibrated in mW entering HAM1. I added this channel to the MC screen, now we can use this to monitor how much light is going into the vacuum.