corey.gray@LIGO.ORG - posted 07:50, Monday 20 January 2025 (82354)
Mon DAY Ops Transition
TITLE: 01/20 Day Shift: 1530-0030 UTC (0730-1630 PST), all times posted in UTC
STATE of H1: Lock Acquisition
OUTGOING OPERATOR: Ryan C
CURRENT ENVIRONMENT:
SEI_ENV state: CALM
Wind: 5mph Gusts, 3mph 3min avg
Primary useism: 0.03 μm/s
Secondary useism: 0.26 μm/s
QUICK SUMMARY:
H1 has been locked for about 2hrs on this chilly (~22degF) morning with low winds and microseism between the 50th & 95th percentile.
13:58 UTC Observing, I adjusted the OPO temperature before I went into observing.
Something weird happened with the alert system last night - there were multiple times where IFO_NOTIFY went into ALERTS_ACTIVE, but it didn't call Ryan every time that happened.
The squeezer was having trouble locking/staying locked in FDS, so once we were out of Observing for 8 minutes, IFO_NOTIFY went into ALERT_ACTIVE, during which it should have called Ryan, but maybe it didn't get to because only 20 seconds later, it got back to FDS.
However, it dropped back out a few seconds later, and once those 8 minutes had gone by, IFO NOTIFY went into ALERT_ACTIVE again, and it did call Ryan at 07:21 UTC.
When the SQZer got back to FDS for a few seconds two minutes later, it again took us back out of ALERT_ACTIVE, and then waited the 8 minutes again before going into ALERT_ACTIVE again and sitting in there for 23 minutes while the SQZer tried to relock. During these 23 minutes, Ryan did not get called.
Then the same thing happened again where the SQZer got to FDS for a few seconds, taking us out of ALERT_ACTIVE and resetting that 8 minute timer. This time it stayed in ALERT_ACTIVE for over 4 hours and did not call Ryan until more than 4 hours later.
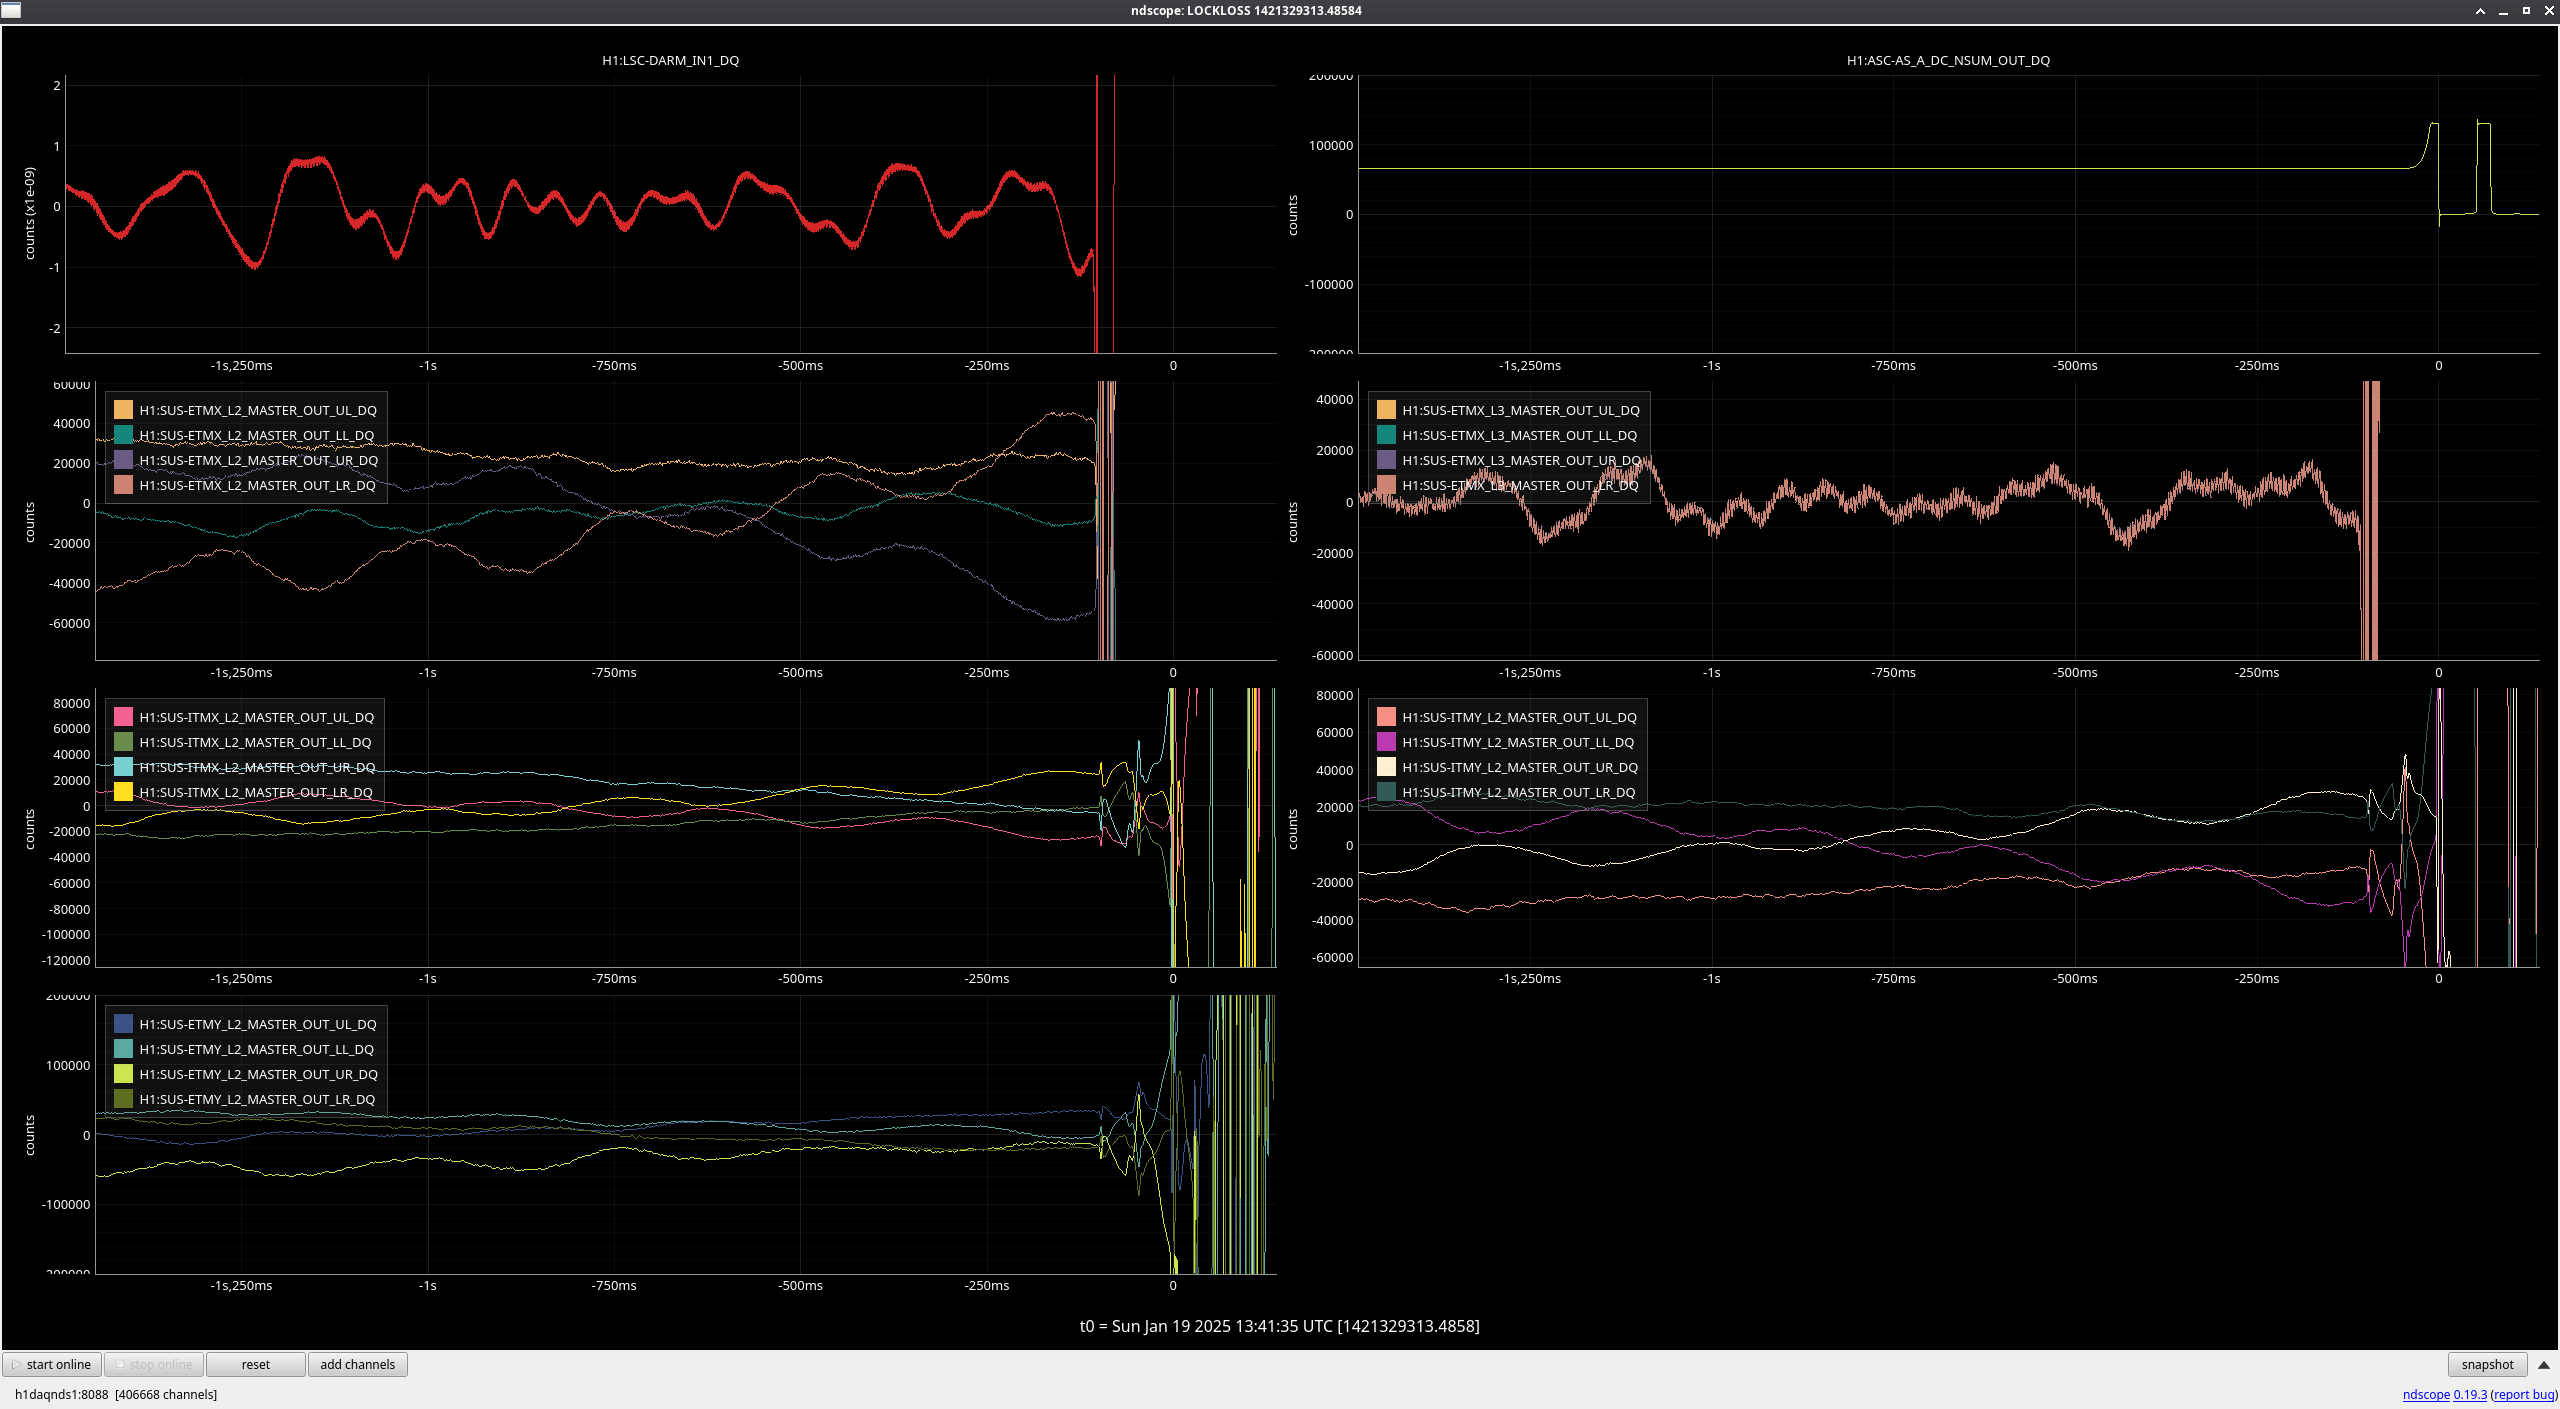
I've attached an ndscope and the IFO_NOTIFY log from last night, complete with my commentary.
It seems like besides the times where the call did not go out like it was supposed to, there might also need to be repeat calls made during times where we sit out of Observing for longer periods of time, maybe once per hour or per 30 minutes?
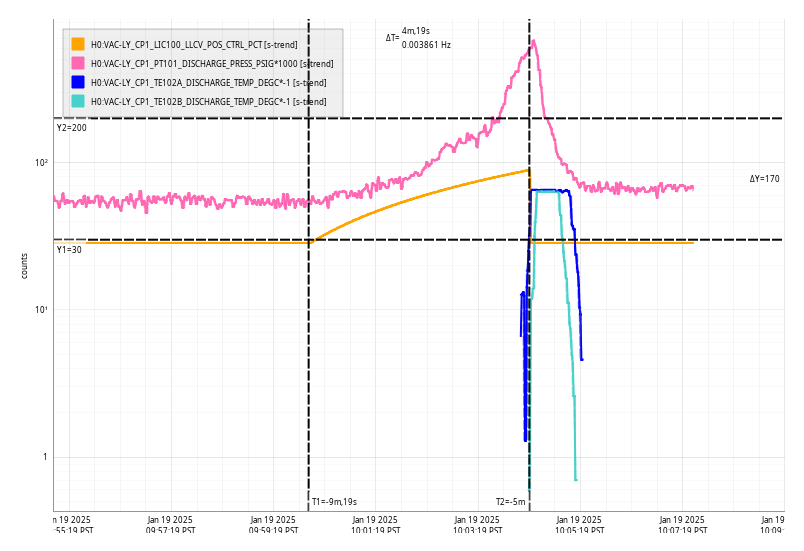
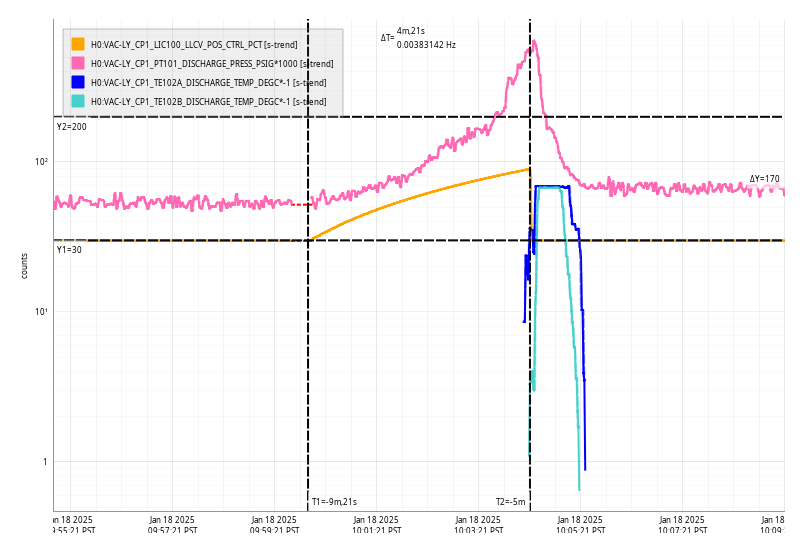
Tagging SQZ. 2025/01/20 07:02:12 UTC for 5 hours we had the SQZ FC struggling to lock. OPO, CLF and PMC stayed locked during this time, plot.
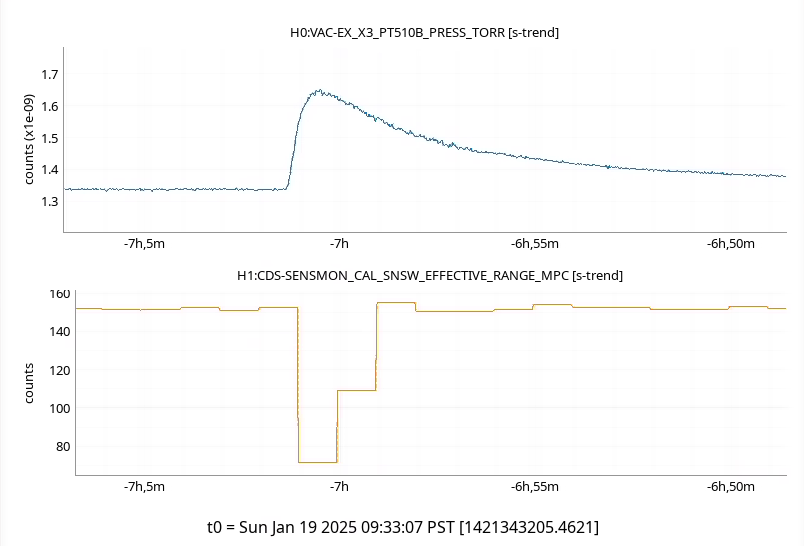
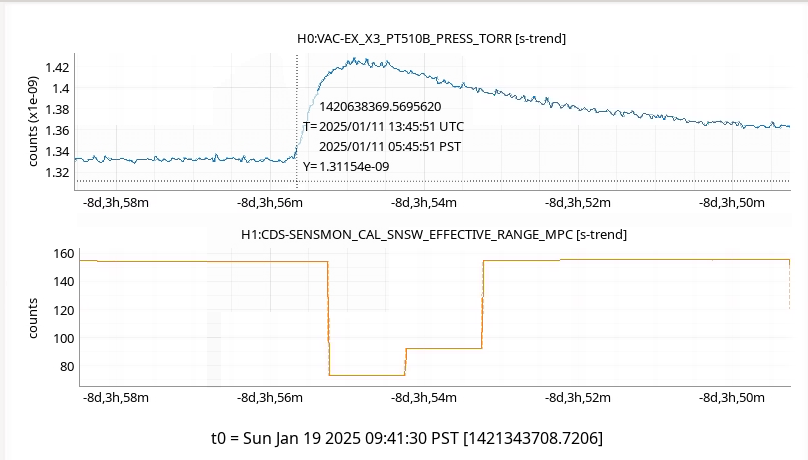
Initially unlocked with message "IR unlocked?" and then repeatedly locked back to IR_FOUND where it lost lock with message "GR lost lock??", checker is return ezca['SQZ-FC_TRANS_C_LF_OUTPUT'] > sqzparams.fcgs_trans_lock_threshold (60) which makes sense, we are at 100 when locked so not near this threshold. Unsure on the cause of FC green unlocking, maybe something in the FC servo dragged the lock away unless we are just seeing the unlock itself, plot and zoom.