Ibrahim, Oli, Thomas, Betsy
Before we flew the BBS in, we did a sanity-check experiment to compare slider values with a laser-pointer optical lever. This experiment follows Jeff's G1200698 math for an optical lever (picture also attached).
Setup:
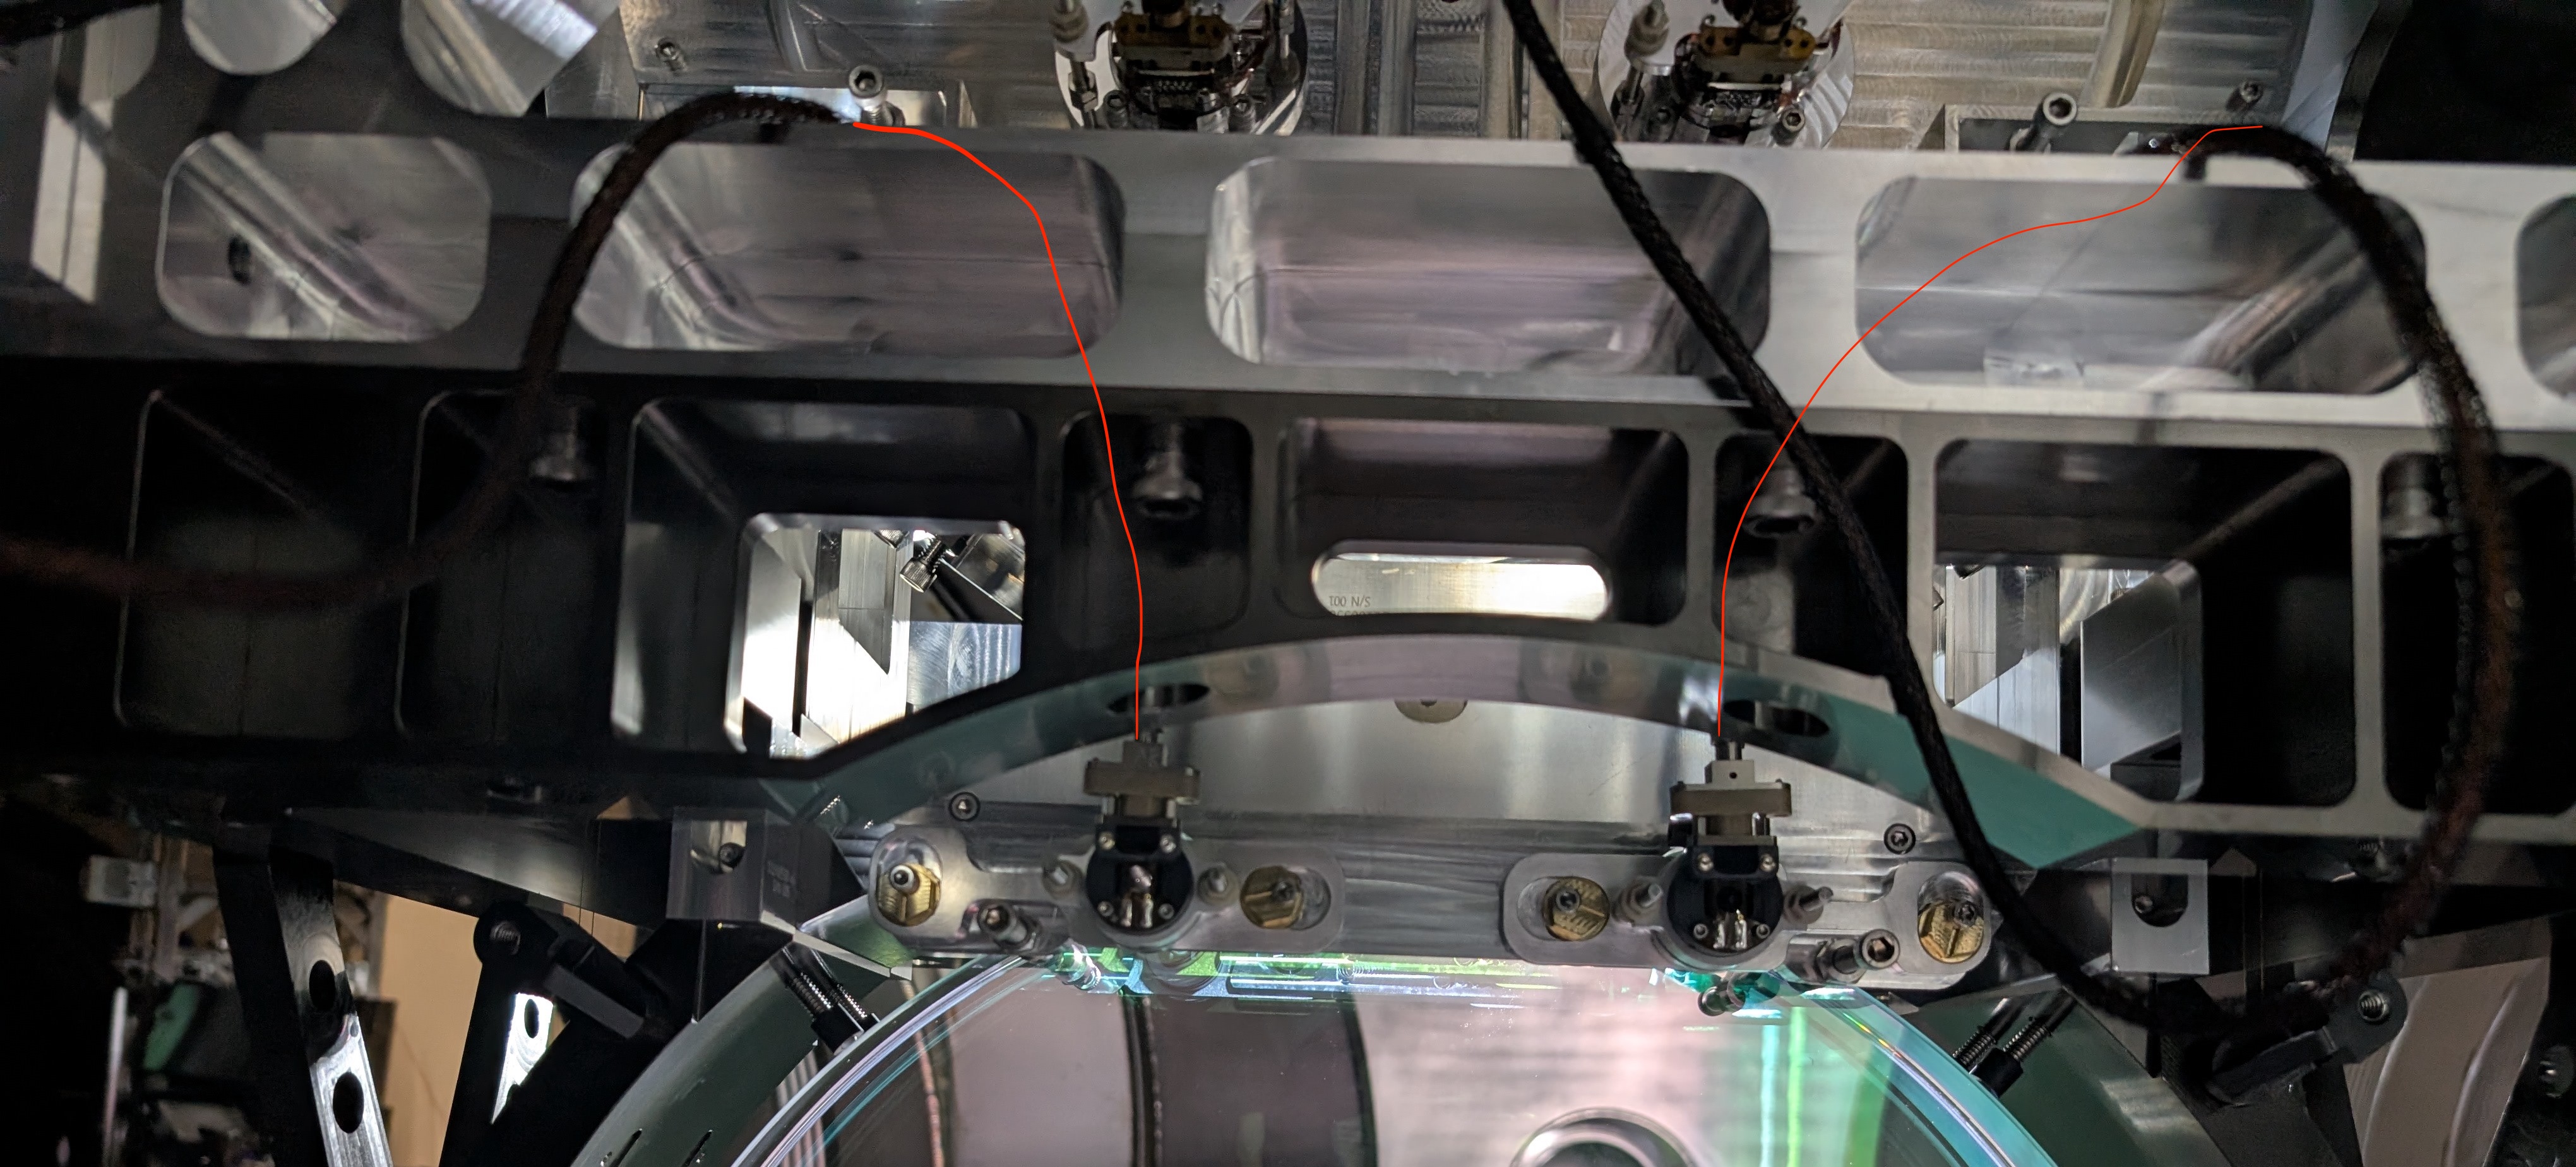
A laser pointer was pointed at the BBS HR side such that the HR and AR reflections could be seen on a paper near the laser pointer. The initial position was recorded on a paper, and then slider values were driven to their maximum range in P and Y. The distance between the laser source and the HR surface was recorded. The experiment was done with BOSEMs and then with QOSEMs.
Method:
When the laser pointer is incident on the BBS, there are two reflected beams (AR and HR). The average distance of these was taken along with the average distance from the BBS. This was done by calculating the distance to the BBS and adding the half-thickness of 30mm. This gives us "one beam" and "one distance' to go off for P and Y. See the attachment below for an image of the paper used during the experiment. This was done once for BOSEMs and then again with QOSEMs.
A few notes:
- The setup was replicated and the distance was remeasured on a different day and this is why the distances are different.
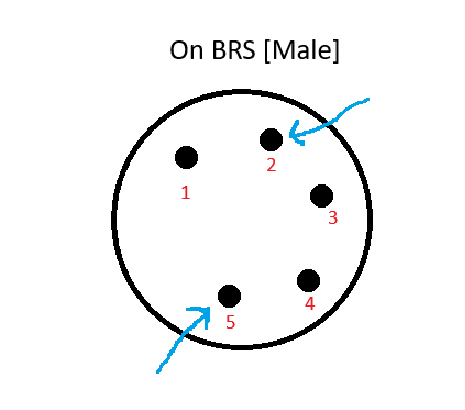
- The QOSEM as-it-is is inversed in its actuator sign convention and you can see this in the attached diagram. One of our action items is to rectify this. So right now, +P = Pitching up instead of down with respect to the HR. In general, we will abide by T1200015, the SUS/Actuator Sign Convention.
Results and Analysis
Pitch is in purple and Yaw is in Orange. The equation used was obtained from "G1200698, the Oplev Infamous Factor of Two", which is essentially the same outline as our experiment, a diagram of this is attached.
This equation is: DØ= DS/2L Where,
Ø is the angle in radians (adjusted to urad below), S is the displacement in the beam spot, L is the distance from the laser source to the optic.
For these data, the total range of the Opticalign sliders was considered (from lowest negative to highest positive). Thus, a half the range would apply if the sliders were zeroed.
| |
BOSEM |
QOSEM |
| Distance from HR surface (in) |
130 |
118 |
| Distance from HR surface (mm) |
3302 |
2997.2 |
| Average distance from optic |
3332 |
3027.2 |
| Pitch Displacement Total - +-1500 cts |
5.5 |
5.75 |
| Yaw Displacement Total +-4000 cts |
46.75 |
40.75 |
| Pitch Angle Swept (urad) |
825.33 |
949.72 |
| Yaw Angle Swept (urad) |
7015.31 |
6730.64 |
| Total Pitch Count Sweep (+-1500) |
3000 |
3000 |
| Total Yaw Count Sweep (+-4000) |
8000 |
8000 |
| Pitch urad/Ct |
0.28 |
0.32 |
| Yaw urad/Ct |
0.88 |
0.84 |
| Pitch Ct/urad |
3.63 |
3.16 |
| Yaw Ct/urad |
1.14 |
1.19 |
Conclusion:
- For a QOSEM Drive:
- Pitch at M3 read +-475urad (1/2 the total sweep of 949.72 shown above), which is equivalent to 3.16 Opticalign Cts per urad.
- Yaw at M3 read +-3365urad (1/2 the total sweep of 6730.64 shown above), which is equivalent to 1.19 Opticalign Cts per urad.
- BOSEM and QOSEM ranges are comprable
- No cross coupling was observed. Remember that this was done on the test stand a few weeks ago, before we found P:Y and Y:P coupling in chamber.
Next Steps:
Next, we're going to compare these results with the M3 AOSEM readouts once these are reliable. We will also compare these results with the model (which is used to corroborate slider calibration). Ultimately, this will help with the calibration of our slider values (both within the actuator slider actuation vs. sensing and from counts to real units).
Once we get a working OpLev (it's not on the BBS right now), we'll be able to get a more fine measurement of this kind.
Again, this is just a gross alignment check for information about our pointing and the capacity of our actuation.


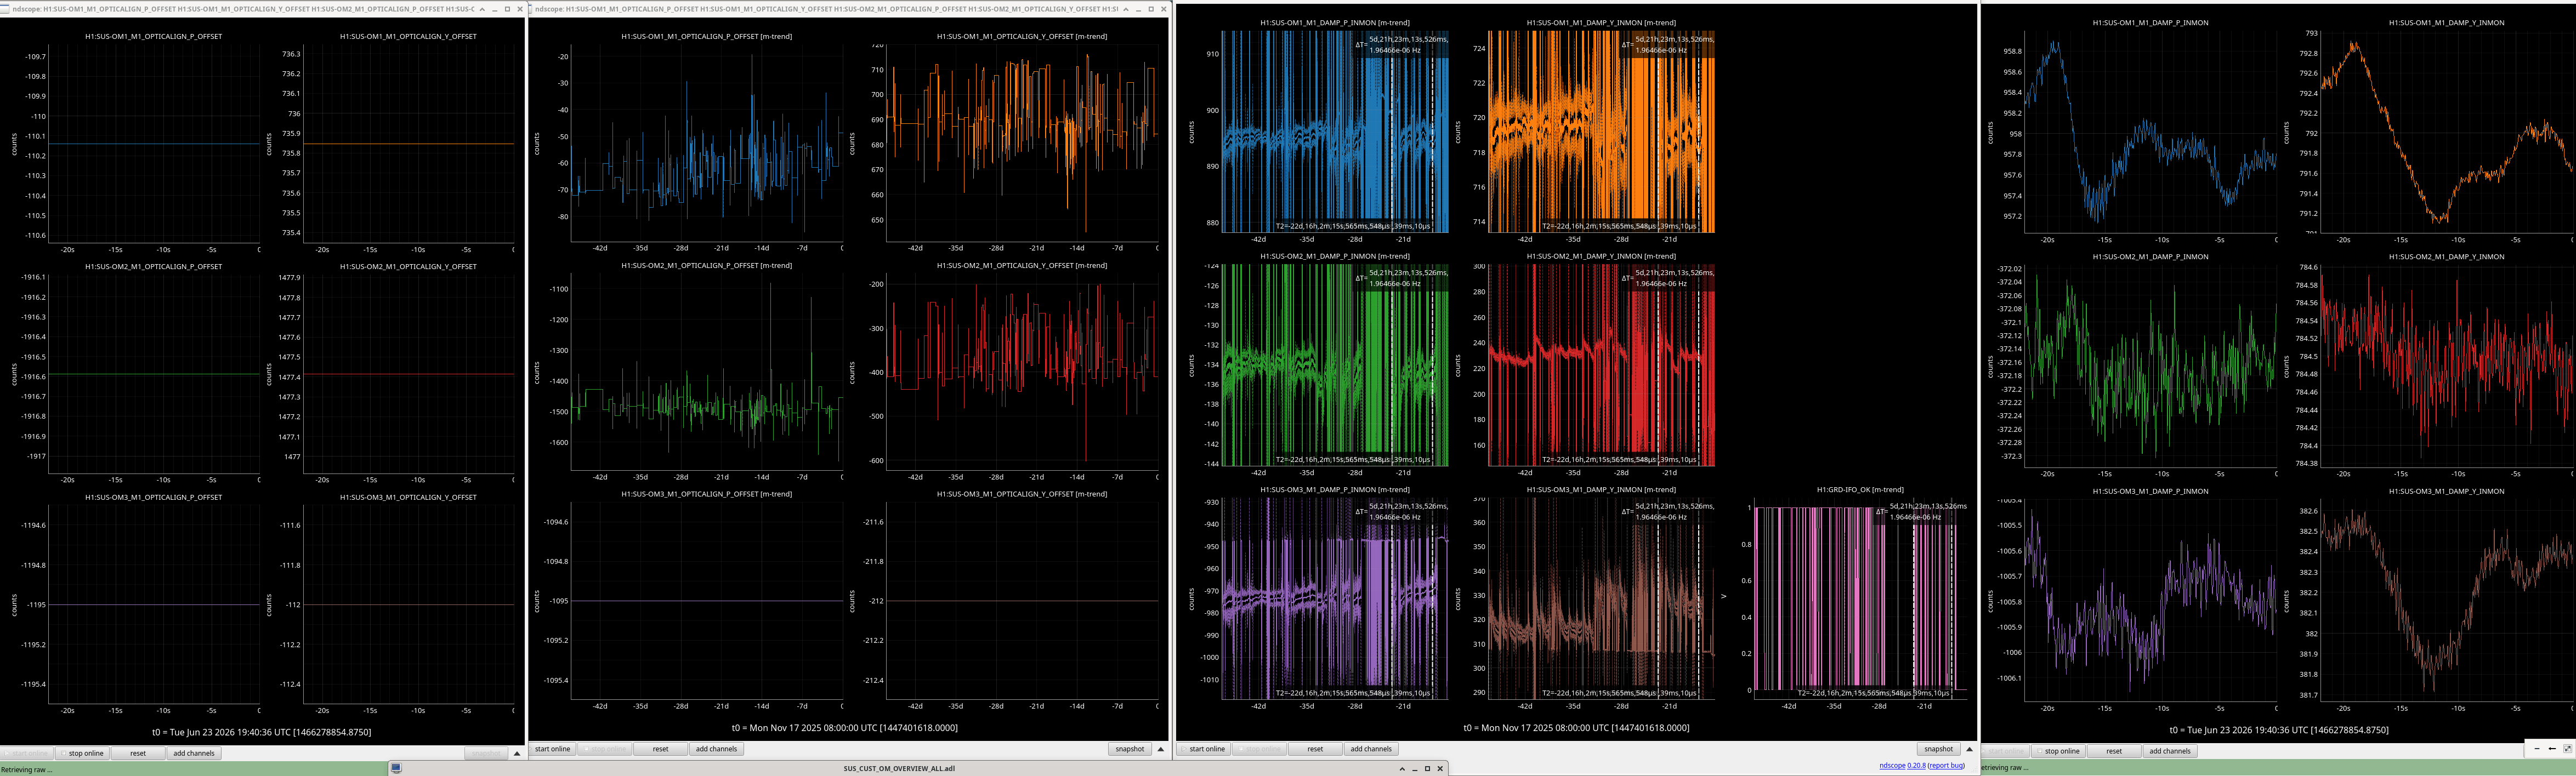


The BBS OpLev has been recentered. I had to yaw the beam onto the QPD, as it was not on it. Once recentered, the SUM counts were around 2400, which is much lower than for the old BS, which was up around 20k. I checked the Output Configuration Switch on the BBS OpLev chassis in the biergarten and it has not changed, the amount of gain is still 0 dB. The other explanations are the coating on the BBS (OpLev beam is at 635 nm, which is not a design wavelength for the coating, so the %R at 635 nm for the BBS could be very different than the old BS) and a failing OpLev laser. I'll check the power output from the laser to see how it's doing (likely tomorrow).
Keita's note: After Jason recentered BS oplev, we changed the BS sliders to see the sign of the sliders (we knew that they were flipped) and how bad the pit to yaw coupling was.
Sign of the H1:SUS-BS_M1_OPTICALIGN_P_OFFSET and H1:SUS-BS_M1_OPTICALIGN_P_OFFSET are systematically wrong.
Positive PIT (right column top) in the slider consistently makes negative PIT on oplev, M2 OSEM and M1 OSEM, i.e. positive PIT tilts the BS up when positive offset is added to the pit slider.
Same story for YAW, negative PIT (left column top) in the slider consistently makes positive YAW for all sensors available, i.e. positive YAW rotates the BS clockwise when viewed from the top.
Arnaud and the gang will fix the sign issue.
PIT to YAW coupling is about 2 YAW per 1 PIT (i.e. PIT actuation make BS move more in YAW). YAW to PIT is not bad.
Positive PIT of 50 counts (uncalibrated) made negative 10urad in PIT and negative 20urad in YAW according to oplev. This agrees with our experience of observing how the beam spot moved in chamber as well as on the AS and ICST1 cameras when trying to move BS in PIT using the slider.
Interestingly, P2Y coupling seems to be OK for M1 (1:0.17 if we trust the QOSEMs), bad (about 1:0.7) for M2 and absolutely terrible (1:2) for M3 oplev.
Negative YAW of 20 counts made positive YAW of about 30urad and almost unmeasurable amount of PIT according to oplev.
LLO also saw a drop in power output on the BS oplev. The current sum is around 12 percent of what the sum was before the vent which matches the drop in LHO BS oplev power.