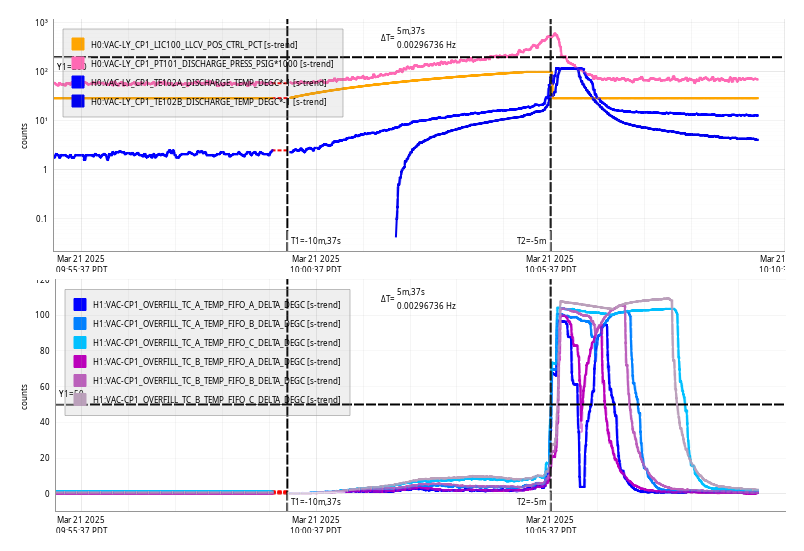
Bi-Weekly TCS Chiller Water Level Top-Off Famis 27811
CO2X
CO2Y
There was no water in the leak cup.
Fri Mar 21 10:05:37 2025 INFO: Fill completed in 5min 34secs
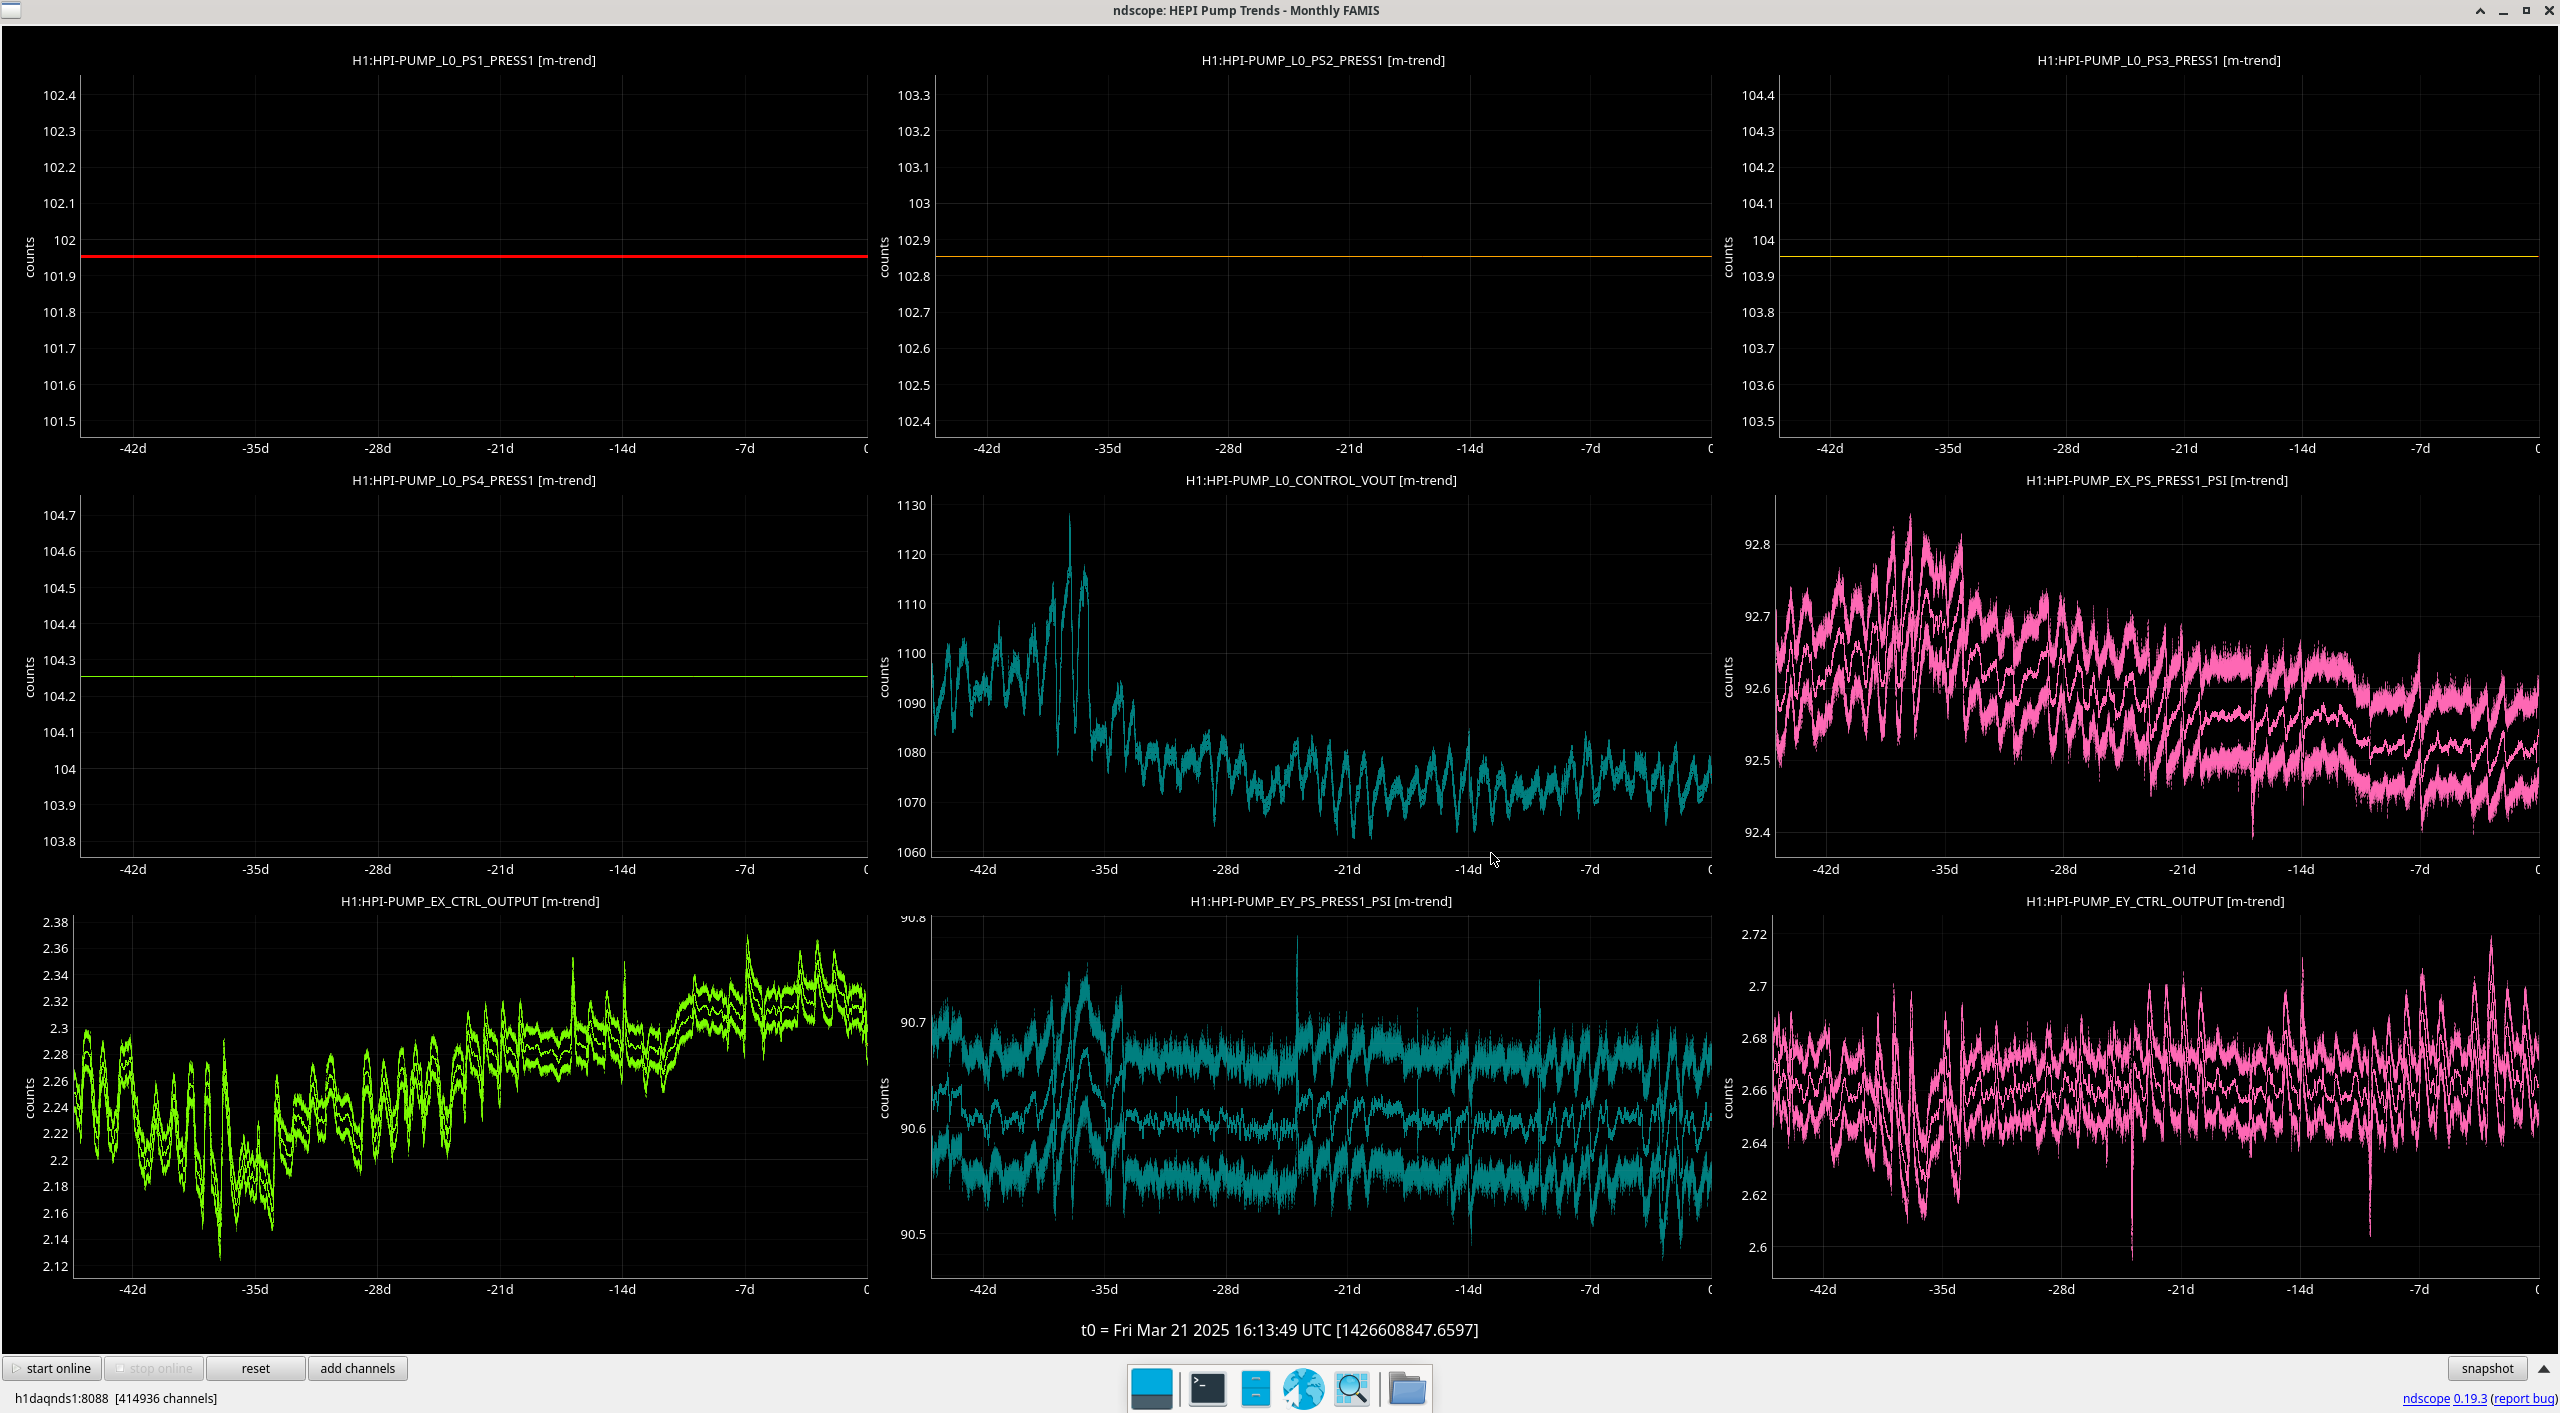
HEPI Pump Trends Monthly. Last Checked in alog 82928. Closes FAMIS 37203.
Trends look as expected and are comprable in noise to last month.
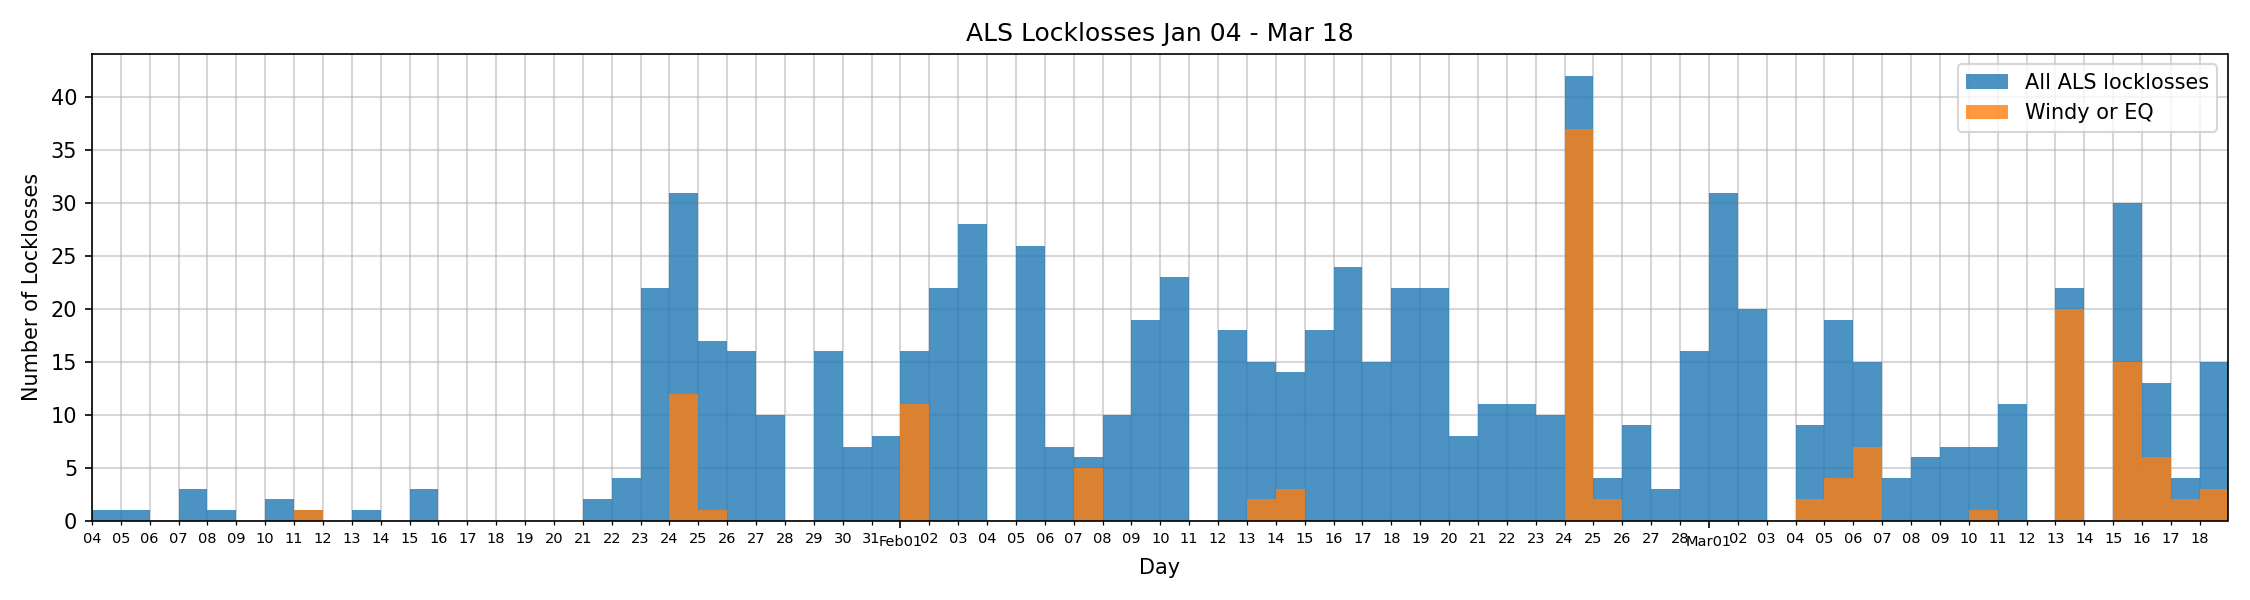
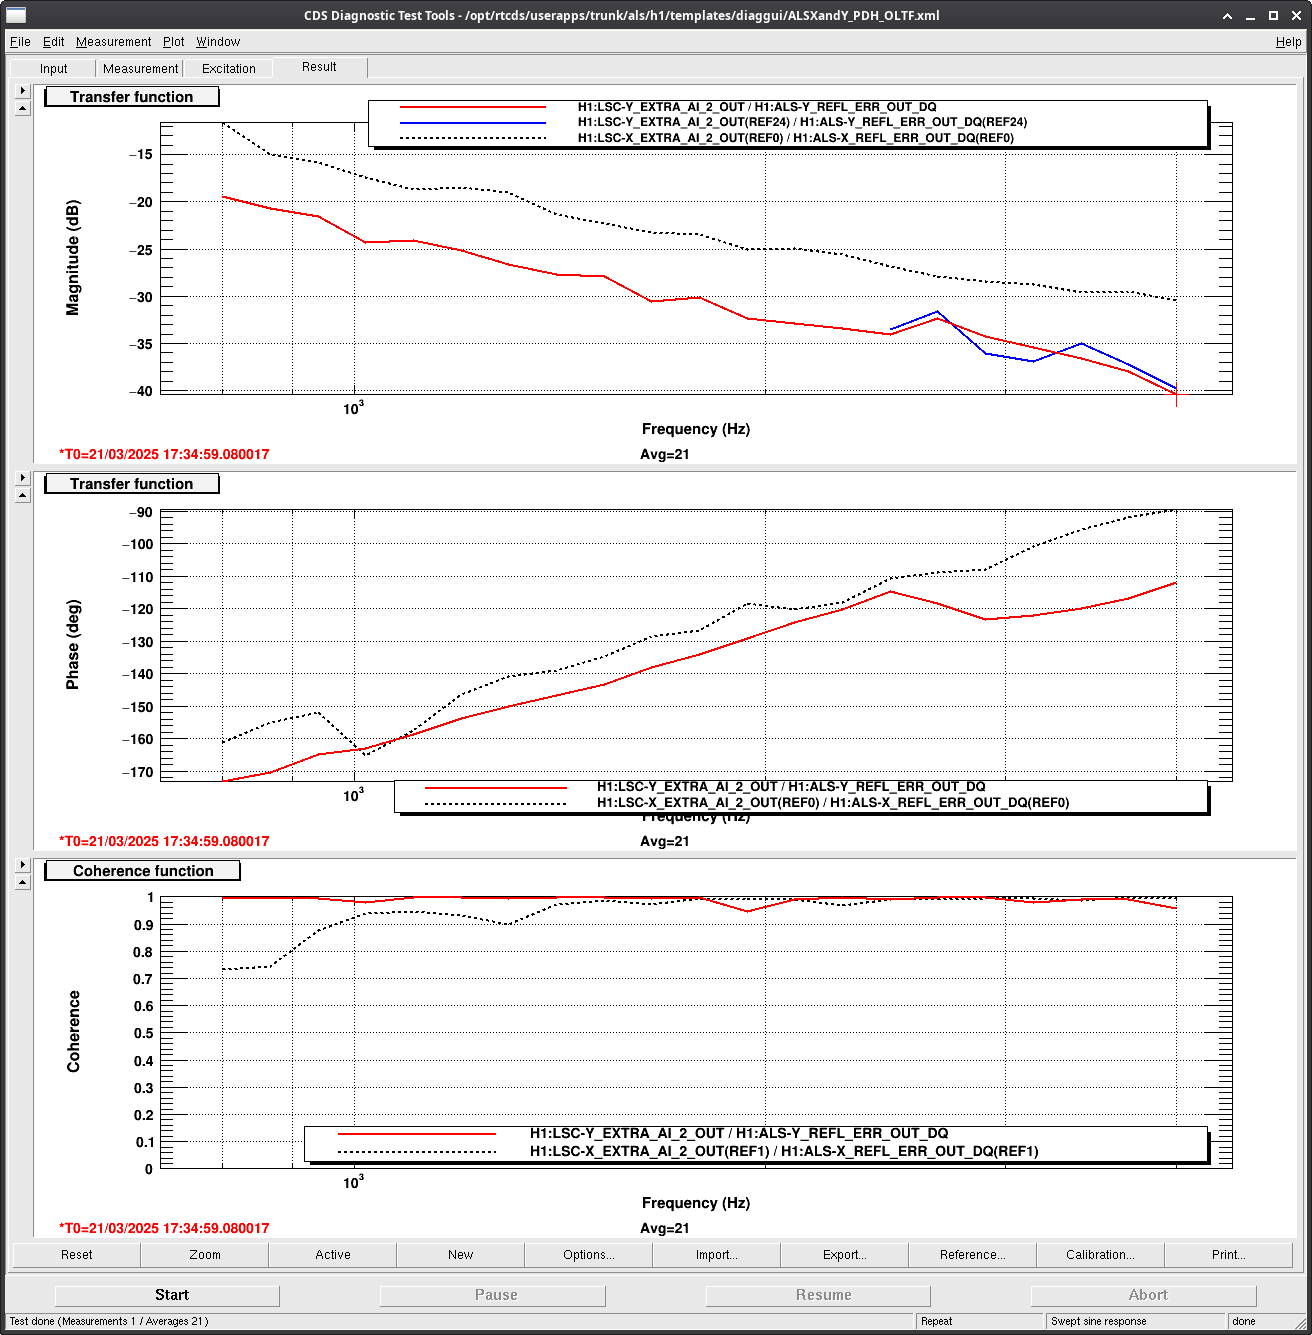
Since I changed the ramp time to 2 seconds for the second time, there hasn't been a change in the rate of these locklosses, there have been 8 per nln lockloss since March 18th at 21 UTC. I've now changed the ramp time back just to avoid an unnecessary change to ALS.
Oli used data from the lockloss tool to make this useful plot showing how many locklosses we've had from the LOCKING_ALS state (state 15 for ISC_LOCK), blue shows the total number of state 15 locklosses for that day and orange shows those that were tagged as high wind or EQ. This shows the problem starting on the 22nd or 23rd UTC time, which might line up in time with this change to the ALS demod phase and locking gain: https://alog.ligo-wa.caltech.edu/aLOG/index.php?callRep=82388
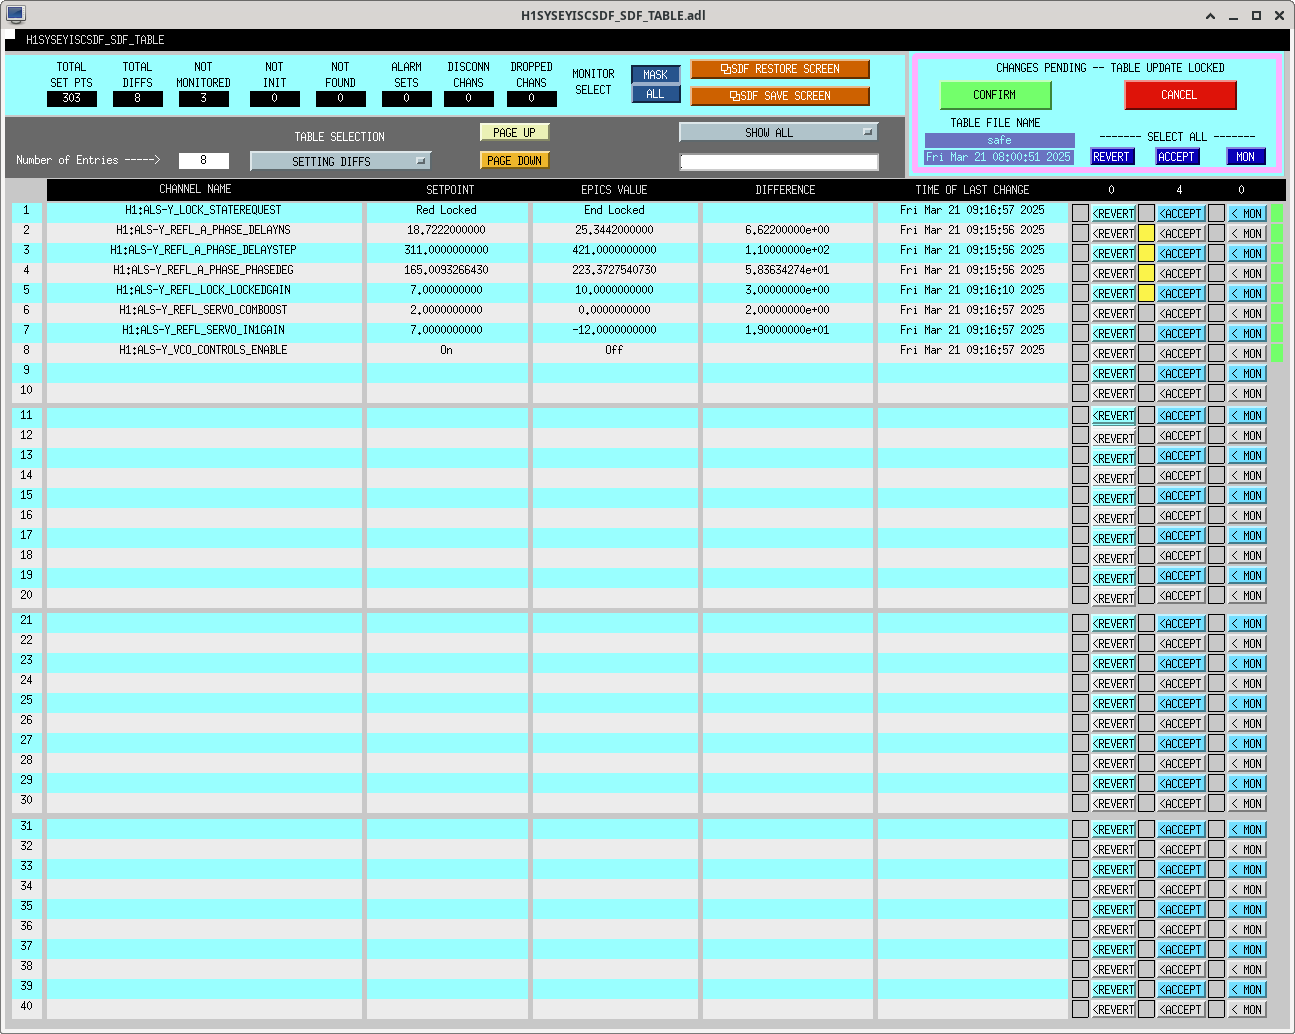
Because of the large EQ right now, we can't lock the Y arm to measure the TF. I've reverted the changes, and accepted the changes in SDF safe.snap. They will need to be accepted in observe. It would also be a good idea to measure the OLG when we can.
FAMIS 26376, last checked in alog83399
Laser Status:
NPRO output power is 1.834W
AMP1 output power is 70.15W
AMP2 output power is 140.0W
NPRO watchdog is GREEN
AMP1 watchdog is GREEN
AMP2 watchdog is GREEN
PDWD watchdog is GREEN
PMC:
It has been locked 44 days, 19 hr 39 minutes
Reflected power = 22.58W
Transmitted power = 106.0W
PowerSum = 128.5W
FSS:
It has been locked for 0 days 0 hr and 12 min
TPD[V] = 0.7967V
ISS:
The diffracted power is around 3.9%
Last saturation event was 0 days 0 hours and 55 minutes ago
Possible Issues: None reported
Lockloss @ 15:00 UTC - link to lockloss tool
S-waves from two M6.2 earthquakes, one from Panama and another from the Aleutians, AK hit at pretty much the same time, sending H1 into EQ mode and losing lock. Since the R-waves are still 15 minutes out from the Panama quake and there have already been some aftershocks, I'm leaving H1 in DOWN until those pass by.
TITLE: 03/21 Day Shift: 1430-2330 UTC (0730-1630 PST), all times posted in UTC
STATE of H1: Observing at 141Mpc
OUTGOING OPERATOR: Ibrahim
CURRENT ENVIRONMENT:
SEI_ENV state: CALM
Wind: 23mph Gusts, 18mph 3min avg
Primary useism: 0.04 μm/s
Secondary useism: 0.34 μm/s
QUICK SUMMARY: H1 has been locked and observing for almost an hour; two locklosses overnight. Ibrahim notes he was called this morning and I've cleared the H1_MANAGER alert.
IFO is in NLN and OBSERVING as of 13:43 UTC <5 minutes after getting the OWL call. I did not touch anything.
Was called at 6:37AM. Logged on to check what the problem was but it seemed that we just hit the 2 hour post-lock OWL call threshold, seemingly due to high winds preventing lock/causing lock acquisition lock losses.
By 6:41AM, we were locked and OBSERVING by 6:43 AM.
I am having issues clearing the OWL due to a NoMachine Malfunction. Will leave it to DAY OPS in 30 mins.
(Gerardo, Janos, Rogers Machinery Techs (Samuel Ragsdale and Brandon Pimentel))
Late entry.
On Tuesday, we had a couple of service technicians from Rogers Machinery complete the annual maintenance for the Kobelco compressor, no hiccups were encountered during the maintenance job.
A couple of notes regarding the service:
The compressor will be ready to use once we test and get an acceptable dew point.
(Jordan, Gerardo, Janos)
Late entry.
Last Tuesday 3 ion pumps were incorporated to the filter cavity tube. The ion pumps were installed some time ago, and they remained valved out until last Tuesday.
The ion pumps are located on the filter cavity tube crosses B4, B5 (installed here) and C1 (installed here).
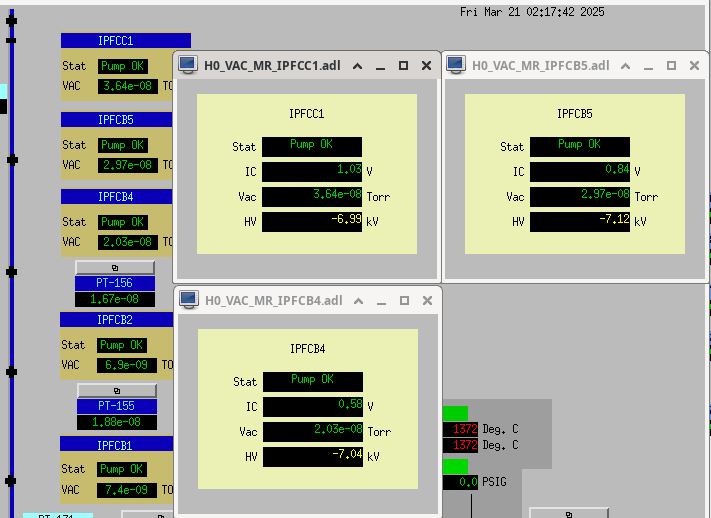
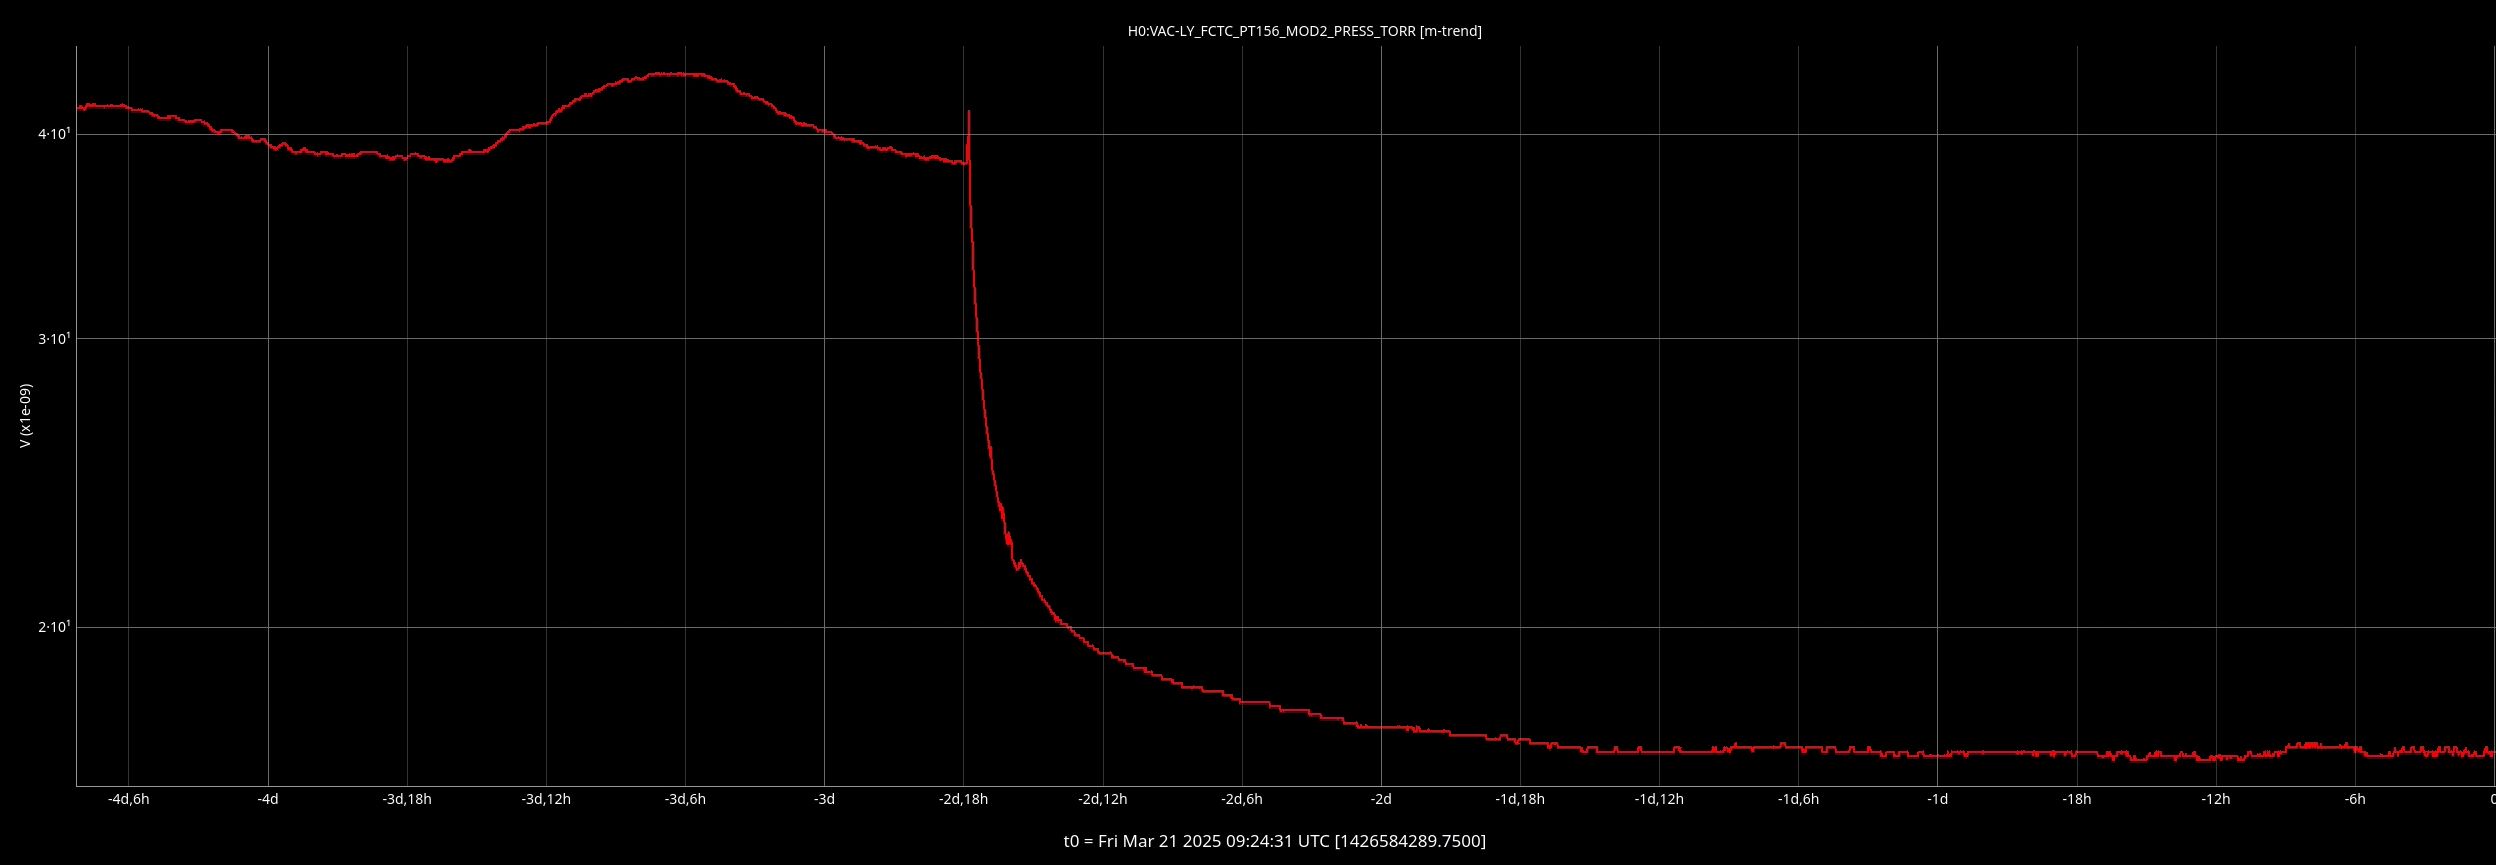
New MEDM screens were created for the signal for each pump (see first attachment), each respective signal is obtained from each of the ion pump controllers, for these ion pump we are using the LPC GAMMA type controllers. For the pressure effect see second attachment.
To incorporate the ion pumps, FC-B-4 and FC-B-5 to the rest of the filter cavity 3 valves were closed, FCV-3, FCV-4 and FCV-5. Then to incorporate ion pump FC-C-1, valve FCV-6 was closed. After the performance of the ion pumps was confirmed all the gate valves were opened.
TITLE: 03/21 Eve Shift: 2330-0500 UTC (1630-2200 PST), all times posted in UTC
STATE of H1: Observing at 149Mpc
INCOMING OPERATOR: Ibrahim
SHIFT SUMMARY: Relocking was automated and quick when the wind died down. We've been locked for ~ 4 hours.
LOG:
| Start Time | System | Name | Location | Lazer_Haz | Task | Time End |
|---|---|---|---|---|---|---|
| 19:57 | LASER HAZ | LASER HAZARD | LVEA (\u2310\u25a0_\u25a0) | YES | LVEA IS LASER HAZARD (\u2310\u25a0_\u25a0) | 06:36 |
| 00:46 | ISS | Mayank | Optics lab | N | Inspect a PD | 01:03 |
01:11 UTC Observing
TITLE: 03/20 Day Shift: 1430-2330 UTC (0730-1630 PST), all times posted in UTC
STATE of H1: Wind
CURRENT ENVIRONMENT:
SEI_ENV state: CALM
Wind: 32mph Gusts, 19mph 3min avg
Primary useism: 0.05 μm/s
Secondary useism: 0.30 μm/s
INCOMING OPERATOR: Ryan C
SHIFT SUMMARY:
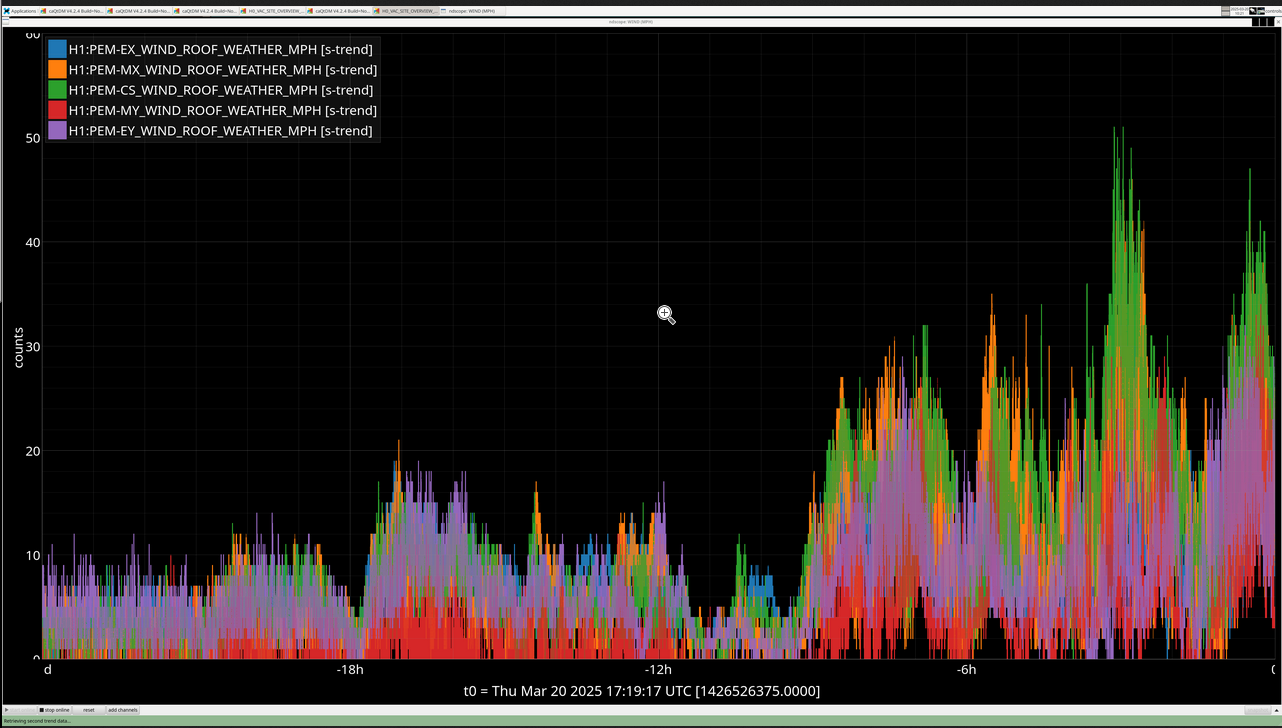
Today's Comissioning plans were marred by locklossed caused by sustained 30+ MPH wind speeds with 40-50 MPH gusts.
Initial_alignment had been done and a number of attempts to lock were tried during a handfull of slight breaks in the wind.
But those were all blown away with the tumbleweeds.
When the Wind was sustained about 35 MPH I was holding the IFO in IDLE.
Observatory mode was set to Windy.
LOG:
| Start Time | System | Name | Location | Lazer_Haz | Task | Time End |
|---|---|---|---|---|---|---|
| 19:57 | LASER HAZ | LASER HAZARD | LVEA (\u2310\u25a0_\u25a0) | YES | LVEA IS LASER HAZARD (\u2310\u25a0_\u25a0) | 06:36 |
| 14:43 | FAC | Nelly | Optics lab | N | Tech cleaning | 14:45 |
| 15:30 | FAC | Mitchel | HAM SHAQ & MY | N | HAM Shaquing | 15:52 |
| 16:12 | PEM | Robert | LVEA Input arm | Yes | Setting up power supplies. | 16:34 |
| 16:12 | SQZ | Mayank | CtrlRm | N | Testing SQZr Servo | 16:34 |
| 16:32 | FAC | Betsy & Mitchel | HAM1 | Yes | Retreiving Hardware & Parts | 18:32 |
| 16:54 | EE | Mark & Fil | CtrlRm | N | Running cableunder false floor | 18:54 |
| 17:05 | PCAL | Rick | PCAL Optics Lab | Yes | PCAL & ISS work | 19:05 |
| 19:19 | PEM | Robert | LVEA Input arm | Yes | Turning off power supplies. | 19:21 |
| 21:40 | ISC | Keita | Optics lab | N | Inventory for ISC parts | 22:12 |
| 21:48 | SEI | Mitchel | MY,EY | N | Getting parts | 22:27 |
| 22:21 | ISS | Rick & Rahul | Optics Lab | Yes | Working on ISS alignment | 22:26 |
TITLE: 03/20 Eve Shift: 2330-0500 UTC (1630-2200 PST), all times posted in UTC
STATE of H1: Wind
OUTGOING OPERATOR: Tony
CURRENT ENVIRONMENT:
SEI_ENV state: CALM
Wind: 36mph Gusts, 22mph 3min avg
Primary useism: 0.06 μm/s
Secondary useism: 0.38 μm/s
QUICK SUMMARY:
The wind started to drop around 00:20 UTC so I went for it and we were able to relock.
01:11 UTC Observing
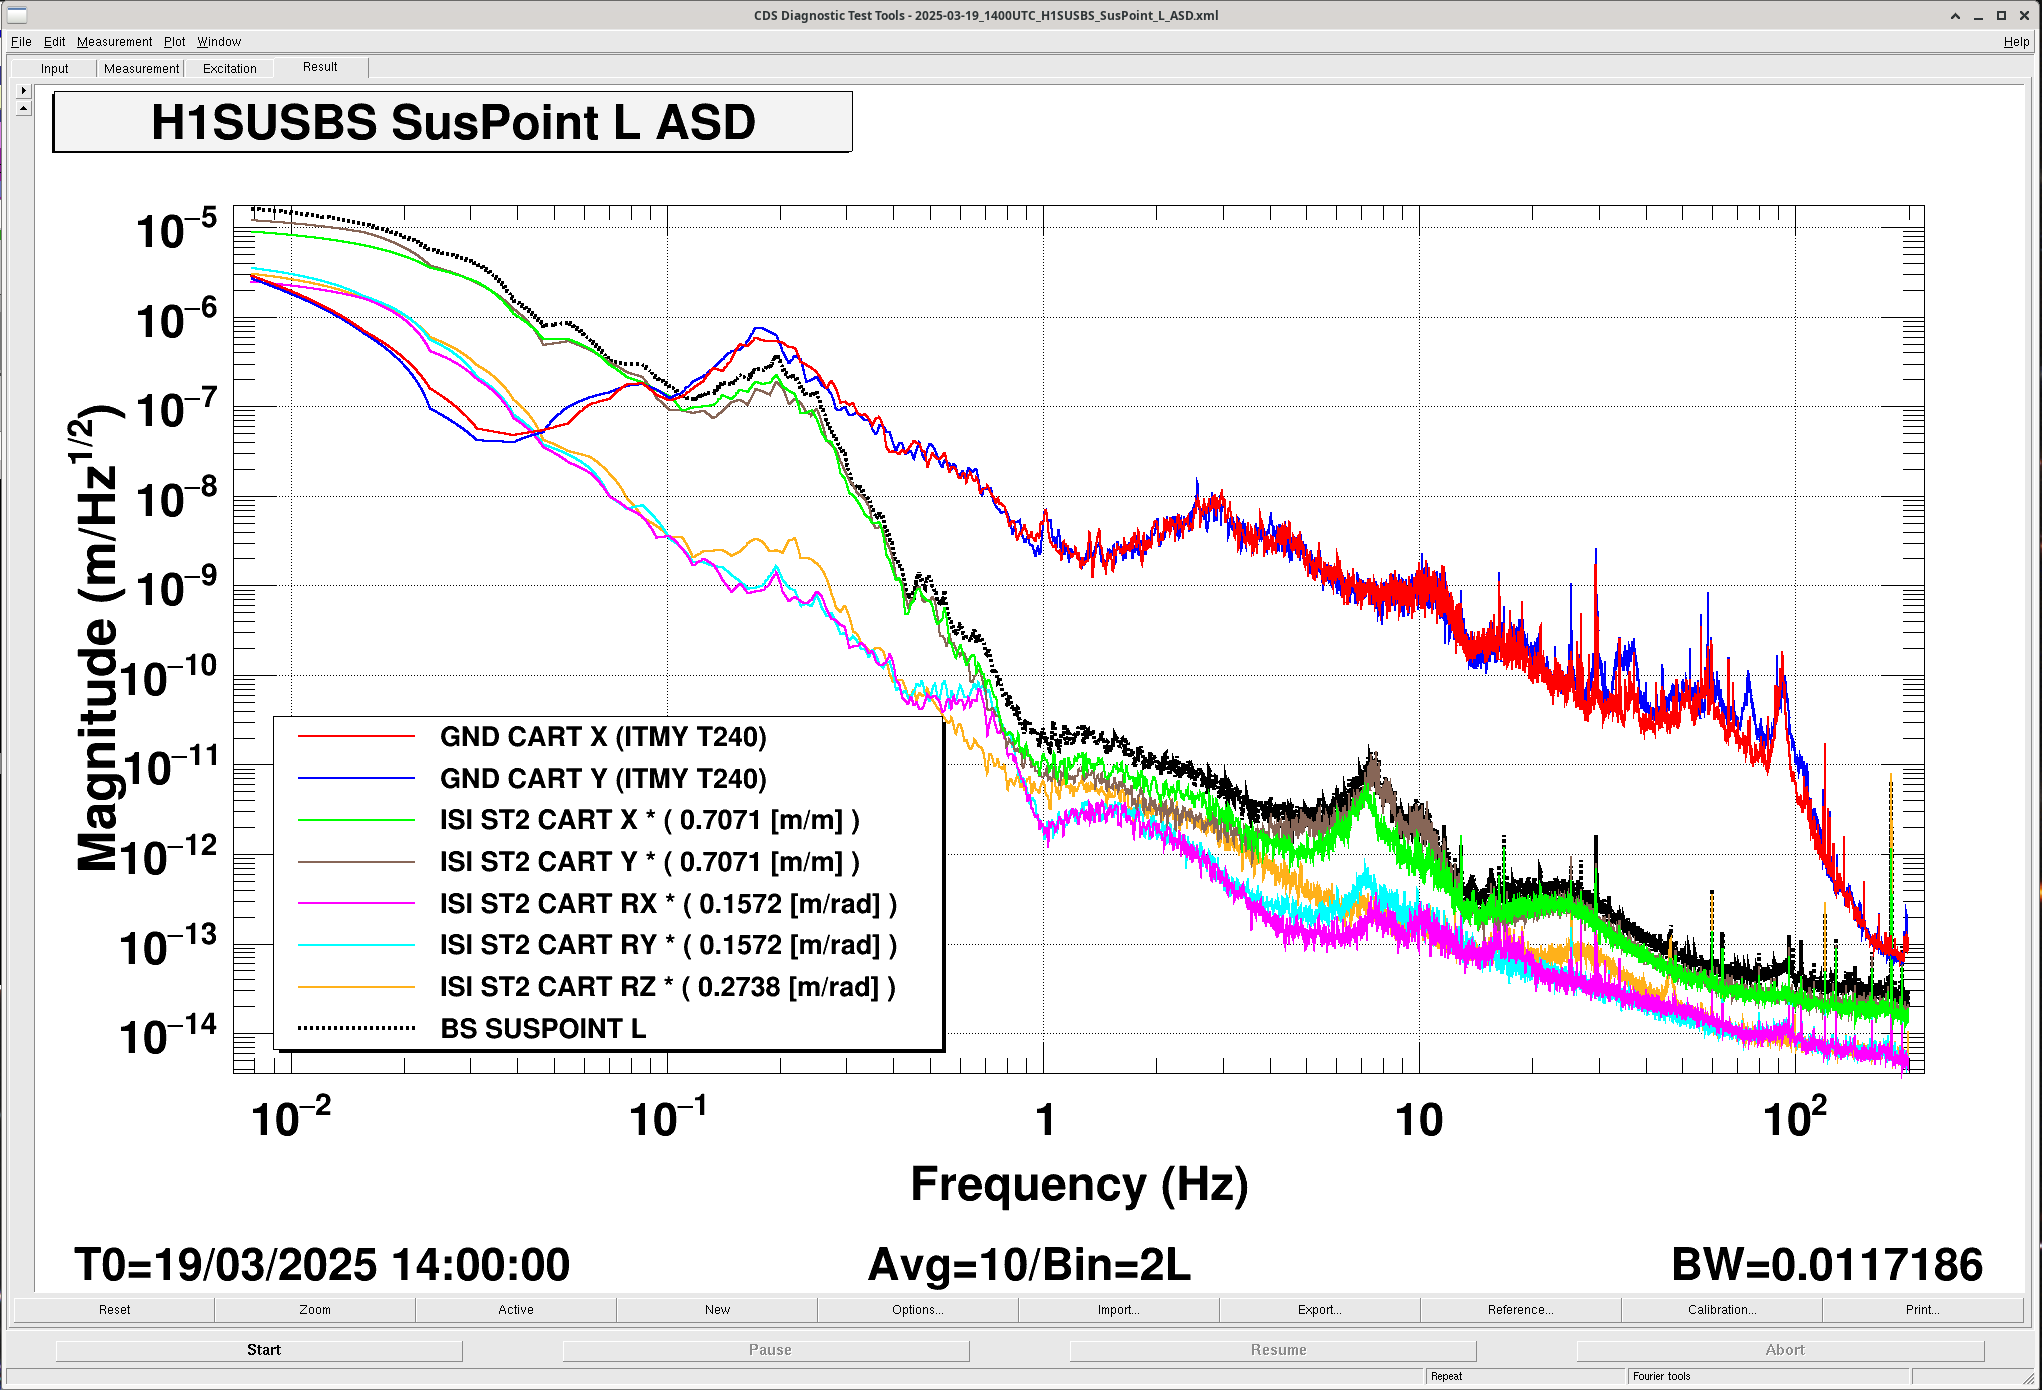
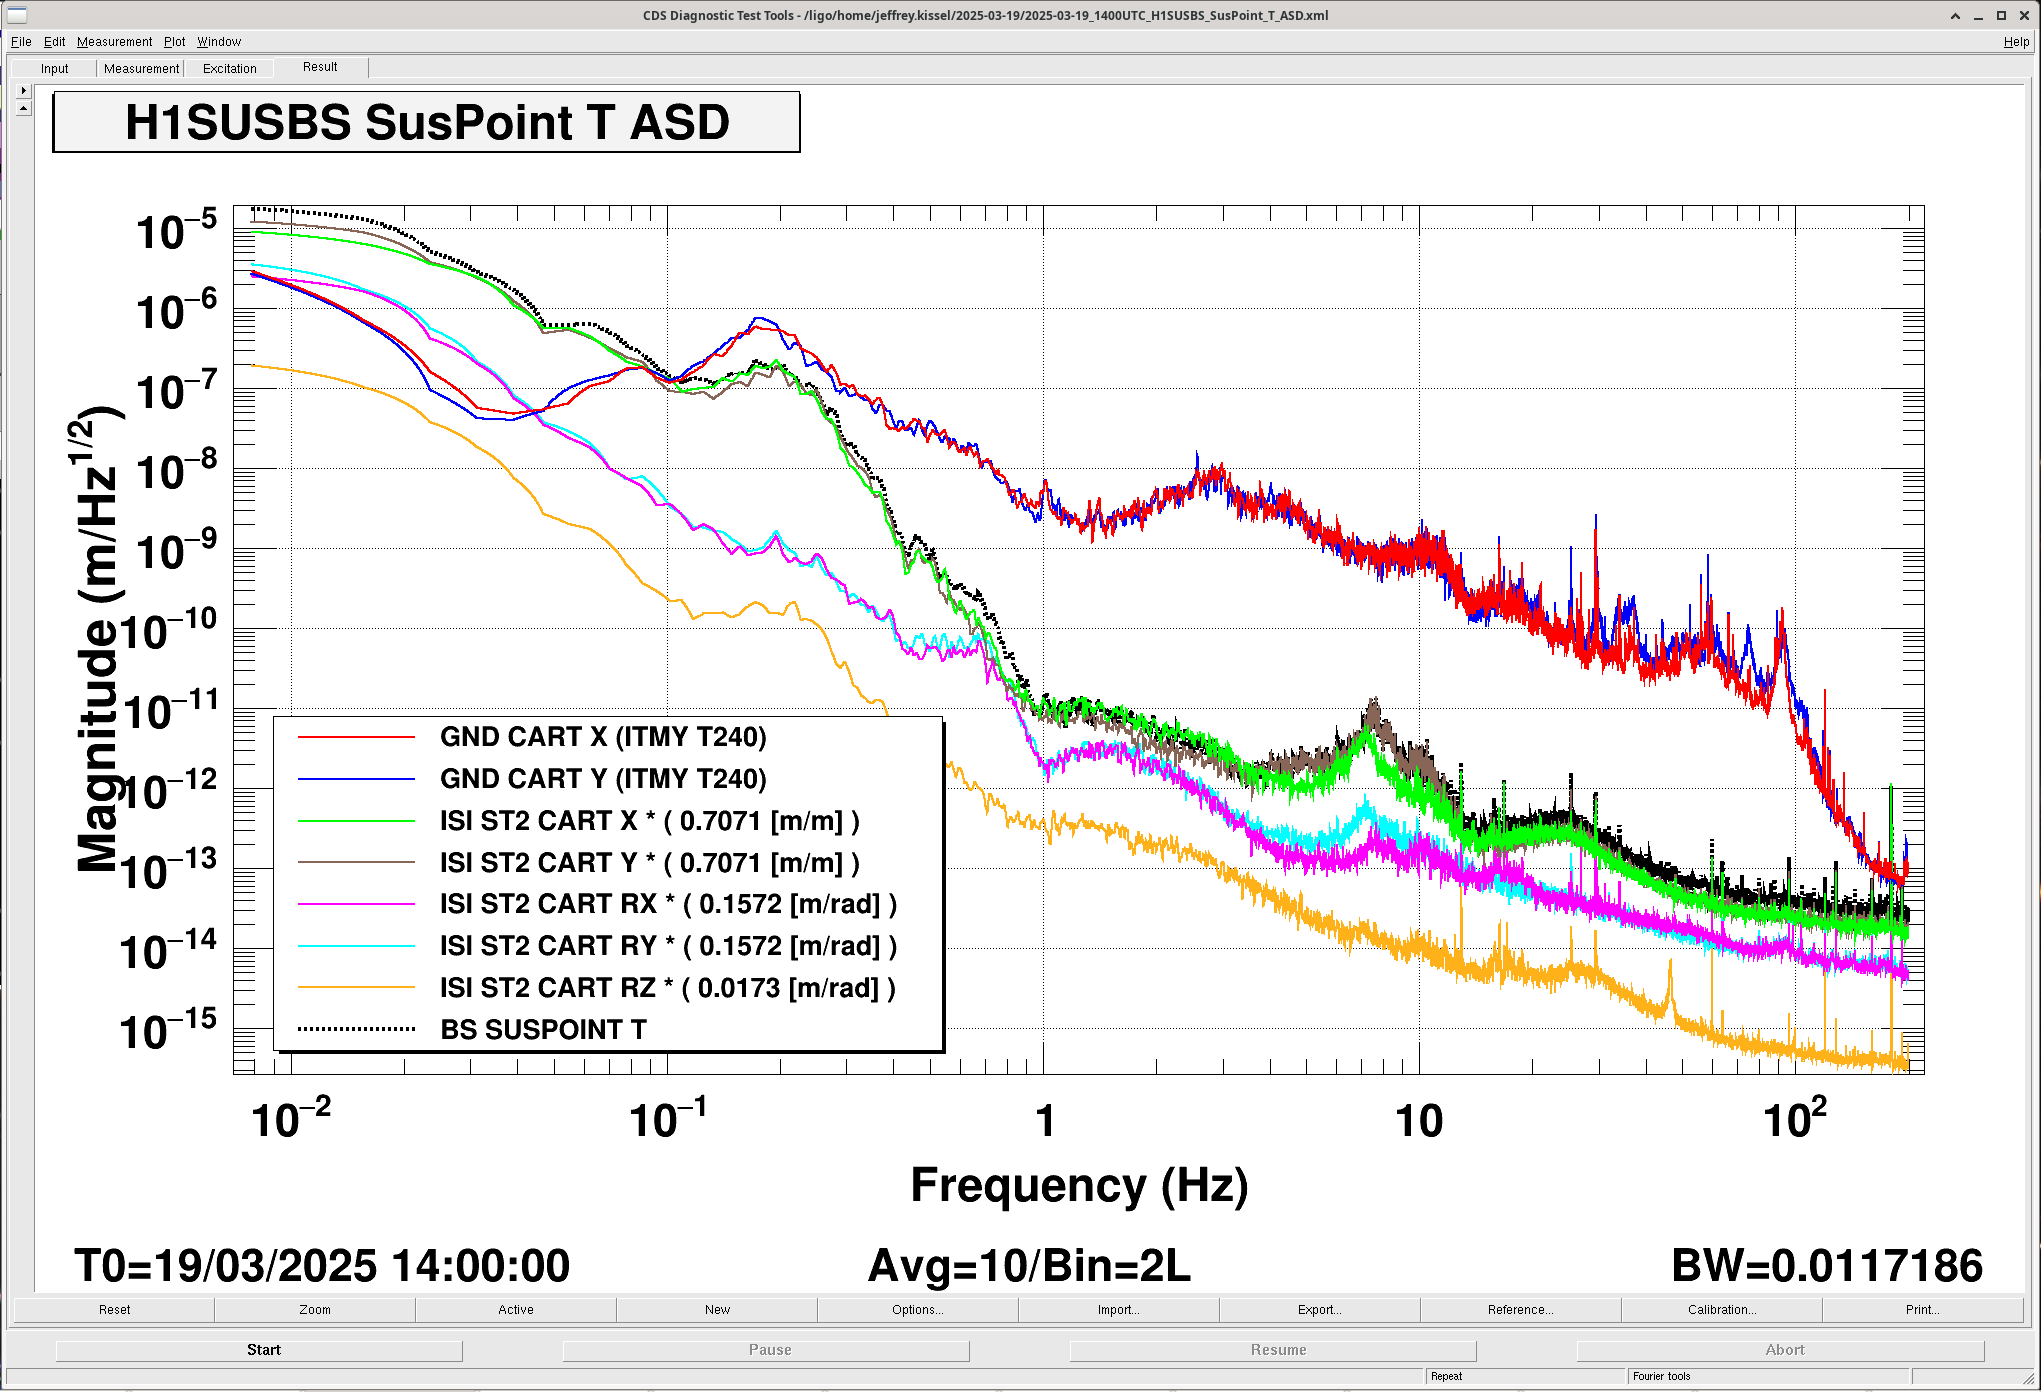
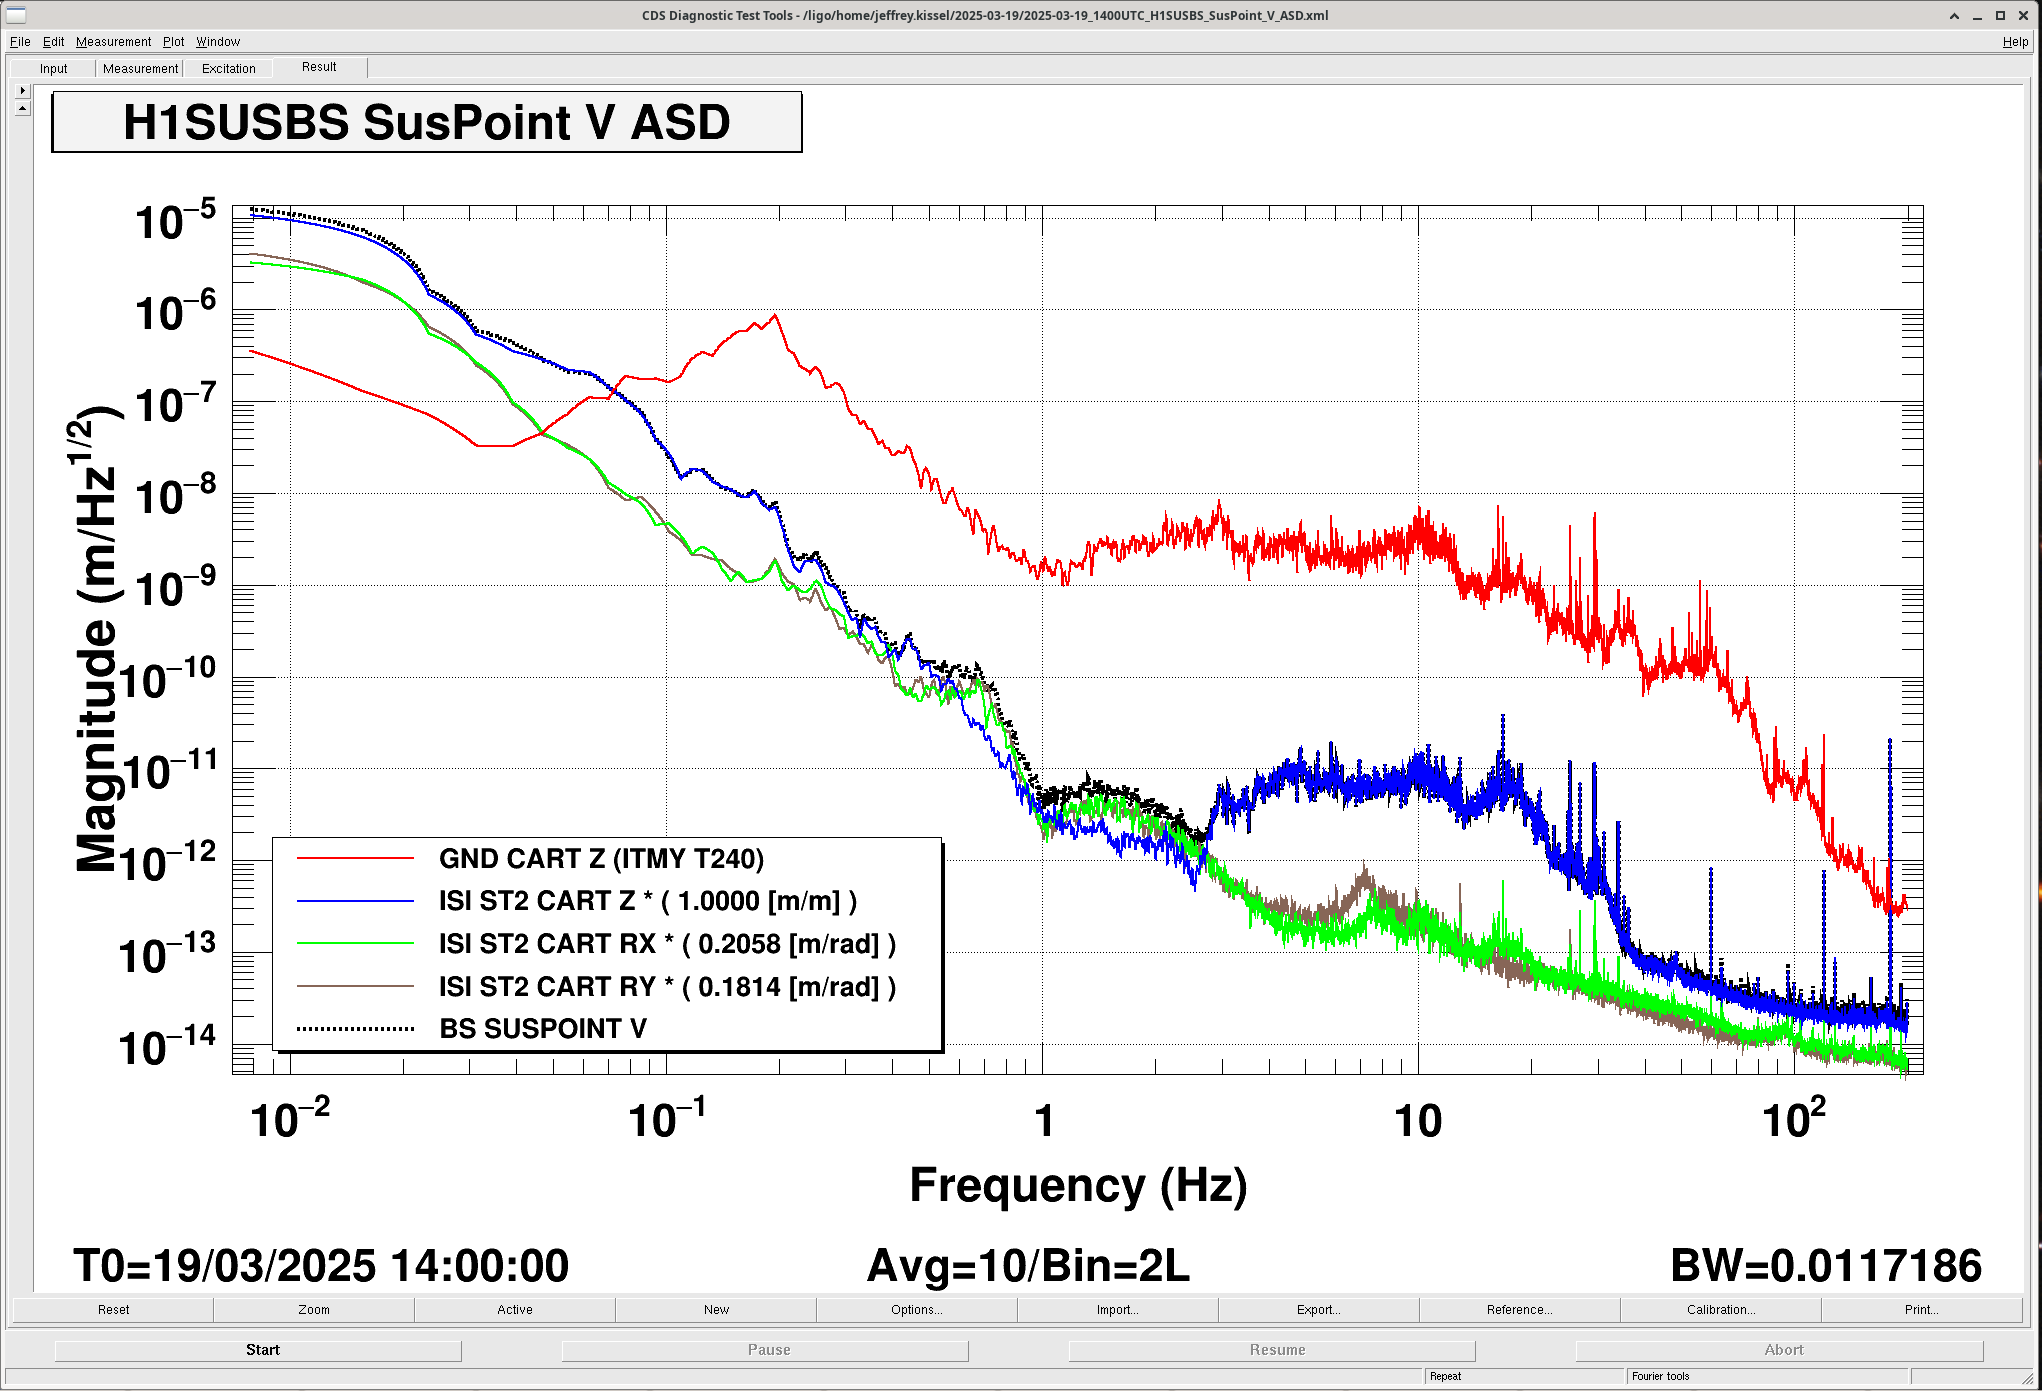
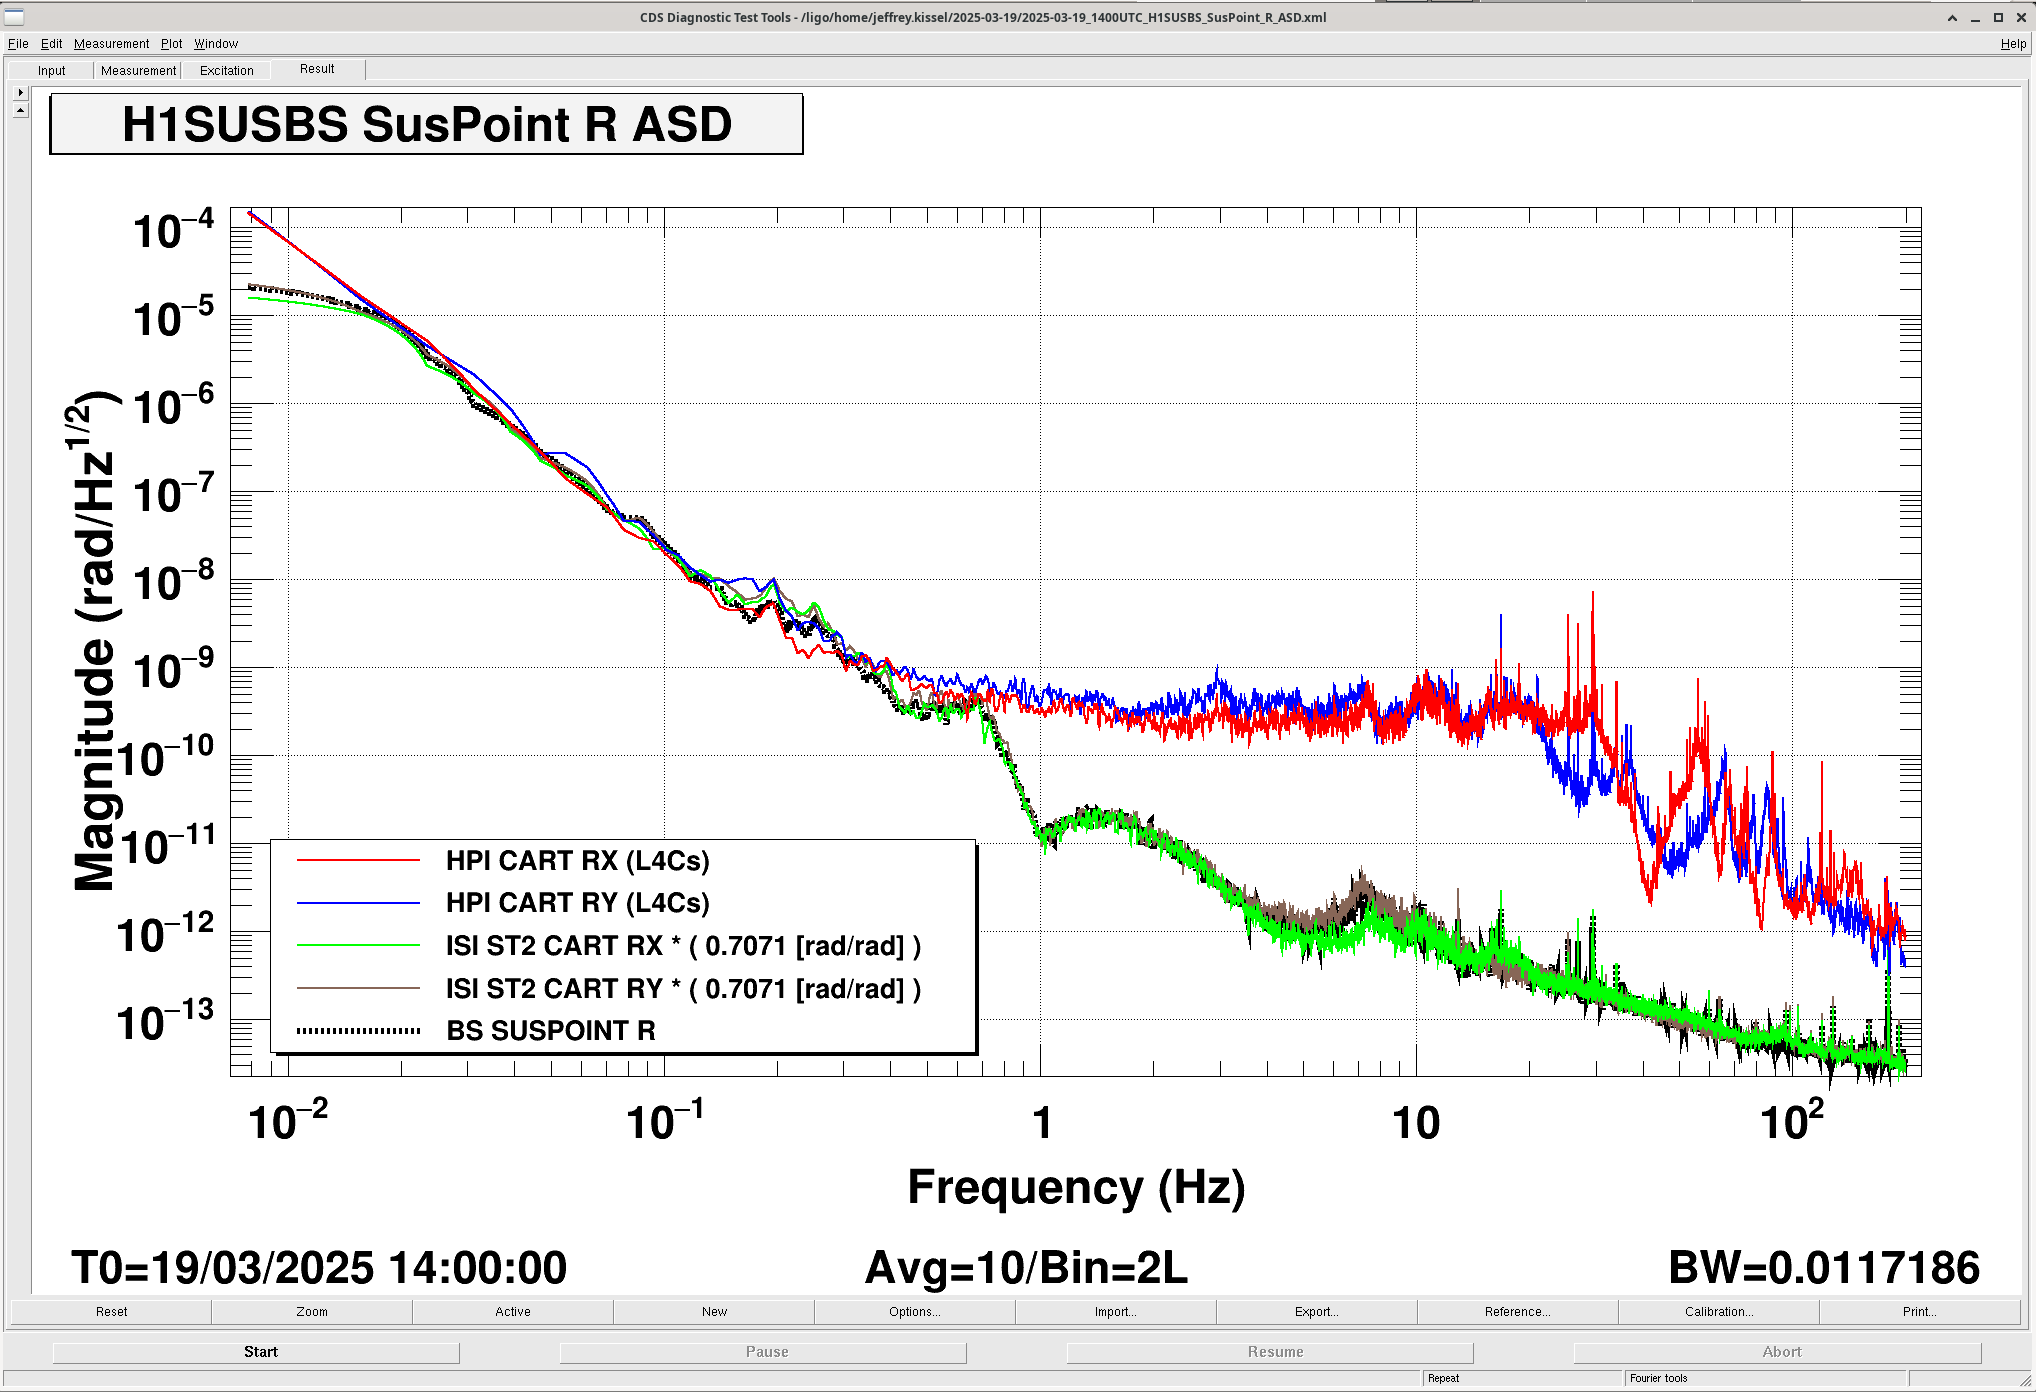
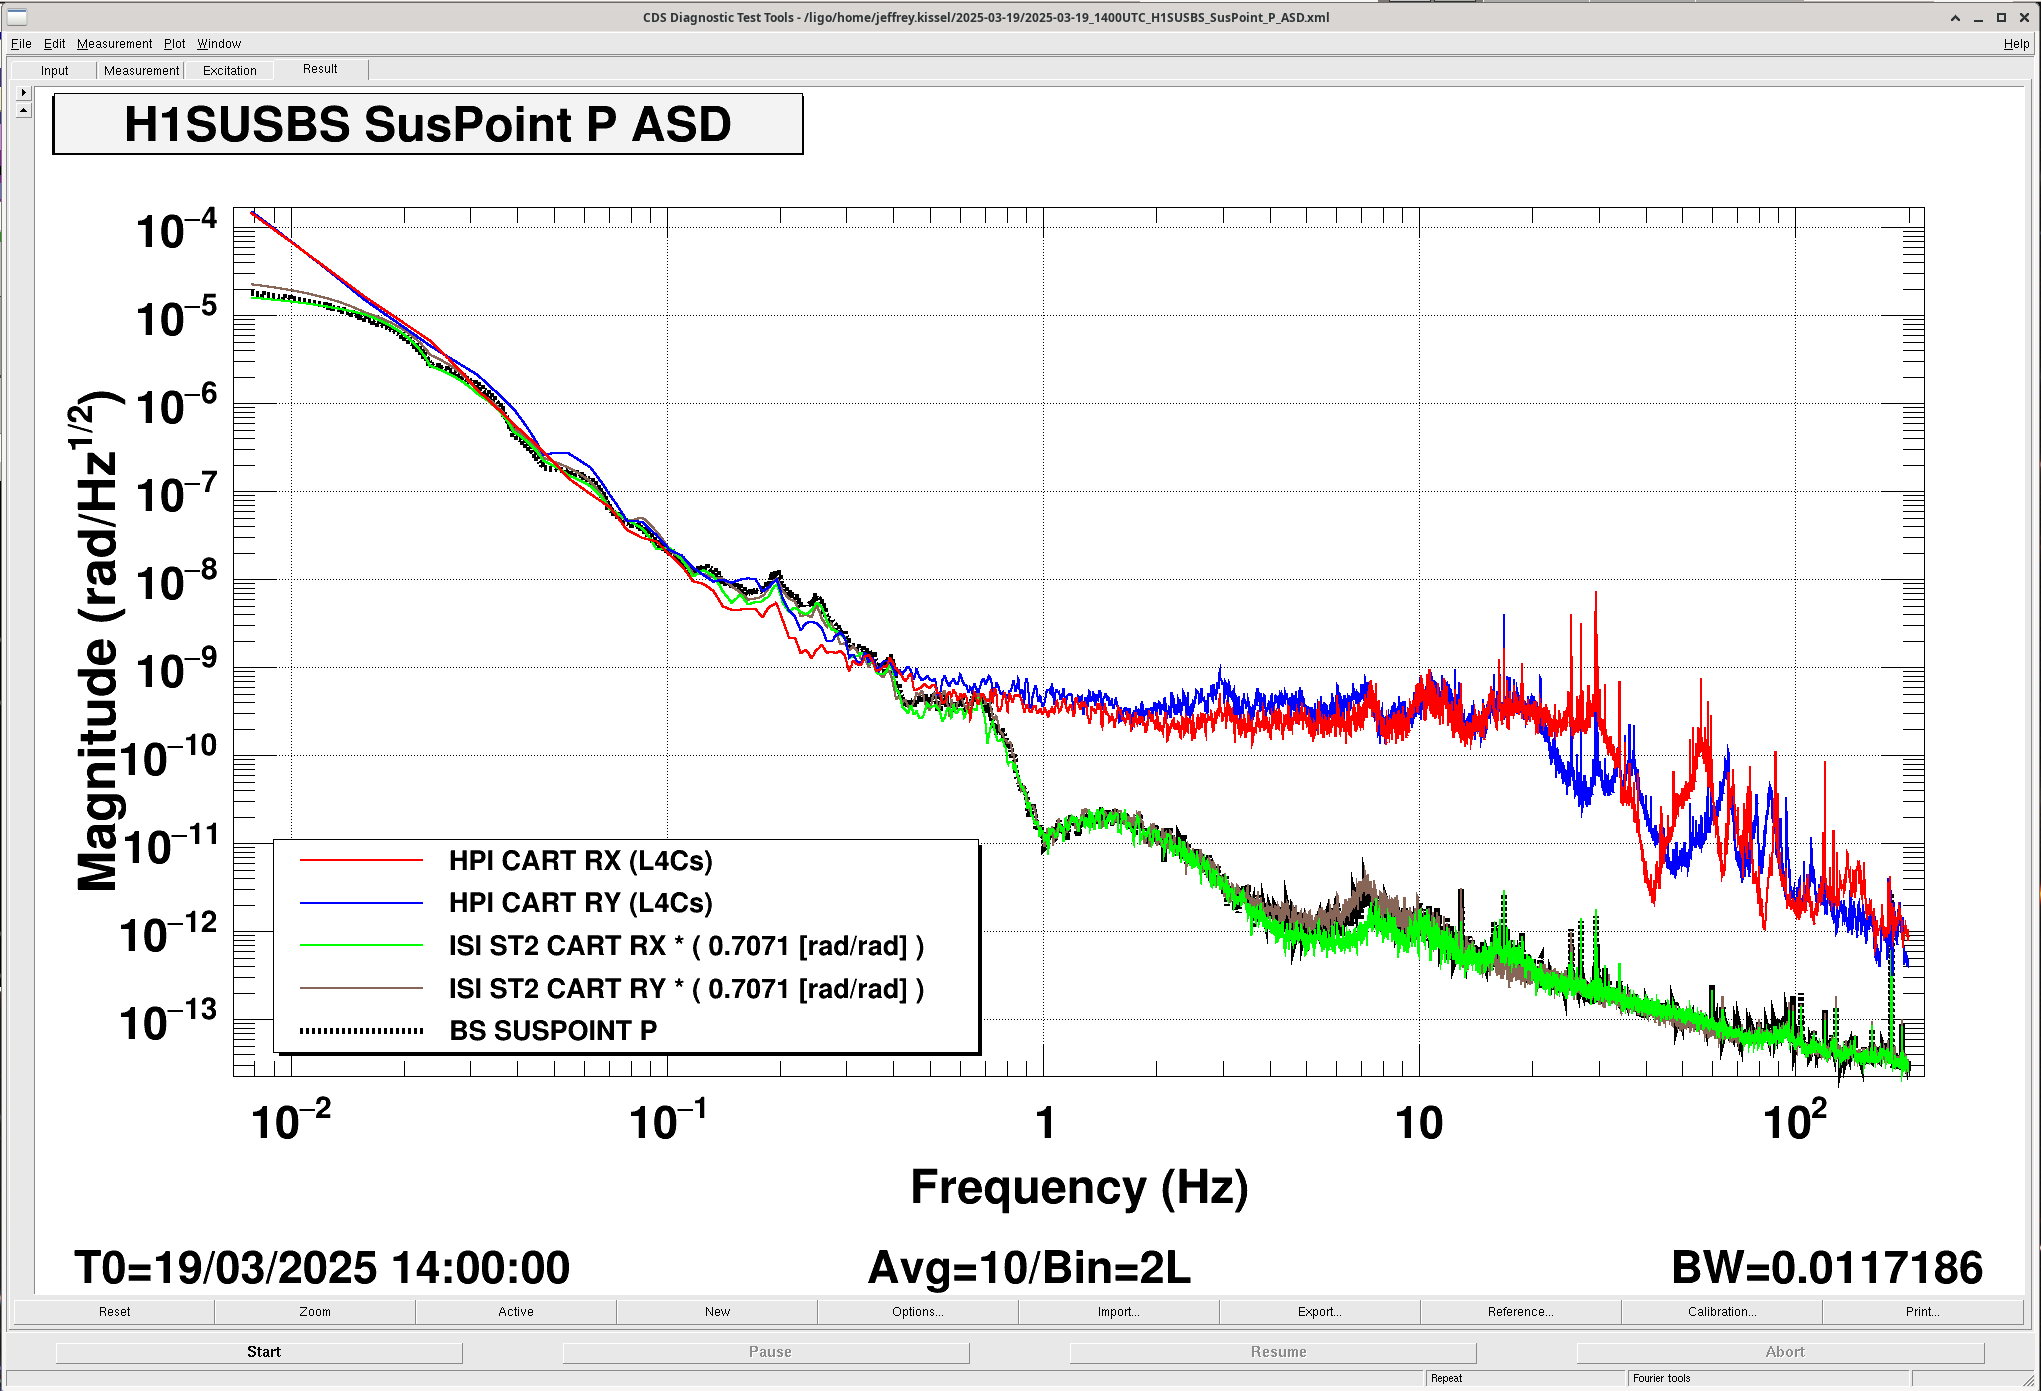
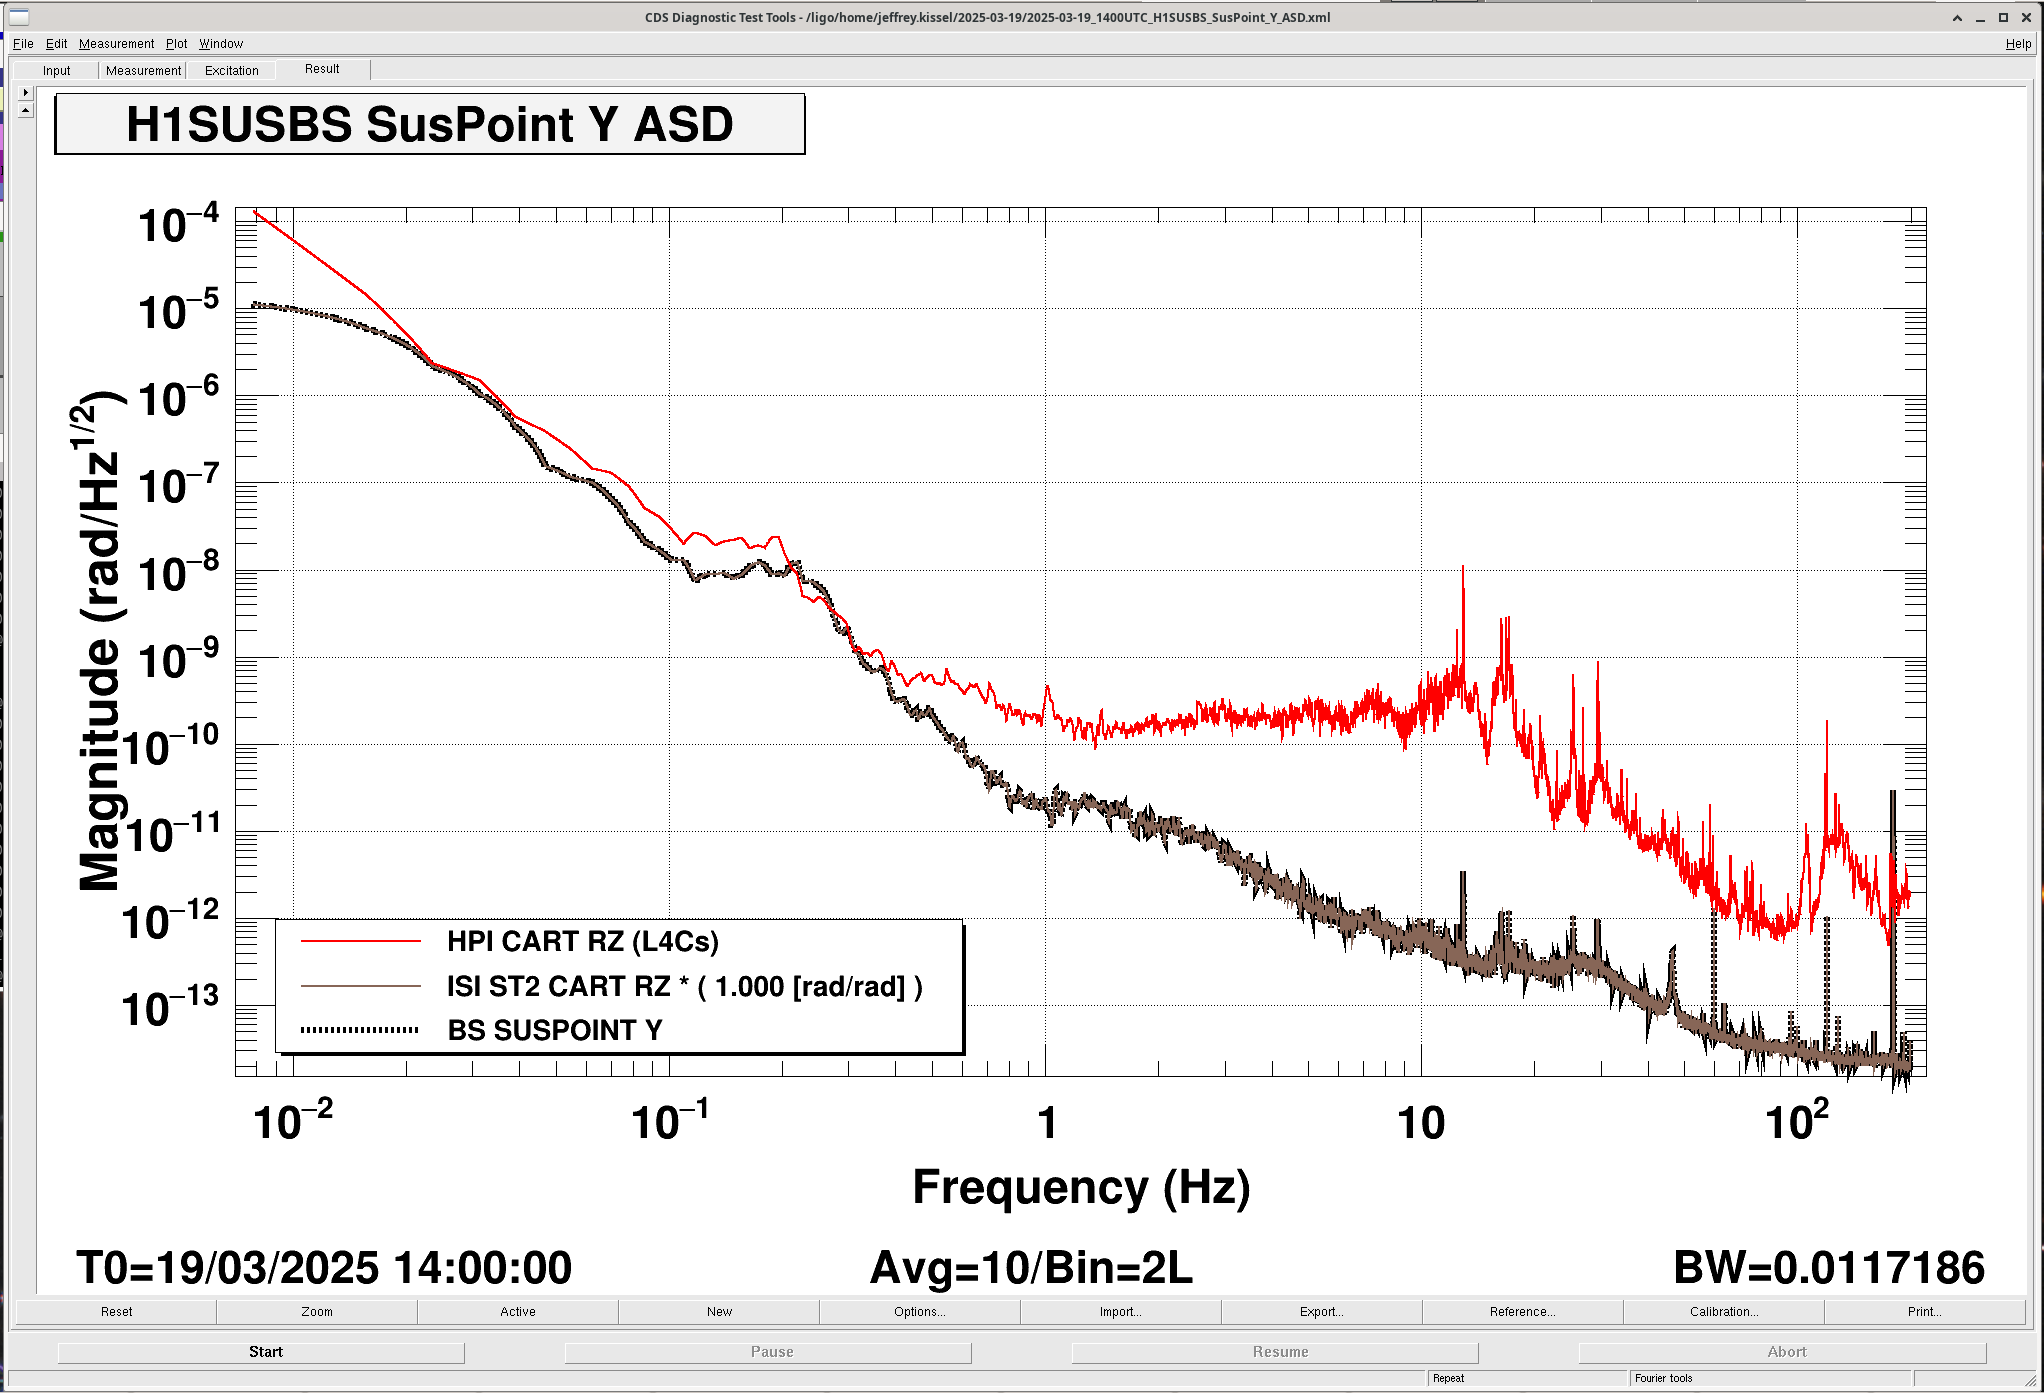
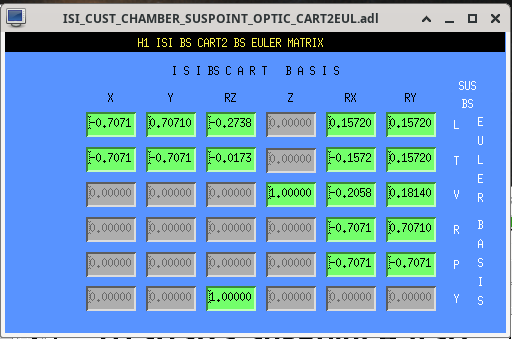
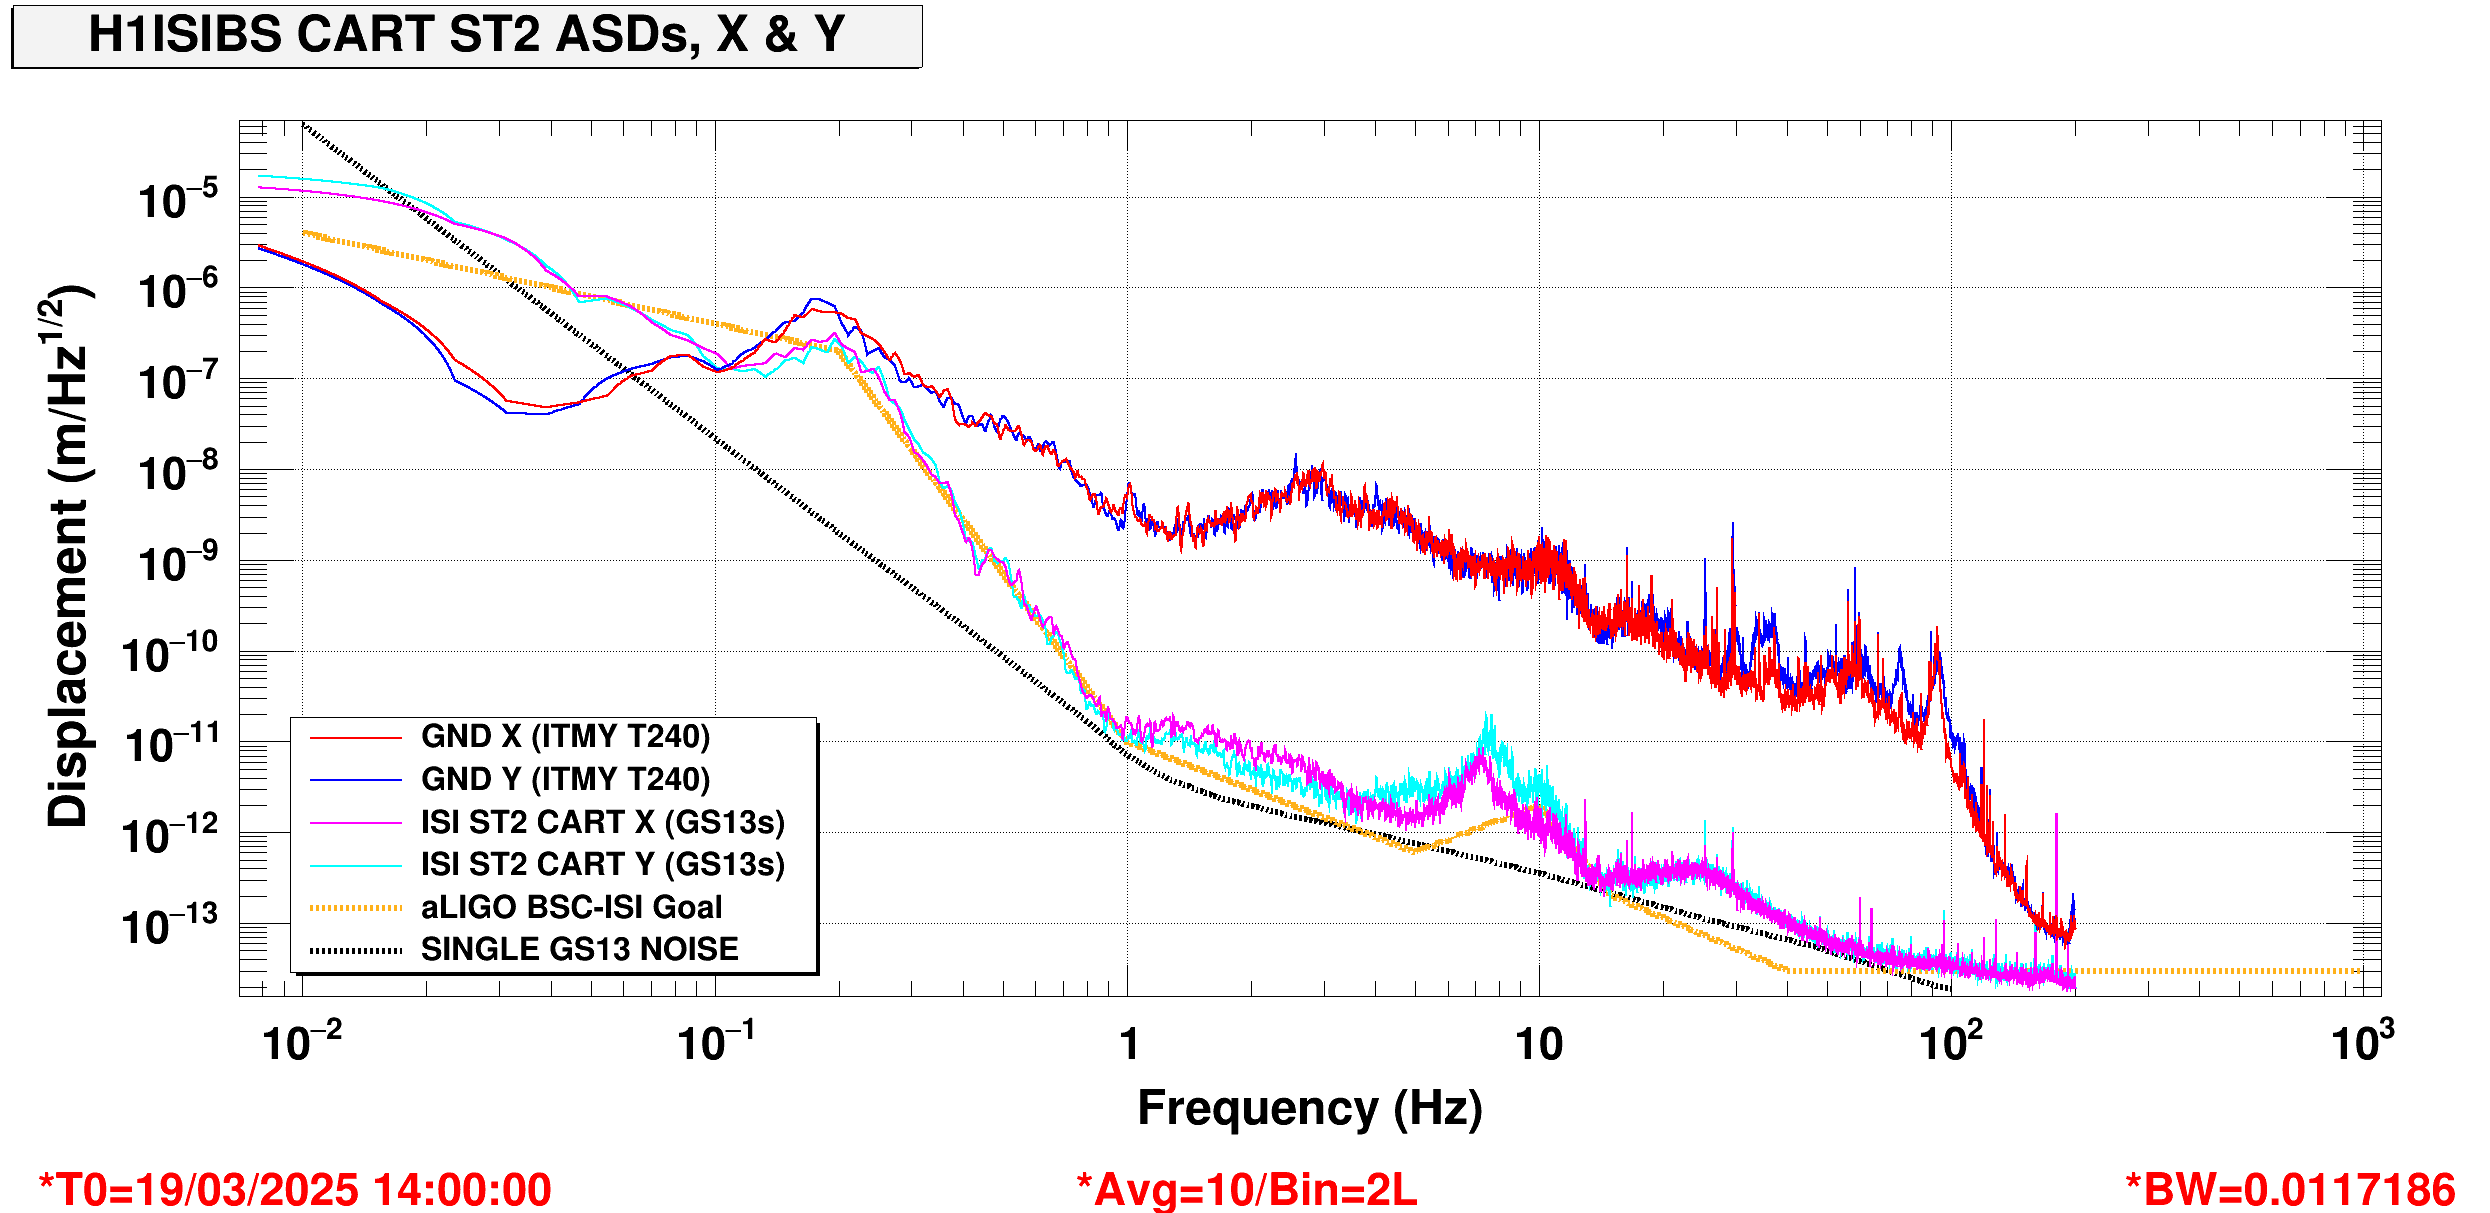
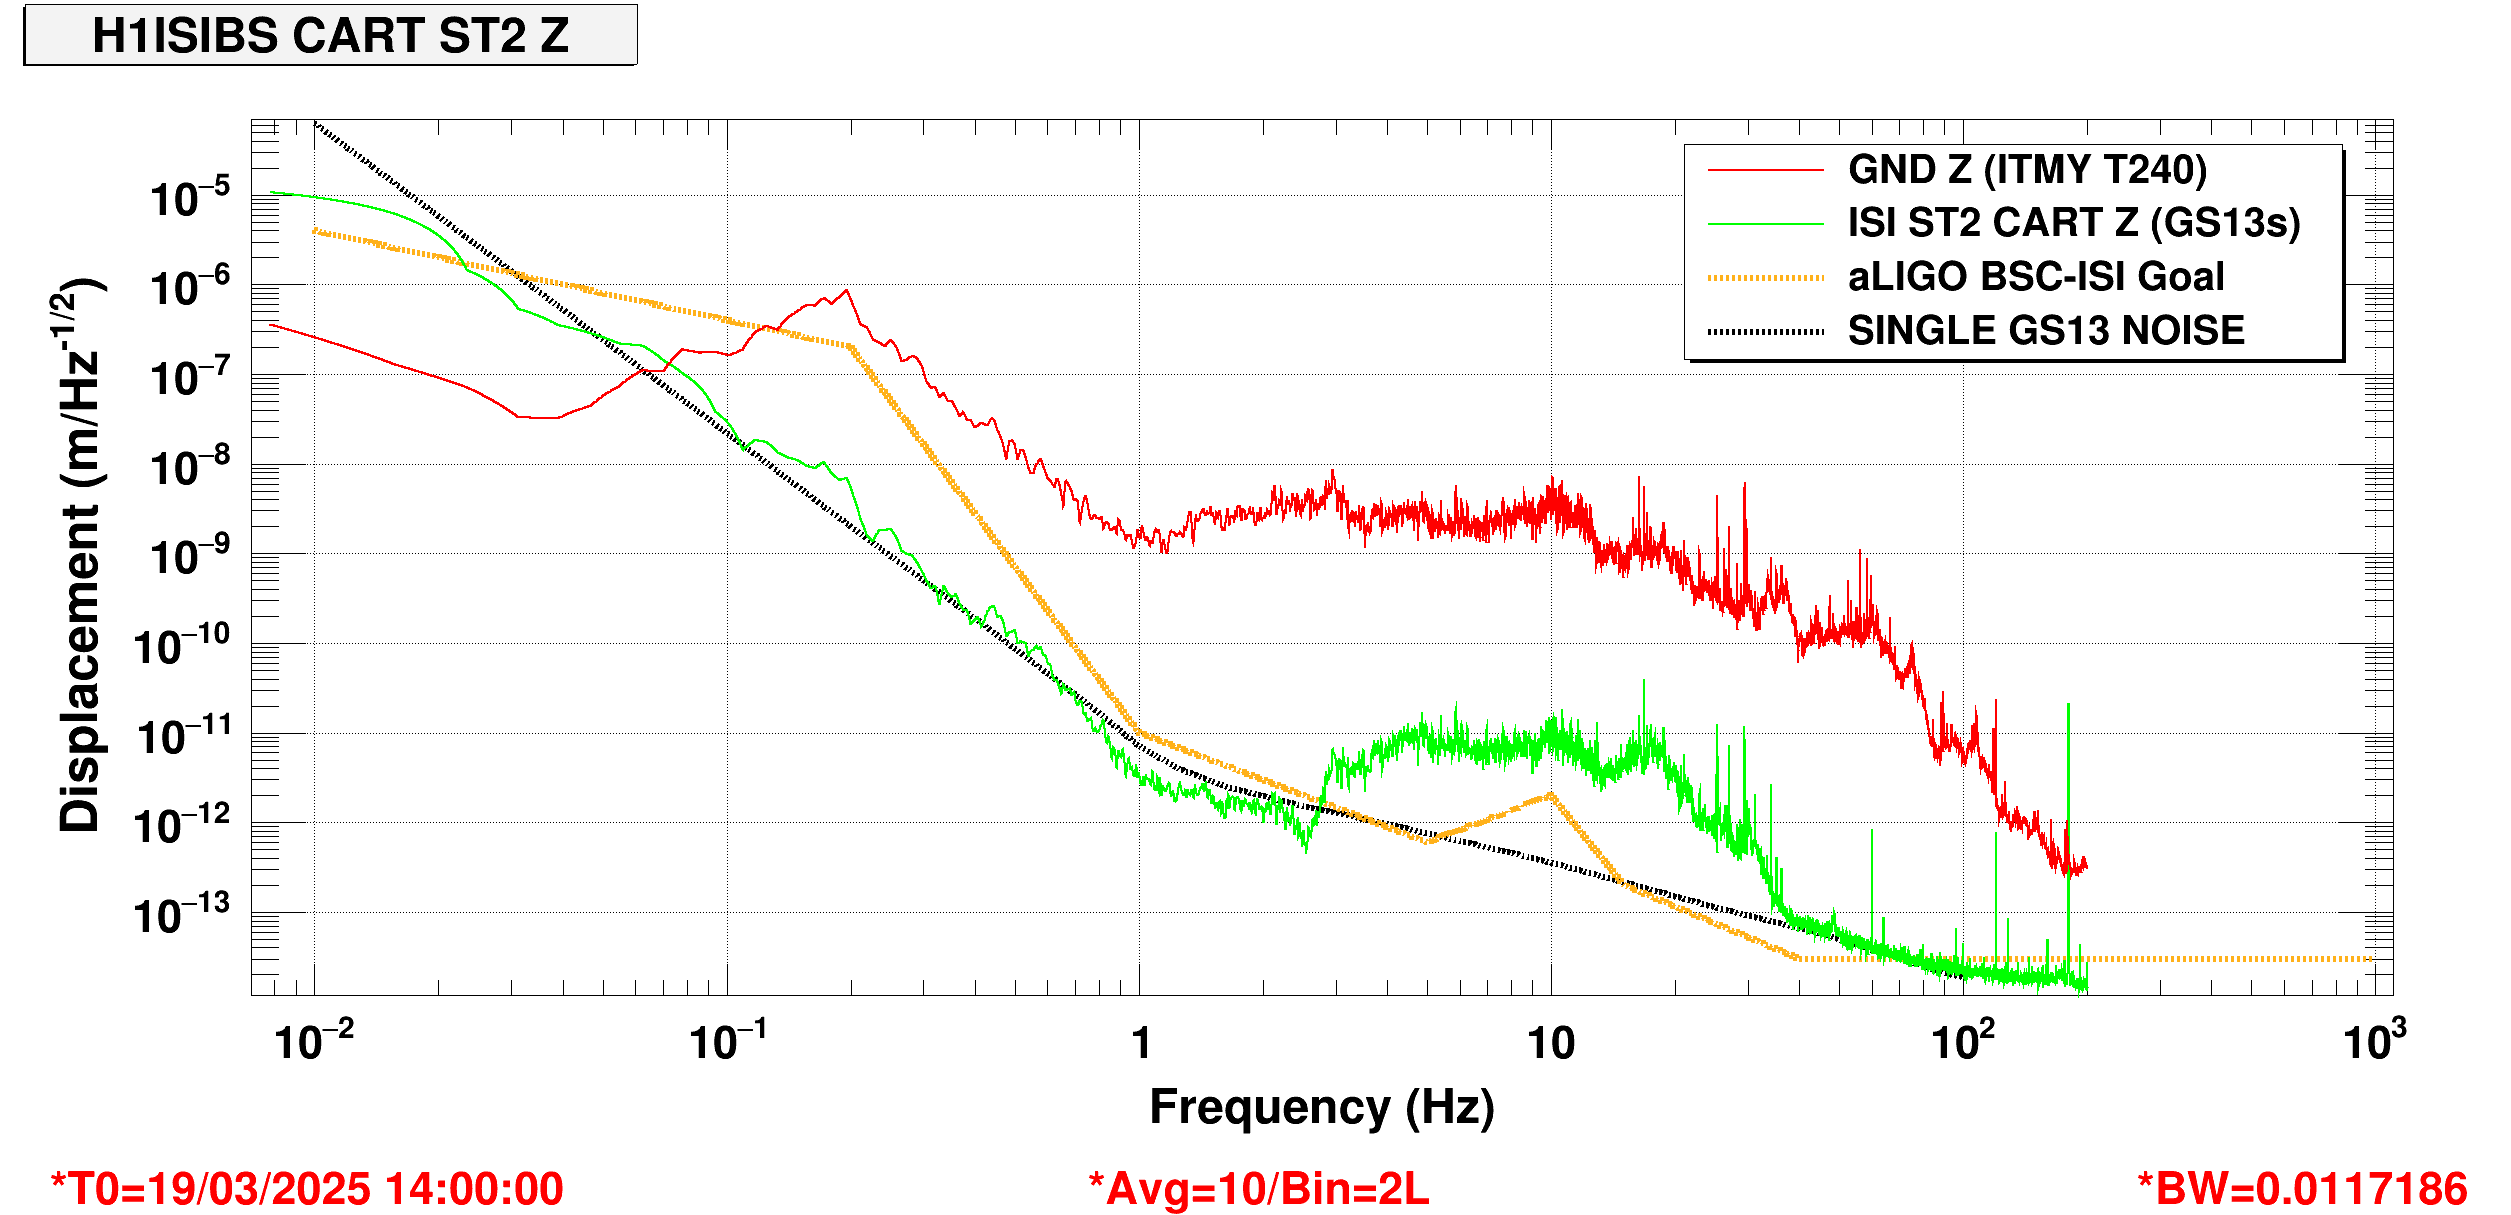
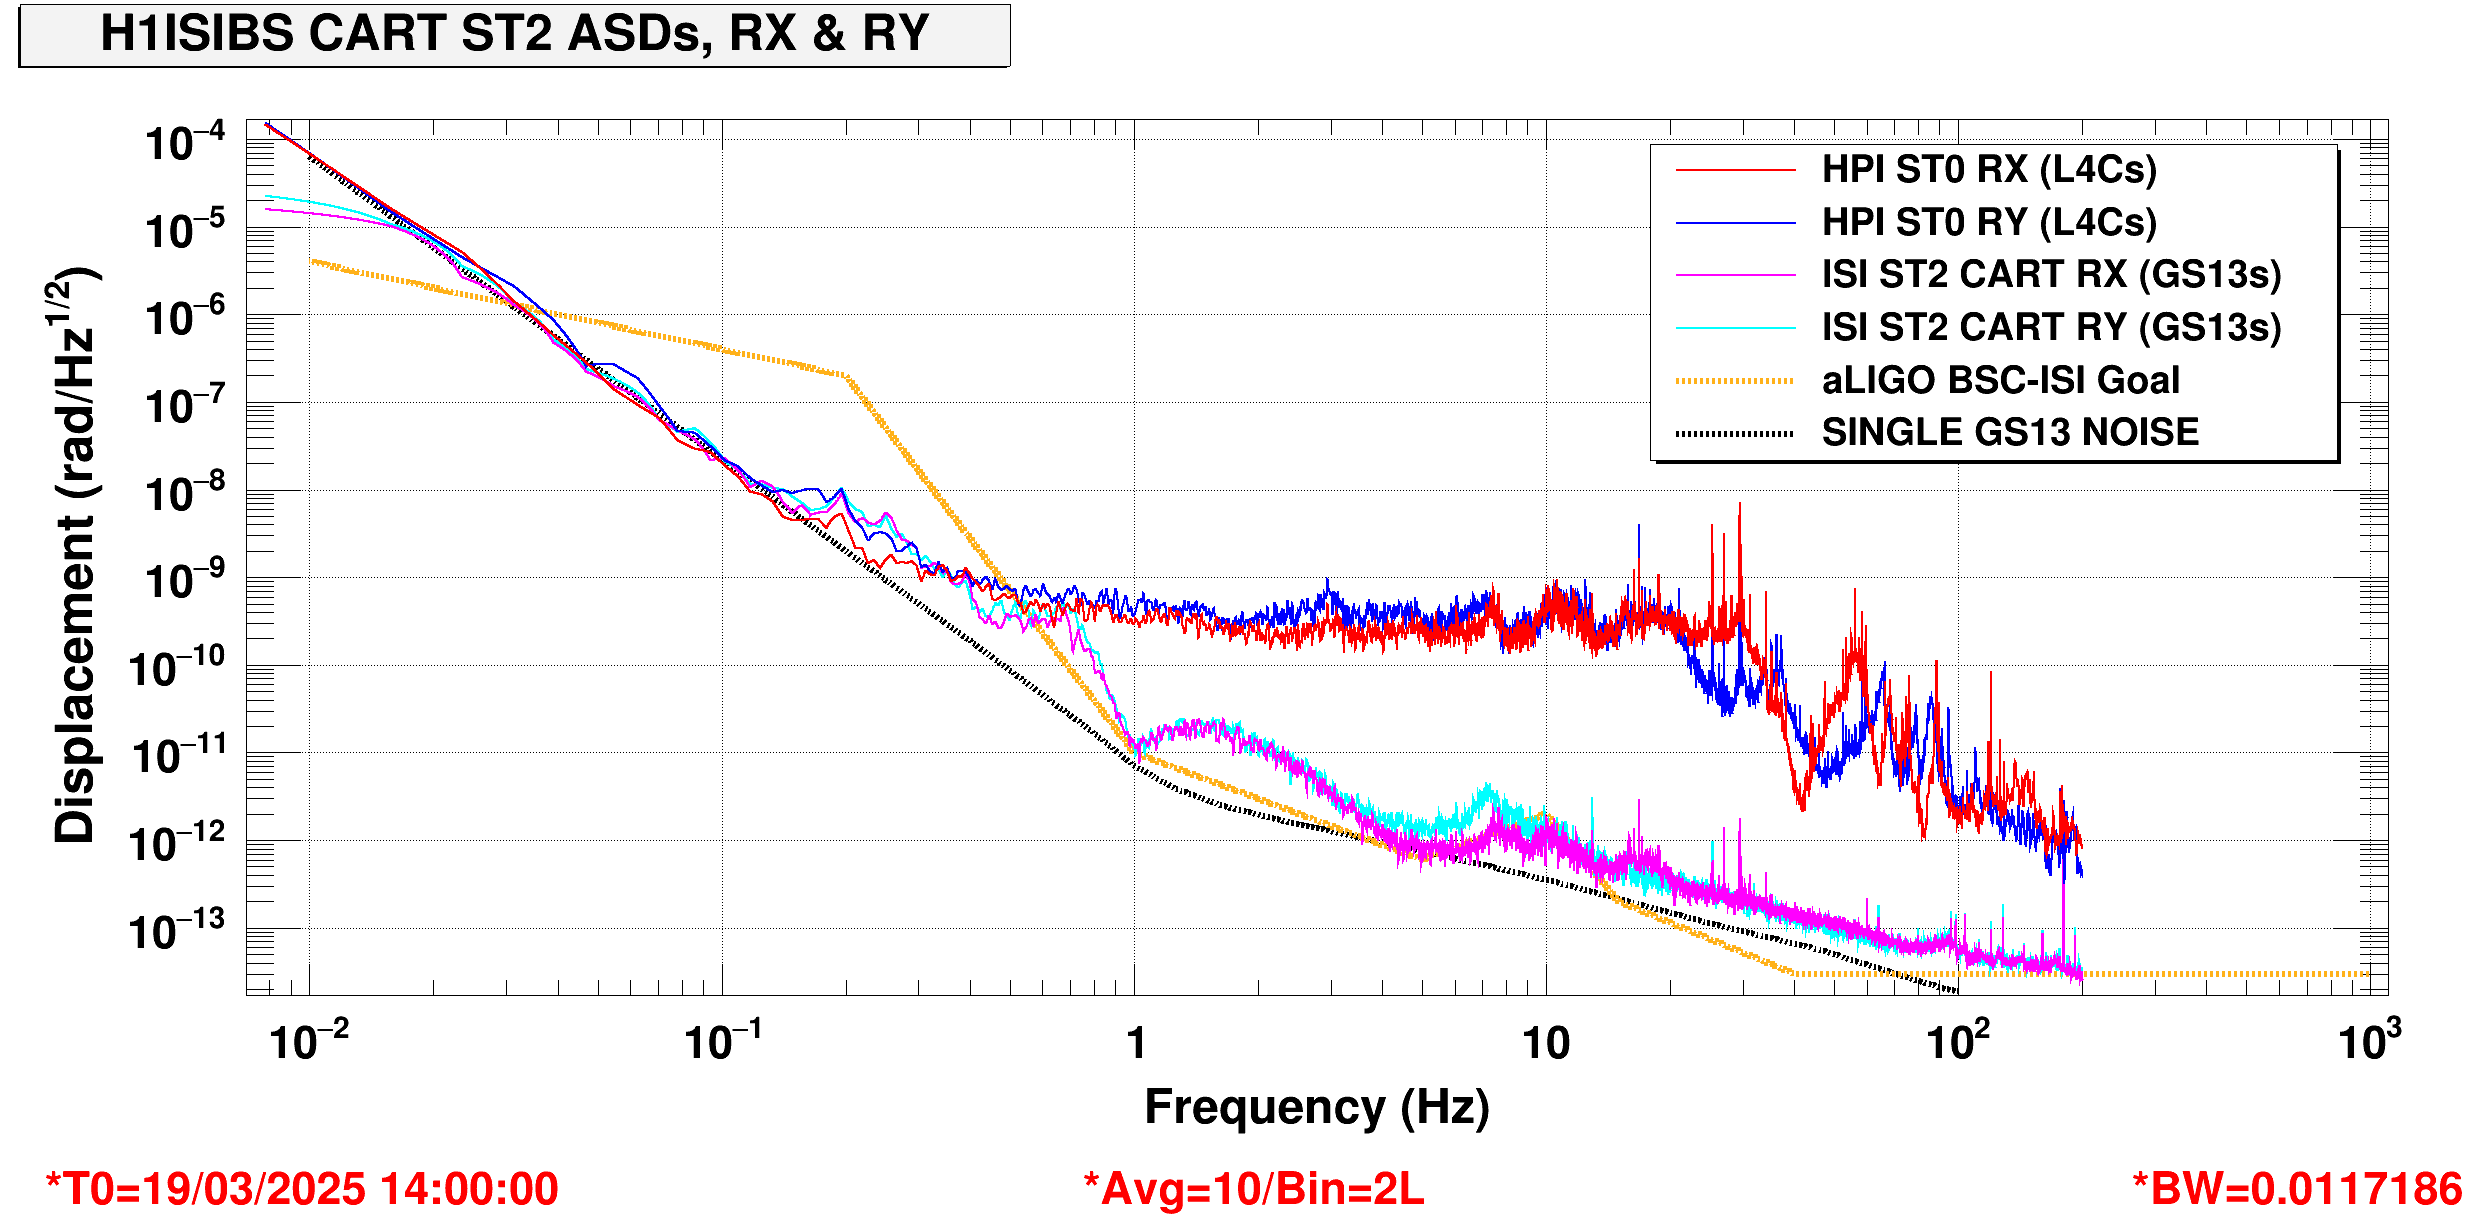
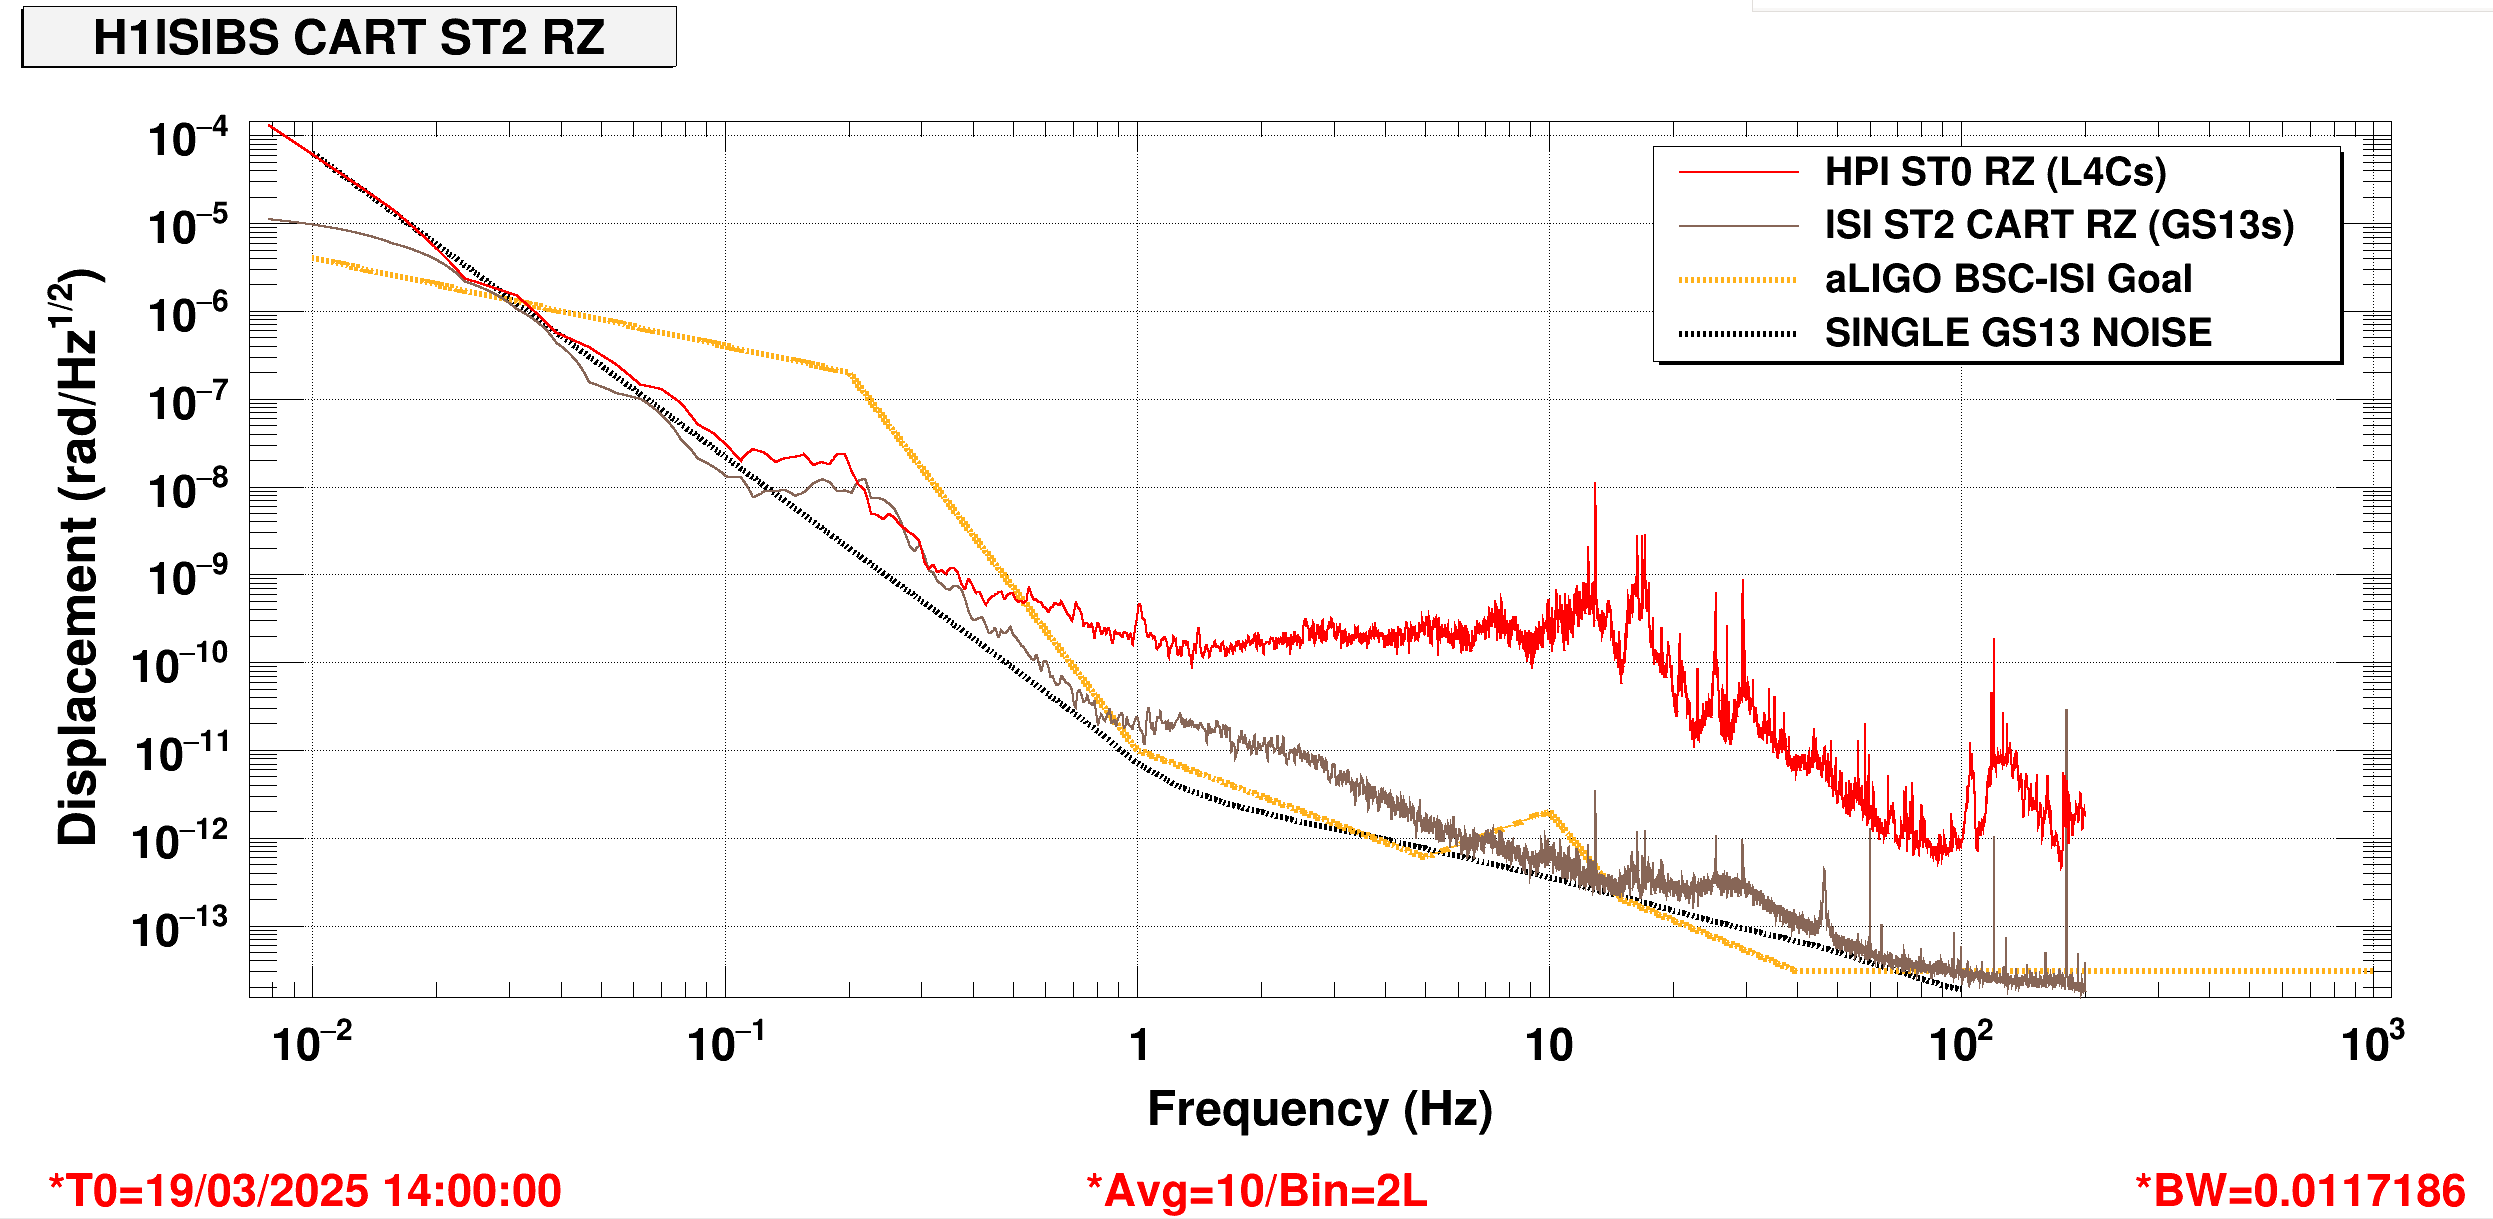
J. Kissel Oli and I are beginning the process for designing damping loops for the A+ O5 BBSS. We're running through the same process that I've been running through for over a decade designing suspension damping loops, in which I build up a noise budget for the optic displacement in all DOFs using input noises for seismic noise, DAC noise, and OSEM sensor noise filtered through said damping loops, all propagated thru the matlab dynamical model of the suspension. The first step along that journey is revisiting all the input noise sources, and making sure we have good model for those. OSEM noise and DAC noise models have recently been validated and updated when I revisited the HLTS damping loop design (see LHO:65687). However, I haven't worked on damping loops for suspensions suspended from a BSC-ISI since 2013, see G1300537 for the QUAD, G1300561 for the BSFM, and G1300621 for the TMTS. In those, I used the 2015 update to the 2005 requirement curve from T1500122 as the input motion. Now, after a decade worth of commissioning and improvements, I figure it's time to show that work here and use it in modeling future SUS damping loops where the SUS is mounted from a BSC-ISI. One of the biggest things we've learned over the decades is that the seismic noise input to the suspension at its "Suspension Point" motion for a given suspension can be the (quadrature) sum of many of the ISI's cartesian degrees of freedom, and depends on where and in what orientation it is on the optical table (see T1100617). As such, we installed front-end infrastructure to calculate the calibrate the lowest stage sensors -- the GS13 inertial sensors -- into both the Cartesian and Euler basis (see E1600028). In this aLOG, I do as I did for the HAM-ISI LHO:65639, I show the Cartesian contributions to each of the Beam Splitter's SUS point motion, by multiplying the Cartesian channels by the coefficients in the CART2EUL matrix for the beam splitter. The time I used for this performance of the H1 ISI BS was 0.01 Hz binwidth (128 sec FFT), 10 average, 50% overlap data set starting at 2025-03-19 14:00 UTC. - This was a late night local set, with no wind and 0.1 [um_BLRMS] level microseism (between 0.1-0.3 Hz) - GND to ST1 Sensor correction is ON, including the DIFF and COMM inputs. - Here at H1, the corner station does NOT have beam rotation sensors to improve the GND T240 sensor correction signal. But, both end stations have a BRS. - The wind was low at this measurement time, but it's worth saying that each end-stations wind fences are in dis-repair at the moment, too be fixed soon. - ST1 Z drive to ST1 RZ T240 decoupling is ON with a "pele_rz" filter - Off diagonal ST1 dispalign matrices are in play, X to RX & RY = -1e-4 & 1e-4, Y to RX = -7e-4, Z to RX & RY = 3.5e-3 & 2.5e-3 - ST1 Blend Filters: - X & Y = nol4cQuite_250 - Z = 45mHz_cps - RX & RY = Quite_250_cps - RZ = nol4cQuite_250. - As far as I can tell, there's NO ST1 to ST2 sensor correction on the ST2 CPS, nor is there and ST1 to ST2 FF to the ST2 actuators. - ST2 Blend Filters: - X & Y = 250mhz - Z = 250mhz - RX & RY = tilt_800b - RZ = 250mhz These will be used to make updates to /ligo/svncommon/SusSVN/sus/trunk/Common/MatlabTools/ seisBSC.m or seisBSC2.m which are toy models of the BSC-ISI performance, used so you don't have to carry around some giant .mat file of performance and you can per-interpolate on to an arbitrary frequency vector, much like I did for seisHAM.m in CSWG:11236. I've committed the .xmls and .pngs in the following SeiSVN directory: /ligo/svncommon/SeiSVN/seismic/BSC-ISI/H1/BS/Data/Spectra/Isolated/ASD_20250319/
Dear Oli,
It may be useful to remember that when Jeff says that the "input to the suspension at its "Suspension Point" motion for a given suspension can be the (quadrature) sum of many of the ISI's cartesian degrees of freedom" - what he means is that, if you want to make a Statistical model (which you do), and if the DOFs are independant (which maybe they are, and maybe they are not), then using the quadruture sum of the ASDs is a reasonable thing to do. In fact, the SUSpoint in reality, and the calculation of the SUSpoint, are done with a linear combination, NOT a quadrature sum. This means that if you grab some data from the cart basis sensors, take the ASDs (where you lose the phase), and add them in quadrature you will NOT get the ASD of the measured suspoint. I think this difference is not going to impact any of your calculations, but maybe it will help you avoid aggravation if you try to do some double checking.
-Brian
The Cartesian performance ASDs of the ISI BS to be used in the statistical model (in the way that Brian cautions in LHO:83473 above) have been exported to /ligo/svncommon/SeiSVN/seismic/BSC-ISI/H1/BS/Data/Spectra/Isolated/ASD_20250319/ 2025-03-19_1400UTC_H1SUSBS_CART_XYZRXRYRZ_ASD.txt (in the DOF order mentioned in the filename.) In the same directory, I also export the ASD of live, projected, coherent linear sum computed by the front-end 2025-03-19_1400UTC_H1SUSBS_EUL_LTVRPY_ASD.txt (in the DOF order mentioned in the filename.) If someone wants to race me, they can use this data and the CART2EUL matrix from the screenshot in LHO:83470, or if you want it programmatically, use /opt/rtcds/userapps/release/isc/common/projections/ ISI2SUS_projection_file.mat and running the following in the matlab command line, >> load /opt/rtcds/userapps/release/isc/common/projections/ISI2SUS_projection_file.mat >> ISI2SUSprojections.h1.bs.CART2EUL ans = -0.7071 0.7071 -0.2738 0 0.1572 0.1572 -0.7071 -0.7071 -0.0173 0 -0.1572 0.1572 0 0 0 1 -0.2058 0.1814 0 0 0 0 -0.7071 0.7071 0 0 0 0 -0.7071 -0.7071 0 0 1 0 0 0 ... but if I win the race, this plot will be a good by-product of the updates to seisBSC.m, which I'll likely post to the CSWG aLOG, like I did for seisHAM.m in CSWG:11236.
Jim reminds me of the following: - This BSC-ISI, ISIB2 has been performing poorly since ~2020. For some yet-to-be-identified reason, after years of physical, electronic, and data analysis investigations by Jim -- see IIET:15234 -- his best guess is some sort of mechanical "rubbing," i.e. mechanical interference / shorting of the seismic isolation, typically by cables. - He points is finger at the H2 corner (use T1000388 to reminder yourself of where that is on BSC2). - You can use the "Network" summary pages (https://ldas-jobs.ligo.caltech.edu/~detchar/summary/) and navigate to "Today" > "SEI" tab > "Summary [X]" or "Summary [Y]" or "Summary [Z]" pages, and look at the bottom row of plots to see how the ISIBS compares against other ISIs at LHO (left plot) and LLO (right plot). Here's a direct link to the plots including 2025-03-19 at 14:00 UTC, with the with the "SEI Quiet" time restriction mode ON. - Also, remember that the MICH lock-acquisition drive from the M2 OSEMs on the SUSBS causes back-reaction on the cage, which messes with the ISI controls, the ISIBS's isolation state guardian is regularly in the FULLY_ISOLATED_SO_ST2_BOOST state, which leaves the FM8 "Boost_3" off until after the ISC_LOCK guardian requests SEI_BS to FULLY_ISOLATED. Because I took data during nominal low noise, the ISI was fully isolated. However, the summary pages above -- even in SEI Quiet mode -- don't filter for whether the ISI is in FULLY_ISOLATED, so you'll that the ISIBS is consistently performing worse. *This* is not a fair comparison or show of how the ISIBS performs worse that the other BSC-ISIs, so take the plots with a big grain of salt. Also, another point of configuration notes: - This ISI, like all ISIs at LHO have their CPS synchronized to the timing system.
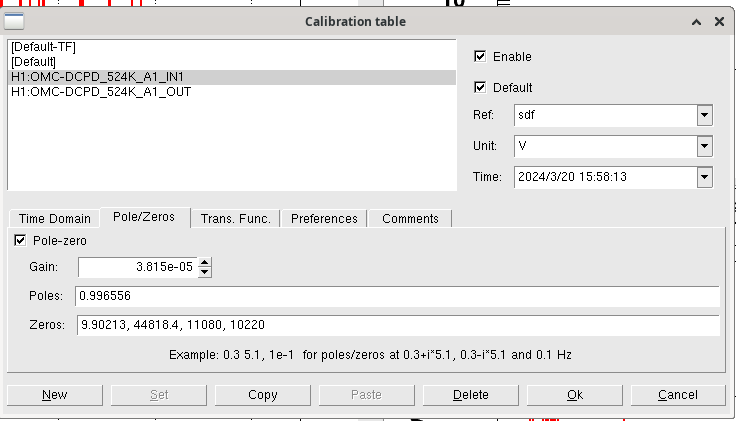
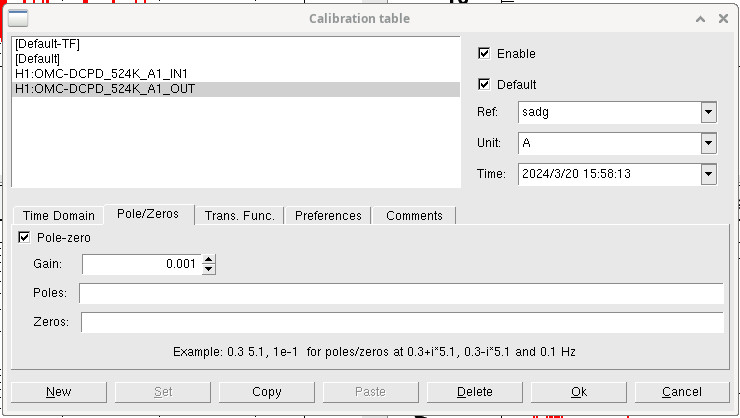
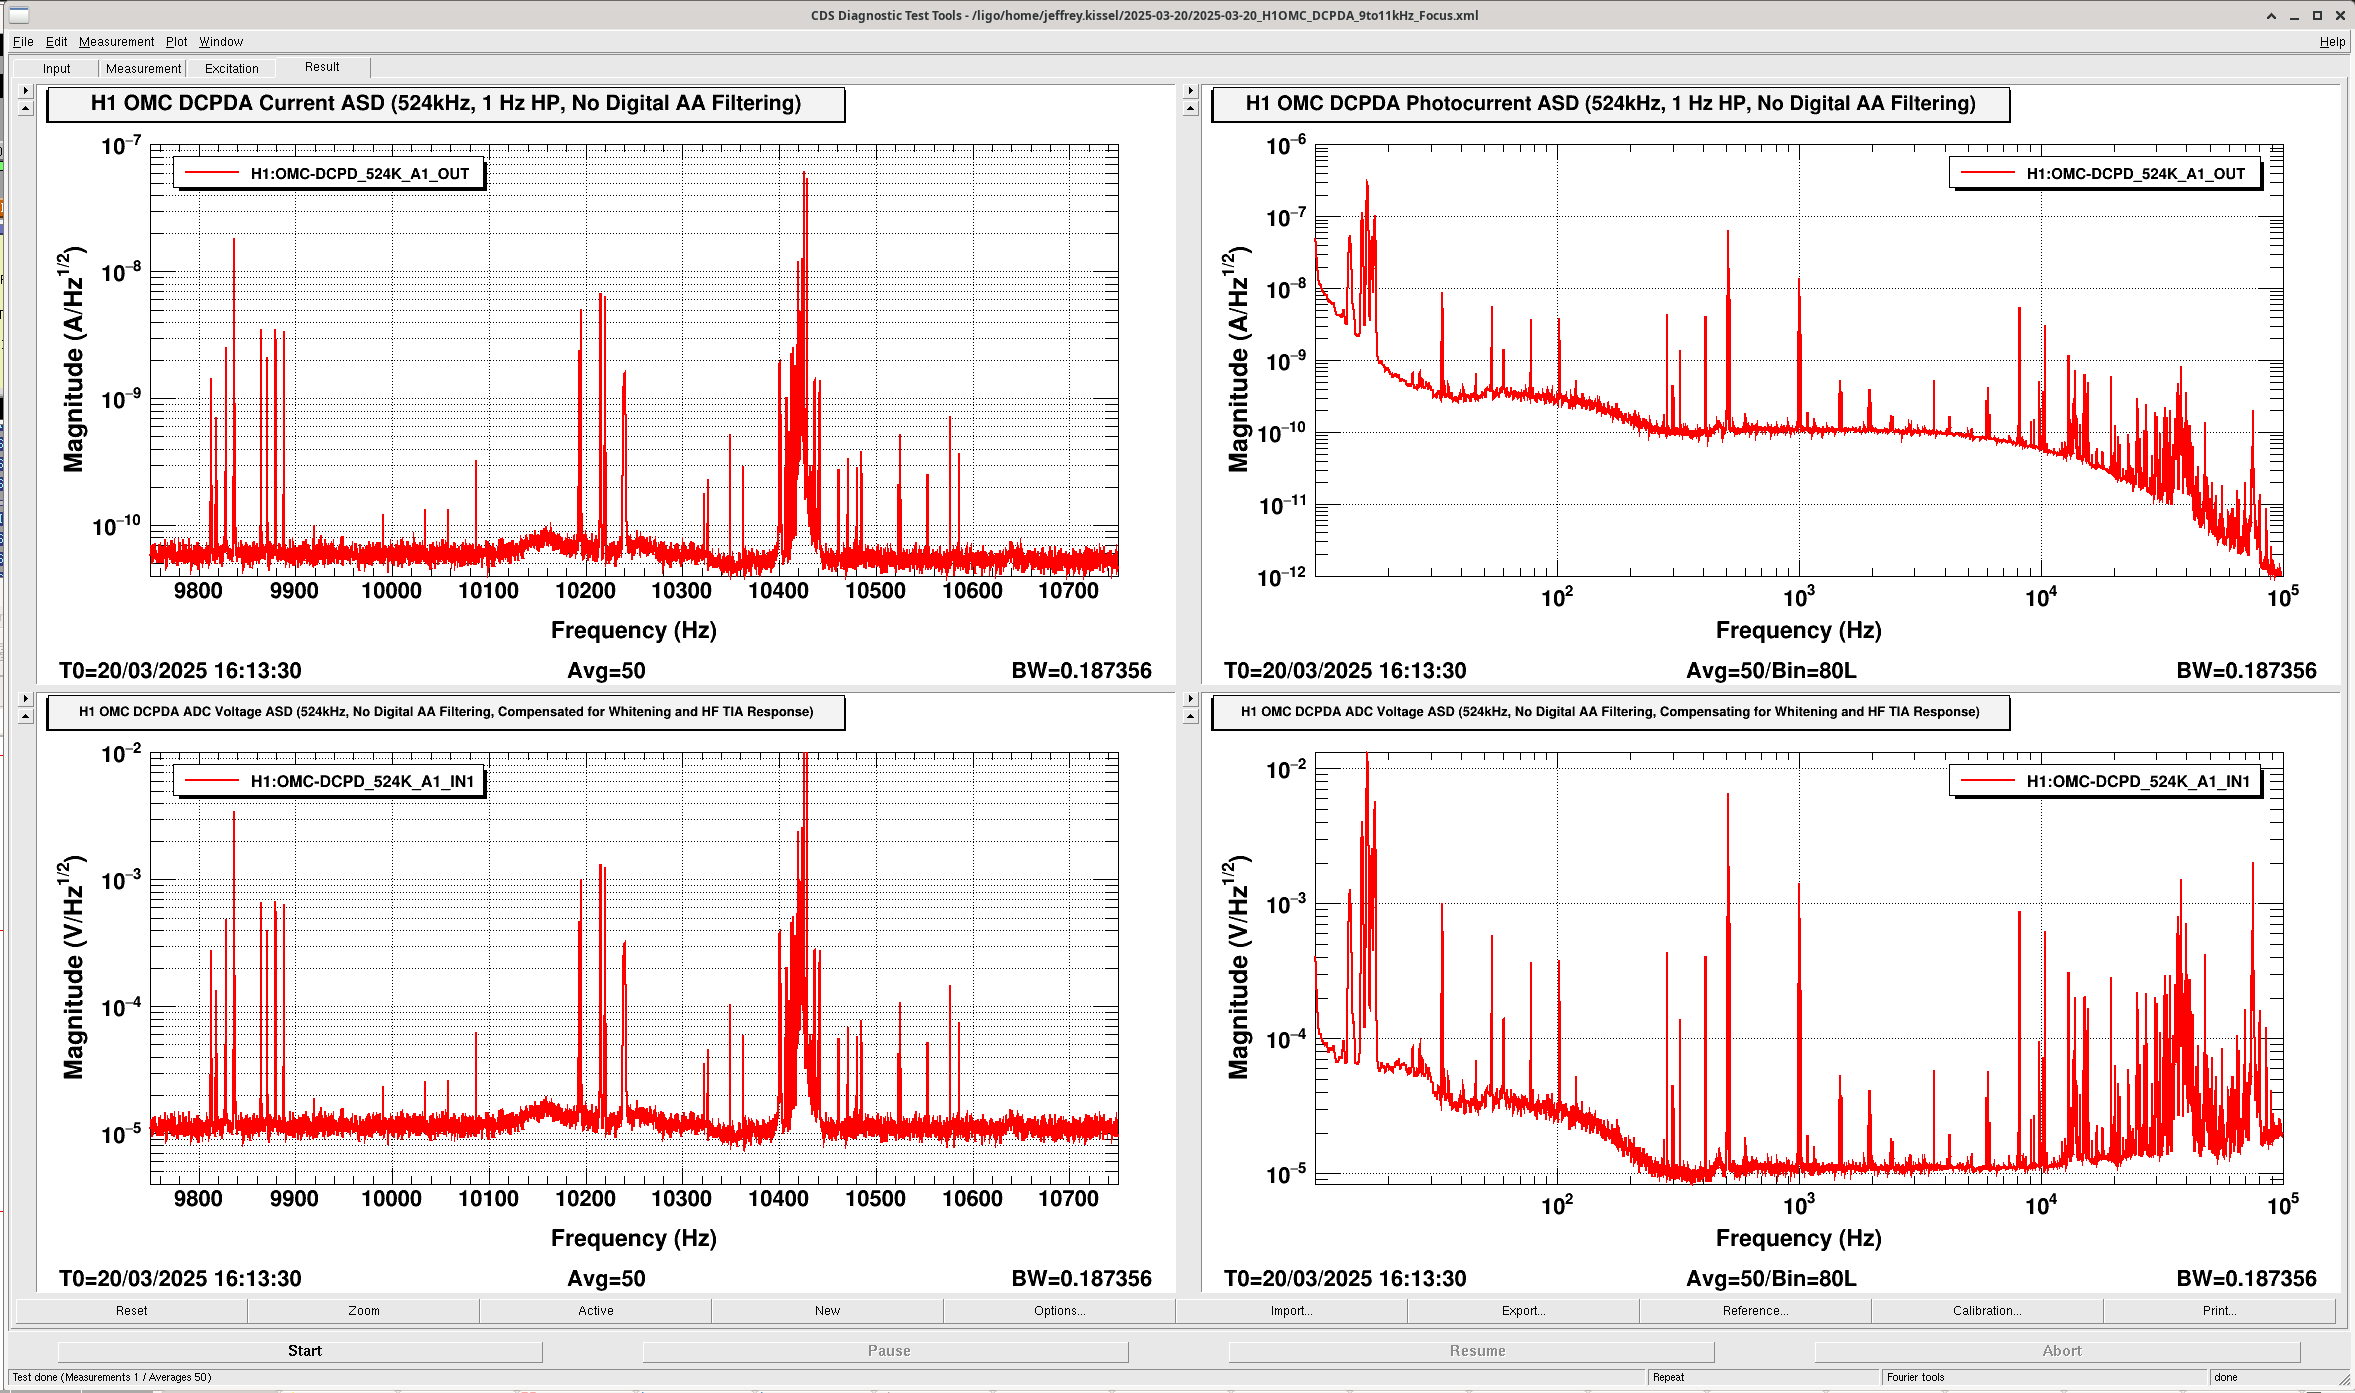
J. Kissel I've been tasked with using the analog voltage input to the OMC DCPD transimpedance amplifiers (LHO:83466) to drive a sine wave around 10 kHz, in order to try to replicate a recent PI ring up which apparently caused broad-band low frequency noise LHO:83335. There is a remote excitation channel that typically drives the this analog input excitation path is running at 16 kHz: the H1:OMC-TEST_DCPD_EXC channel's filter module lives in the h1lsc.mdl model in a top_names OMC block at the top level of the model, and the output of that filter bank is connected to the lsc0 IO chassis' DAC_0's 11th / 12th digital/analog channel. That DAC's AI channel goes through quite an adventure before arriving at the OMC whitening chassis input -- following D19000511, - AI chassis for lsc0 IO chassis DAC_0 lives in ISC-C1 U7, port OUT8-11 D9M spigot (page 2, component C15), connected to cable ISC_406 - The long ISC_406 DB9 cable connects to a LEMO Patch Panel (D1201450) on the other end in ISC-R5 U12 (page 22, component C210). - Funky LEMO to D9M cable D2200106 ISC_444 connects from the patch panel to the whitening chassis, - ISC_444 D9F end of the cable to lands at the J4 D9M port labeled "From AI/DAC / Test Inputs" of OMC DCPD whitening chassis in U24 of ISC-R5 rack. ... but this won't work: this channel is driven at 16 kHz sampling frequency. So, we can't drive anything technically above 8192 Hz, but realistically above ~5-6 kHz. I digress. I'm going with SR785 excitation via DB9 breakout. Anyways -- I attach here an ASD of the OMC DCPDs sampled at 524 kHz during nominal low noise this morning (taking advantage of the live-only 524 kHz channels), low-passed at 1 Hz, without any digital AA filters; the channel H1:OMC-DCPD_524K_A1 filter banks channels from LHO:82686. The OMC DCPD z:p=1:10 Hz whitening is ON during nominal low noise. The top panels show a zoomed in, and zoomed out version of the DCPDA ASD calibrated into photocurrent on the PDs (H1:OMC-DCPD_524K_A1_OUT channel, * 0.001 [A/mA], all the rest of the calibration is built in to the front-end filter bank; see OUT DTT Calibration). The bottom panels show a zoomed in, and zoomed out version of the DCPD ASD calibrated into ADC input voltage, with what whitening that was ON divided out, and the 2x ~11 kHz poles of the TIA divided out. (H1:OMC-DCPD-524K_A1_IN channel, * 1/4 [four-channel copy sum to avg conversion] * 0.0001526 [V/ct for 40 Vpp range over an 18 bit ADC] * z:p = (10):(1) inverse whitening filter * z:p = (11k,10k):([]) inverse HF TIA response ) In the zoomed in version of the plots, you can clearly see the mess of acoustic modes at 10.4 kHz. One can also see relatively noise free region at 10.3 kHz that looks clean enough for me to target with my analog excitation. I plot the de-whitened ADC voltage because the transfer function between the TEST DAC input and the TIA's output voltage is designed to the 1.0 in the GW band, from ~50 to 5 kHz, given that in that band, the transimpedance is 100e3 [V/A] and the series resistor that turns the voltage injection of the TEST input into current is 100e3 [V/A] (see ). So "nominally" un-whitened ADC counts should be a one-to-one map to DAC voltage input. At 10 kHz, however, the 2x ~11 kHz poles of the TIA, which drop the TEST input voltage by a factor of 5x at 10 kHz (see, e.g. plots from LHO:78372) So, that's why in the lower panels of the above mentioned plot of OMC DCPD A's ADC voltage calibrated in the way mentioned above. This should be a one-to-one map to the equivalent DAC voltage to drive. I looks like the non-rung-up 10.4 kHz PI modes today were of-order 1e-2 V = 10 mV, and the surrounding noise floor is around 1e-5 V = 10uV = 0.01 mV of equivalent DAC drive. The lower limit of the SR785 SRC amplitude is 0.1 mVp = 0.2 mVpp (single ended). Also, using the SR785 in a FFT measurement mode, where you can drive the source at a single frequency, there is no ramp. It's just ON and/or OFF. (I should also say that a SR DS340 function generator also doesn't have a ramp on its output. I considered using that too.) So -- hopefully, suddenly turning on a noisy 10.3 kHz line at 0.1 mVp into the IFO with a noise floor of 0.01 mV/rtHz at 10kHz won't cause problems, but ... I'm nervous.
TITLE: 03/20 Day Shift: 1430-2330 UTC (0730-1630 PST), all times posted in UTC
STATE of H1: Lock Acquisition
CURRENT ENVIRONMENT:
SEI_ENV state: CALM
Wind: 47mph Gusts, 31mph 3min avg
Primary useism: 0.09 μm/s
Secondary useism: 0.41 μm/s
QUICK SUMMARY:
H1 had reached Nominal_LOW_NOISE [600] at 16:09 UTC
Commissioning had started.
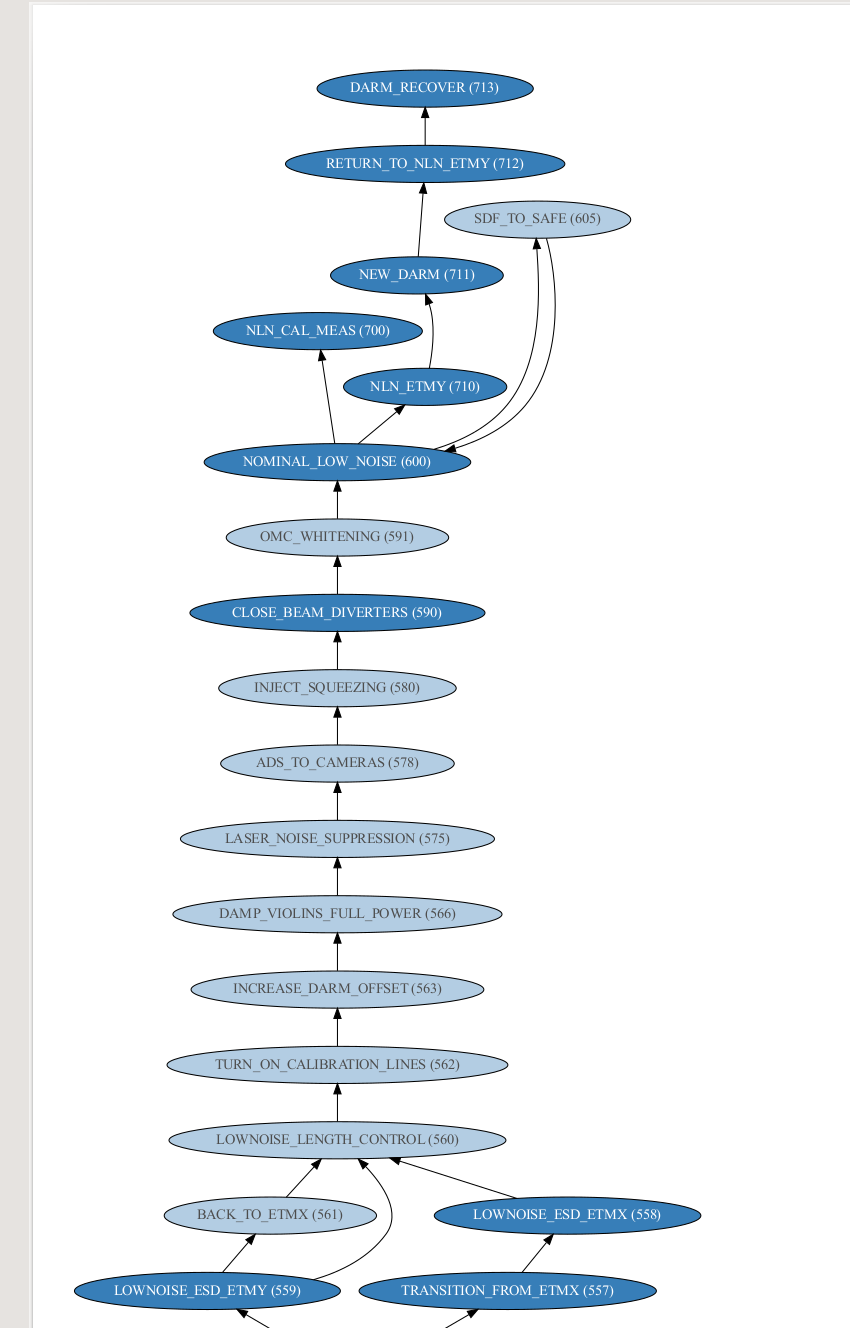
A button pusher accidentally pressed the NLN_ETMY[710] button on the ISC_LOCK screen.
There was enough time to pause and Look at the ISC_LOCK graph, to look for a way back to NOMINAL_LOW_NOISE[600].
The Graph has a path out of NLN_ETMY[710] to NEW_DARM[711], then to RETURN_TO_ETMY[712], then to DARM_RECOVER[713].
But since DARM_RECOVER[713] didn't have a path back o NLN[600] I thought we would still be stuck.
So I held us in NLN_ETMY for a few more moments while I checked the alog and found Ryan Short's alog76320 .
I then quickly pulled up an Ndscope to find that Ryan and company had lost lock and not returned back to NLN[600].
Other alogs that mention NLN_ETMY all mention locklosses. so that was our last well documented path out of NLN_ETMY.
There was some confidence building amongst the wealth of knowledge within the Control Room that we should manuel from NLN_ETMY[710] to BACK_TO_ETMX[561].
Since that was the intuition and consensus of the room full of knowledgable people we tried it.
This led us to be stuck in BACK_TO_ETMX and a LOG that said:
2025-03-20_16:25:29.616860Z ISC_LOCK [BACK_TO_ETMX.run] USERMSG 0: EX ESD bias is off.
2025-03-20_16:25:29.617144Z ISC_LOCK [BACK_TO_ETMX.run] USERMSG 1: EX ESD must be off. DARM not transitioned. HELP ME!!!!
And we then lost lock due to high winds.
In the Future, If you find your self in NLN_ETMY, maybe try DARM_RECOVER instead.
Relocking as been abismal.
Jennie W, Sheila
Summary: We altered the offsets on the H1:ASC_OMC_{A,B}_{PIT,YAW} QPDs which are used to align the beam into the OMC. This was aiming to give us a improvement in optical gain. After doing this we aimed to measure the anti-symmetric port light changing as we chnage the darm offset. We are trying to use both these measurements to narrow down where we have optical loss in that could be limiting our observed squeezing. Performed both measurments successfully but the different alignment of the OMC made the squeezing less good so Camilla (alog #83009) needed to do some tuning.
Last time (alog #82938) I did this I used the wrong values as our analysis used the output channels to the loops instead of the input channels which come before the offsets are put in. The new analysis of our measurement of the optical gain as seen by the 410Hz PCAL line, changing with QPD offset, shows that we want the loop inputs to change to:
H1:ASC_OMC_A_PIT_INMON to 0.3 -> so we should change H1:ASC_OMC_A_PIT_OFFSET to -0.3
H1:ASC_OMC_A_YAW_INMON to -0.15 -> so we should change H1:ASC_OMC_A_YAW_OFFSET to 0.15
H1:ASC_OMC_B_PIT_INMON to 0.1 -> so we should change H1:ASC_OMC_B_PIT_OFFSET to -0.1
H1:ASC_OMC_B_YAW_INMON to 0.025 - so we should change H1:ASC_OMC_B_YAW_OFFSET to -0.025
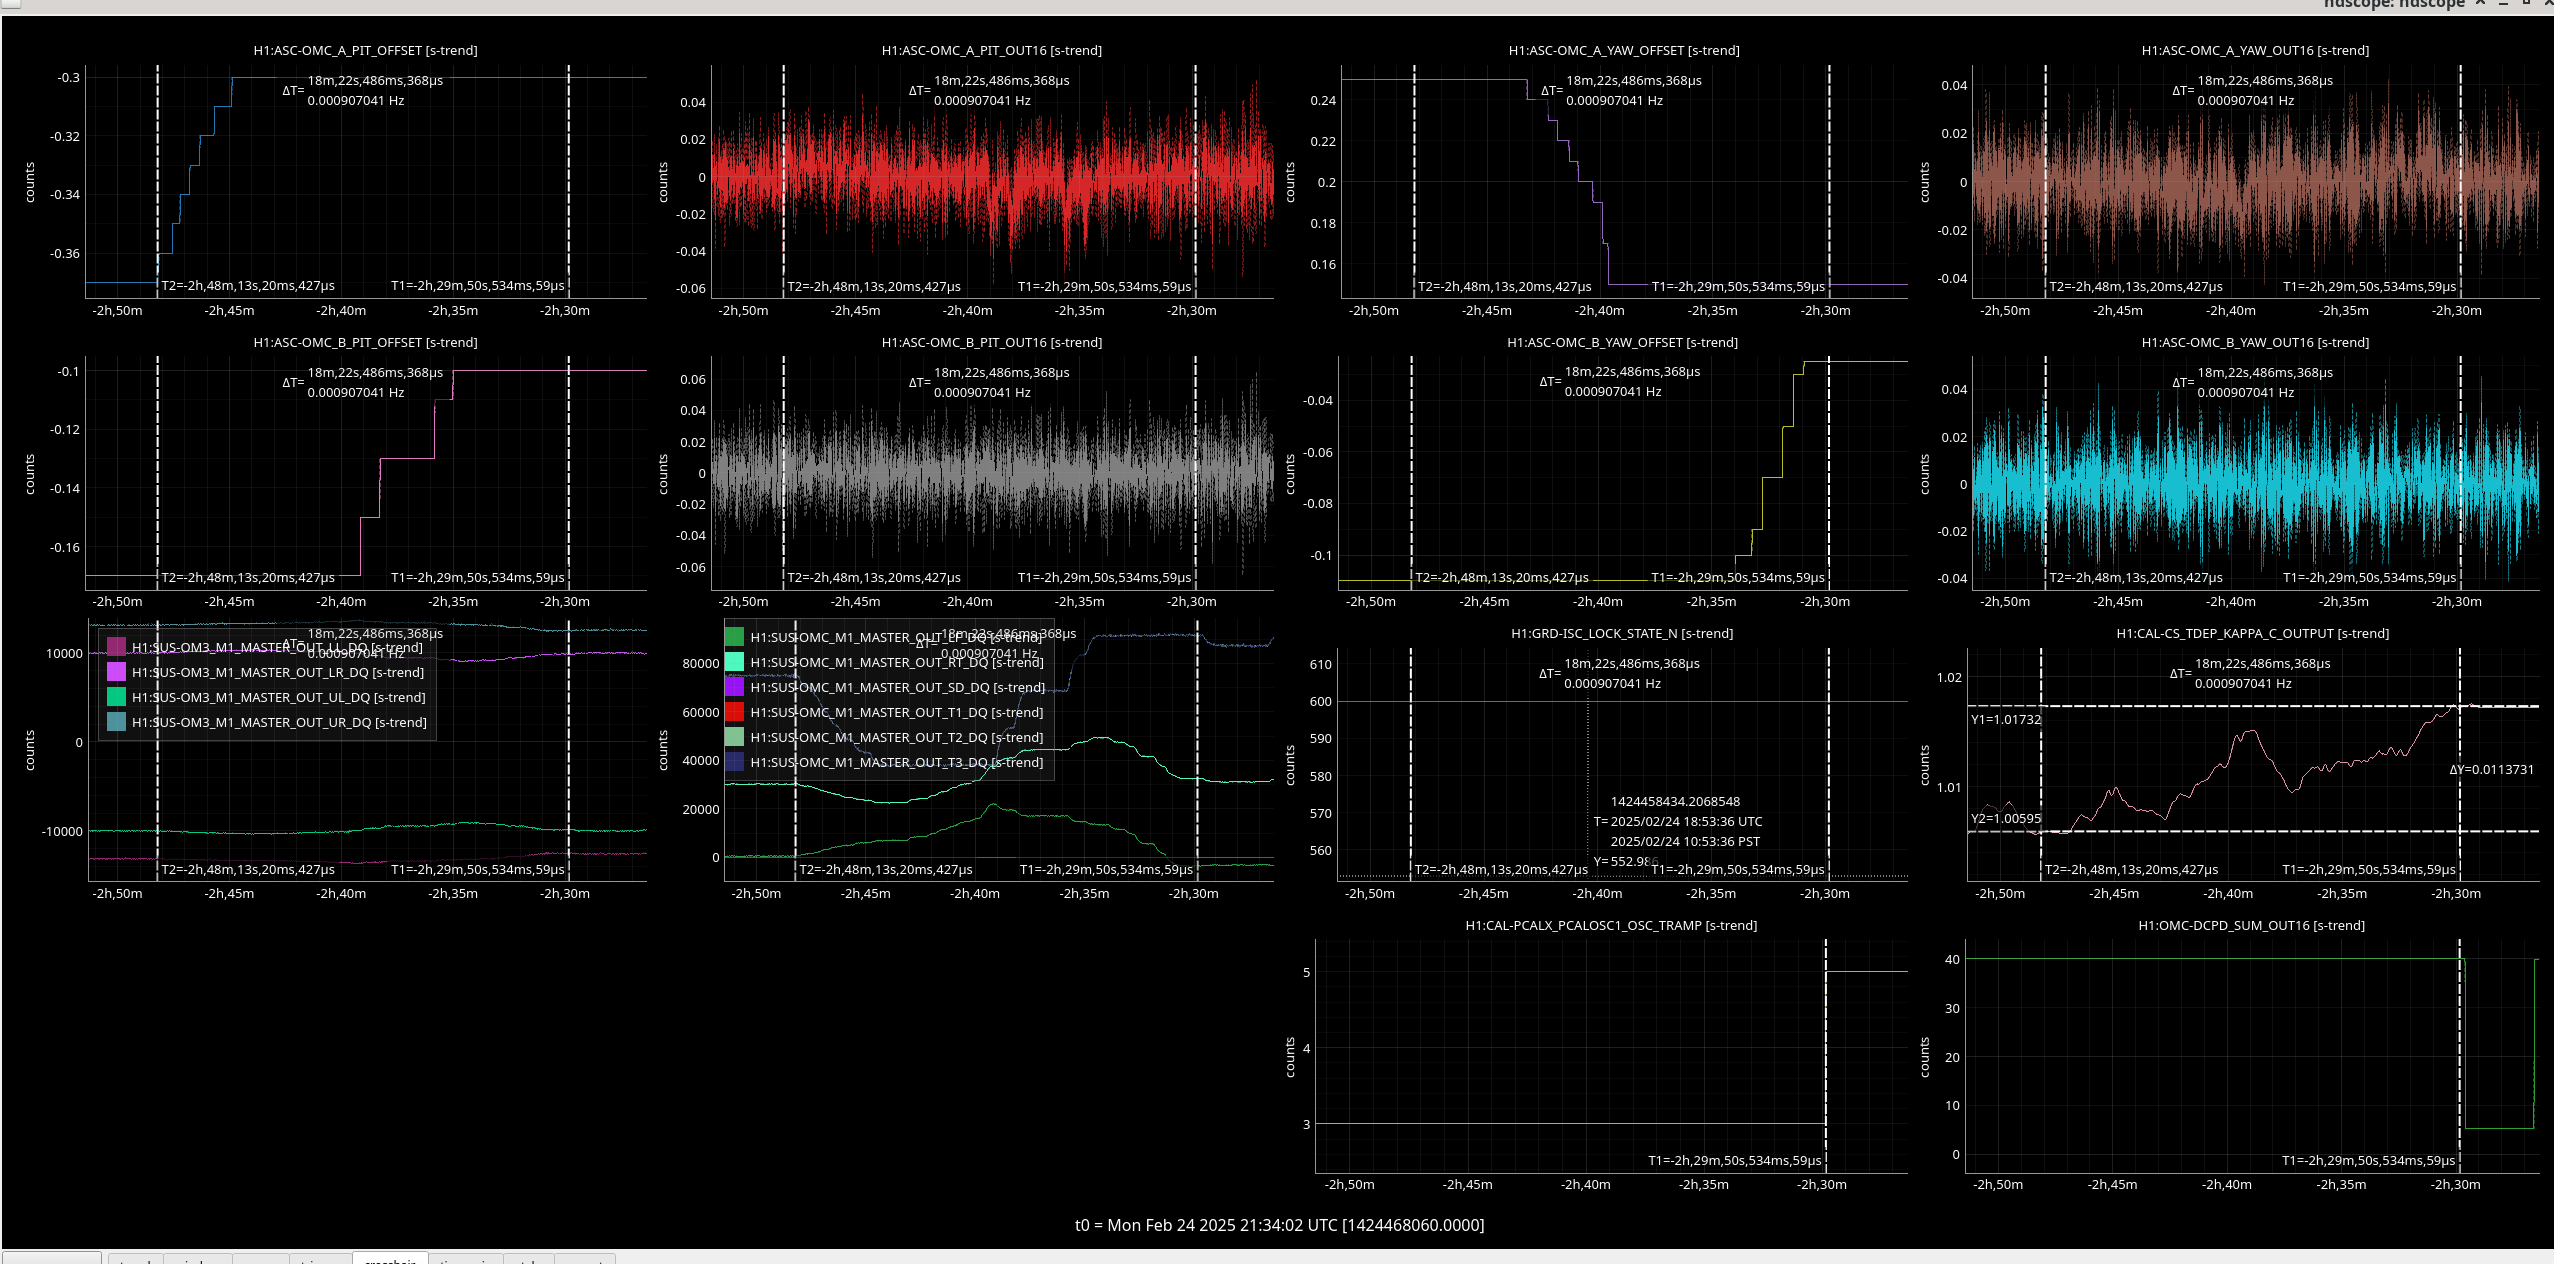
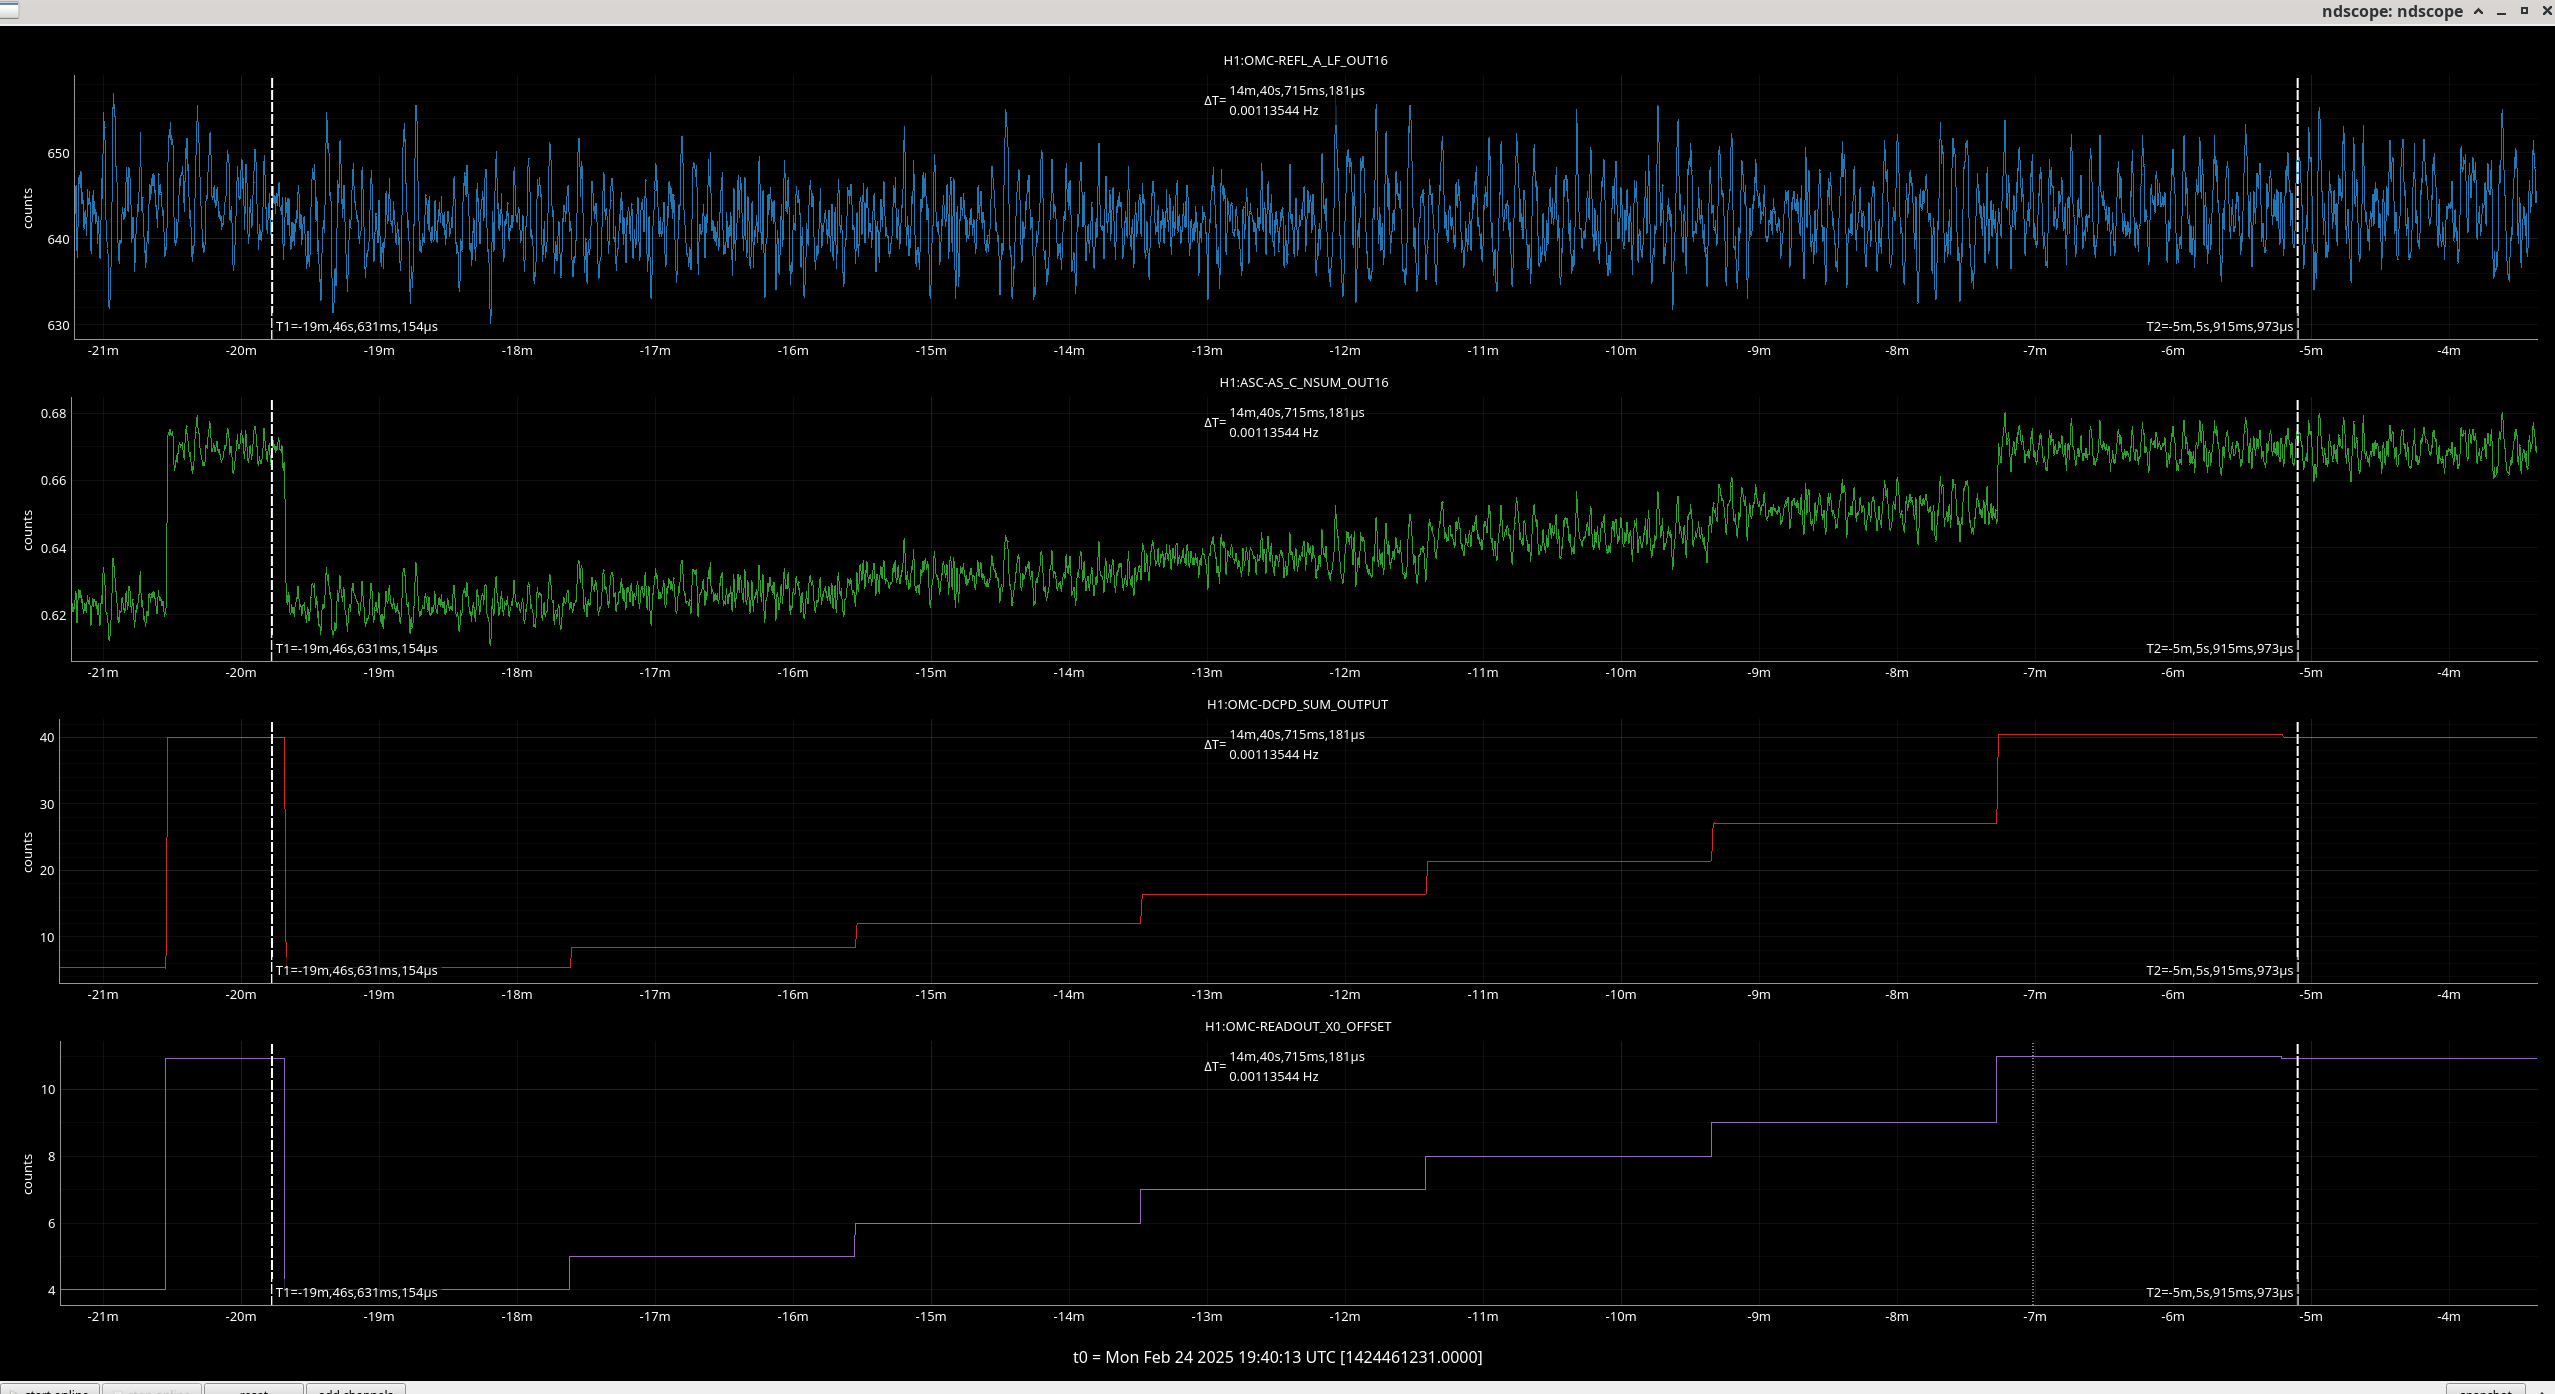
We stepped these up in steps of around 0.01 to 0.02 while monitoring the saturations on OMC and OM3 suspensions and the optical gain, both to make sure we were going in the correct direction and that we were not near to saturation of the suspensions as hapenened last time I tried to do this.
Attached is the code and the ndscope showing the steps on each offset, (top row left plot, top row center right plot, second row left plot, second row center right plot). The top stage osems for OM3 suspension are shown in the third row left plot, the top stage osems for OMC suspension are in the third row center left plot, and the optical gain is shown in the third row right plot.
The optical gain improved from by 0.0113731 from a starting value of 1.00595, so that is an improvement of 1.13 % in optical gain.
Around 19:04:28 UTC I started the DARM offset step to see if the change in optical gain matches that we would see if we measured the throughput of HAM 6. Unfortuntely I forgot to turn off the OMC ASC which we know affects this measurement of the loss. We stood down from changing the OMC and Camilla did some squeezer measurements, then I made the same mistake again the next time I tried to run it (d'oh). Both times I control-C'd the auto_darm_offset.py form the command line which means the starting PCAL line values, and DARM offset had to be reset manually before I ran the script successfully after turning the OMC ASC gain to 0 to turn it off.
The darm offset measurement started at 19:20:31 UTC. The code to run it is /ligo/gitcommon/darm_offset_step/auto_darm_offset_step.py
The results are saved in /ligo/gitcommon/darm_offset_step/data and /ligo/gitcommon/darm_offset_step/figures/plot_darm_optical_gain_vs_dcpd_sum.
From the final plot in the attached pdf, the transmission of the fundamental mode light between ASC_AS_C (anti-symmetric port) DCPD is (1/1.139)*100 = 87.8 %. We can compare this to the previous measurement from last week with the old QPD offsets to see if the optical loss change matches what we would expect from such a change in optical gain.
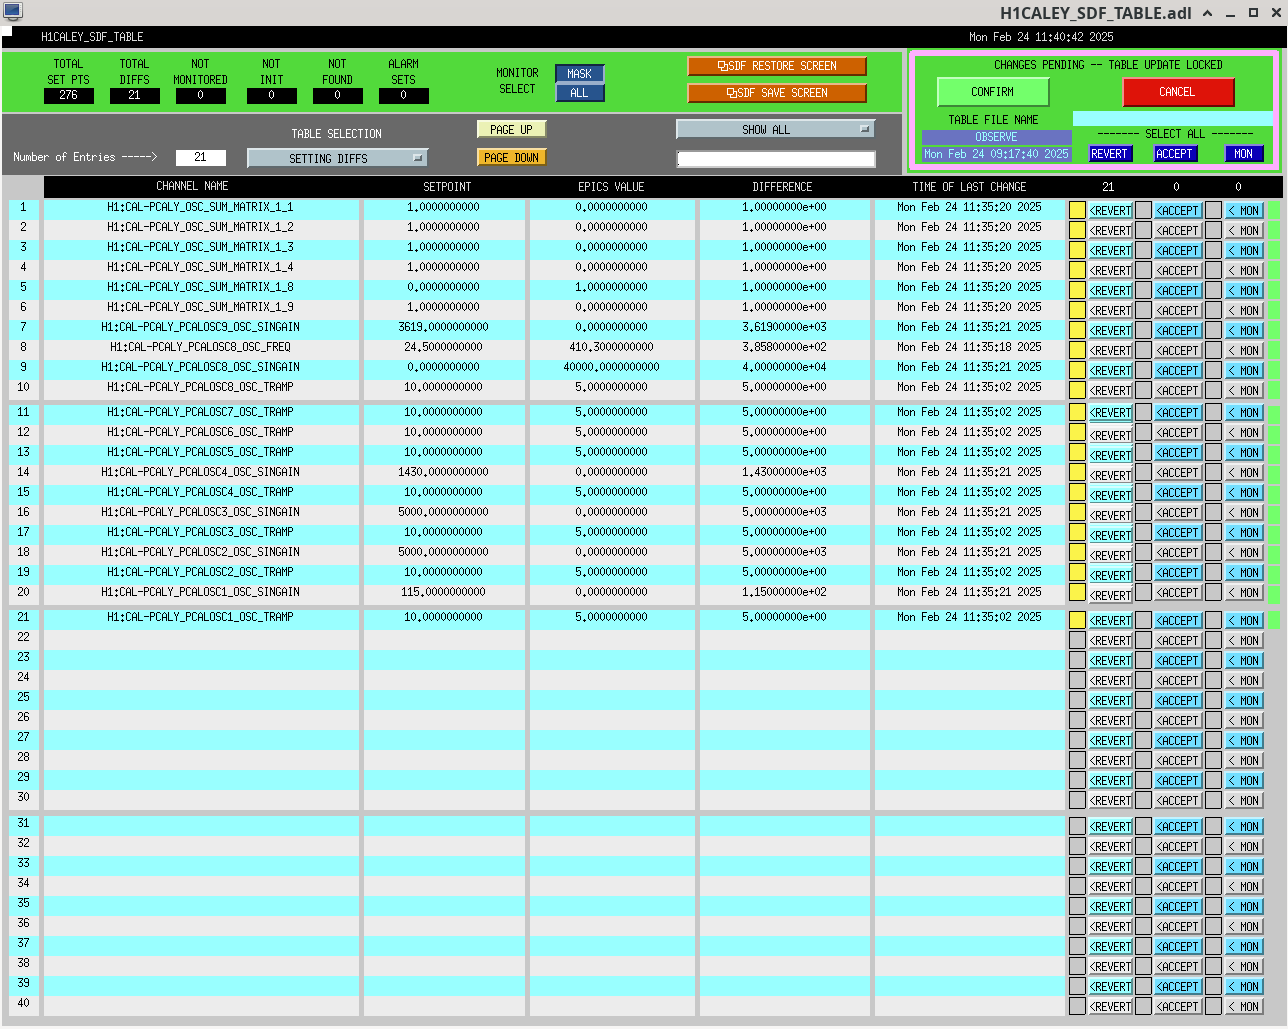
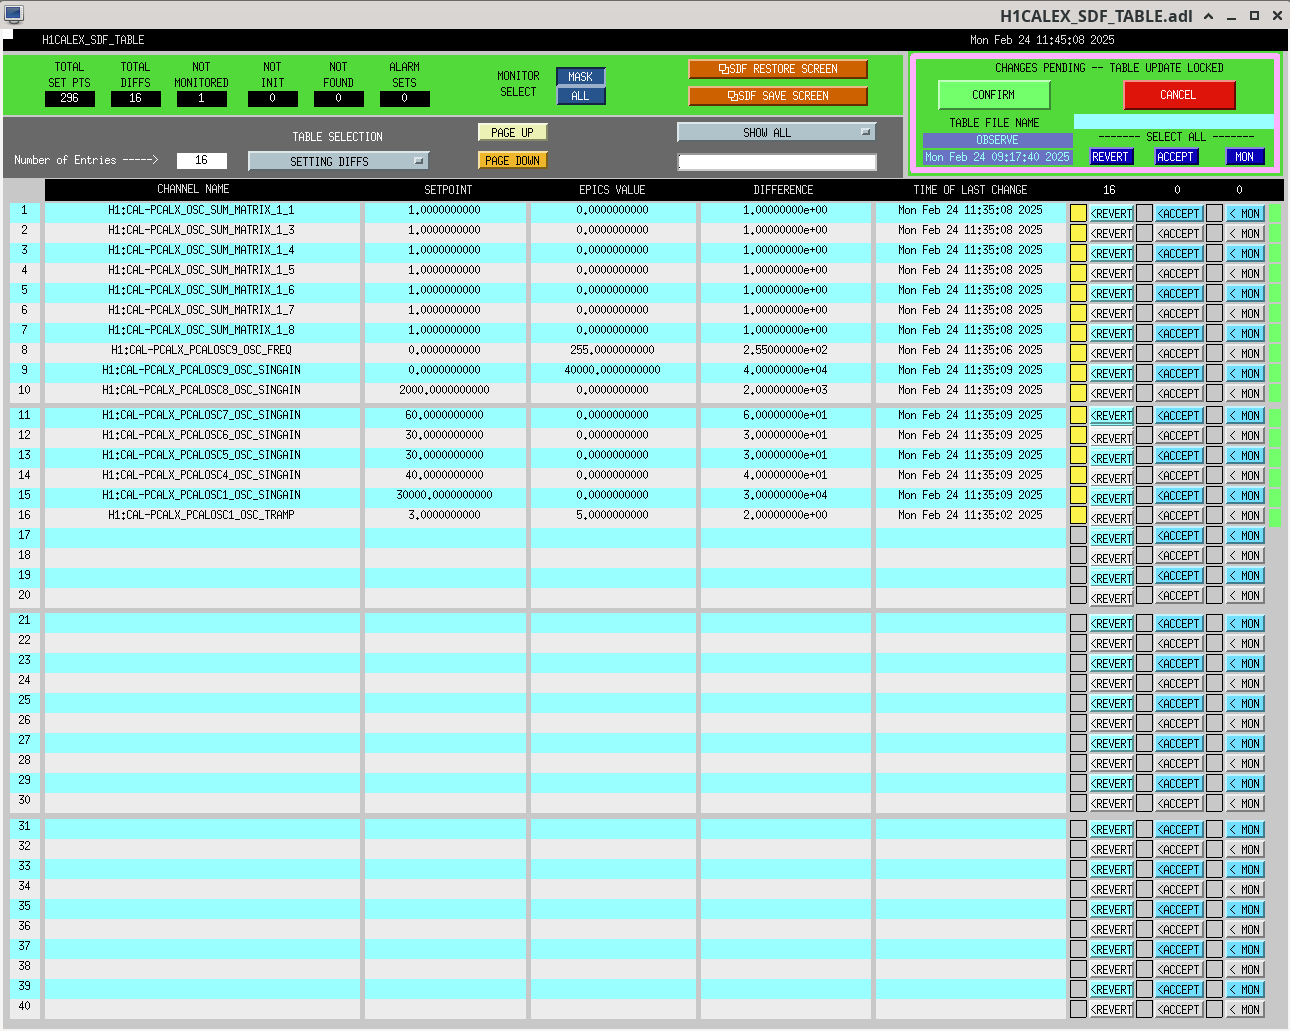
Since the script didn't save the correct values for pcal ey and ex (due to the script being run partially twice before a siccessful measurement). I reverted the PCAL values back using SDF before we went into observing. See attached screenshots.
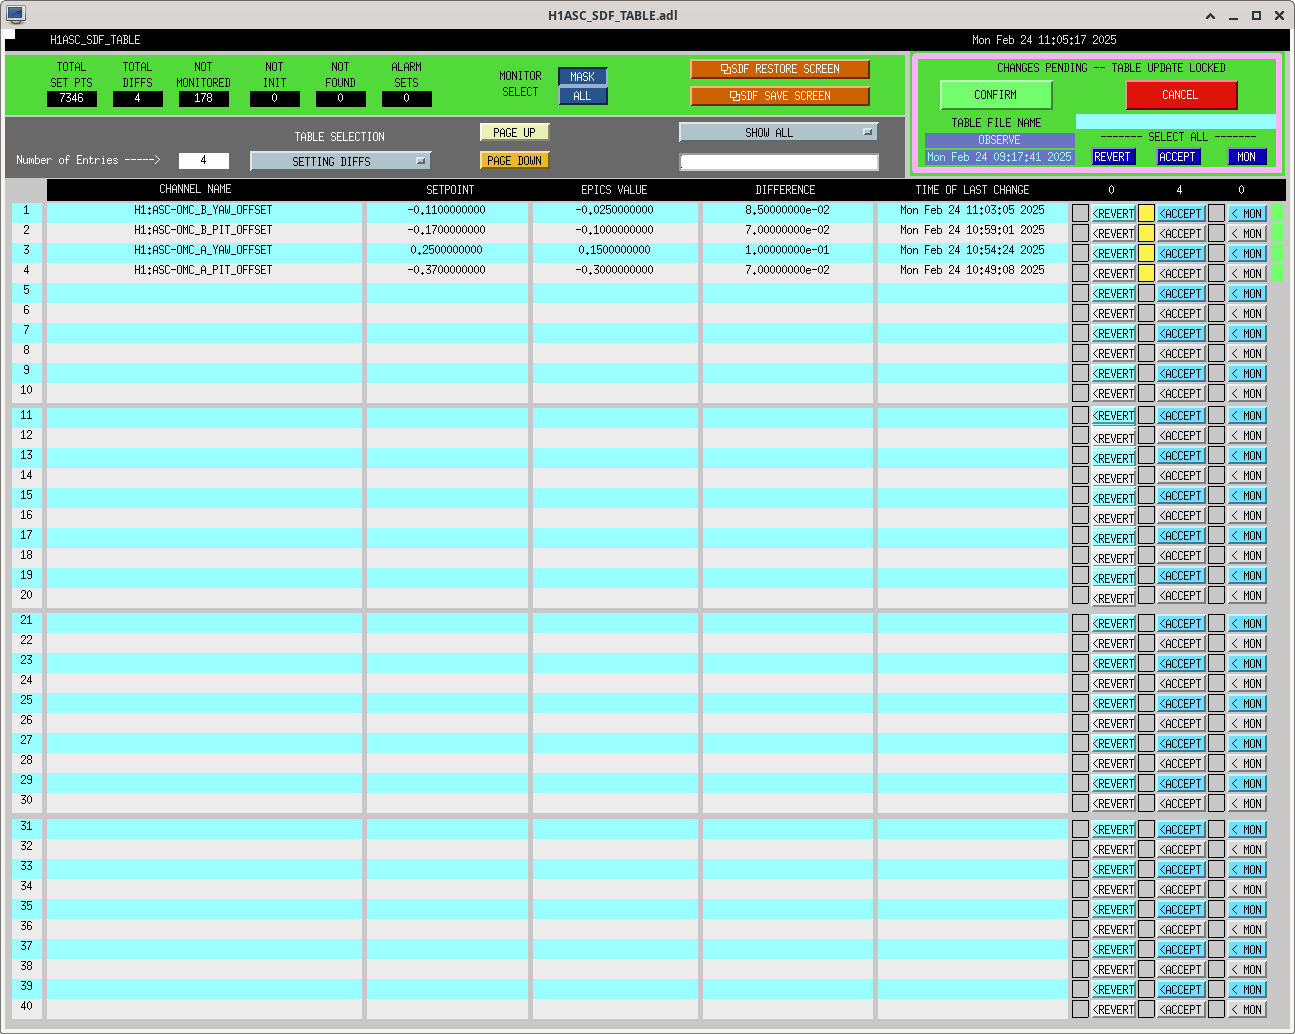
Sheila accepted the new ASC-OMC_A and B OFFSET values in OBSERVE and SAFE (only have the pic for OBSERVE).
Comparing OMC losses calculated by OMC throughput and optical gain measurements.
If we take the improvement in optical gain noted above and calculate the improvment in the optical gain ^2, ie.
(g_f^2 - g_i^2)/ g_i^2 = 0.023 = 2.3 %
And compare it to the gain in OMC throughput from this entry to the measurement after changing the OMC ASC offsets above
(T_OMC_f - T_OMC_i)/ T_OMC_i = 0.020 = 2%
Both methods show a similar improvement in the coupling to the OMC, or alternatively decrease in the HAM 6 losses. Since we improved the alignment of the OMC, it makes sense that the losses decrease and them agreeing validates our method of using darm offset steps to calculate OMC throughput and thus the loss in HAM 6.
The optical gain must be squared as it changes with the square root of the power at the output (due to the DARM loop).
For this comparison I was not able to use the measurement of optical gain from the same day as the initial measurement of OMC throughput, (alog #82938) as the calibration was exported to the front-end between these two dates which would have changed the reference value for kappa C.
The code I used for calcultions is attached.
As I did for the previous DARM offset measurement on the 20th Feb, in alog #83586, I checked that the DARM offset does not show a clear trend in the OMC REFL power. This would be another way of quantifying the mode-matching of the DARM mode to the OMC, but since the mode-matching is good, no trend can be seen in this channel (top plot) as we change the DARM offset.