This is a log from this past Friday:
The goals of the day were (1) to measure a calibrated CARM signal and (2) to try switching the frequency sensor to the PFD (Phase Frequency Discriminator). The former was achieved but the latter was not.
Calibration of the CARM signal
The VCO-based PLL, which is our frequency sensor for the CARM, was calibrated by an IFR RF generator so that one can evaluate the CARM fluctuation in a meaningful unit. The output signal from the PLL gets into an SR560 which does a signal amplification (pole at 100 Hz and gain of 10 ) and then is branched to the common mode board and an ADC through an RFPD interface box for monitoring the CARM signal. This channel is called H1:ALS-C_COMM_A_RF_I. Since this doesn't go through the common mode board the calibration is independent of the common mode board gain, which is good. Anyway according to a measurement where a known RF signal is injected to the RF input of the PLL a calibration factor of 176.2 Hz/ counts was obtained. This number was currently put in the gain of ALS-C_COMM_A_RF_I.
Calibrated CARM in-loop signal
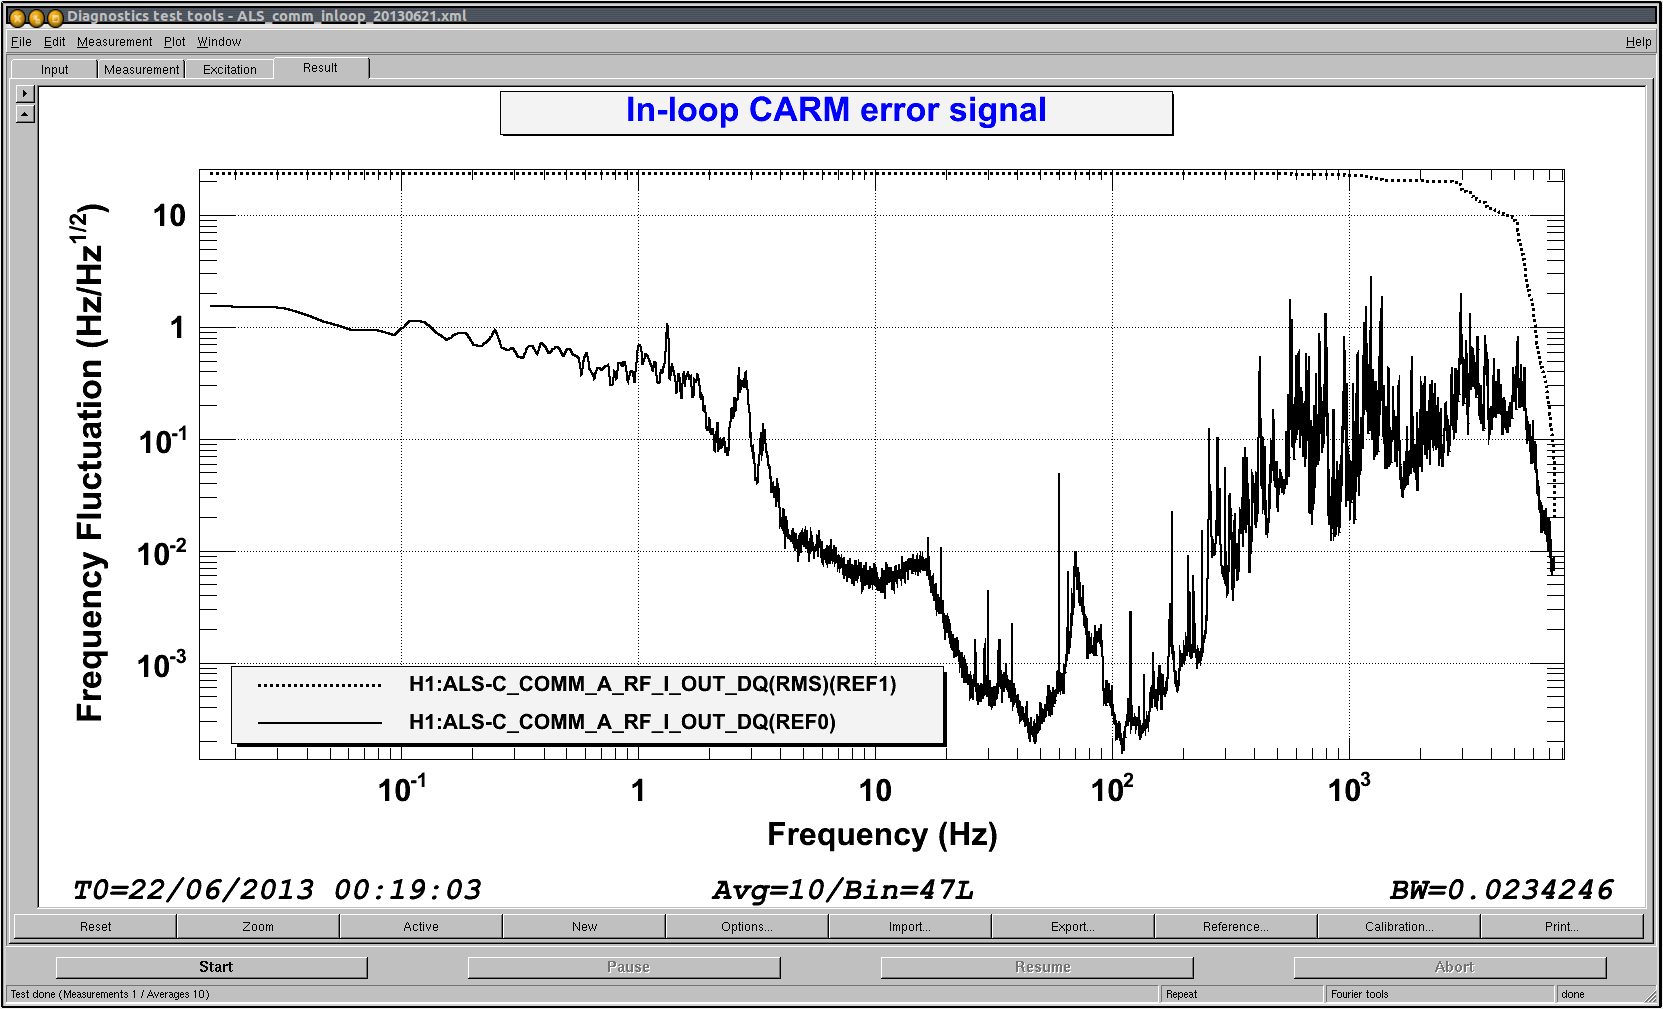
The plot below is a measured CARM in-loop spectrum.
The residual fluctuation was measured to be 23.66 Hz in RMS integrated from 10 mHz to 7 kHz (shown as dashed line). However we are aiming a residual RMS of 8 Hz in order to confine the PSL frequency well within the arm resonance whose linewidth is approximately 80 Hz. So we are still far from the requirement by a factor of 4-ish but this is not surprising since we established the CARM control very recently.
Some notes on this plot
-
The loop configuration is the same as the one we established in this past Tuesday (see alog 6801) except for the following two parts :
-
the gain of the end PDH loop was increased by a 4 dB (see alog 6835).
-
Matt added a Pomona box right after the second SR560 for low passing the CARM signal at 13 kHz.
-
RMS of 23.66 Hz is inconsistent with what we observed in the transmitted light of the infrared beam (see alog 6801)
-
The arm cavity currently should have a linewidth of 168.14 Hz if T_etm = T_itm = 0.014 is assumed. The fluctuation of 23.66 Hz is not big enough to explain the 20 % fluctuation of the transmitted light.
-
The observed fluctuation may be due to an angular fluctuation happening somewhere. We need a better sensor which is more insensitive to the angular degrees of freedom i.e. length RF diode or a single PD on ISCTEY table (?).
-
Also if the sensor noise is high, the actual fluctuation observed at the transmitted light may be higher than 23 Hz.
-
The RMS is dominated by high frequency components mainly above 1 kHz. Noise source is not identified yet.
-
The 2.5 Hz peak wasn't always prominent. Depending on the time you are looking at the peak sometimes disappeared.
-
The high frequency cut off at 5-6 kHz is probably due to a down sampling filter. Though I haven't confirmed if this was true. Note that the signals are recorded in 16 kHz.
-
Anyway it is possible that there might be some significant residual components above 6 kHz. An analog measurement is also necessary.
Alignment drift in the arm cavity
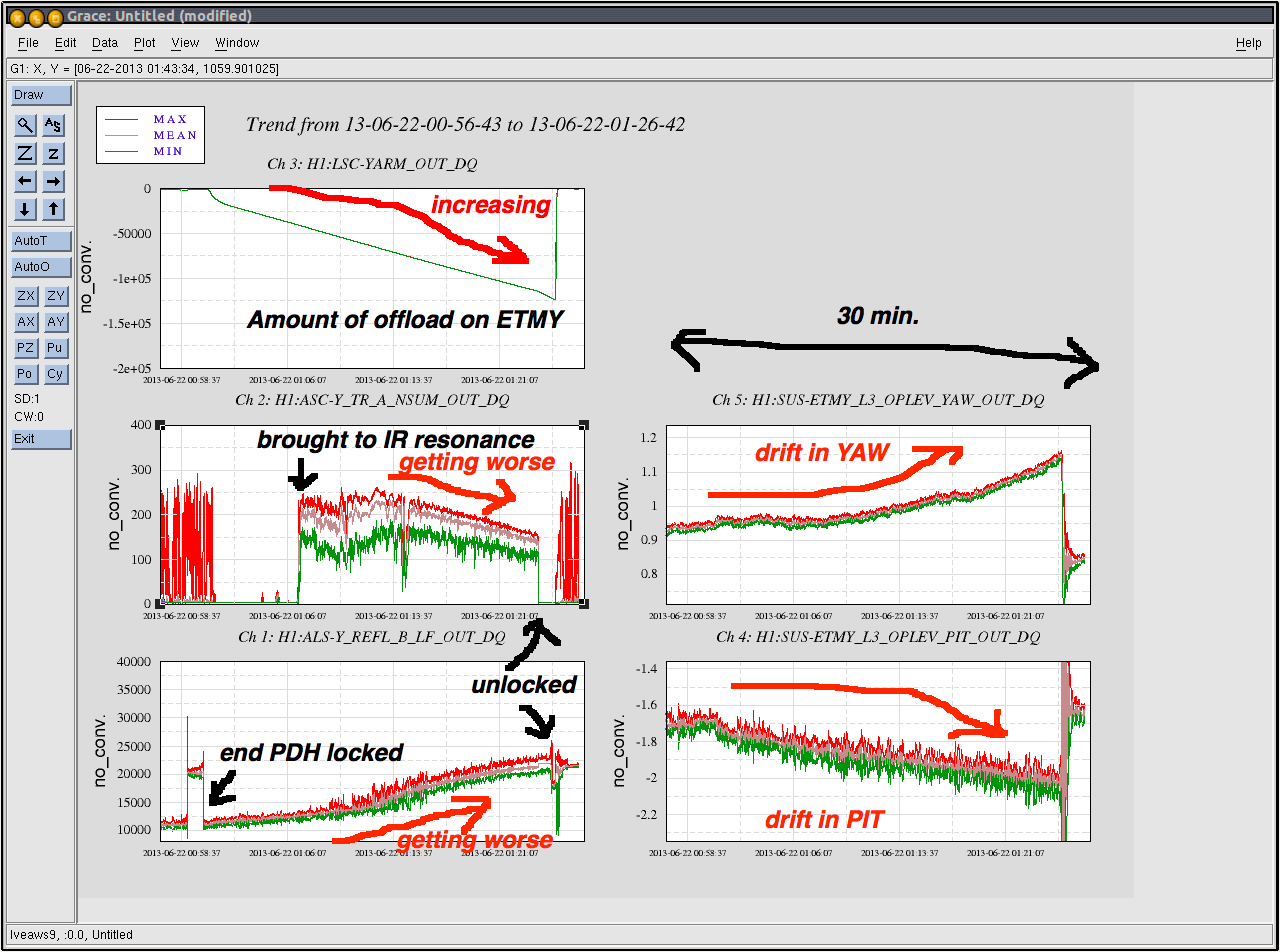
It seems there was an alignment drift which turned out to be big enough to prevent us from a long term measurement (say more than 30 min.). This looks due to a longitudinal to angle coupling in the ETMY top mass actuators. We have used an length offload scheme that relieves the end PDH signal from the low frequency saturation by branching the signal to the arm length via the ETMY top mass actuation. According to Matt the One-Arm-Test people used to offload this signal to HEPI rather than the ETMY or ISI, but recently we ended up with this ETMY scheme for some reason. Anyhow I think we have to go back to the old school -- offloading to the HEPI rather than the ETMY suspension for more rock solid lock.
The time series attached below is a trend during the CARM was locked. The CARM loop was closed right after the end PDH was engaged and then it was brought to the arm resonance several minutes later. I was tweaking PR2 and IM4 in the first 5-ish minutes after the IR became resonant. Then I stopped messing around afterward and simply let it locked. Obviously the oplev was seeing drift in both and YAW and PIT of ETMY by 0.3 urad or so over 20 minutes. Eventually the lock was lost (probably the end PDH first and then every loop lost their lock) due to the bad alignment. Once the length offload was shut off the alignment came back perfectly --- this strongly suggests a length to angle coupling in the ETMY top mass actuators at low frequency.
CARM control with PFD
Still unsuccessful --- I tried to close the CARM loop without using the PLL frequency sensor that we recently have been using but this basically destroys the IMC lock. One big reason is that there is a big gain discrepancy between the frequency sensor and phase sensor modes. This complicates the control scheme. Another reason is that it seems difficult to confine the PFD within its phase sensor mode by feeding the CARM signal to the MC2 suspension. The MCL control bandwidth can be 100 Hz or so, but probably this is not good enough to confine it within the phase range in the first place. Hmmm .... Also, I tried to confine the sensor close to the phase range by feeding a low frequency signal to the ALS_comm VCO through the Beckoff by using ezcaservo but this turned out that the slow control is too slow for this job, plus everytime the sensor enters the phase sensor range it gives a large signal and somehow kicks the VCO frequency away from it instantaneously.
The last thing we can try is a transition from the PLL frequency sensor to the PFD once everything is locked with the frequency sensor (though we need to establish some kind of fast switching since the CARM signal is mainly processed in the analog land).
Beatnote lost and found -- it was BS HEPI alignment
As reported (see alog 6835) the beatnote had been lost at the corner station. This turned out to be due to mainly an alignment of the BS HEPI and indeed the beam was hitting the mount of one of the 1 inch mirror on ISCT1 before the beam gets combined with the PSL green light. Vincent told me that the BS HEPI had been stack since the last Monday (correct me if wrong) and he suggested me to recover the position of the HEPI by introducing biases in the actuators. We tried this and it worked -- the beam came back to a good position on ISCT1 and we became able to see the beatnote again. It is still unclear why the BS HEPI alignment changed between Wednesday to Thursday even though it was stack. Although the alignment was mostly recovered, later on a fine tuning of the green beam alignment was done by tweaking PR3.