david.barker@LIGO.ORG - posted 10:24, Saturday 07 March 2026 (89419)
Sat CP1 Fill
Sat Mar 07 10:18:00 2026 INFO: Fill completed in 17min 57secs
Images attached to this report
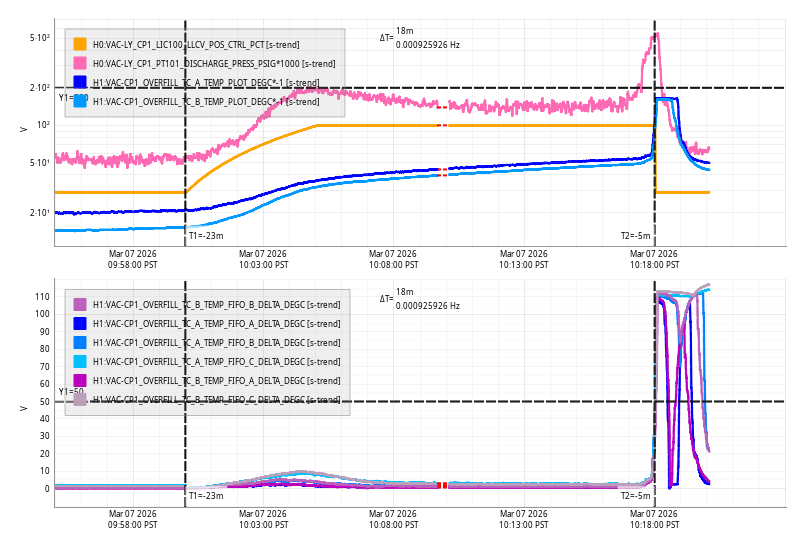
Sat Mar 07 10:18:00 2026 INFO: Fill completed in 17min 57secs
Erik, Dave:
I have built and installed Oli's first versions of the HAM6 SUS models: h1susom0, h1susobs, h1susam, h1susomcab, h1susom1ab, h1susom2ab and h1susom3ab.
Currently h1sush6 is running without Dolphin IPC and is not connected to the DAQ. Therefore to get this early running I edited the models and removed the remaining H1:LSC-TRIG_IFO_PCIE part from the om0, obs, am, om[123]ab models.
Only the iop model is in puppet, so I had to also do some hand editing of the rtsystab file to get the models to start.
I made a temporary edit to generate_cds_overview.py to add these models to the CDS Overview. To make space I simply stretched the window vertically. I'll reorder the lower section so the SUS column can take the full window height (also additional models will be added to h1sush5 and h1susb2h34).
Next week we will put all of this into puppet and add these models to the DAQ.
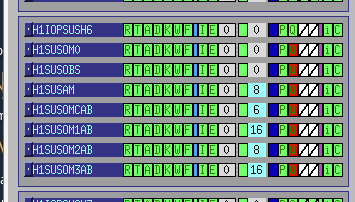
Note that the RED, WHITE DAQ blocks are due to the system not being known by the DAQ nor is it connected to the DAQ network.
S. Muusse, T. Roocke
All chassis were put on the rack for the Y table and cables attached. All electronics were tested and working however, we have realised additional power supplies are required and some additional cables are required.
Power supply/ cables still required:
A potential solution is to use pre designed 15V, 12V, 5V, regulator boards in another chassis which can be input to the table through the blank and power feedthroughs. Alternatively there are some preexisting supply boxes for 12 and 15 V
TITLE: 03/07 Day Shift: 1530-0030 UTC (0730-1630 PST), all times posted in UTC
STATE of H1: Planned Engineering
INCOMING OPERATOR: Ryan S
SHIFT SUMMARY: We ran into issues trying to lock the IMC after locking JAC and GREEN_ARMs, it seems to be from MC1 (T2 and T3 mostly).
LOG:
| Start Time | System | Name | Location | Lazer_Haz | Task | Time End |
|---|---|---|---|---|---|---|
| 15:37 | FAC | Contractor | MidY | N | Unloading bricks for CEBEX | 17:21 |
| 15:38 | FAC | Randy | EX | N | Bring ergo lift back to CS High bay, 15:57 | 17:34 |
| 16:12 | FAC | Kim, Nellie | LVEA | N | Tech clean, Nellie out 16:48 | 16:58 |
| 16:28 | SEI | Jeff | Optics lab | LOCAL | SPI work | 22:45 |
| 17:01 | PSL | Sheila | LVEA | N | Unlock rotation stage to turn up to 1W then relock, in @ 17:09 | 17:18 |
| 17:19 | ALS | Sheila | LVEA HAM1 | Y/LOCAL | SGH table alignment work | 17:51 |
| 17:34 | FAC | Randy | High bay | N | Clean lift | 17:48 |
| 17:44 | TCS | Sophie | Cheeta lab | N | Plug stuff in | 17:57 |
| 18:29 | FAC | Contractor | MidY | N | Unload bricks | 21:29 |
| 18:54 | VAC | Jordan | LVEA | N | Check HAM1 aux cart | 19:07 |
| 18:56 | TCS | Sophie | Cheeta / Prep lab | N | Cheeta work | 20:22 |
| 19:07 | EE | Marc | LVEA, HAM1 | N | Terminate cables | 22:20 |
| 20:16 | CDS | Dave | MER | N | DAQ chassis work | 21:31 |
| 21:25 | TCS | Sophie | Prep lab | N | Cheeta work | 22:04 |
| 21:48 | ISC | Masayuki | LVEA | N | Turn on whitening | 22:09 |
| 22:05 | TCS | Sophie, Thomas | Prep lab | N | Cheeta | 23:30 |
| 22:34 | EE | Marc | CER | N | See about swaping HAM2 MC1 M1 coil driver | 22:38 |
| 22:47 | EE | Marc | CER | N | Coil driver swap MC1, in at 22:55 | 23:25 |
| 22:56 | EPO | Erik + family | LVEA | N | Quick tour | 23:13 |
16:37 EX sensor correction off as the BRS was ringing up from Randys' loading of the ergo lift.
17:18 Sheila unlocked the rotation stage and I turned up the power to 1W, Sheila then relocked it.
17:35 UTC I used the ALS nodes to run an alignment for GRREN_ARMs, ALSX locked after a few taps of ETMX but ALSY took more convincing
19:30 UTC I started to run TFs for MC1, then MC3 aand RyanS did MC2
23:10 UTC SUSHB13 crashed, possible from Marc's work in a close by rack
23:17 UTC ITMX, ITMY WDs tripped, SW, ISI ST1, ISI ST2, and HEPI
23:31 I remeasured MC1 P and confirmed that the Coil Driver swap was unsuccessful, the TF still looked the same. I also ran an undamped OSEM spectra before and after the swap.


All the h1susb13 models stopped with timing errors this afternoon, followed later by h1psl0's iop model. CER activity was ongoing around this time.
We tried a model restart on h1psl0, which did not work. We rebooted the machine and all started OK.
We tried a reboot of h1susb13, but it got stuck. We then hard-reset the computer via IPMI and all came back OK.
Following the recovery of h1iopsusb13 I untripped the BSC1 and BSC3 SWWDs (the SEI had tripped).
Daniel had a new h1ascimc model to install (no DAQ restart). We stopped h1ascimc, which caused a DAC error on h1iopasc0. So as before, we had to restart all the h1asc0 models to load a new h1ascimc.
Per WP13076 we replaced the coil driver for MC1 due to suspicion it was causing MC1 to jump. The coil driver in question glitched on TOP3. Referencing D0902810-v12, the chassis in question is U41 on SUS-C4, we exchanged it with a spare.
Old SN - S1001097, New SN - S1100194
Shelia will retest the signal chain to see if this solves the issue.
It did not, at least with comparing a before/after transfer function. See alog89409.
FAMIS 38889, last checked in alog89213
There are 12 T240 proof masses out of range ( > 0.3 [V] )!
ETMX T240 2 DOF X/U = -1.784 [V]
ETMX T240 2 DOF Y/V = -1.829 [V]
ETMX T240 2 DOF Z/W = -1.089 [V]
ITMX T240 1 DOF X/U = -2.403 [V]
ITMX T240 1 DOF Z/W = 0.447 [V]
ITMX T240 3 DOF X/U = -2.587 [V]
ITMY T240 3 DOF X/U = -1.122 [V]
ITMY T240 3 DOF Z/W = -3.098 [V]
BS T240 3 DOF Z/W = -0.34 [V]
HAM8 1 DOF X/U = -0.301 [V]
HAM8 1 DOF Y/V = -0.439 [V]
HAM8 1 DOF Z/W = -0.746 [V]
All other proof masses are within range ( < 0.3 [V] ):
ETMX T240 1 DOF X/U = -0.045 [V]
ETMX T240 1 DOF Y/V = -0.067 [V]
ETMX T240 1 DOF Z/W = -0.059 [V]
ETMX T240 3 DOF X/U = -0.048 [V]
ETMX T240 3 DOF Y/V = -0.118 [V]
ETMX T240 3 DOF Z/W = -0.075 [V]
ETMY T240 1 DOF X/U = 0.032 [V]
ETMY T240 1 DOF Y/V = 0.17 [V]
ETMY T240 1 DOF Z/W = 0.232 [V]
ETMY T240 2 DOF X/U = -0.109 [V]
ETMY T240 2 DOF Y/V = 0.203 [V]
ETMY T240 2 DOF Z/W = 0.034 [V]
ETMY T240 3 DOF X/U = 0.244 [V]
ETMY T240 3 DOF Y/V = 0.057 [V]
ETMY T240 3 DOF Z/W = 0.108 [V]
ITMX T240 1 DOF Y/V = 0.293 [V]
ITMX T240 2 DOF X/U = 0.134 [V]
ITMX T240 2 DOF Y/V = 0.244 [V]
ITMX T240 2 DOF Z/W = 0.238 [V]
ITMX T240 3 DOF Y/V = 0.115 [V]
ITMX T240 3 DOF Z/W = 0.065 [V]
ITMY T240 1 DOF X/U = 0.02 [V]
ITMY T240 1 DOF Y/V = 0.142 [V]
ITMY T240 1 DOF Z/W = 0.012 [V]
ITMY T240 2 DOF X/U = 0.018 [V]
ITMY T240 2 DOF Y/V = 0.239 [V]
ITMY T240 2 DOF Z/W = 0.112 [V]
ITMY T240 3 DOF Y/V = 0.043 [V]
BS T240 1 DOF X/U = -0.06 [V]
BS T240 1 DOF Y/V = -0.286 [V]
BS T240 1 DOF Z/W = 0.208 [V]
BS T240 2 DOF X/U = 0.069 [V]
BS T240 2 DOF Y/V = 0.117 [V]
BS T240 2 DOF Z/W = 0.022 [V]
BS T240 3 DOF X/U = -0.132 [V]
BS T240 3 DOF Y/V = -0.259 [V]
There are 2 STS proof masses out of range ( > 2.0 [V] )!
STS EY DOF X/U = -4.566 [V]
STS EY DOF Z/W = 2.375 [V]
All other proof masses are within range ( < 2.0 [V] ):
STS A DOF X/U = -0.576 [V]
STS A DOF Y/V = -0.668 [V]
STS A DOF Z/W = -0.645 [V]
STS B DOF X/U = 0.124 [V]
STS B DOF Y/V = 0.96 [V]
STS B DOF Z/W = -0.355 [V]
STS C DOF X/U = -0.947 [V]
STS C DOF Y/V = 0.891 [V]
STS C DOF Z/W = 0.653 [V]
STS EX DOF X/U = 0.578 [V]
STS EX DOF Y/V = -0.515 [V]
STS EX DOF Z/W = -0.367 [V]
STS EY DOF Y/V = 1.166 [V]
STS FC DOF X/U = 0.155 [V]
STS FC DOF Y/V = -1.181 [V]
STS FC DOF Z/W = 0.633 [V]
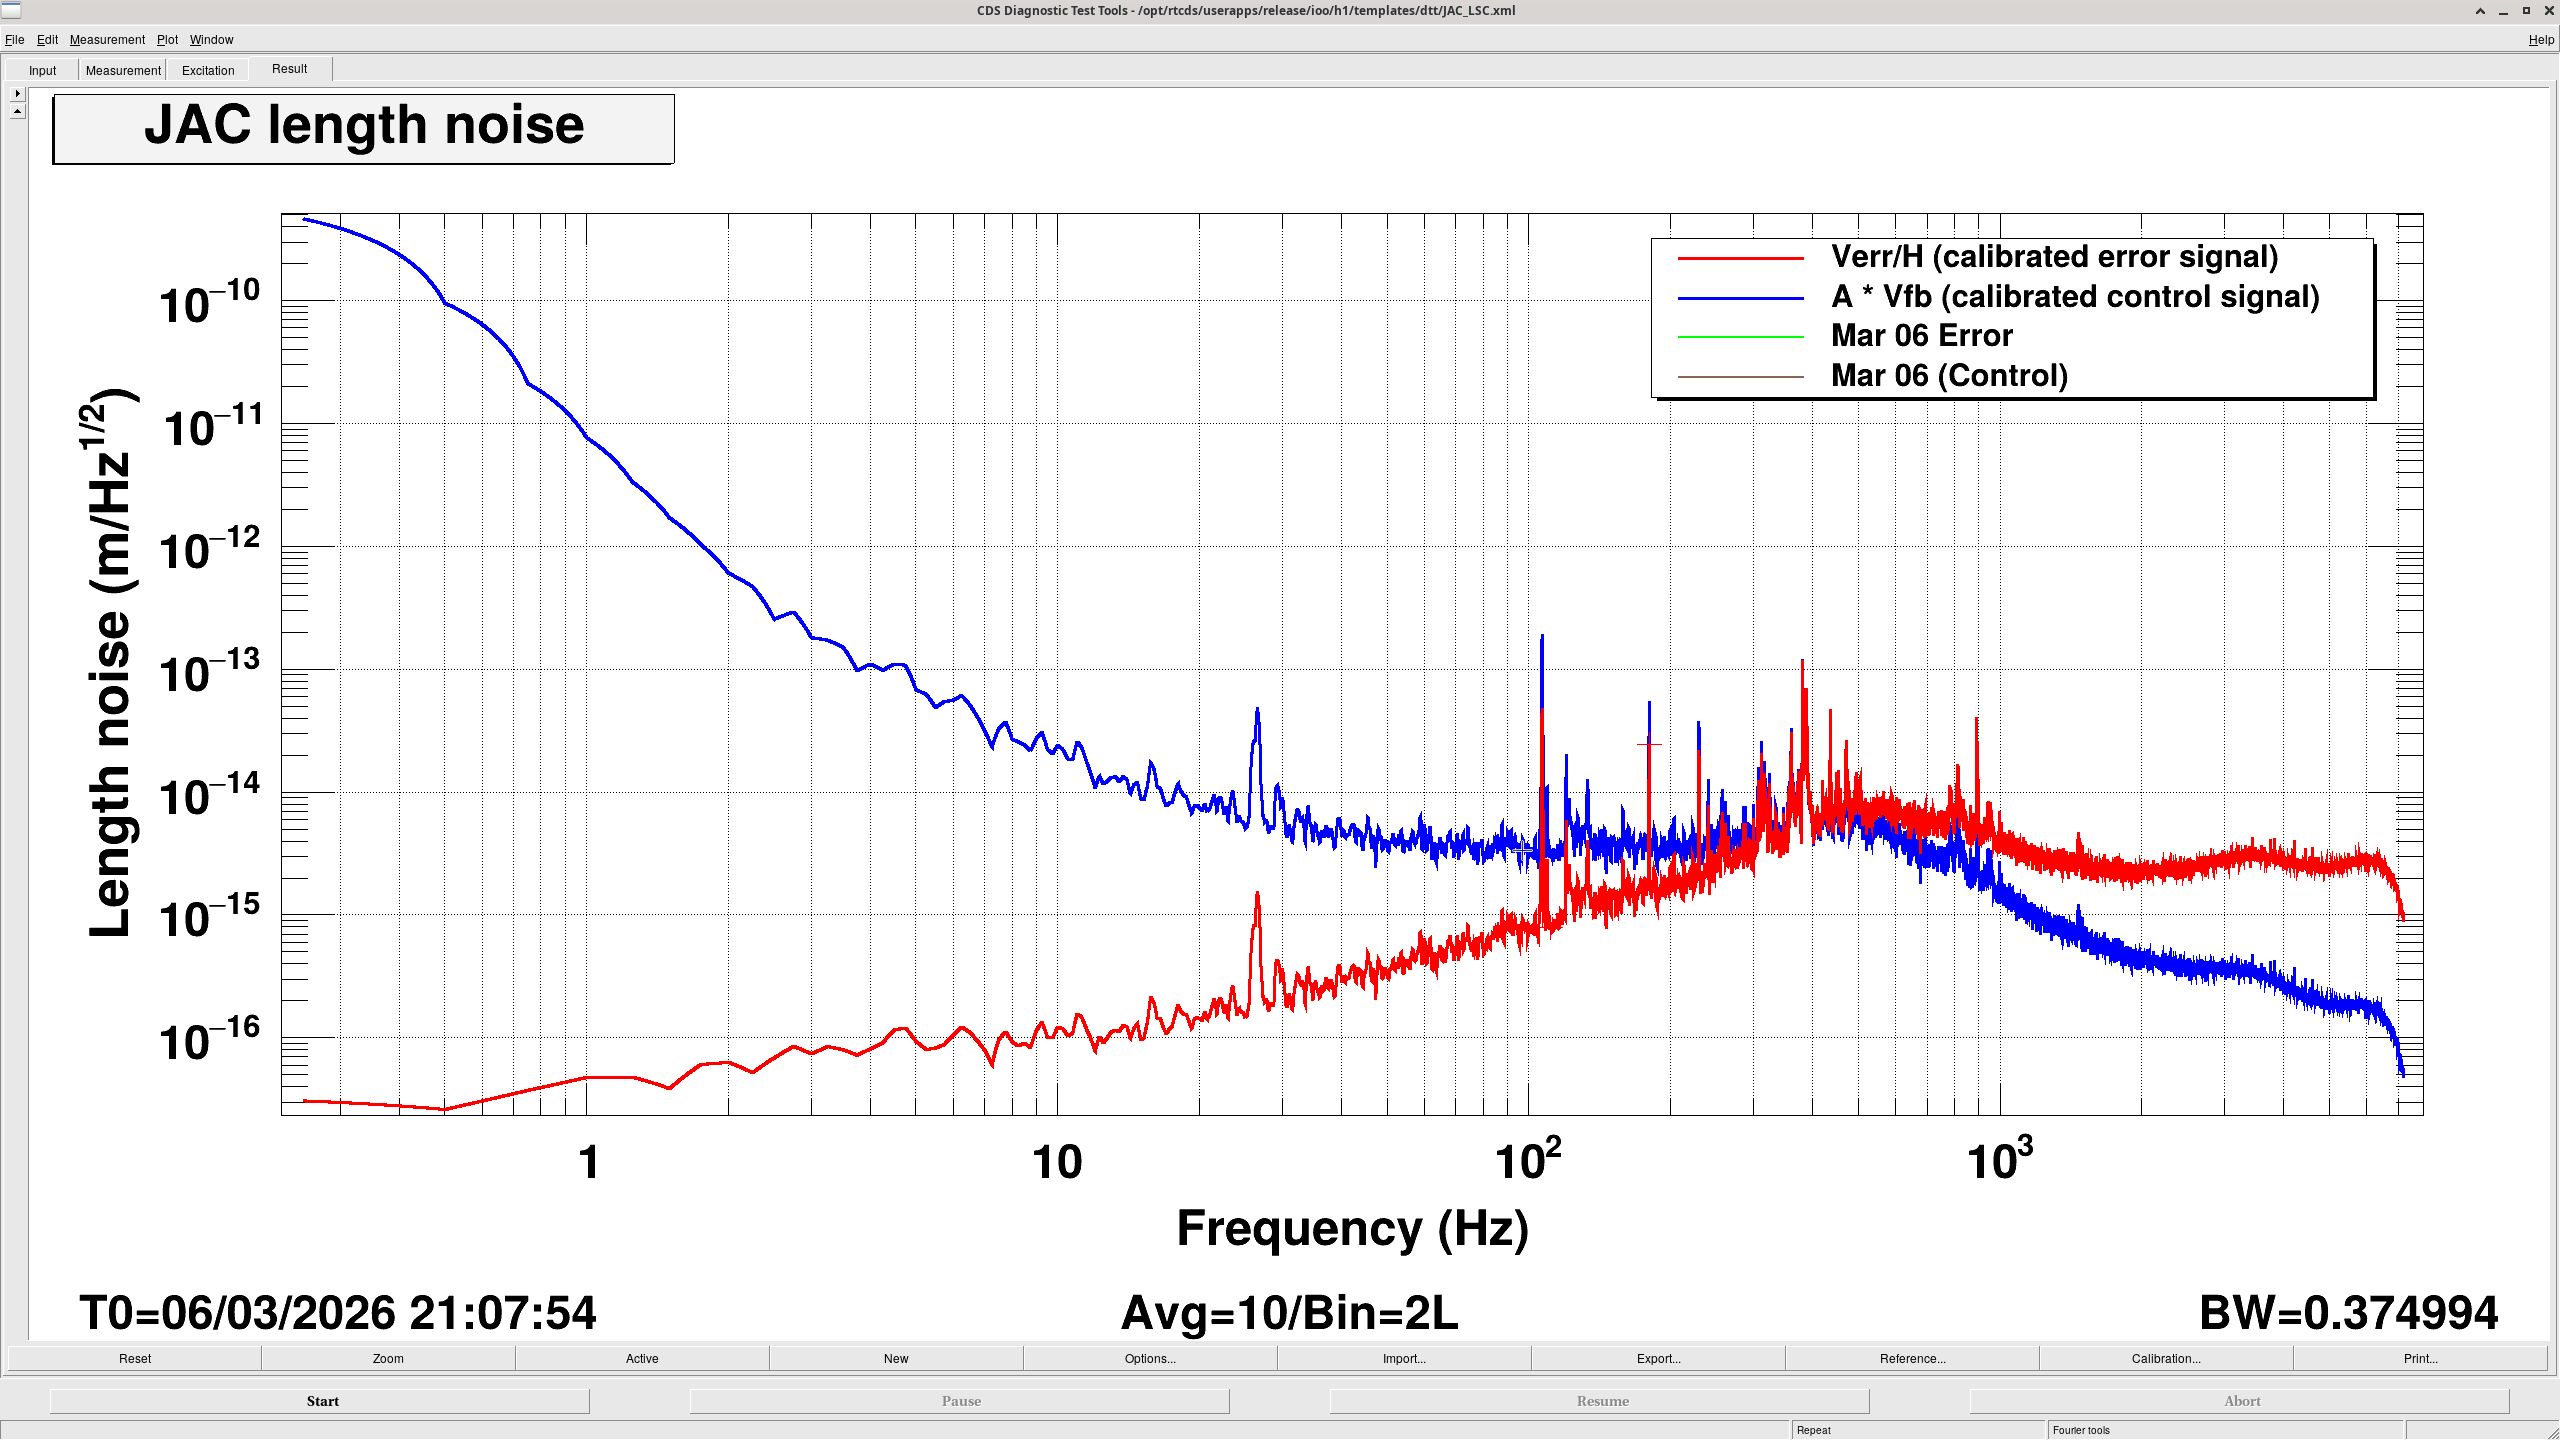
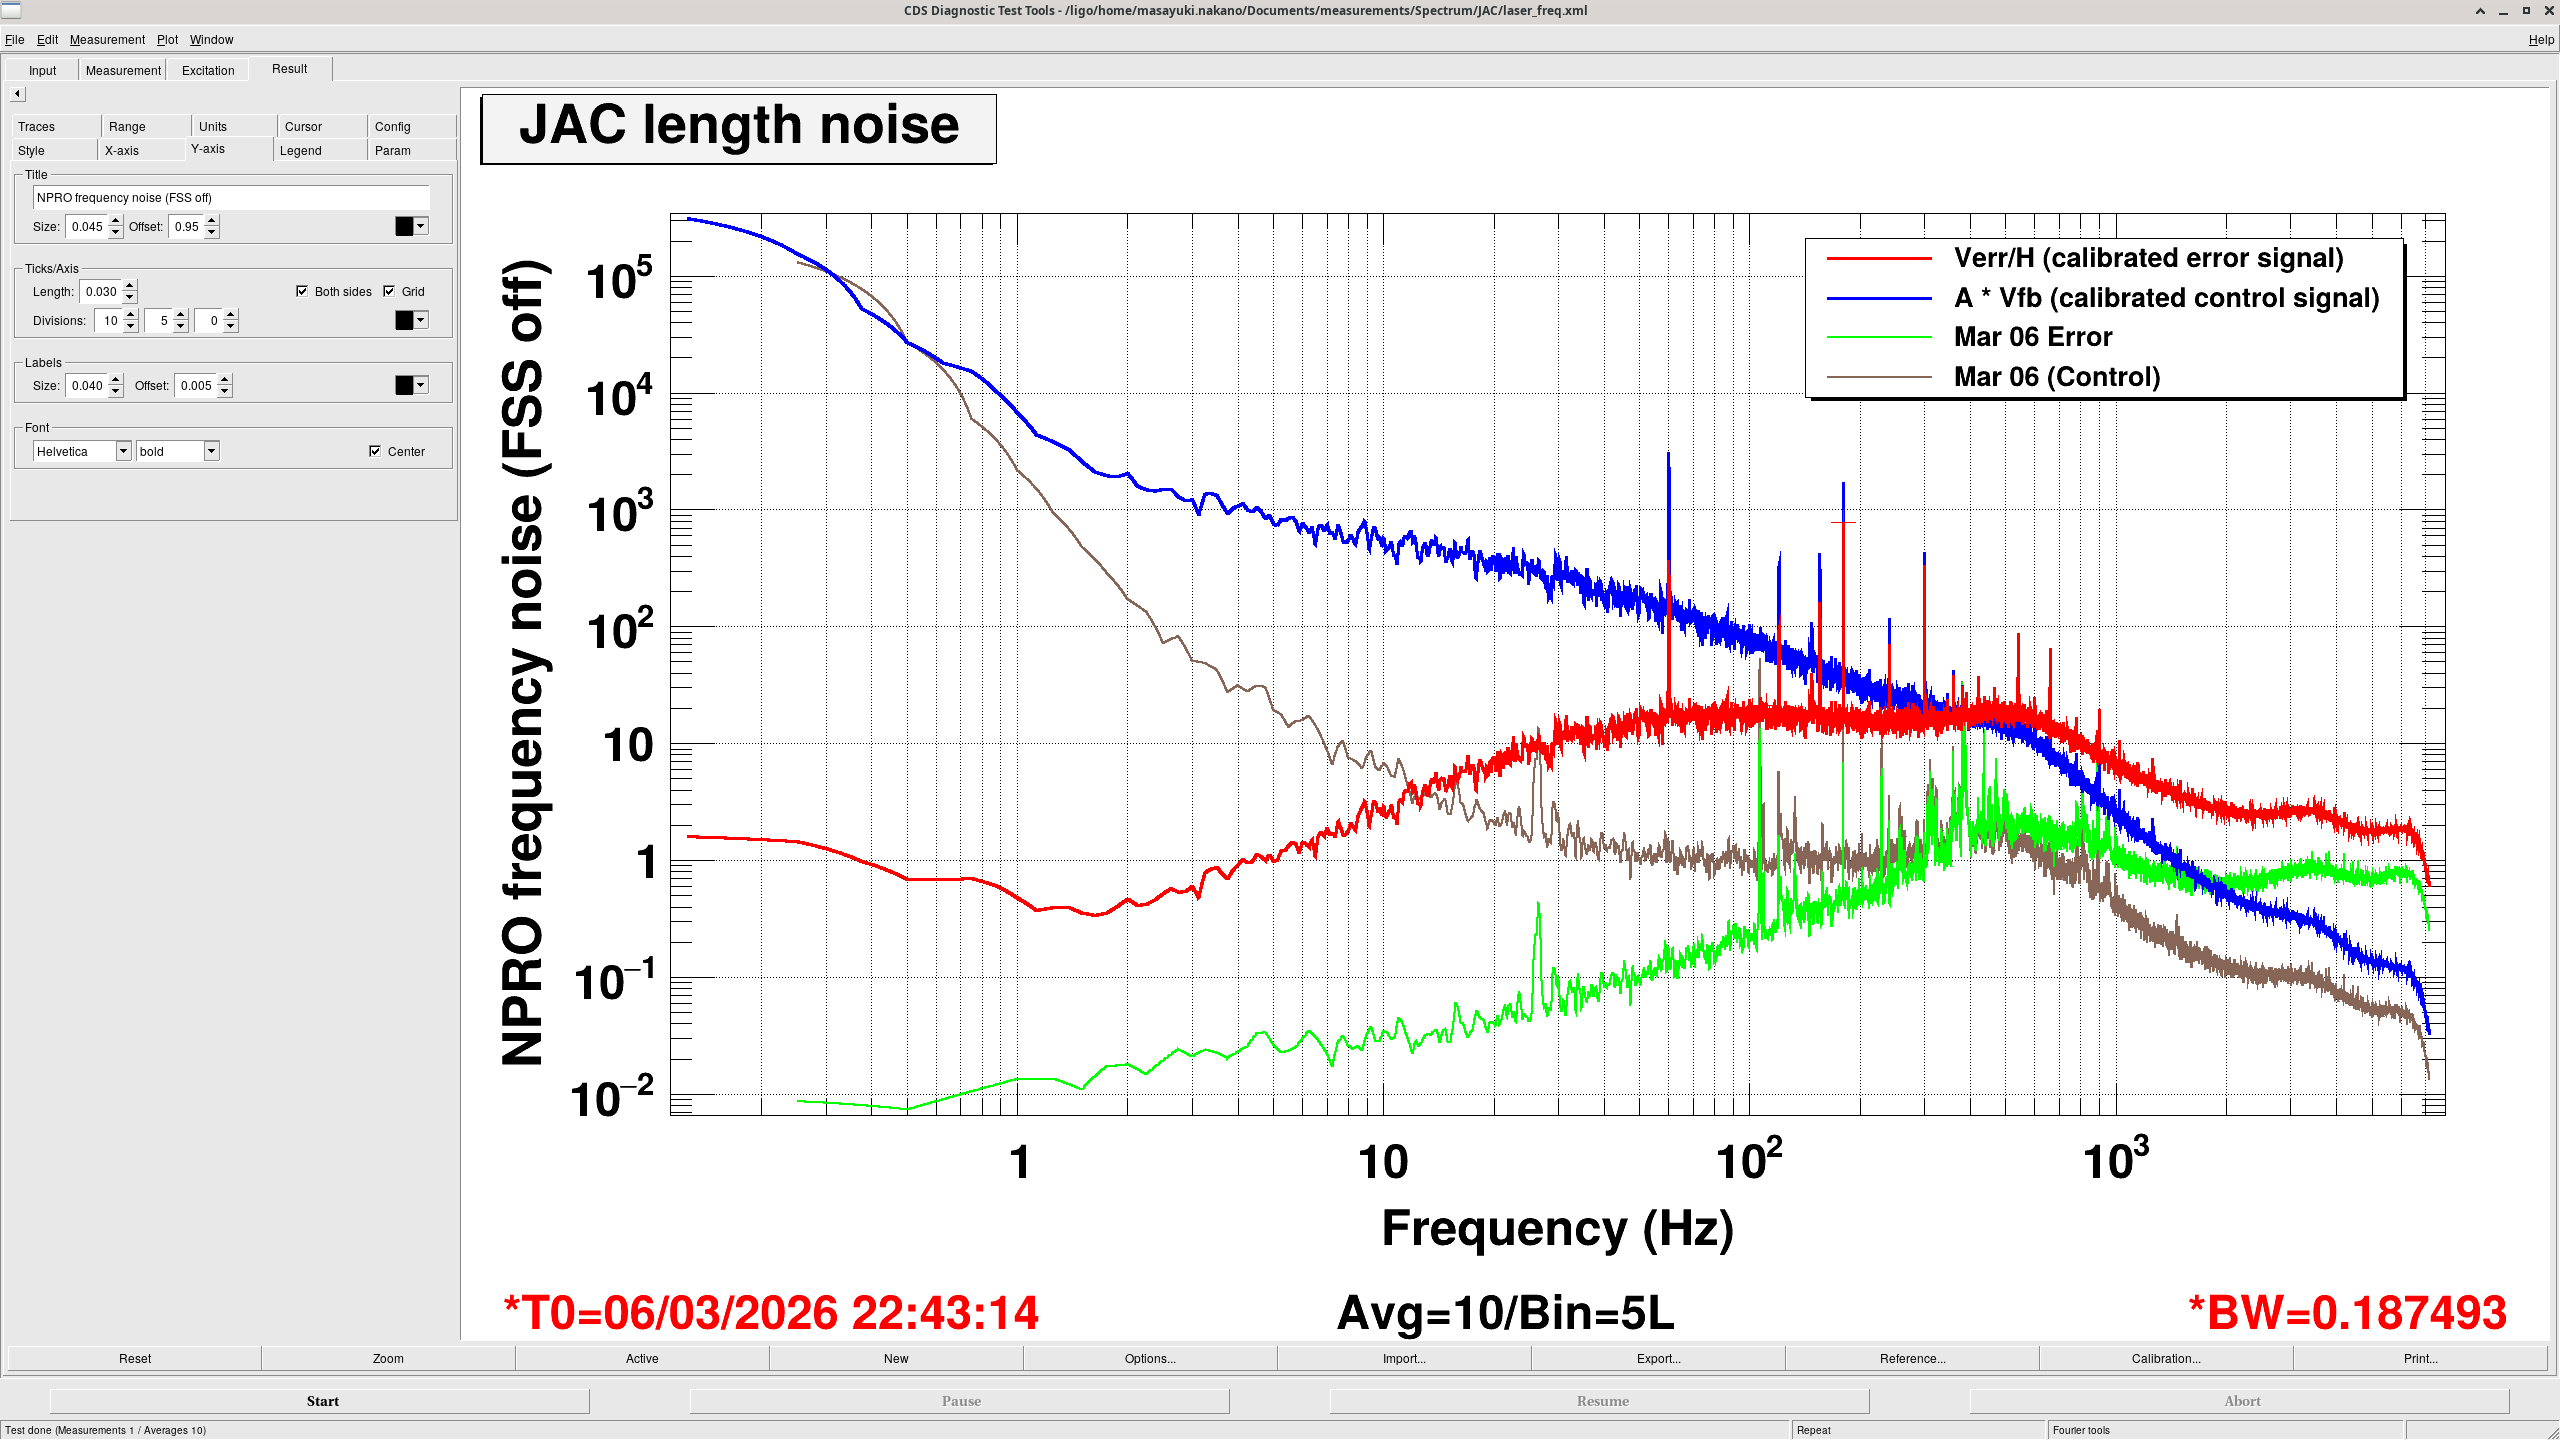
The calibrated error signal and feedback signal spectra were measured to estimate the free-running length motion of the JAC. Below the unity gain frequency (UGF = 400 Hz), the feedback signal represents the cavity length motion, while above the UGF the error signal represents the motion. The estimated length noise is well below the design assumption and does not appear to limit the JAC performance.
The spectra of the calibrated error signal and feedback signal were measured to estimate the free-running length motion of the JAC.
- Below the UGF (400 Hz), the feedback signal represents the cavity length motion.
- Above the UGF, the error signal represents the cavity length motion.
Around 400 Hz, the spectrum appears slightly inflated because of the phase bubble, but the actual noise level is expected to be approximately flat in that region.
- Above 30 Hz
Above 30 Hz, the spectrum becomes flat. This is likely not real cavity motion, but instead electronics noise from the readout chain. A more careful calculation is needed to identify the exact source, but it is most likely the photodiode or the ADC.
Since the incident power is currently 1 W, this noise floor is expected to decrease if the input power is increased.
- Below 10 Hz
Toward DC, the spectrum rises approximately with an f-3 slope. This is interpreted as drift in the PZT control signal caused by temperature drift.
Therefore, the actual cavity length variation at low frequencies is expected to be smaller than what appears directly in the measured spectrum.
- Estimated Length Noise
Looking at the spectrum around 10 Hz, where the above effects are not expected to dominate, the cavity length noise is estimated to be approximately 2 × 10-14 m/rtHz.
In the design, the cavity length motion was conservatively assumed to be 1 × 10-12 m/rtHz at 10 Hz.
Therefore, the measured result is well below the design assumption, indicating that the loop design and the JAC do not introduce problematic intensity noise or phase noise.
As a sanity check, the same measurement was repeated with the FSS unlocked. In this measurement, the vertical axis was converted into laser frequency noise by multiplying the calibrated length signal by
FSR / (lambda / 2)
where the free spectral range is given by
FSR = c / L
with c the speed of light and L the cavity round-trip length. For the JAC, L = 2.02 m.
The resulting spectrum, shown in the second plot, is approximately 100 Hz/rtHz at 100 Hz. This is consistent with the typical frequency noise of the NPRO laser.
This also confirms that the JAC is sufficiently quiet compared with the NPRO noise level.
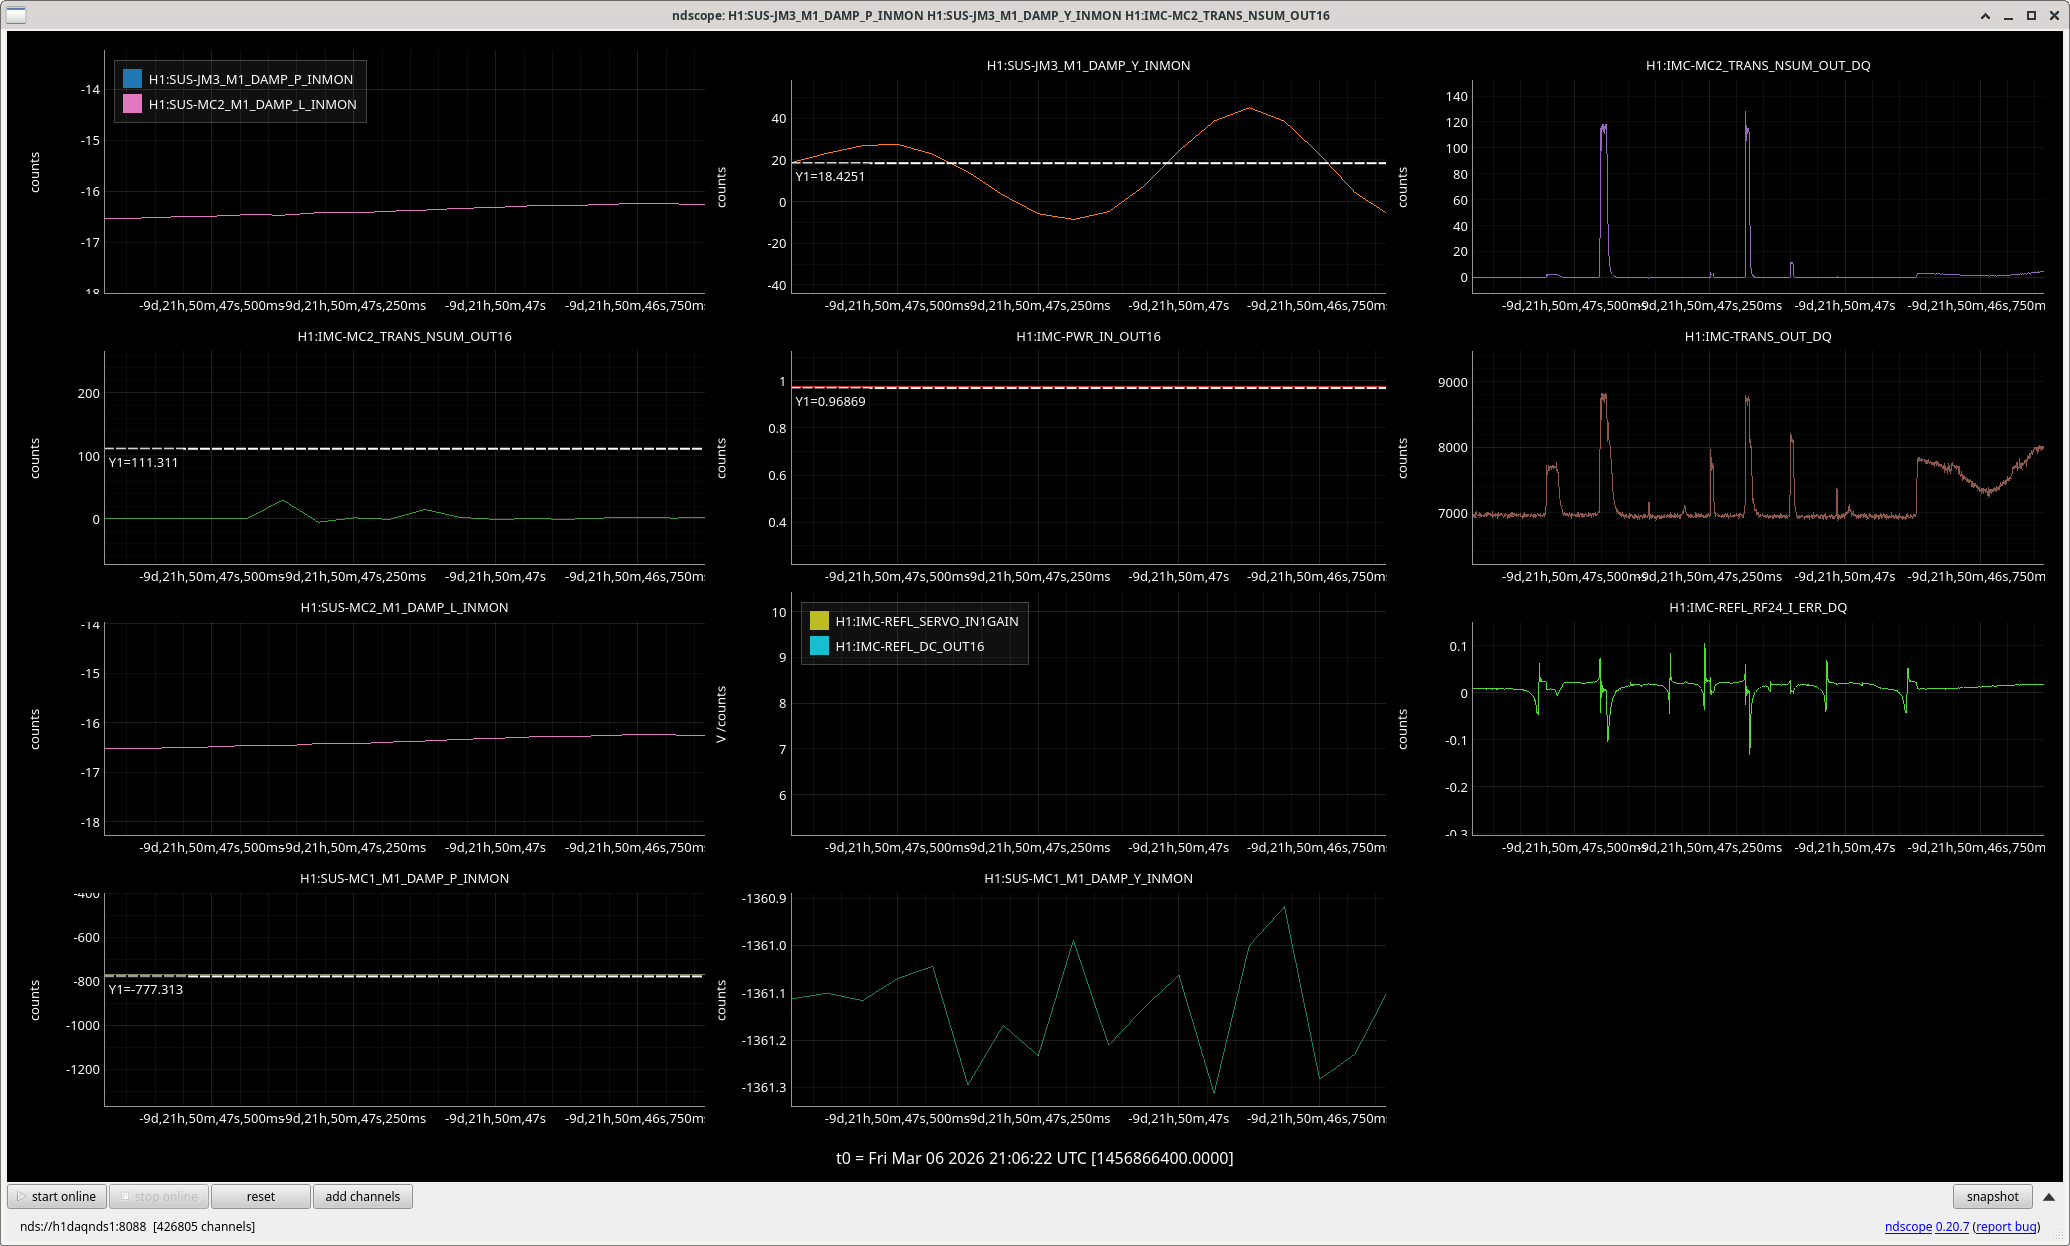
Today we have been having some difficulty in locking the IMC, which might be related to MC1 an MC1 suspension problem.
With the mode cleaner aligned and flashing, we checked the IMC REFL RF24 I and Q signals to check that the PDH phase looks OK, it does. This is a similar amplitude to what we saw in trends from a time when the IMC was locking, here.

WP13043 h1sush6 front end install
Daniel, Erik, Fil, Jonathan, Dave:
The new h1sush6 front end system is running with its full card complement and a basic IOP model.
On Wednesday afternoon we got the computer booting and seeing most of its chassis, detailed in alog 89376
The outstanding issues were: timing card was not receiving a timing signal, 4th Adnaco BP was not seen.
On Thursday we tracked the fibre issues to a not-quite-seated MTP on the MSR's MER patch (port 3). Once this fibre was reseated correctly the timing card received its signal and the 4th Adnaco BP was seen.
At this point I built up the IO Chassis with the correct card layout, using the ADC and 16bit-DACs provided by the BHD group. We supplied the Interface cards and ribbon cables from stock.
As of end-of-business Thursday the IO Chassis was almost complete, I had miscounted the 16bit-DACs and we were one card short. I built h1iopsush6 with this partial layout and we got the model running.
Friday lunch time I installed the 5th 16bit-DAC and added it to h1iopsush6. The system is now complete as-per drawings G2301306
H1SUSH6 IO Chassis Layout
| A1-1 | LIGO Timing Card S2101110 | A3-1 | 16AO16-DAC4 250611-24 S2500772 --- S1500324 | |
| A1-2 | empty | A3-2 | empty | |
| A1-3 | 16AI64-ADC0 S2500754 --- S1102353 | A3-3 | empty | |
| A1-4 | 16AO16-DAC0 110419-25 --- S1900099 | A3-4 | empty | |
| A2-1 | 16AI62-ADC1 210128-39 S2500747 --- S1102355 | A4-1 | 6464Contec-BIO0 | |
| A2-2 | 16AO16-DAC1 250611-03 S2500773 --- S1102283 | A4-2 | empty | |
| A2-3 | 16AO16-DAC2 250911-07 S2500768 --- S1900098 | A4-3 | empty | |
| A2-4 | 16AO16-DAC3 25-611-10 S2500770 --- S15000314 | A4-4 | empty |
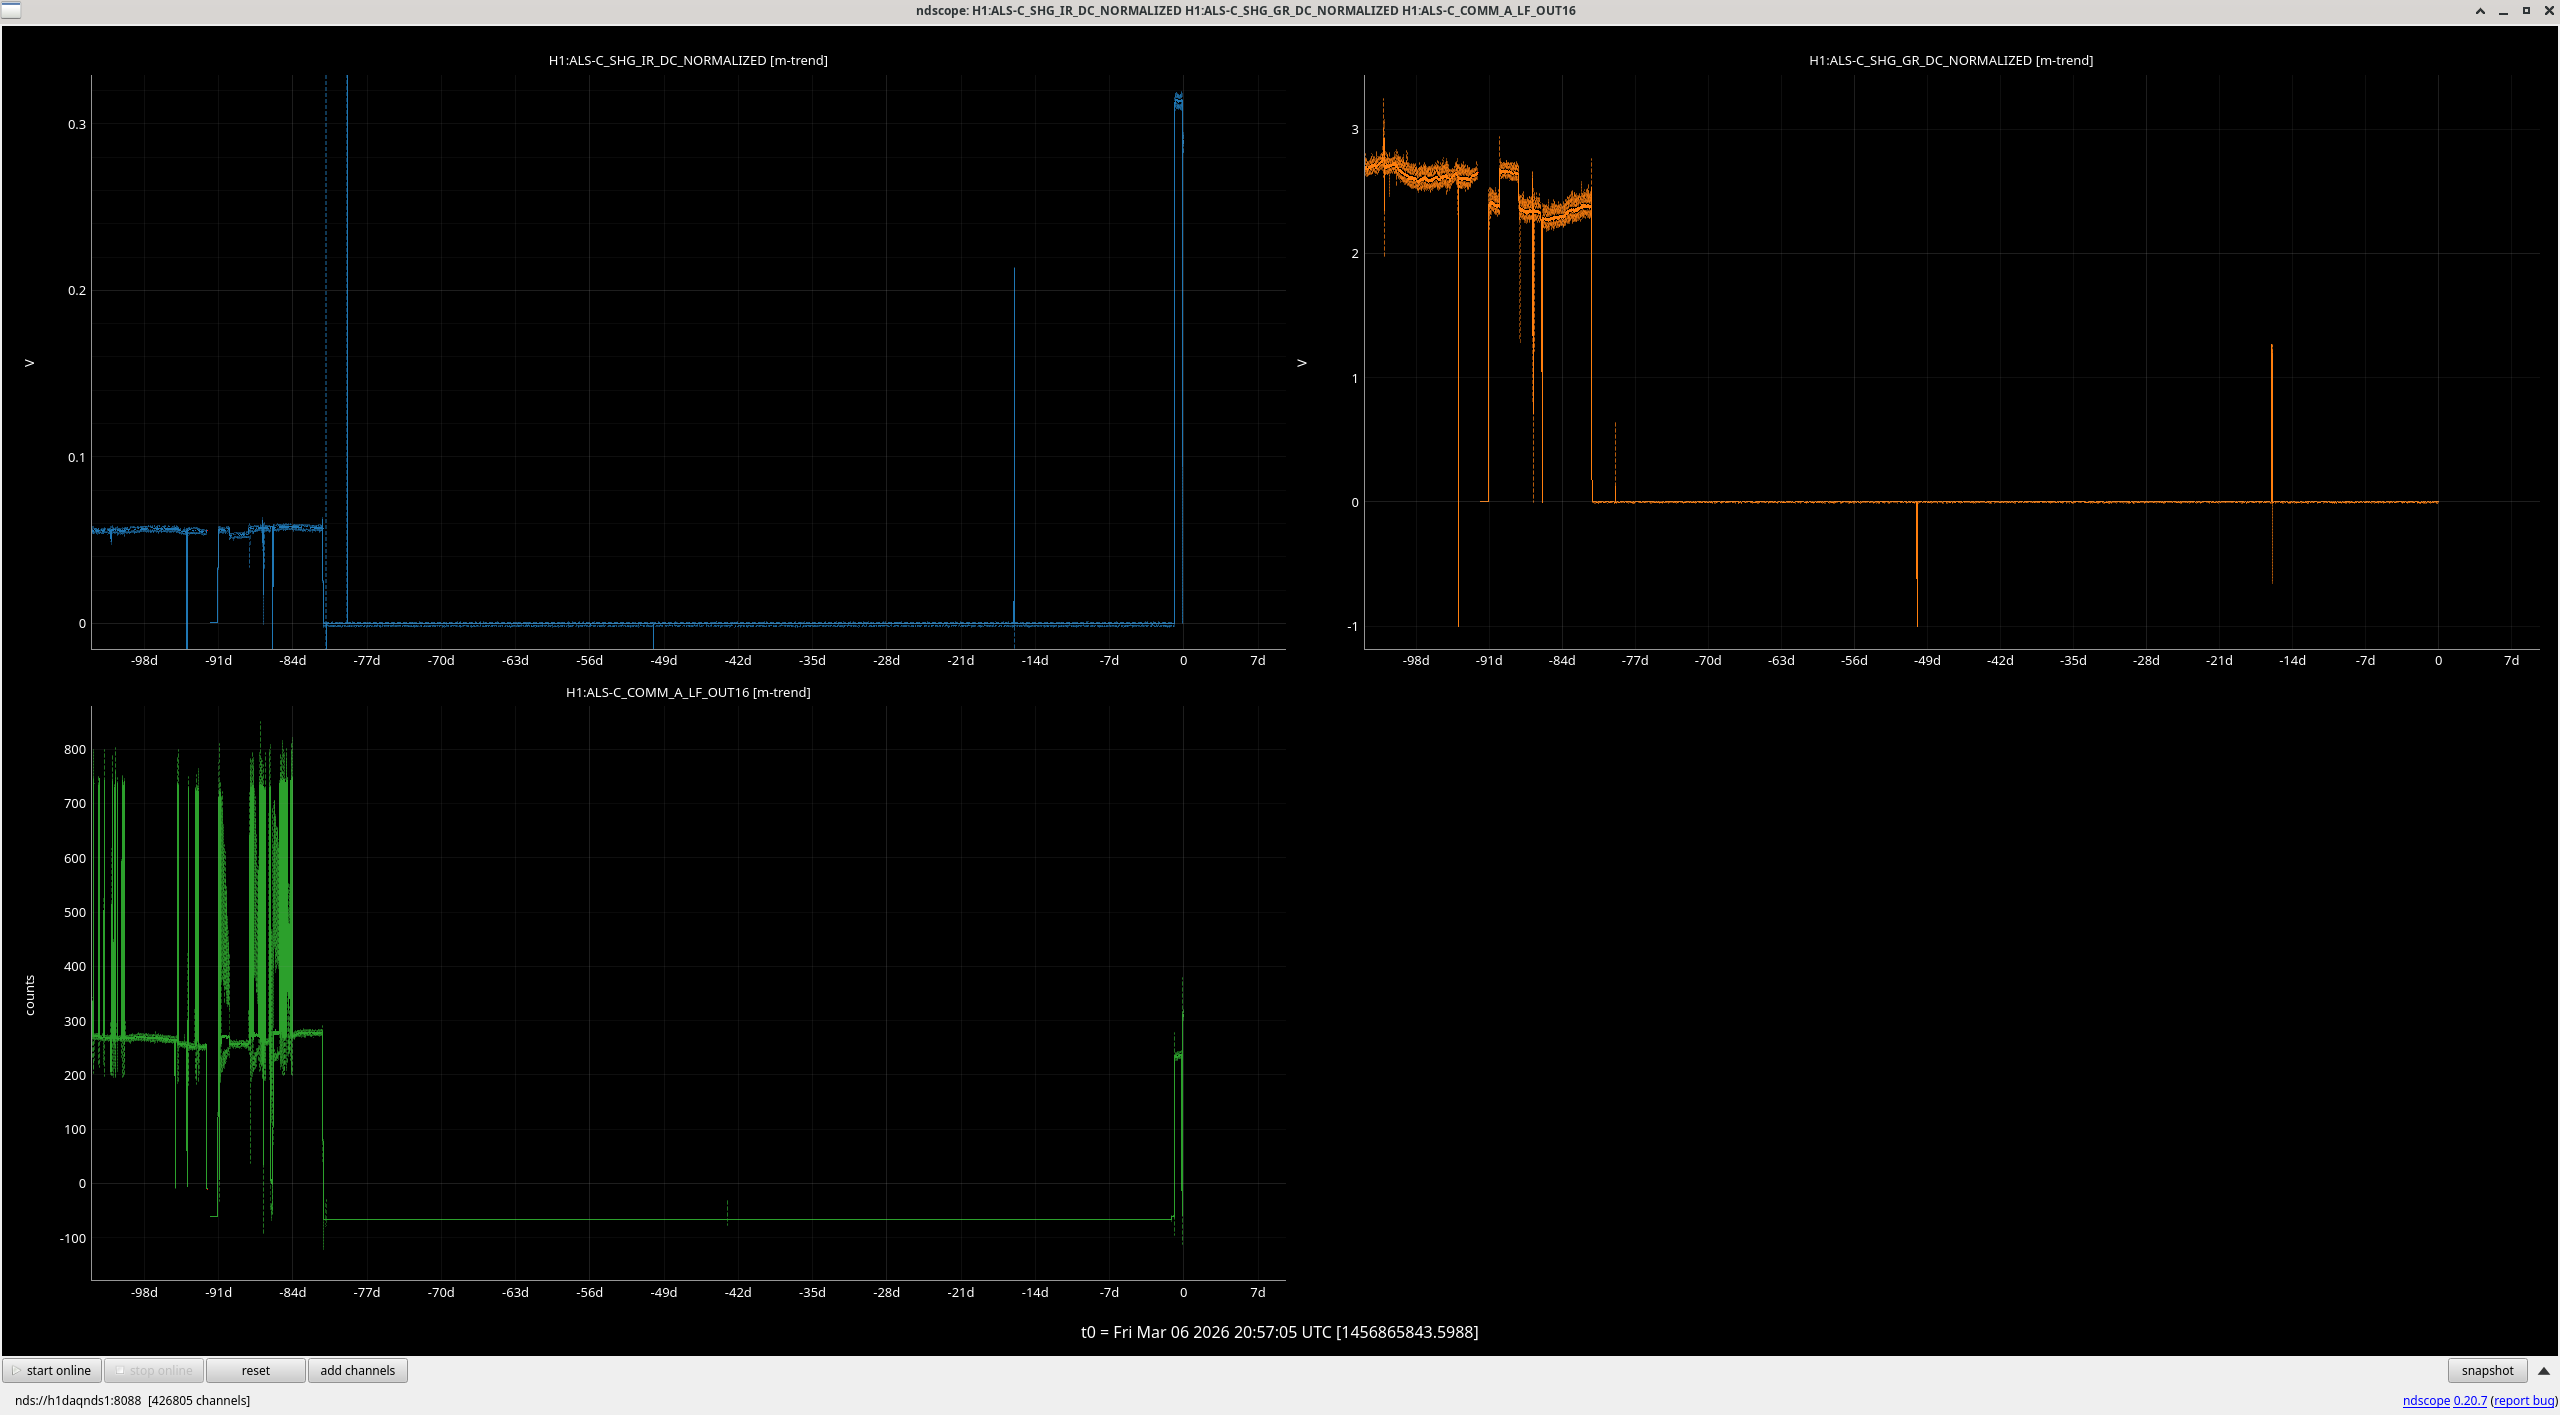
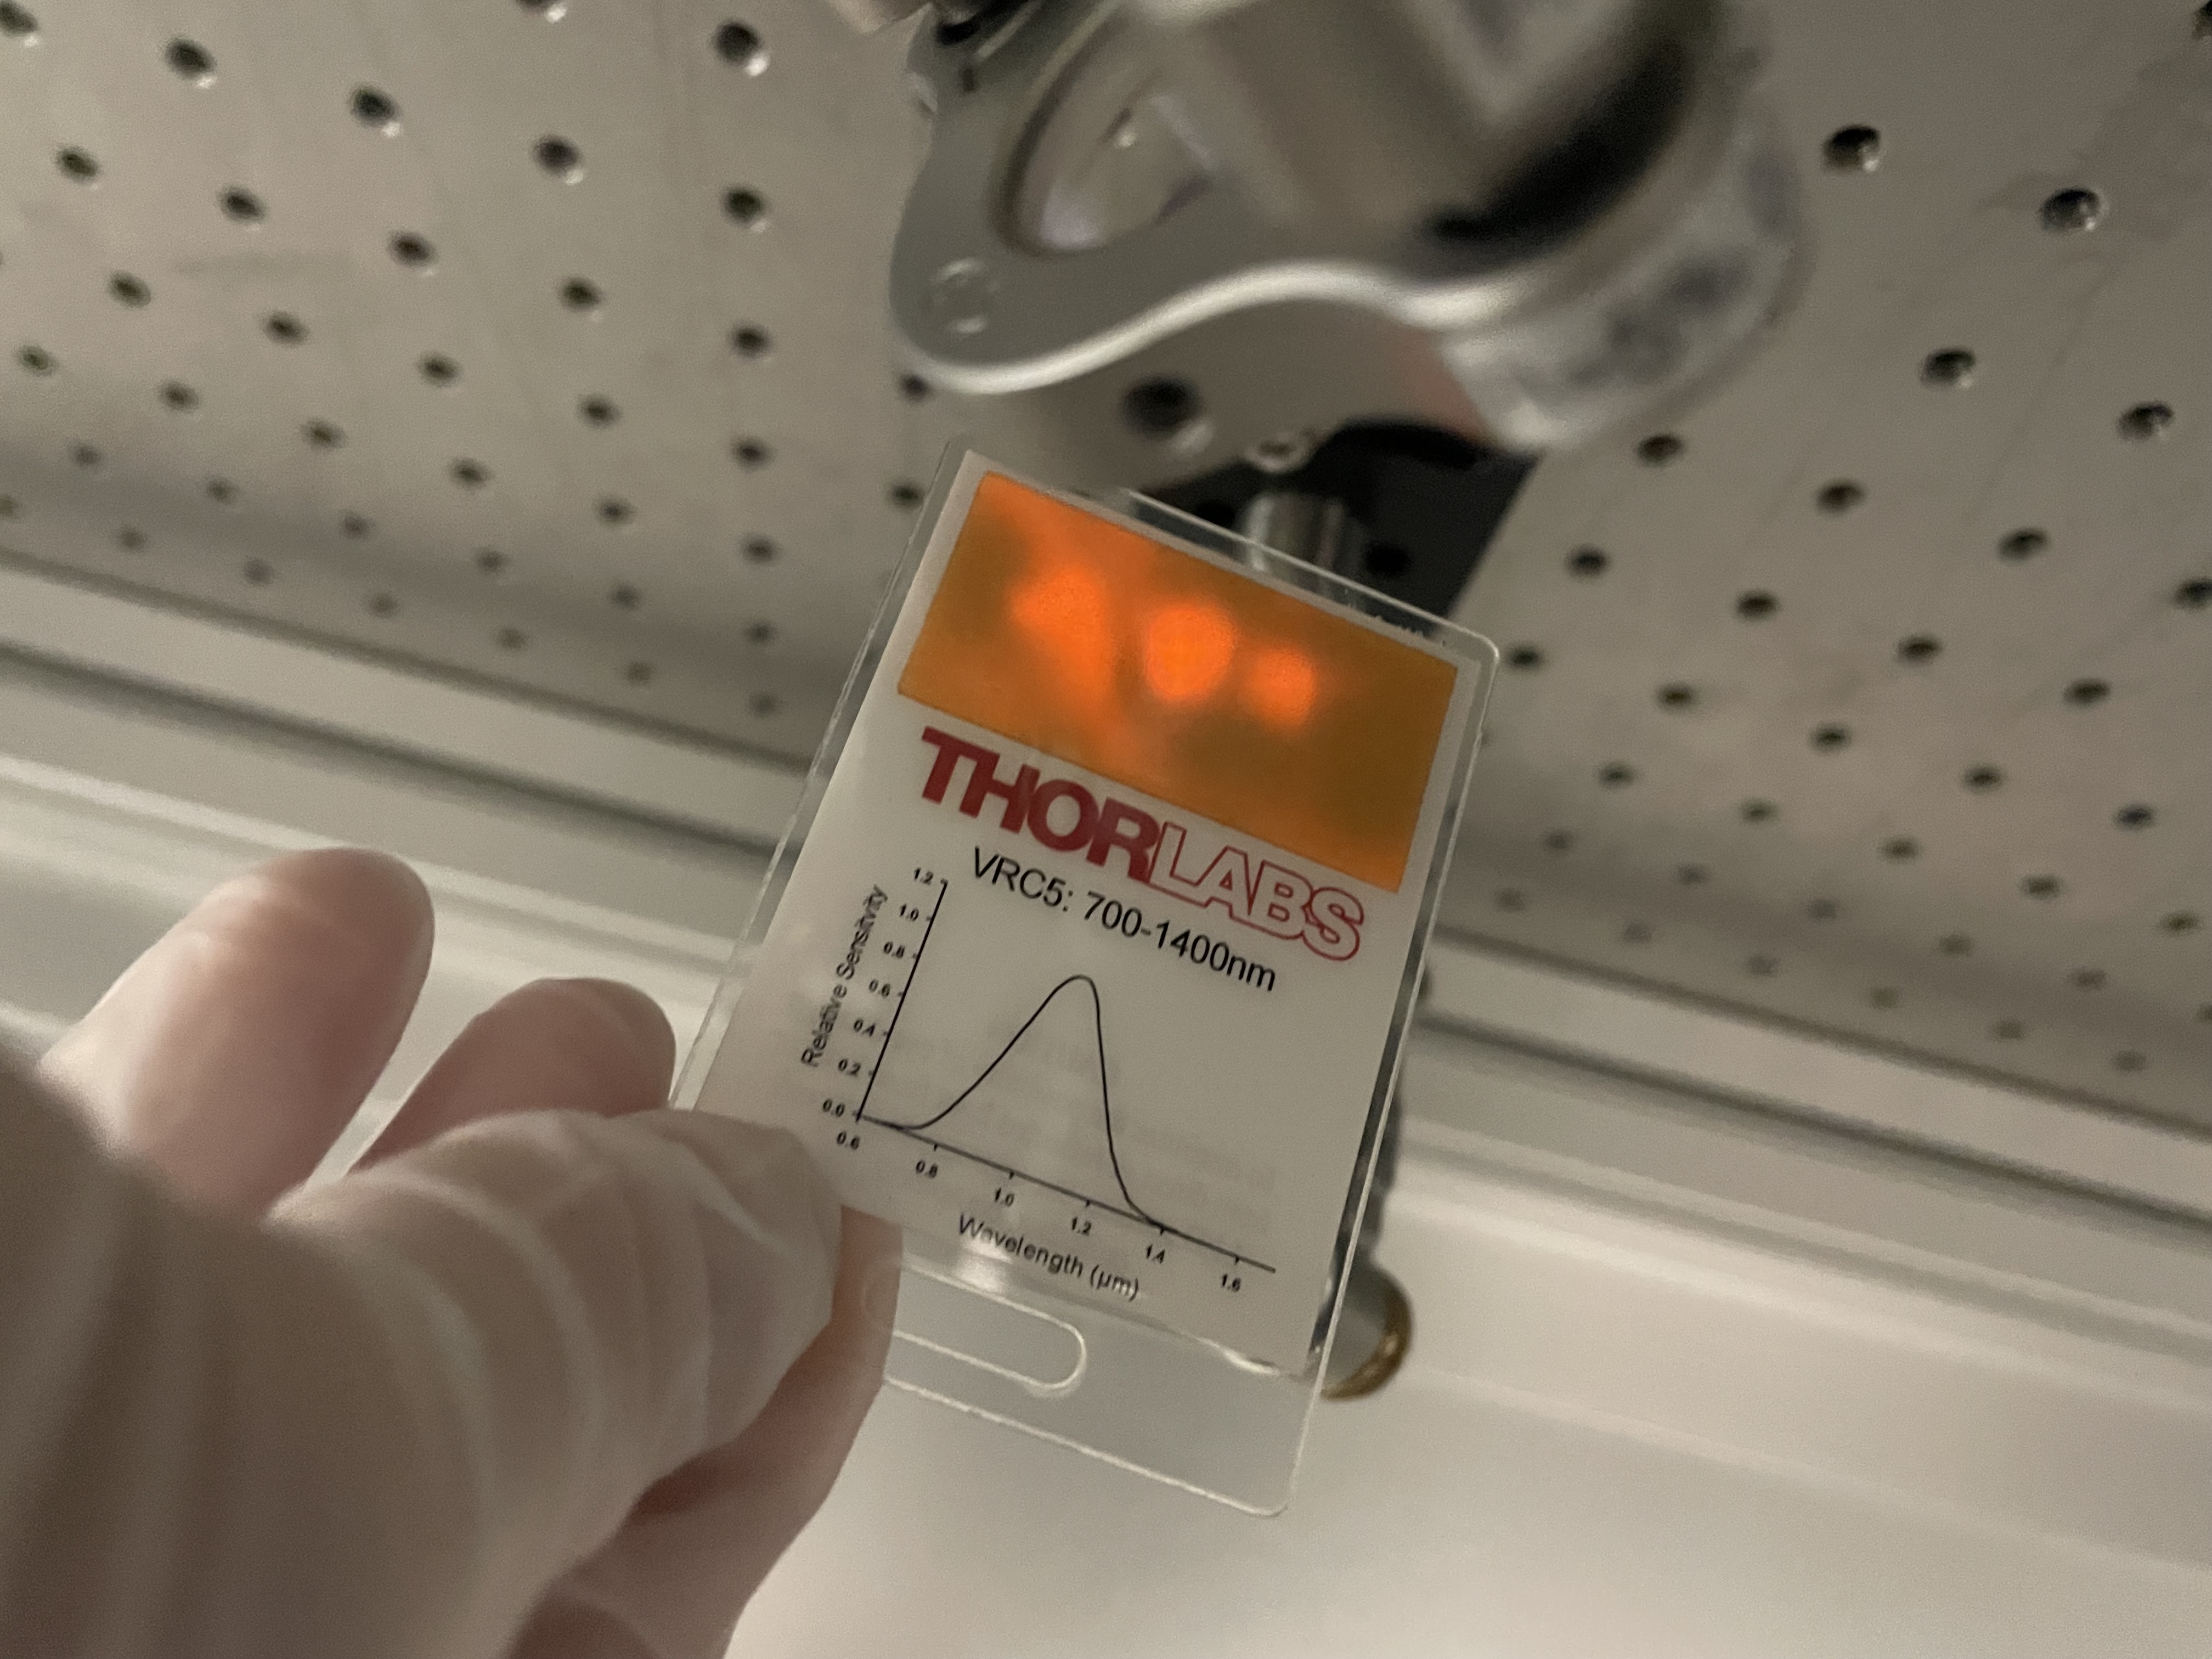
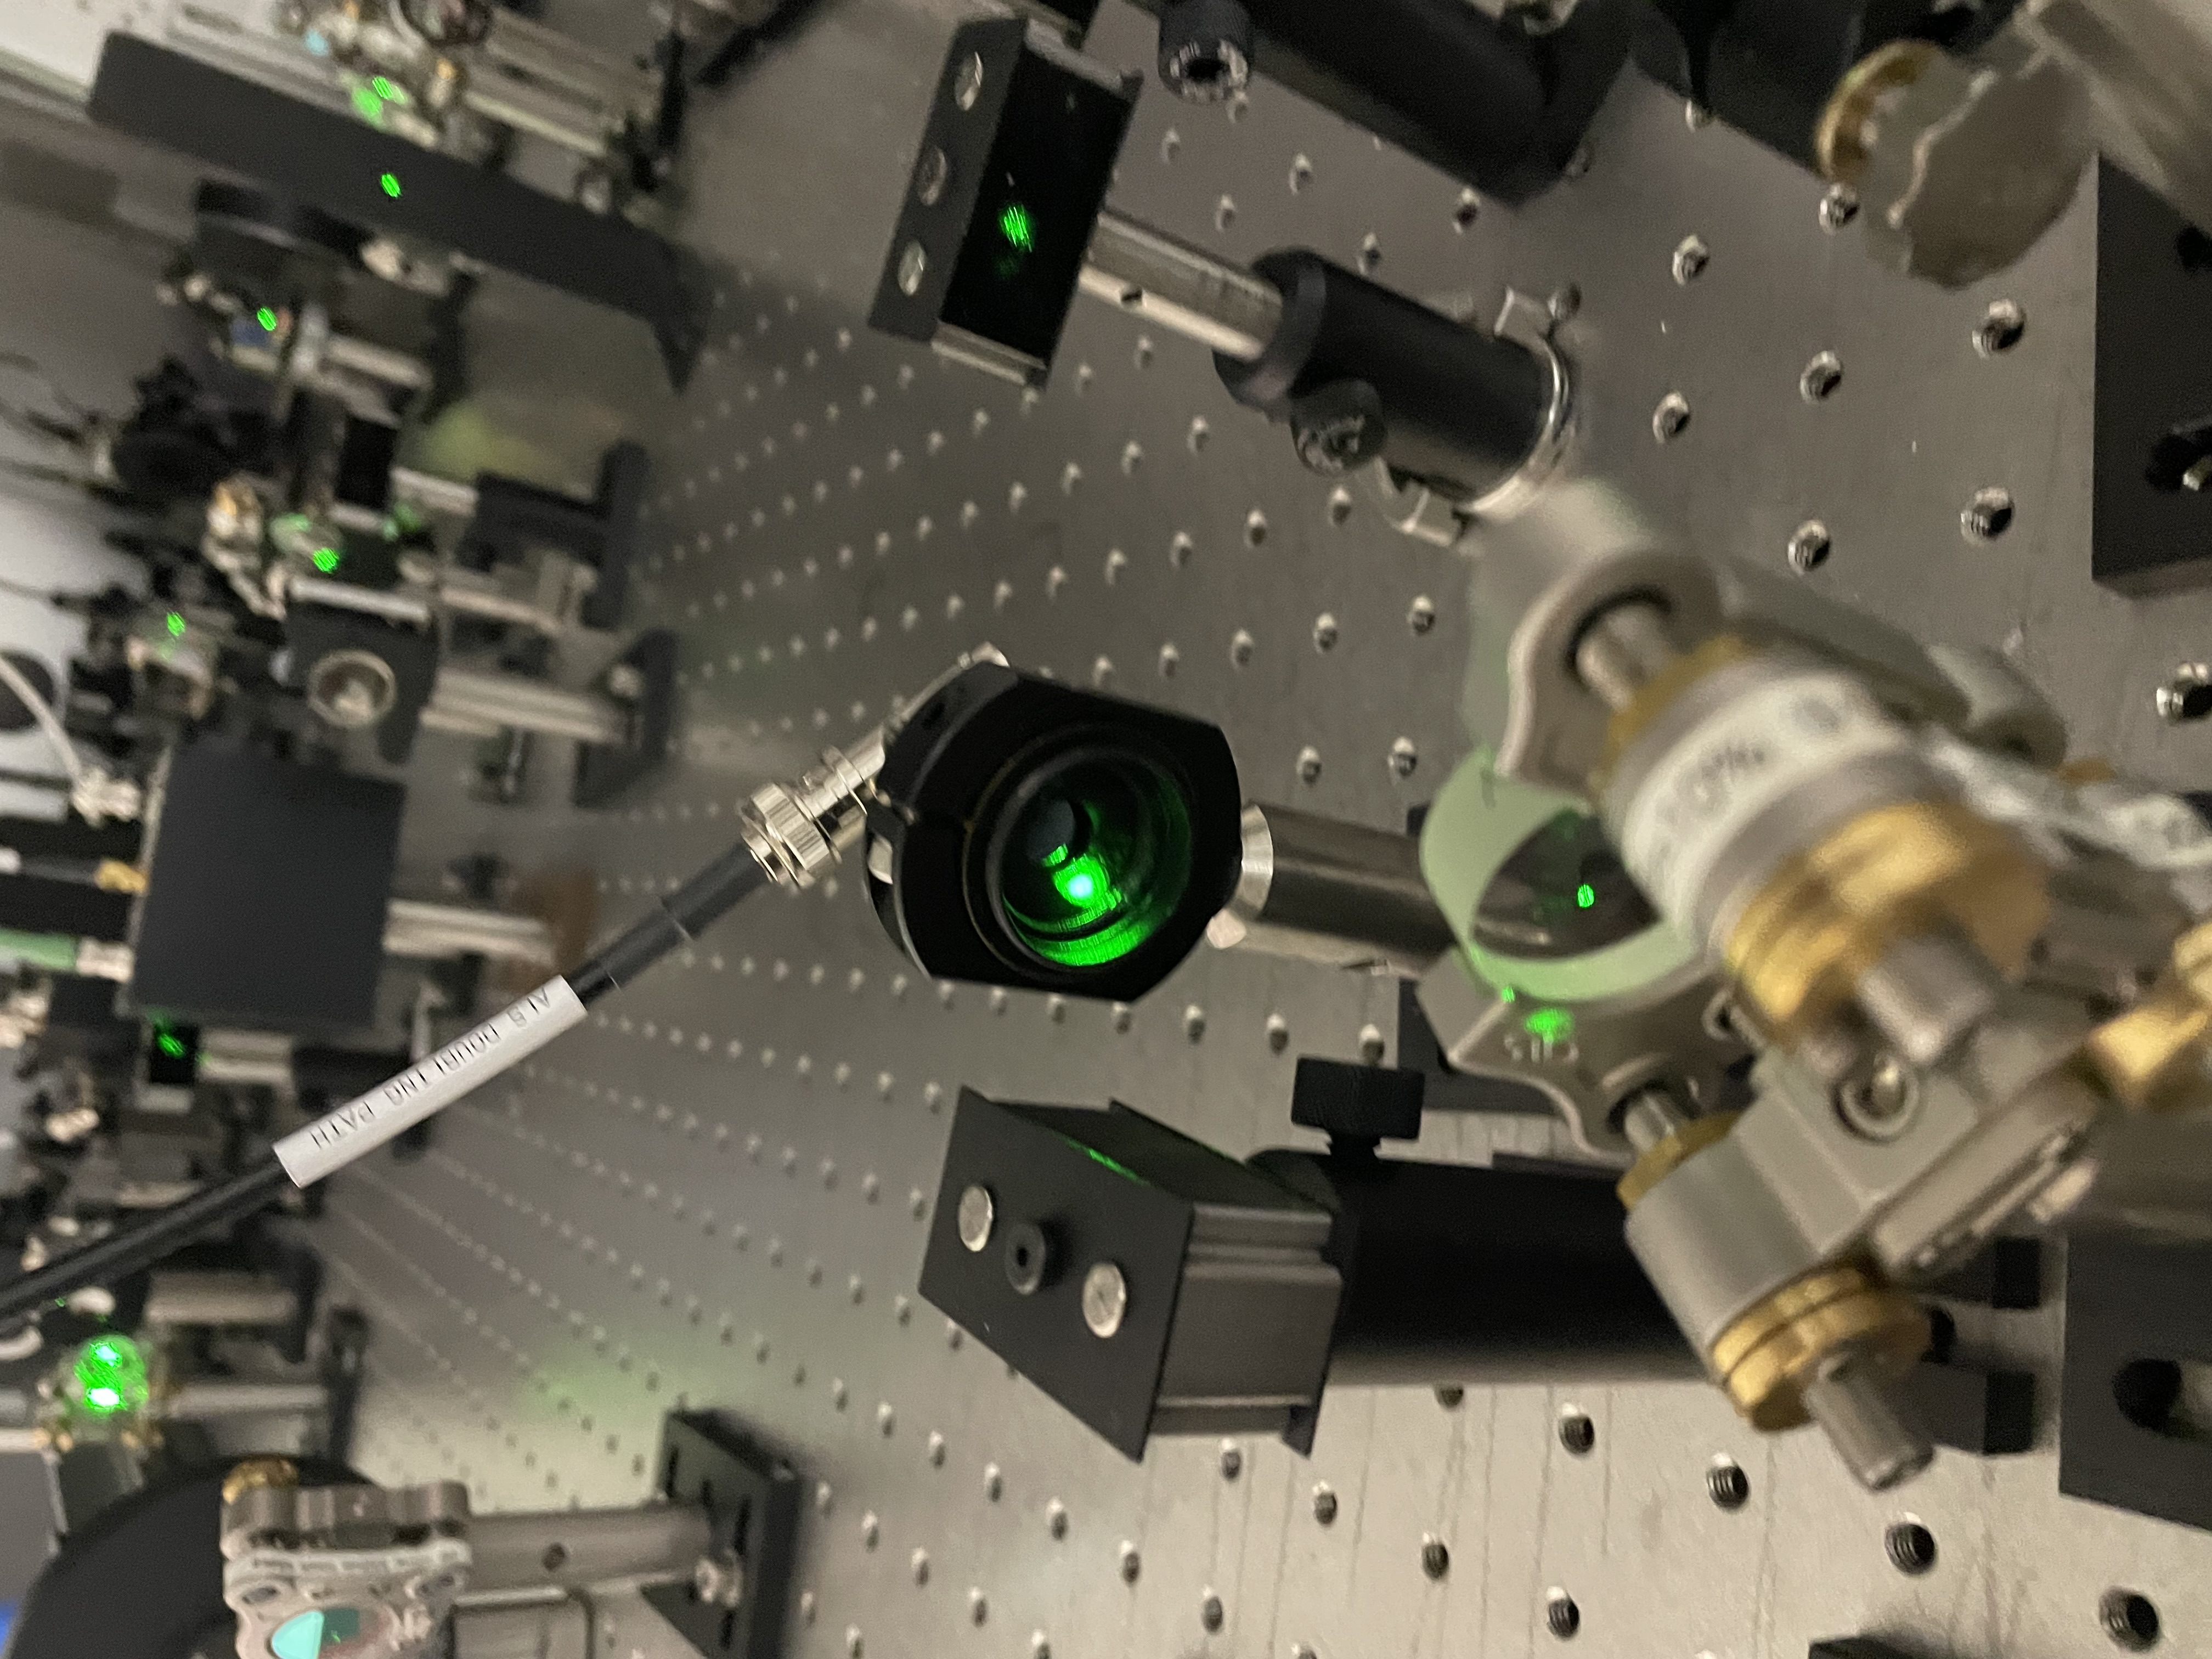
This morning I went to the bifurcated laser hazard and adjusted alignment of the ALS SHG path on ISCT1, picking up where Jenne left off yesterday. Drawing here
The IR beam was reasonably centered on the bottom periscope mirror and the 1" steering mirror right after it, it was clipping on the 1" BS used for the monitor PD. I yawed the 1" mirror right after the periscope to reduce the clipping, seen on a card right after the BS. Then I continued to yaw that first steering mirror to get a beam transmitted through the SHG, as you translate the beam you can see lots of glints transmitted which aren't the actual beam. As soon as there was full beam going through the SHG, the green beam was alinged onto the COMM A broadband PD, so I didn't move any steering optics other than the first one.
The monitor diodes do not agree with the power levels that they showed before the table move. The IR one shows 6 times more power than before the table move, which makes me think the diode may not have been well aligned at the end of O4. The beam in reflection off that first beamsplitter has two lobes visible on a card, possibly the front and back surfaces of the BS. The beam was clearly missing the green power monitor PD, (before photo), I moved the diode to center, but the beam is still too low. Nearly a year ago TJ and I wrote that this diode wasn't working, 84558, it does but seems to have been working since June 9th 2025, a day when the table was realigned as described in 84900. Since this alignment puts the beam onto the COMM diode, which is quite far from the SHG, I think it must be similar to previous alignments, and we probably need to adjust the height of this diode.
The power on the COMM A PD is about 300 counts, similar to what it was in O4. So, this is probably a good enough alignment for us to proceed with locking with.
Summary
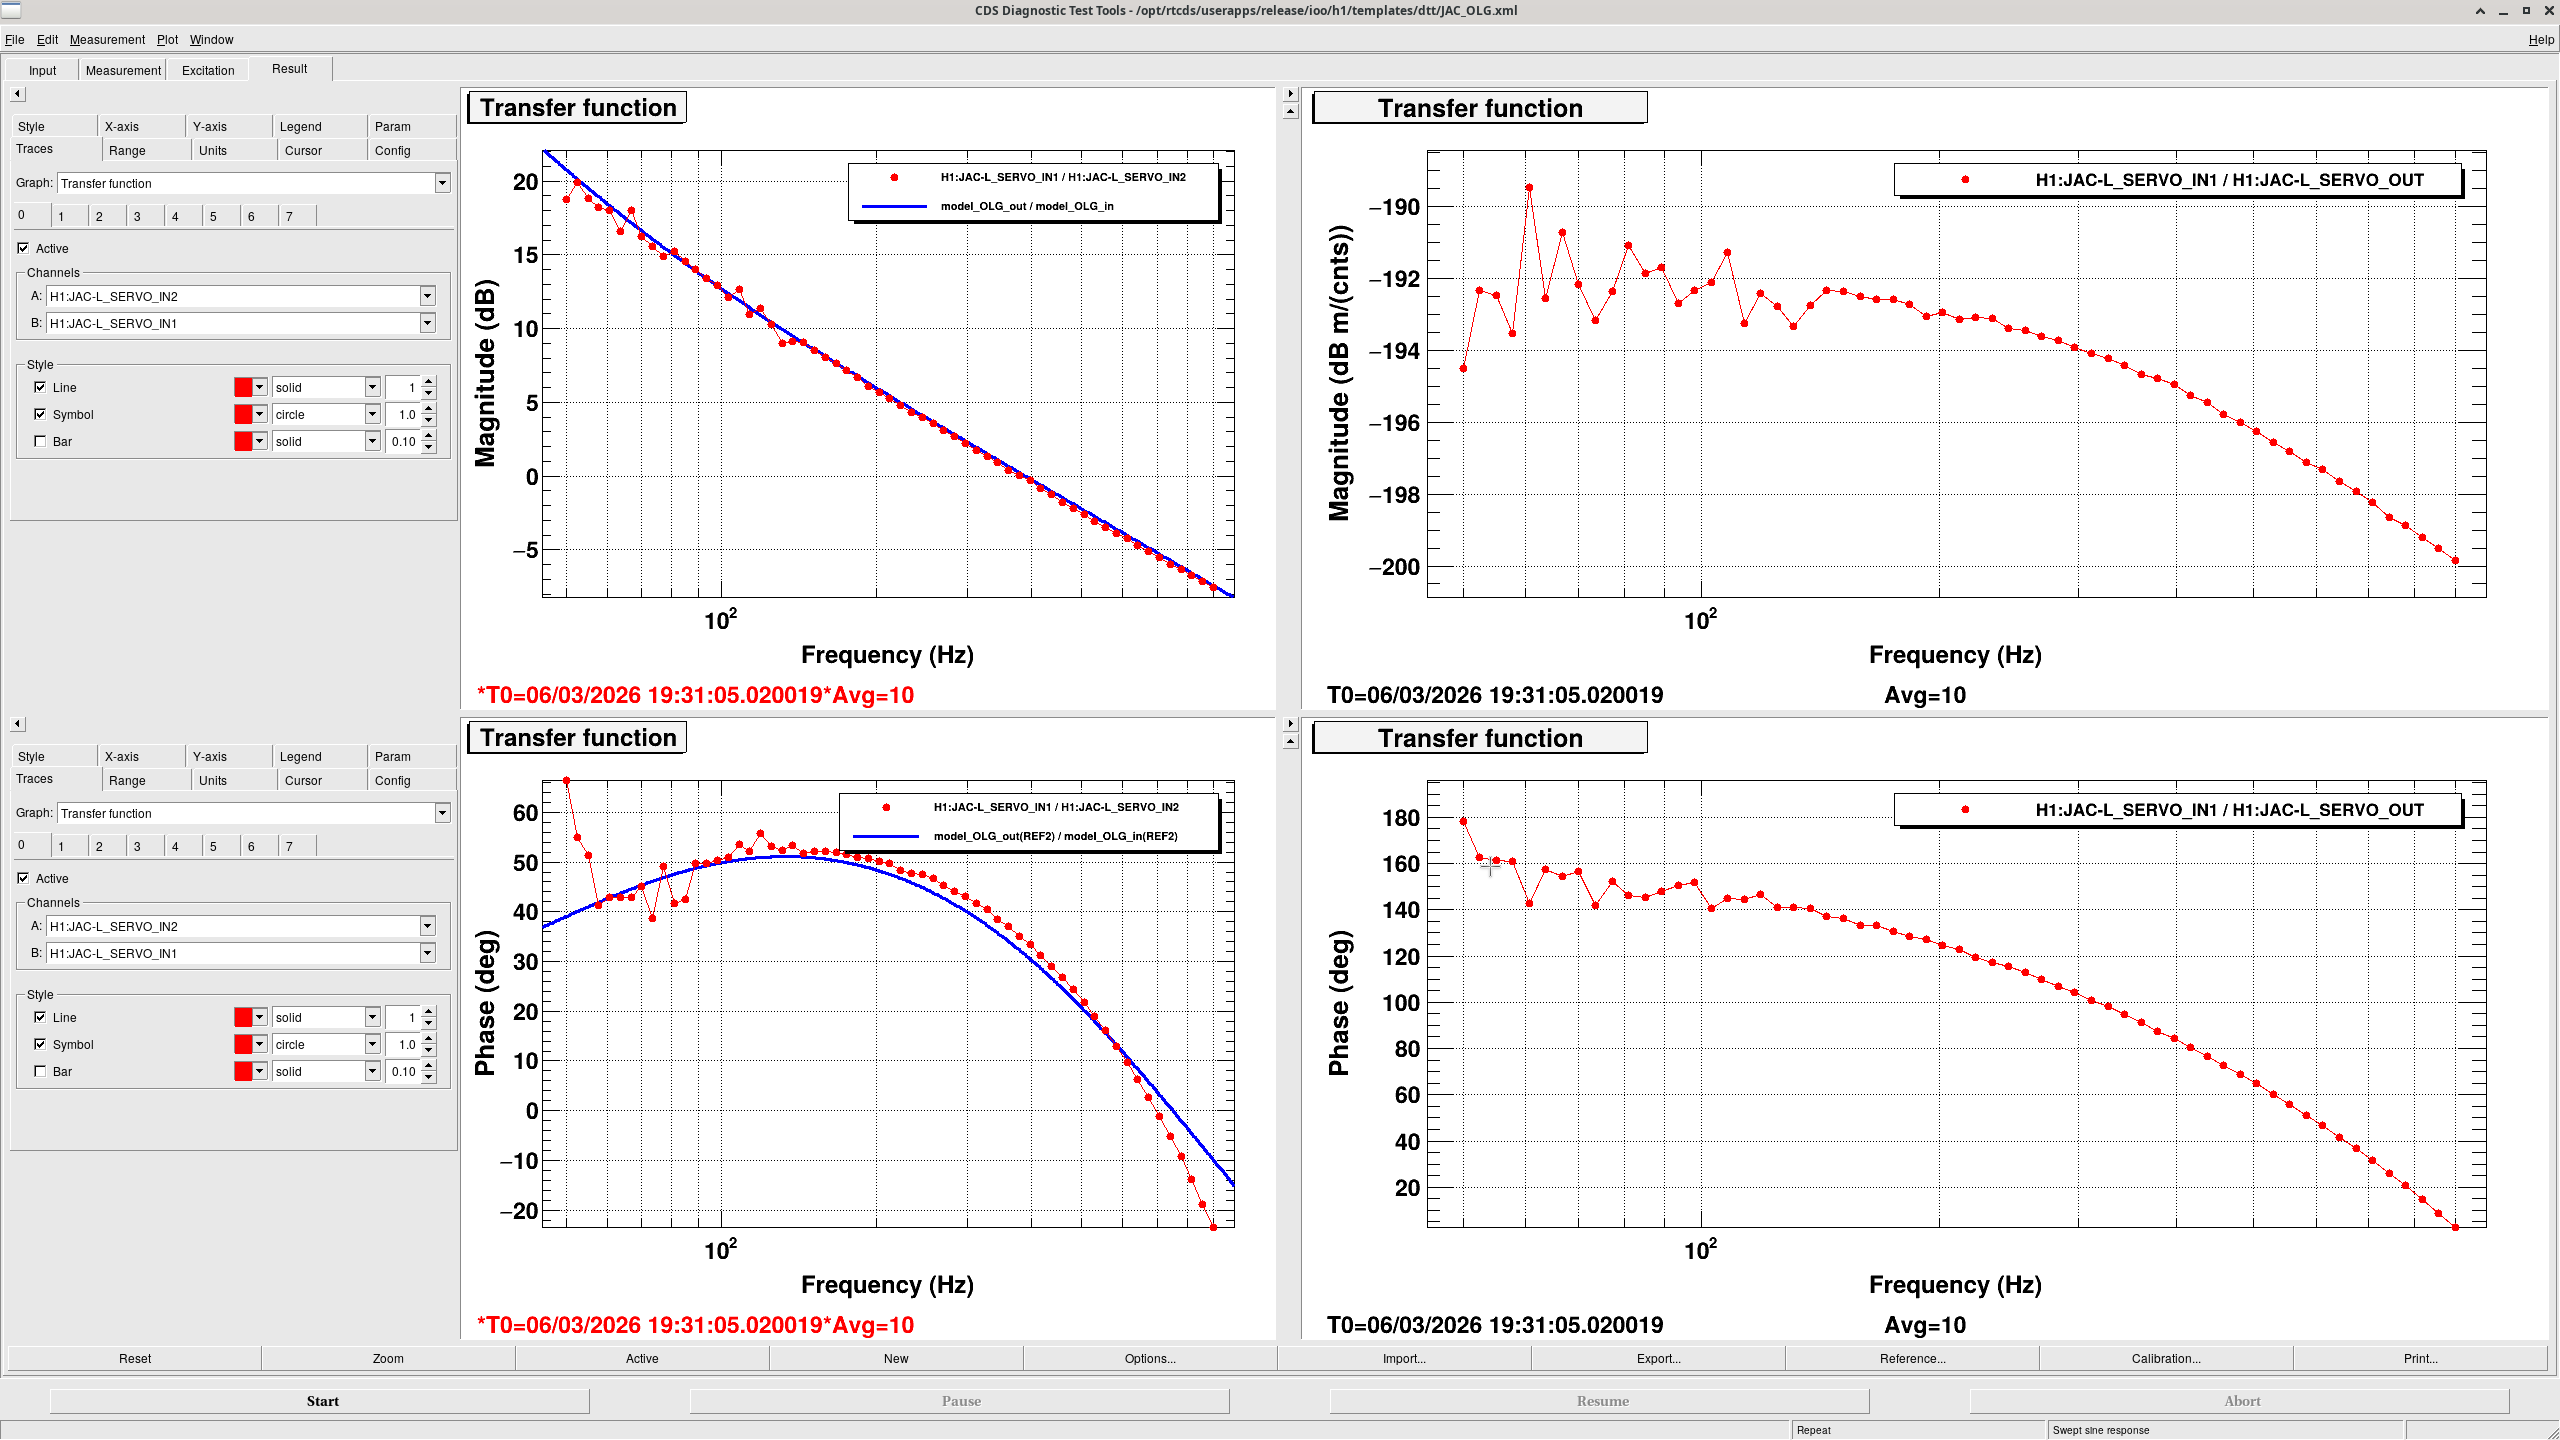
The JAC length servo was designed to set the unity gain frequency (UGF) at 400 Hz. Additional low-frequency boost was implemented to improve suppression below 50 Hz. The open loop gain (OLG) was measured and compared with the servo model.
Details
PZT actuator compensation
The PZT driver has poles at 1 Hz and 400 Hz, and a zero at 10 Hz.
To compensate for this response, a zpk(400, 10, 40) filter was implemented in the servo.
With this compensation, the actuator response becomes approximately a first-order low-pass with a cutoff frequency of 1 Hz.
Unity gain frequency
The servo gain was then set so that the unity gain frequency (UGF) is 400 Hz.
The phase margin at 400 Hz is 37 degrees, which includes the phase contribution from the first-order low-pass (90 degrees) and the additional phase delay in the system.
Low-frequency boost
A 1–50 Hz boost filter (first-order pole-zero boost filter) was implemented to improve low-frequency suppression.
The phase contribution of this filter is –7 degrees at 400 Hz, resulting in a total phase margin of about 30 degrees at the UGF.
Also, the integrater was implemented below 1Hz. Combination between boost and integrator gives f^{-2} slope below 50Hz.
Open Loop Gain measurement
The open loop gain (OLG) has been measured. A comparison between the measured OLG and the model is shown in the attached plot in the left panel. The right panel is the TF of the PZT.
MEDM interface
The OLG measurement template can be opened from the spectrum/OLG button in the bottom-right corner of the MEDM screen.
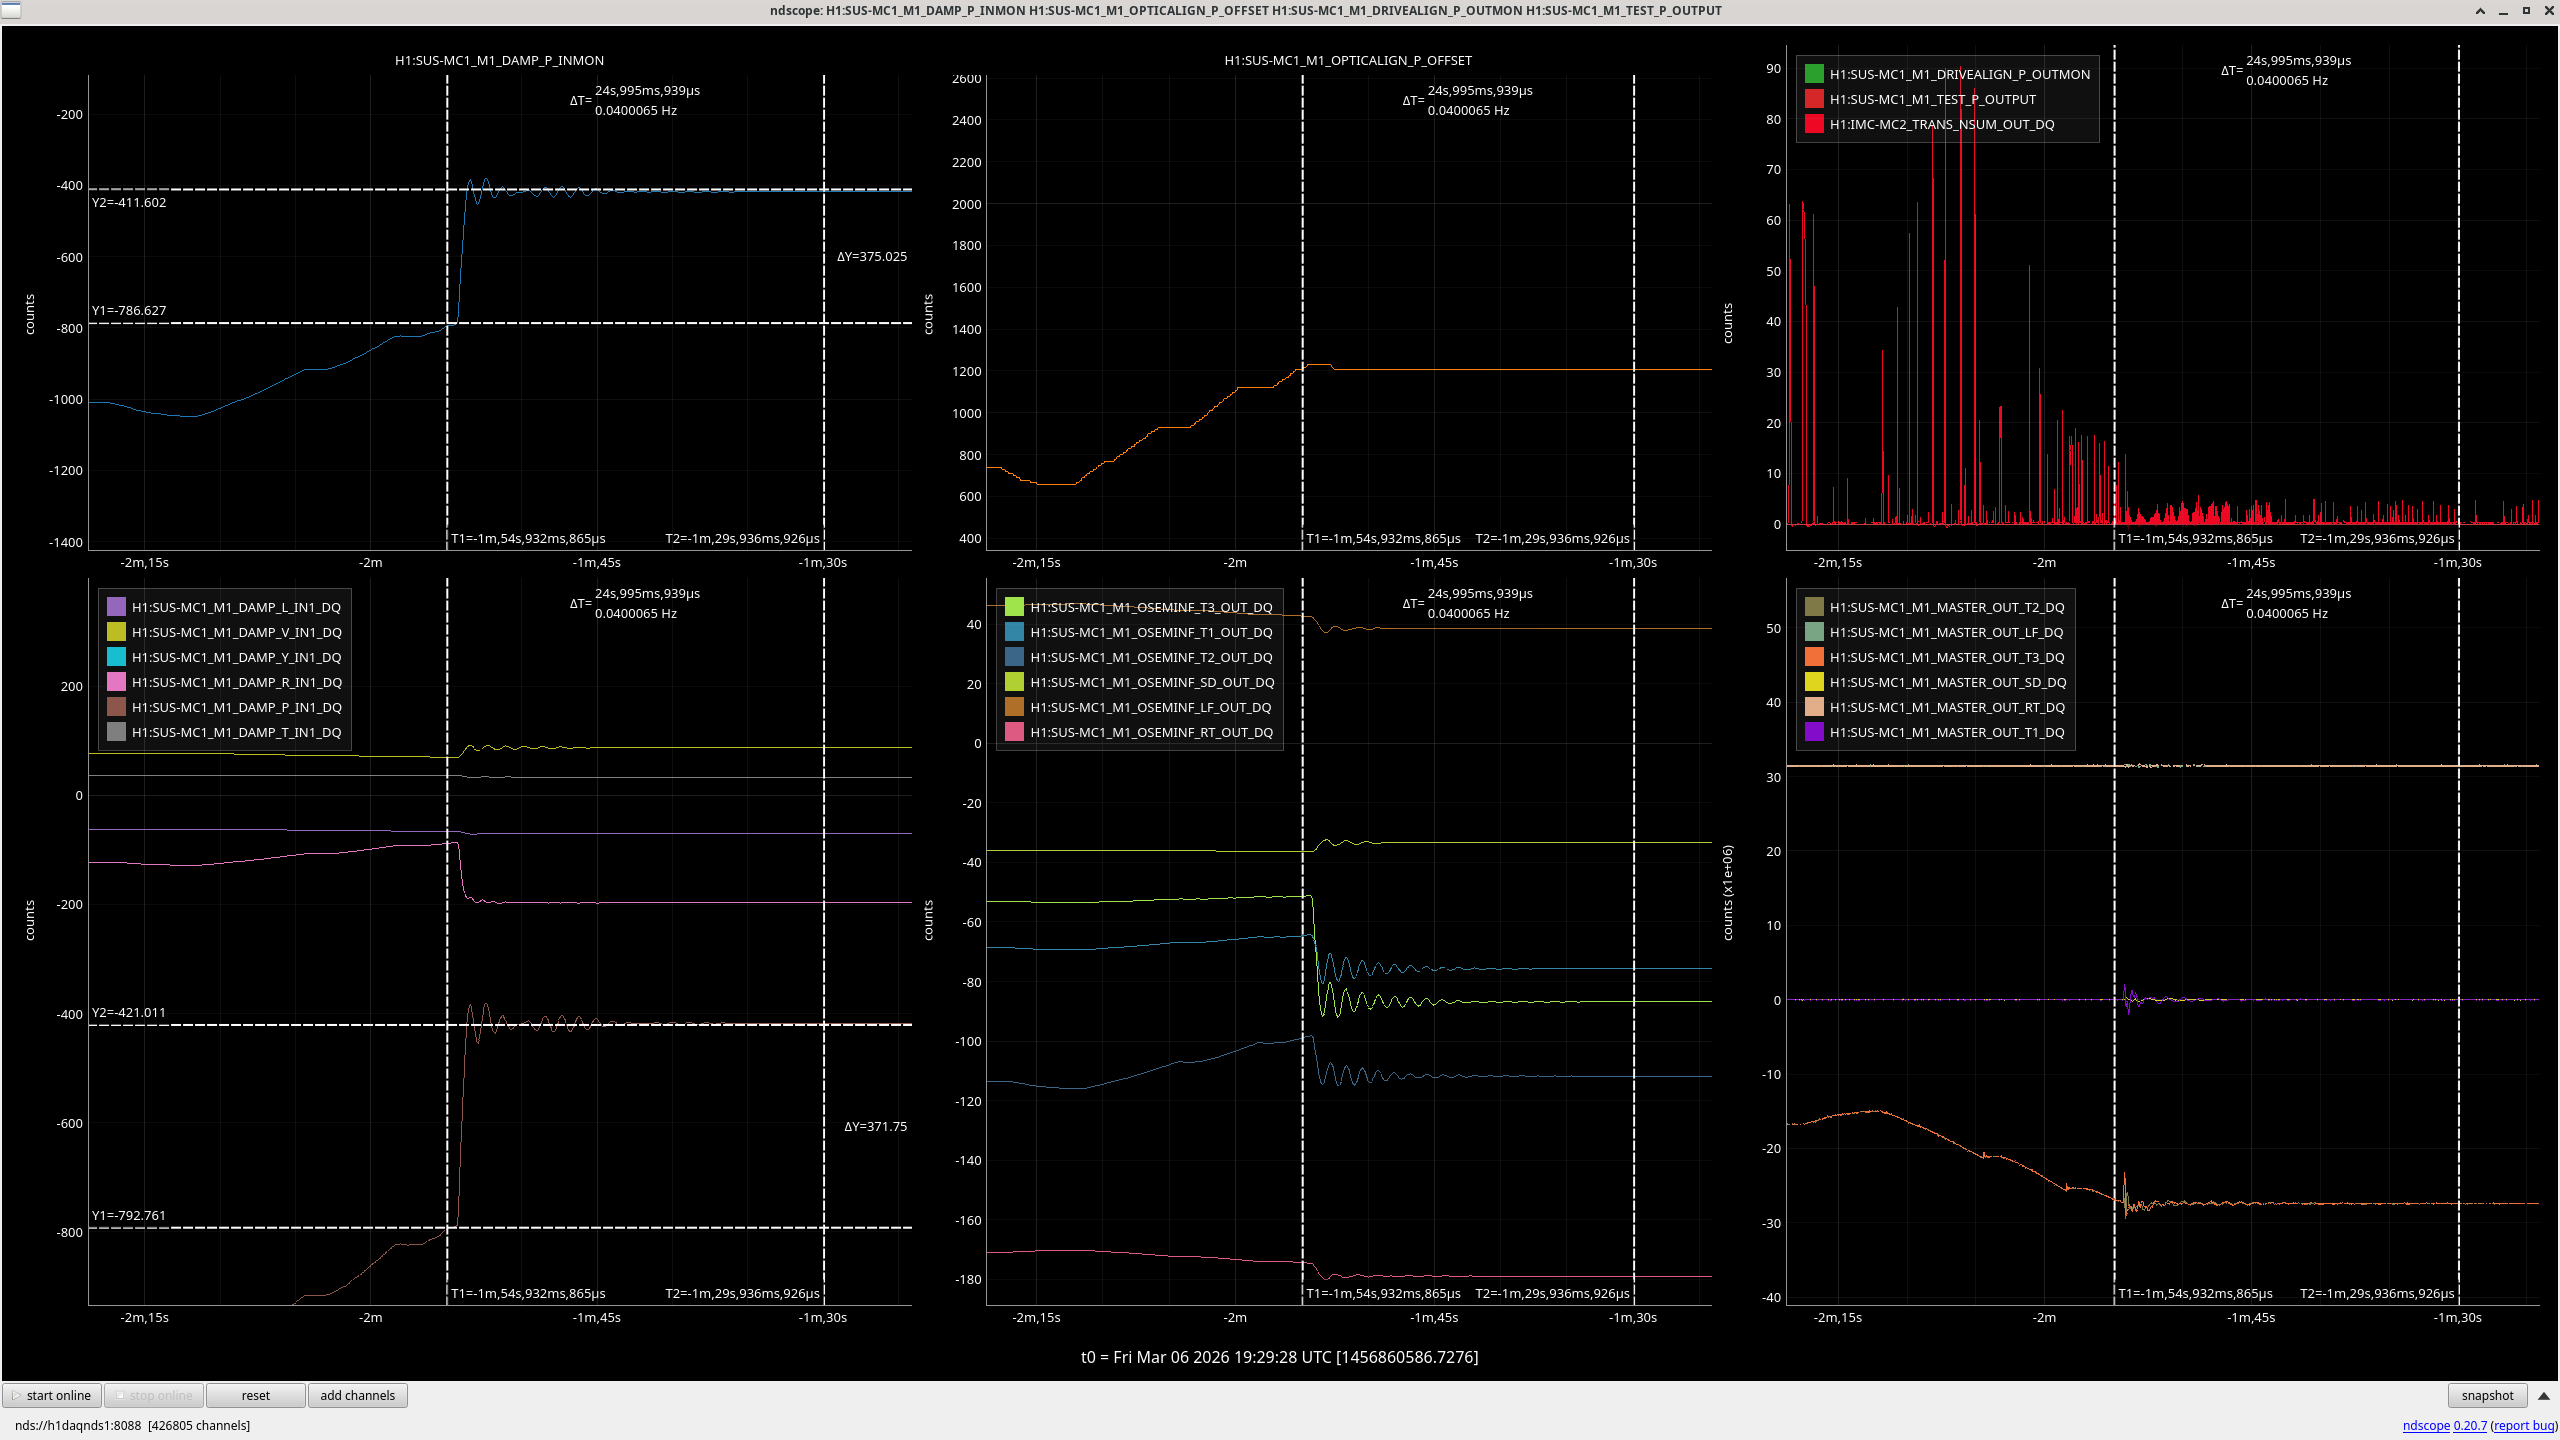
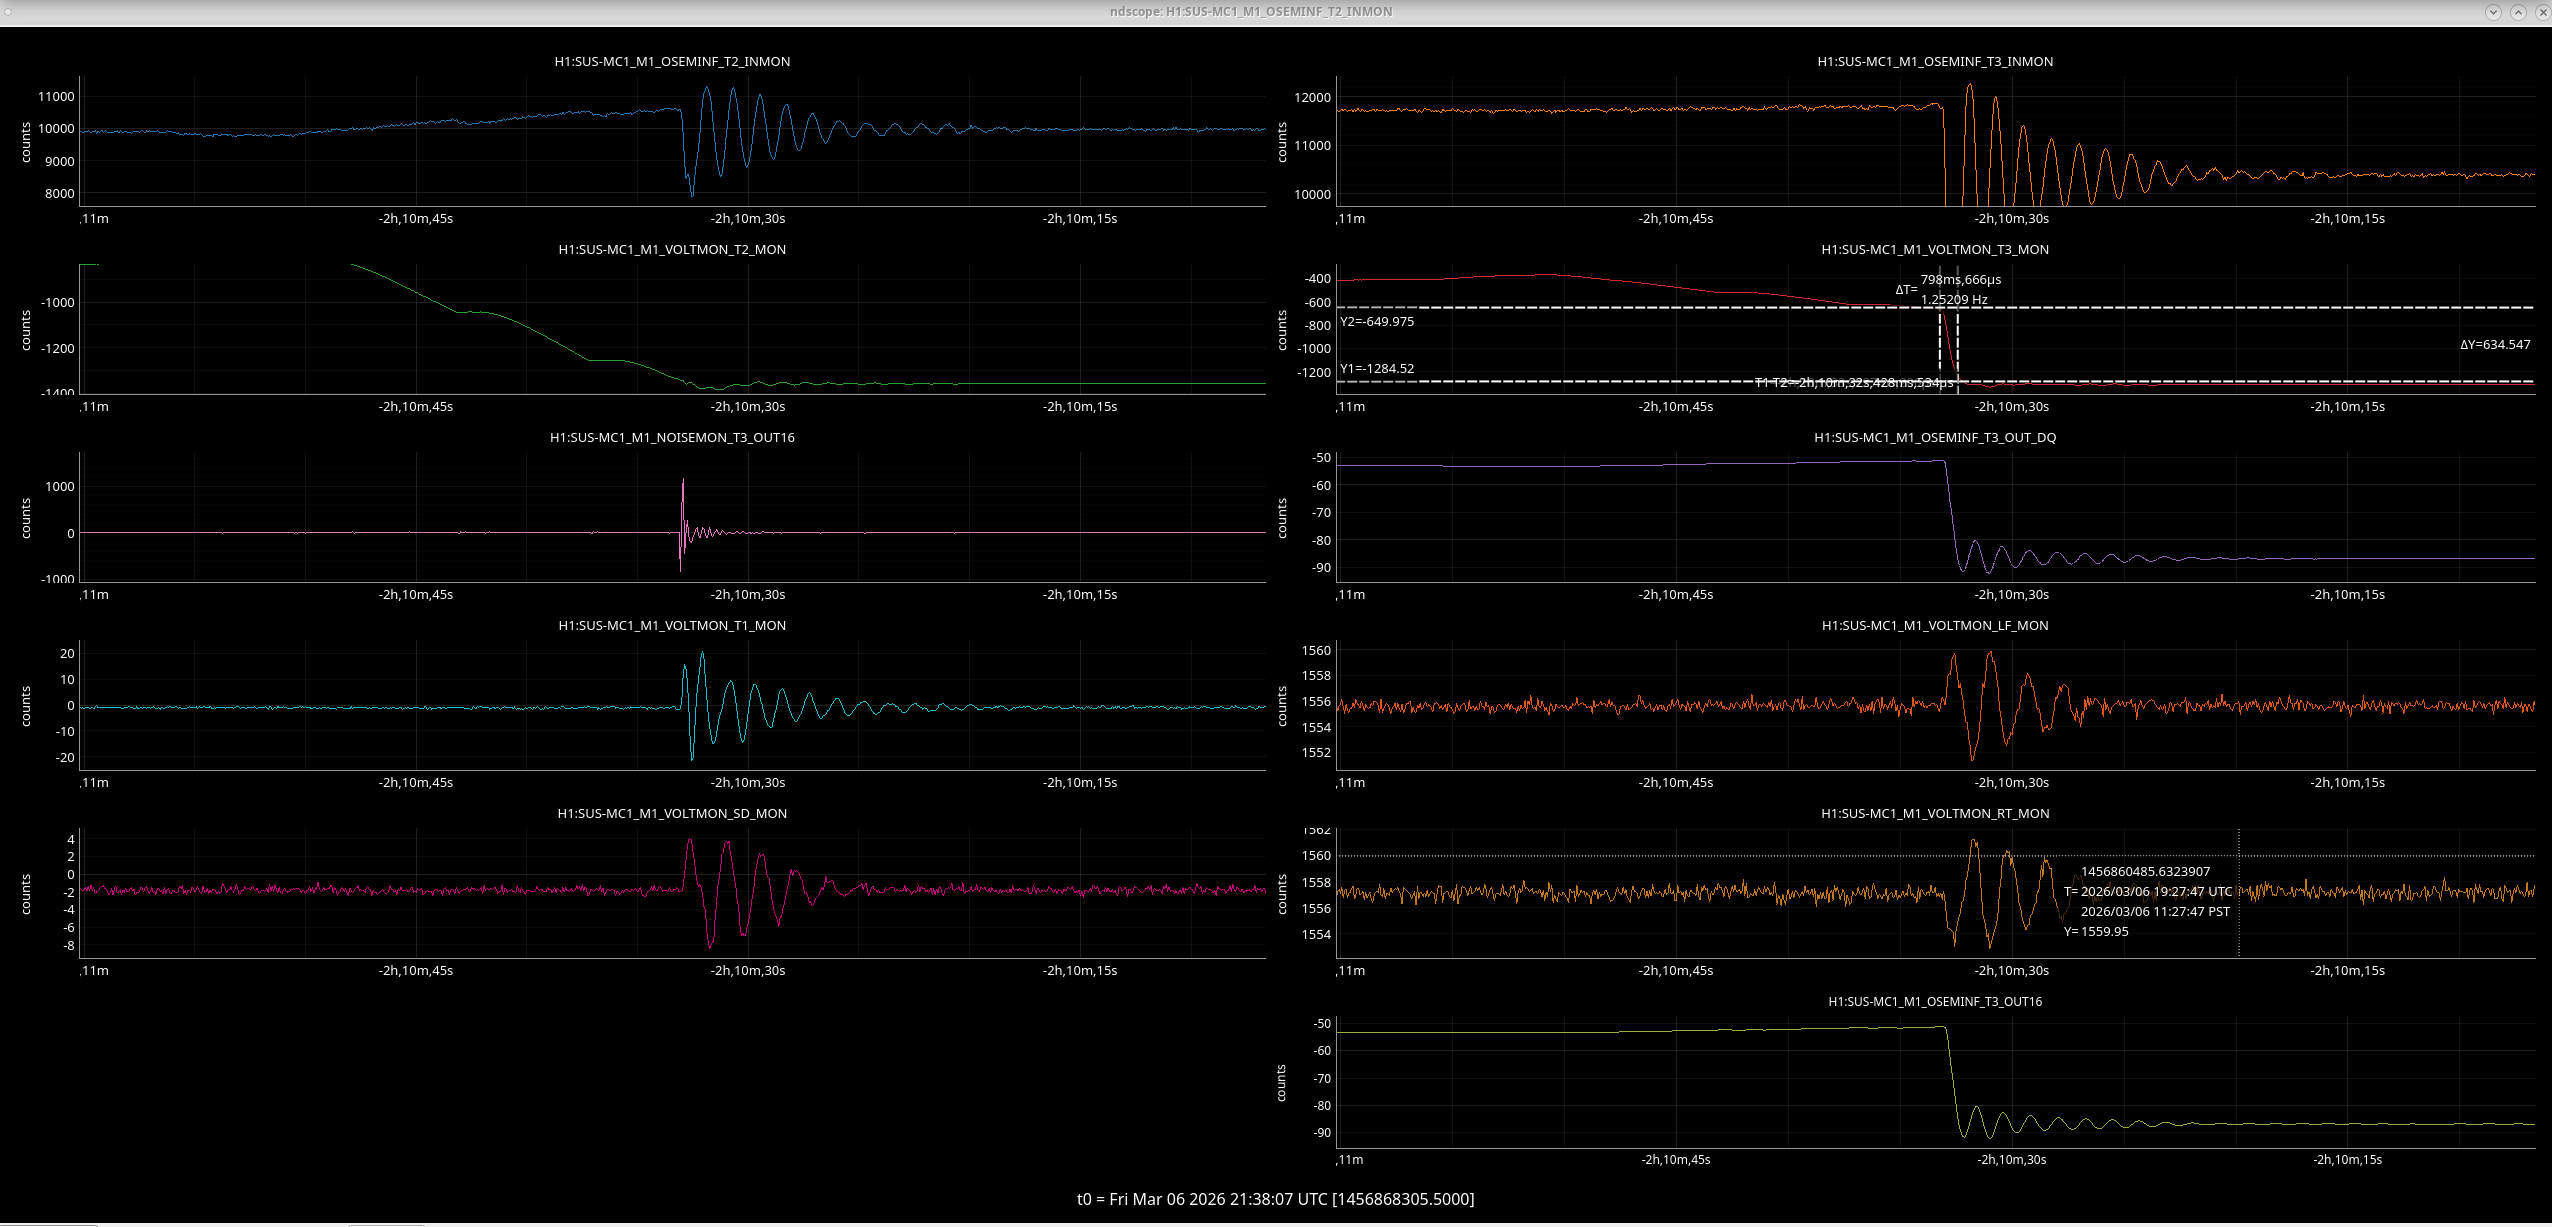
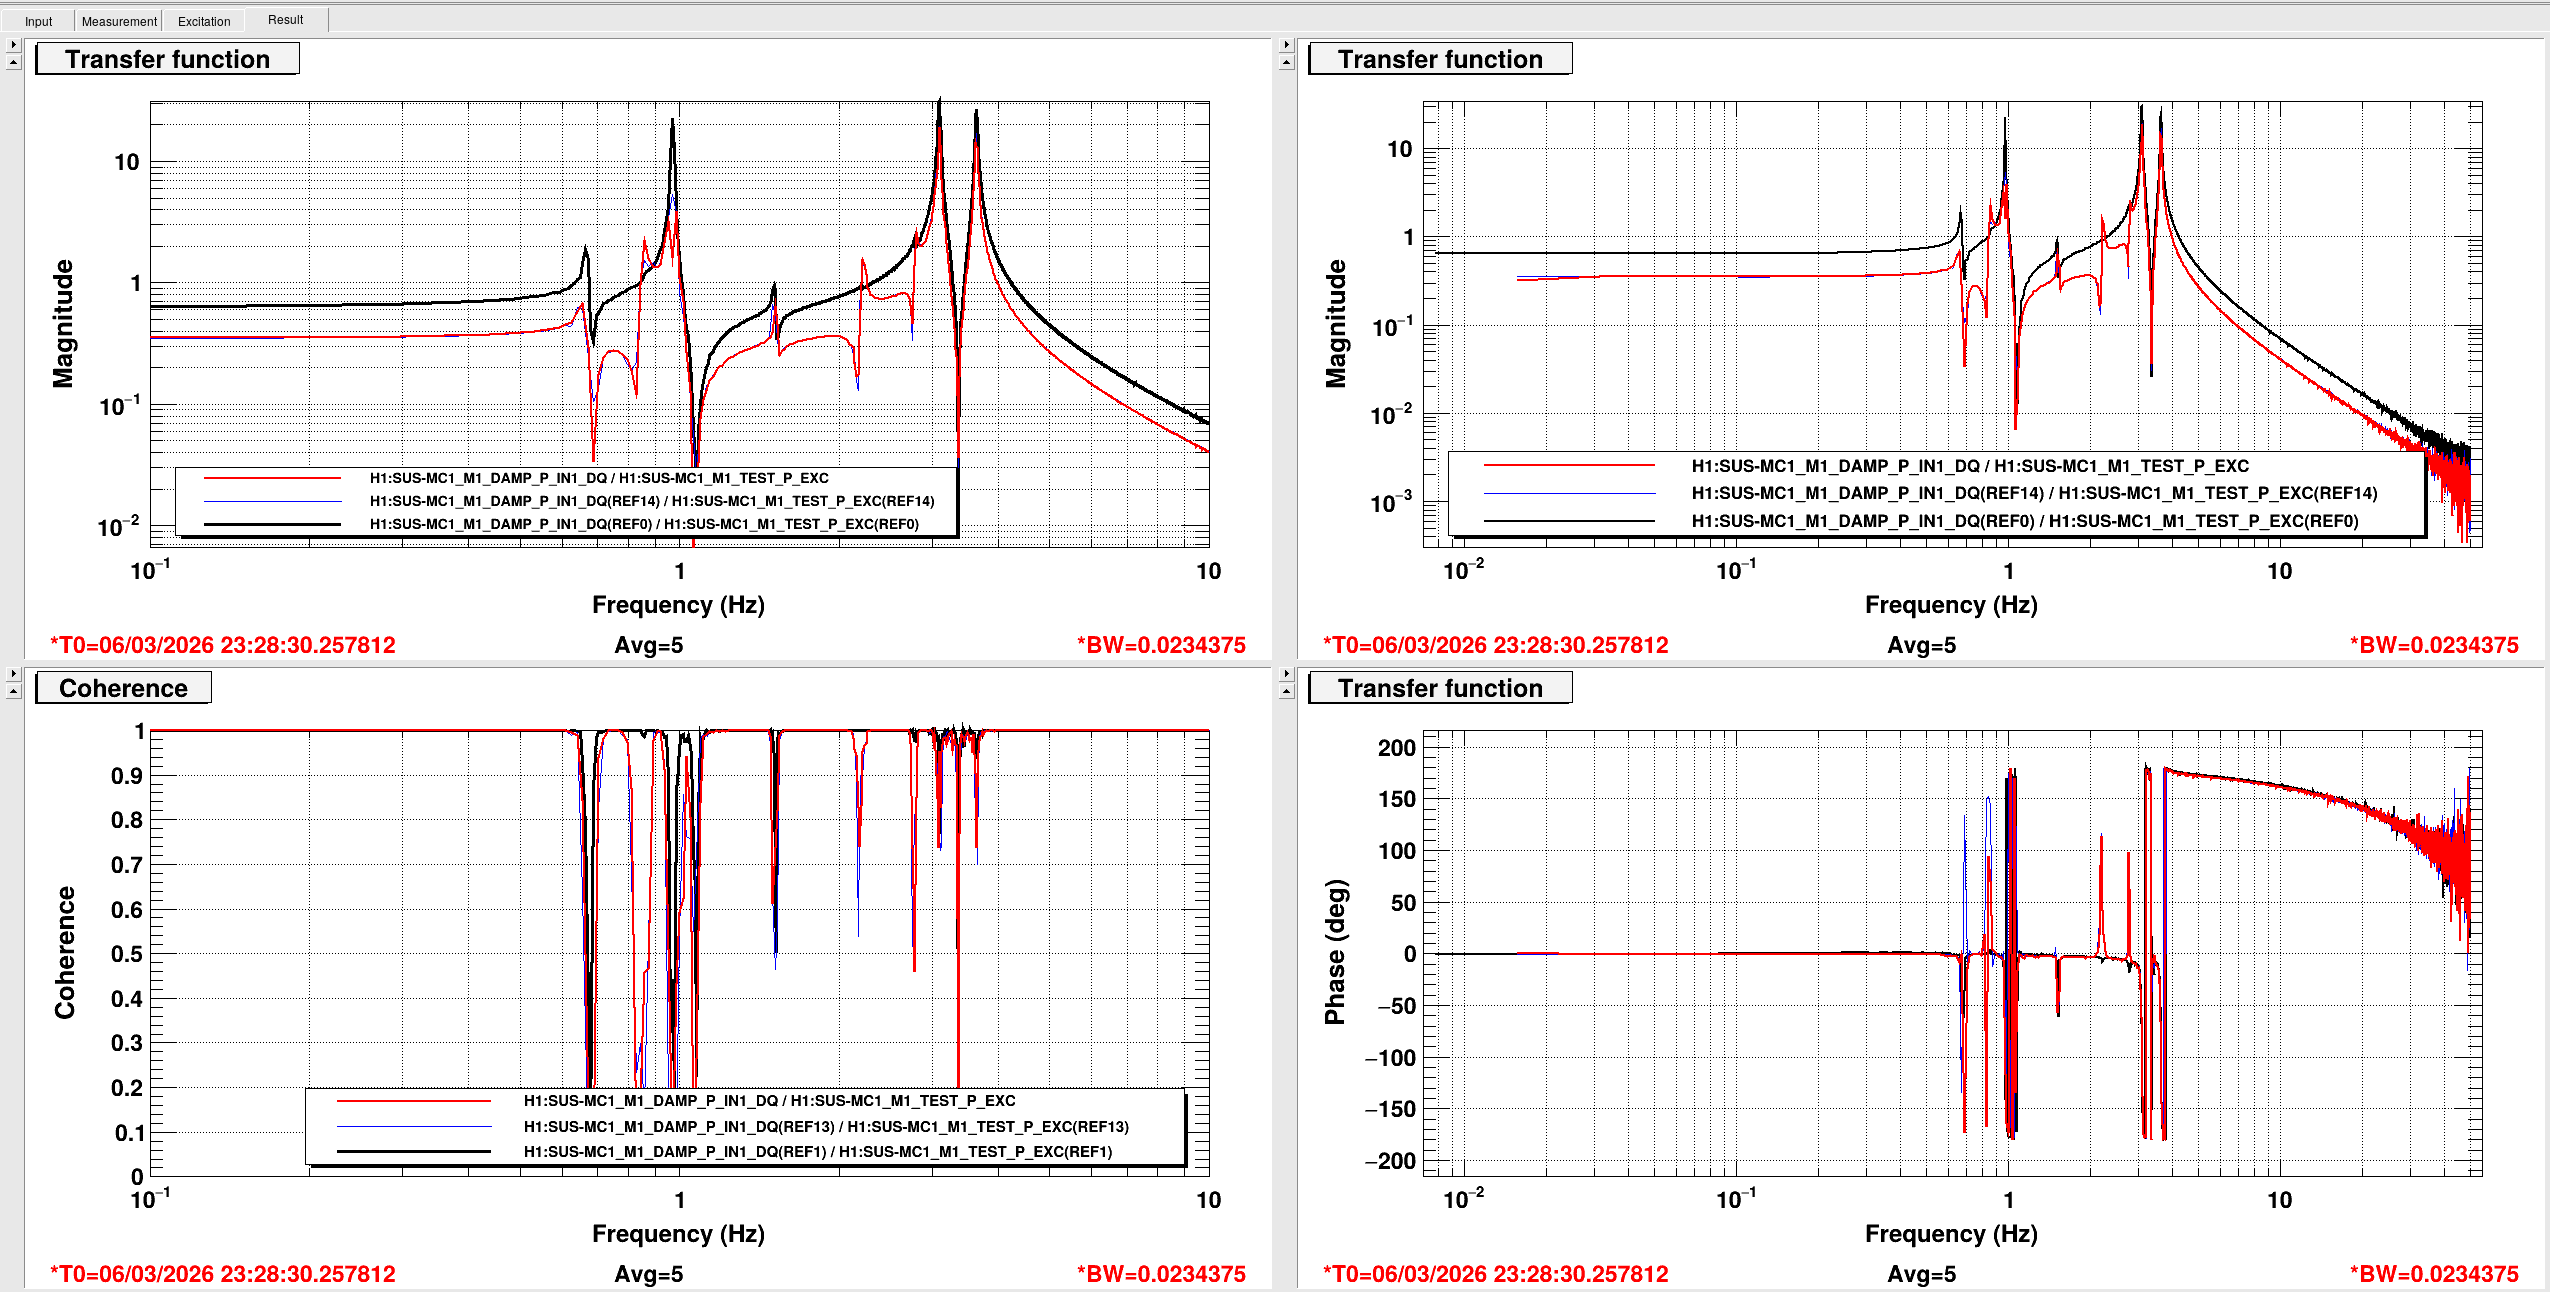
I was adjusting the alignment of MC1 pitch earlier, when the suspension had a large alignment shift that wasn't caused by a change in the requested drive to the DACs. The attached screenshot shows my requested alignment shifts in opticalign, and the resulting change in the requested DAC counts on T2 + T3. There is a sudden 420 urad jump in the osem readbacks from pitch, and a 133 urad jump in roll at the first time cursor. The master outs only see a few cycles on oscillations, which probably is from the damping loops responding to the jump, but they settle to the same requested drive as before the jump. The jump seems to be real as the IMC flashes disappeared at this time.
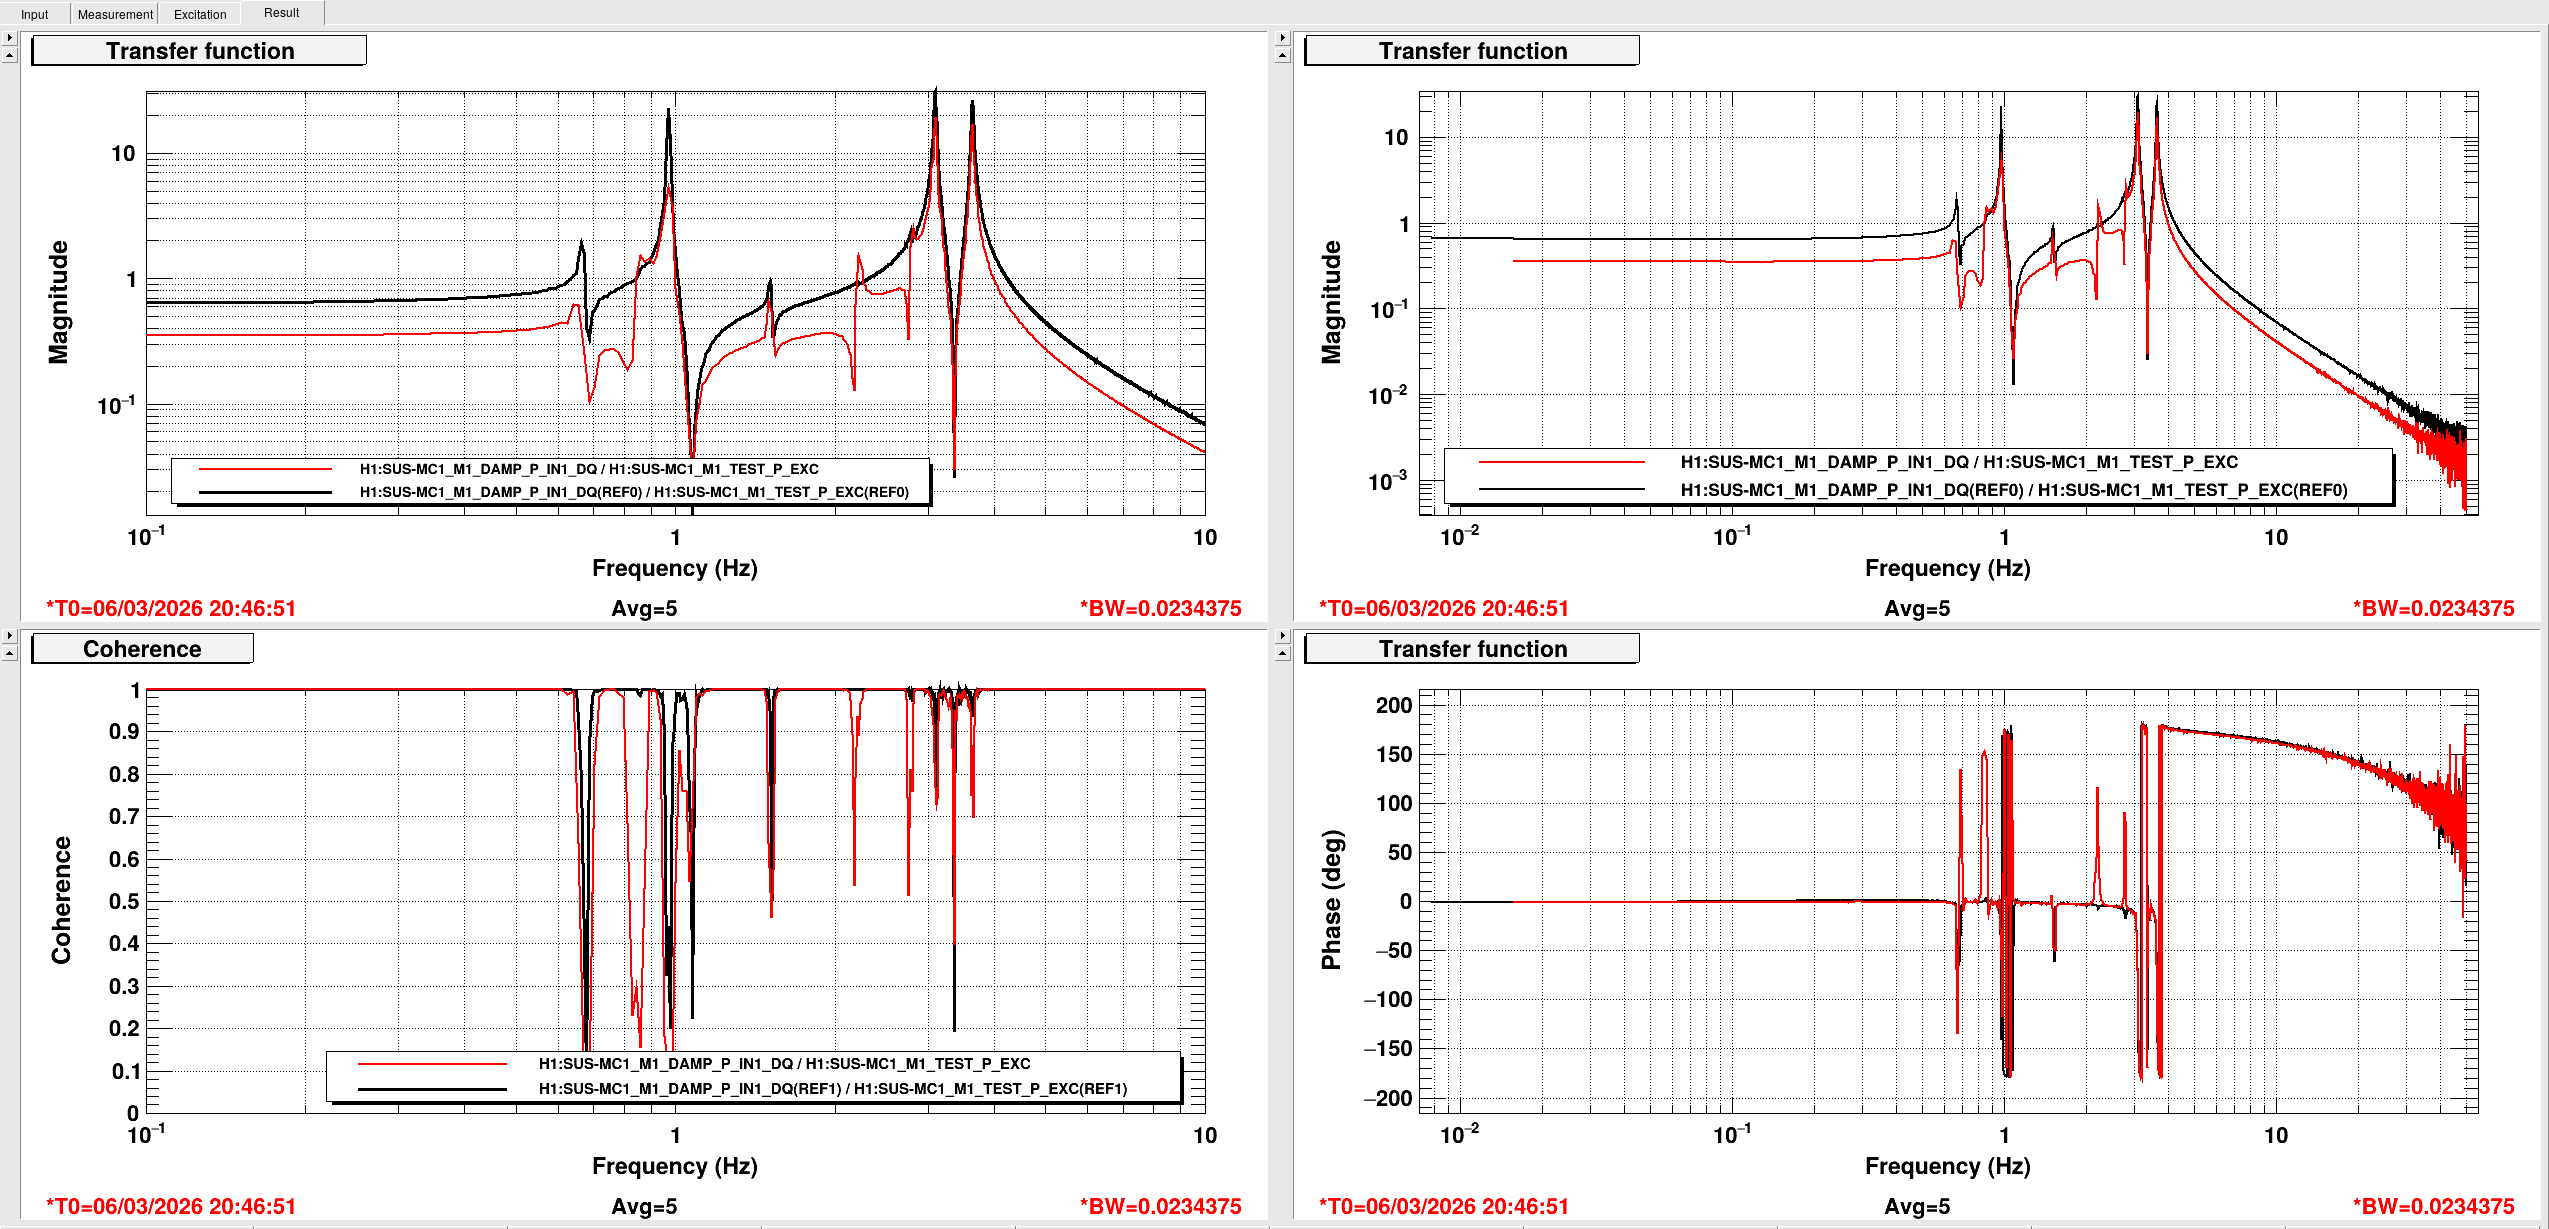
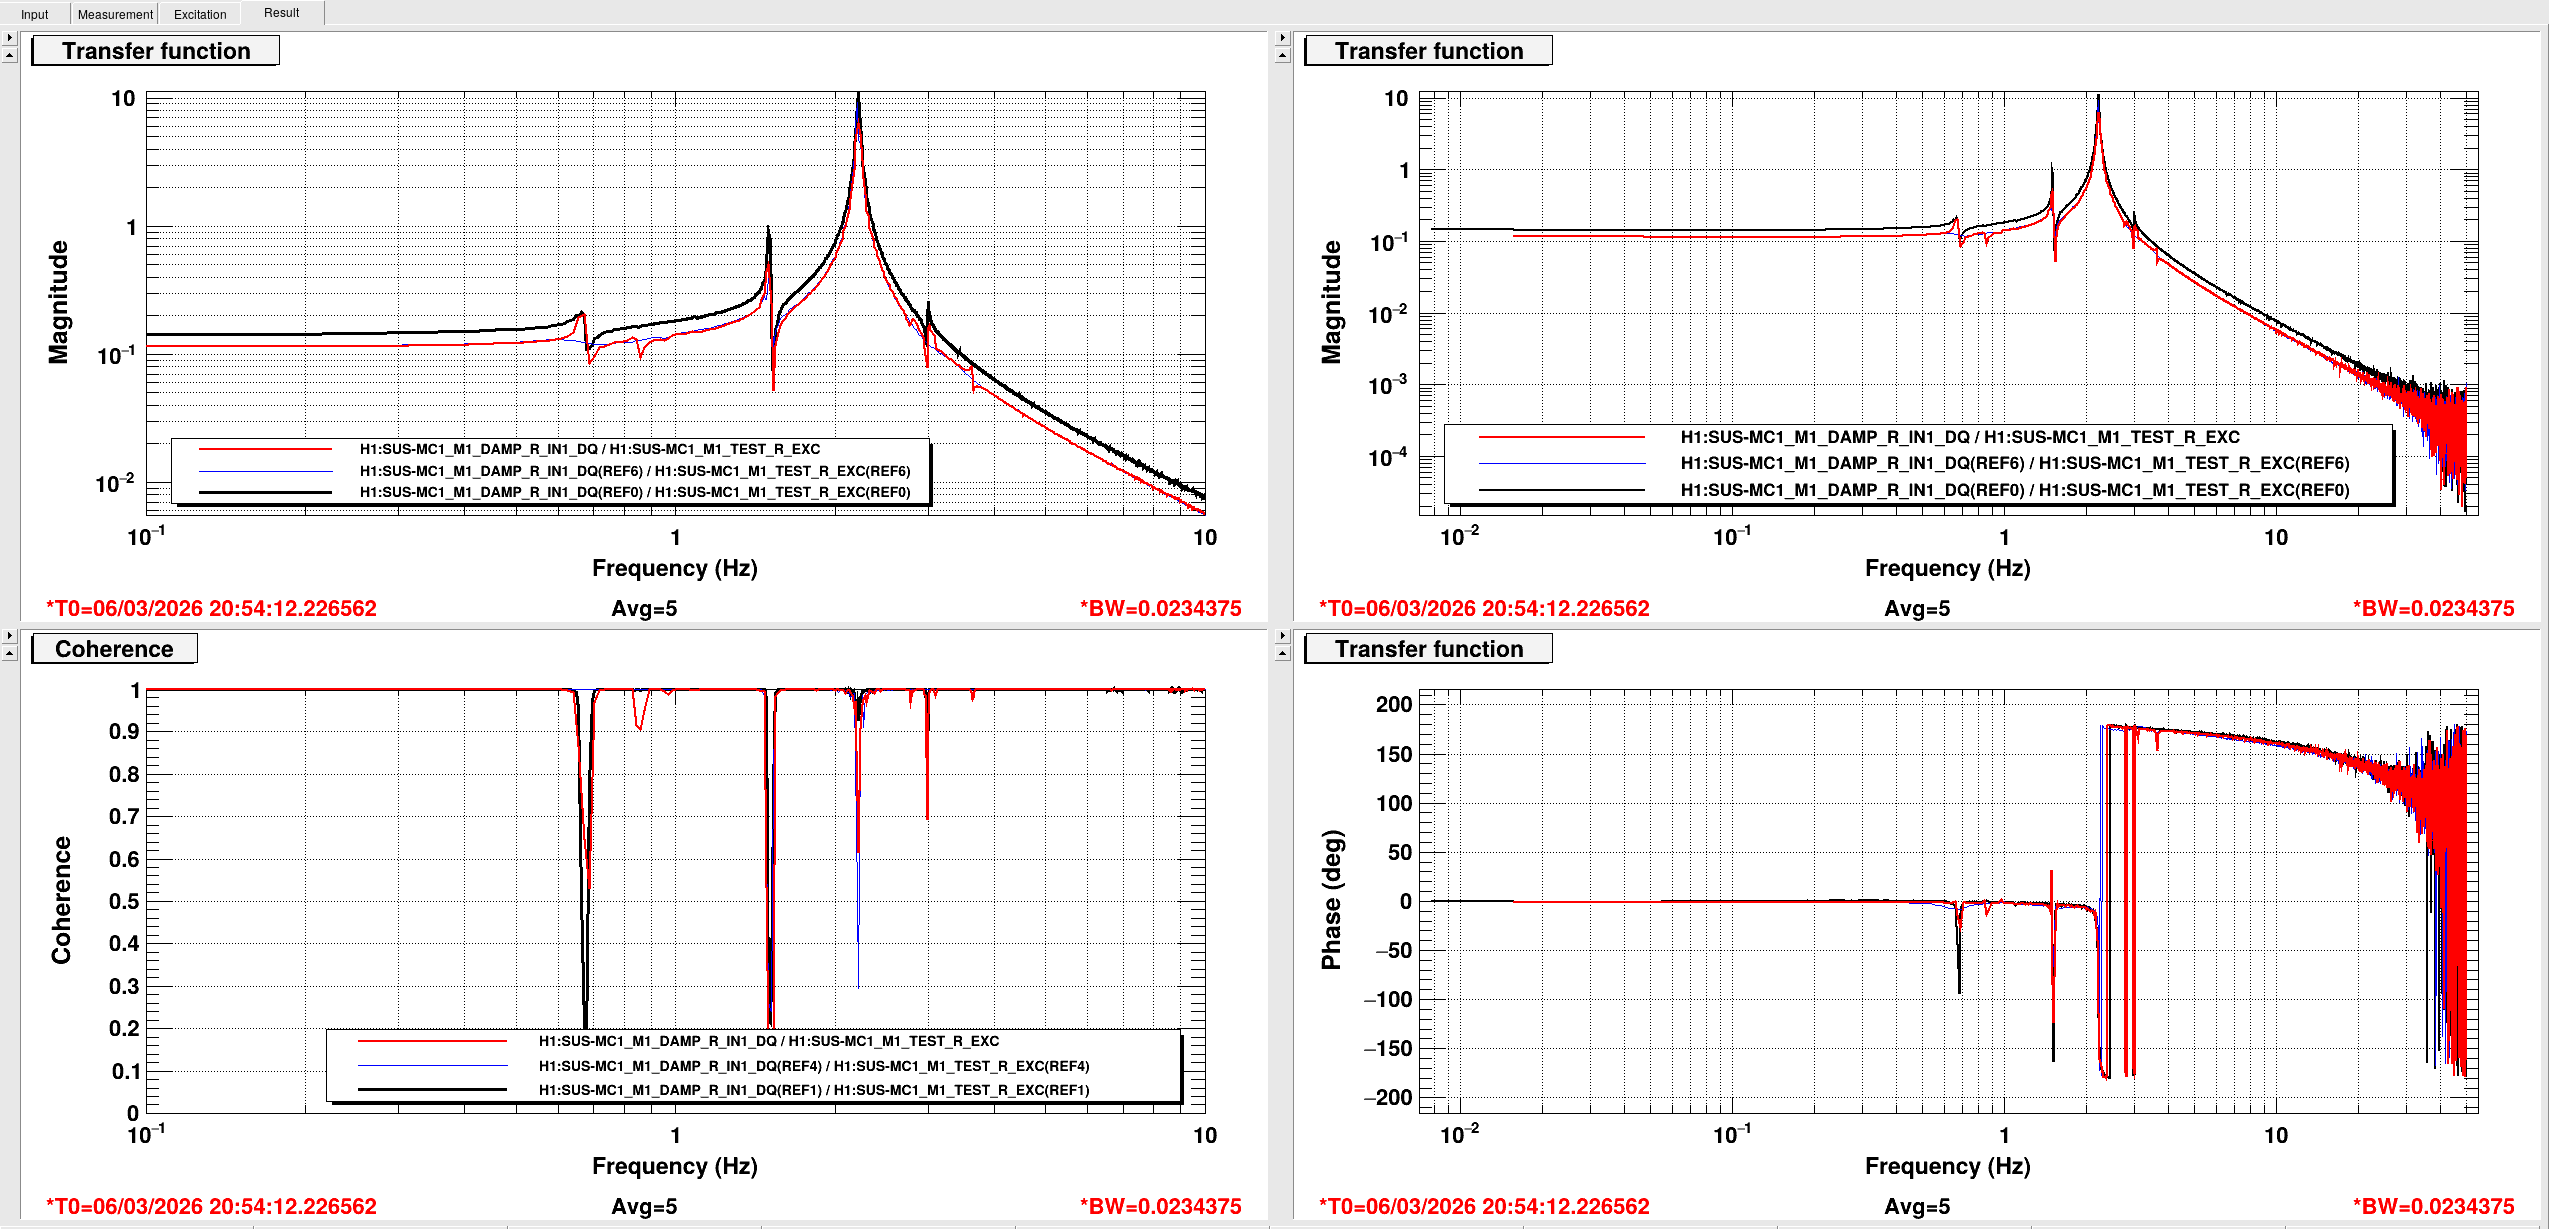
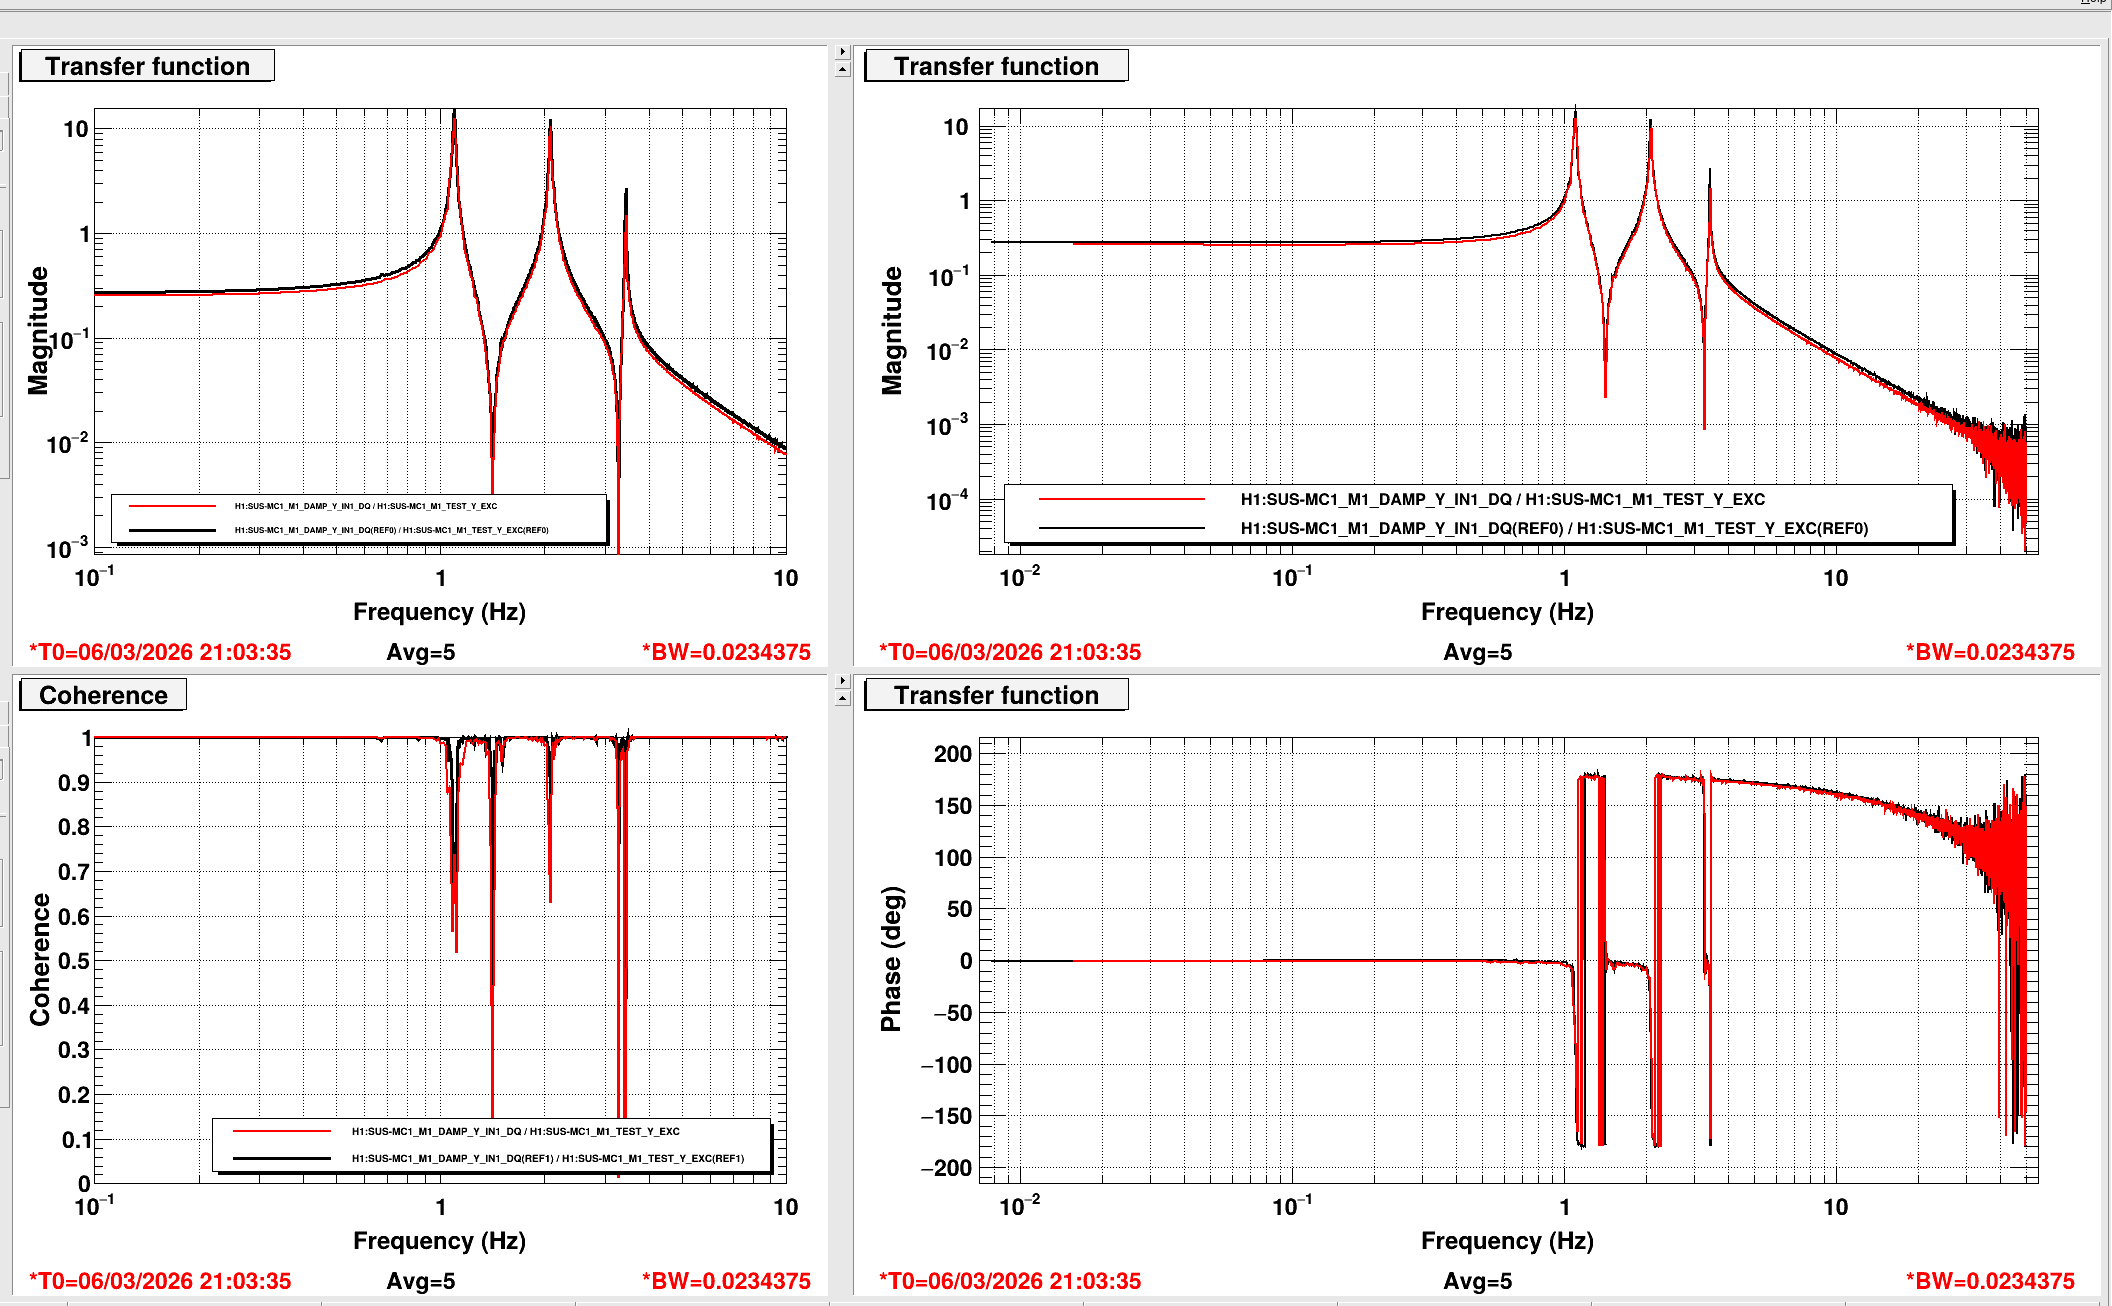
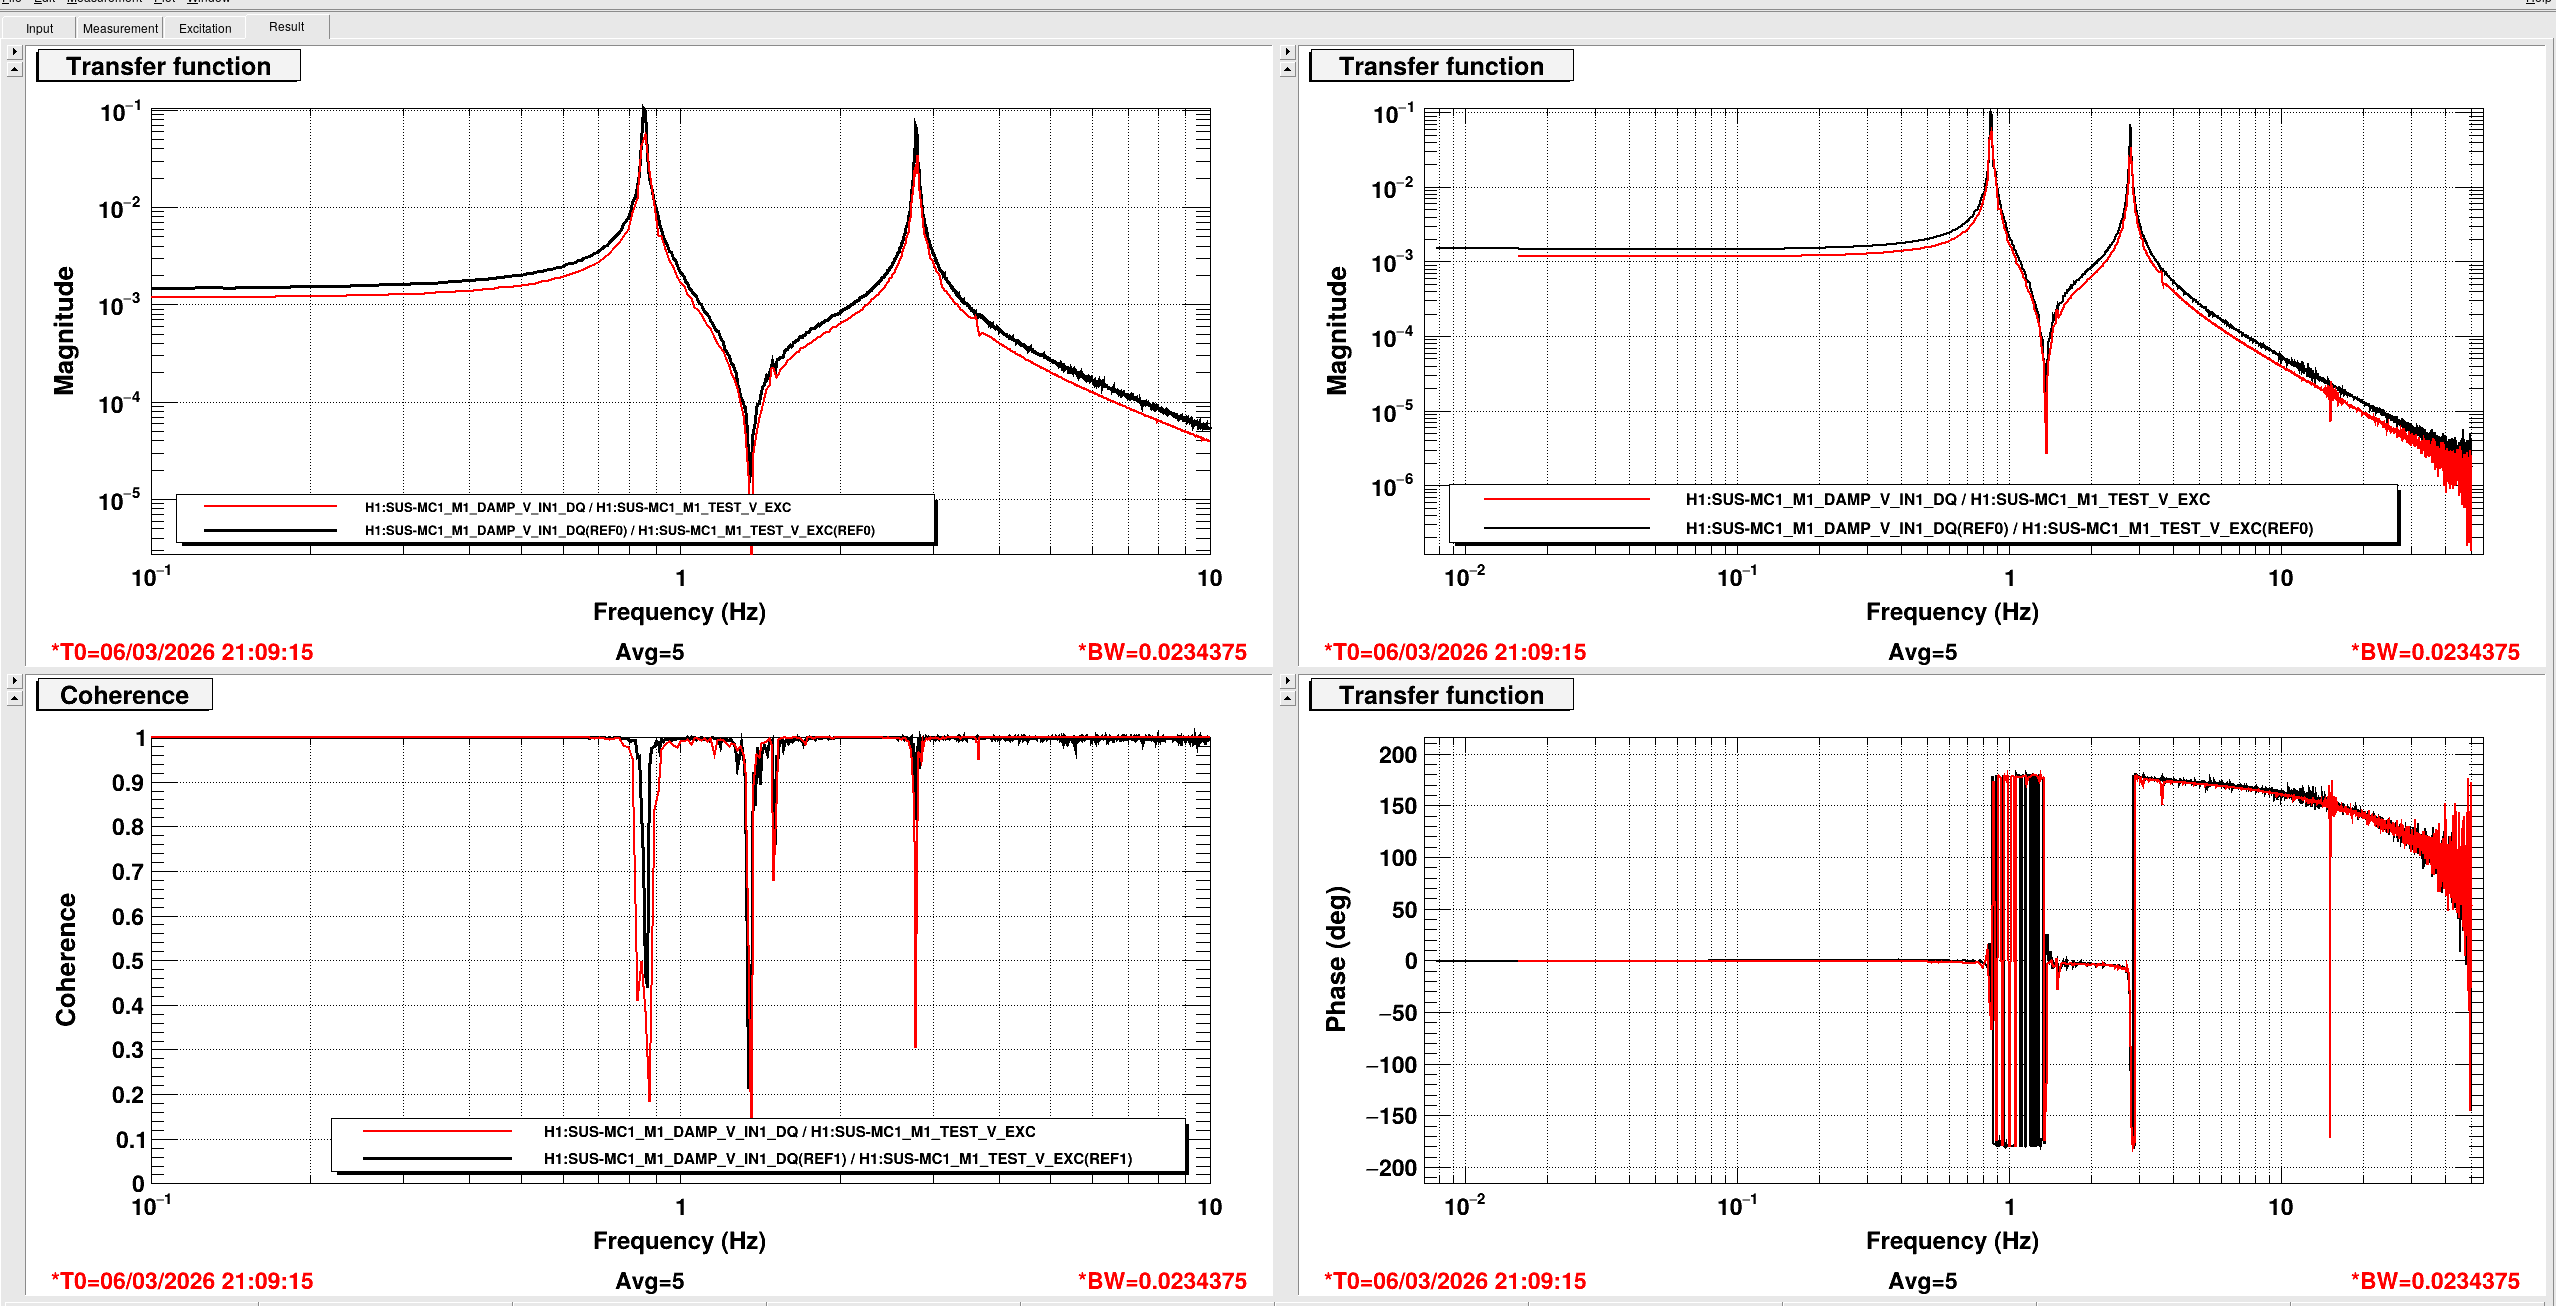
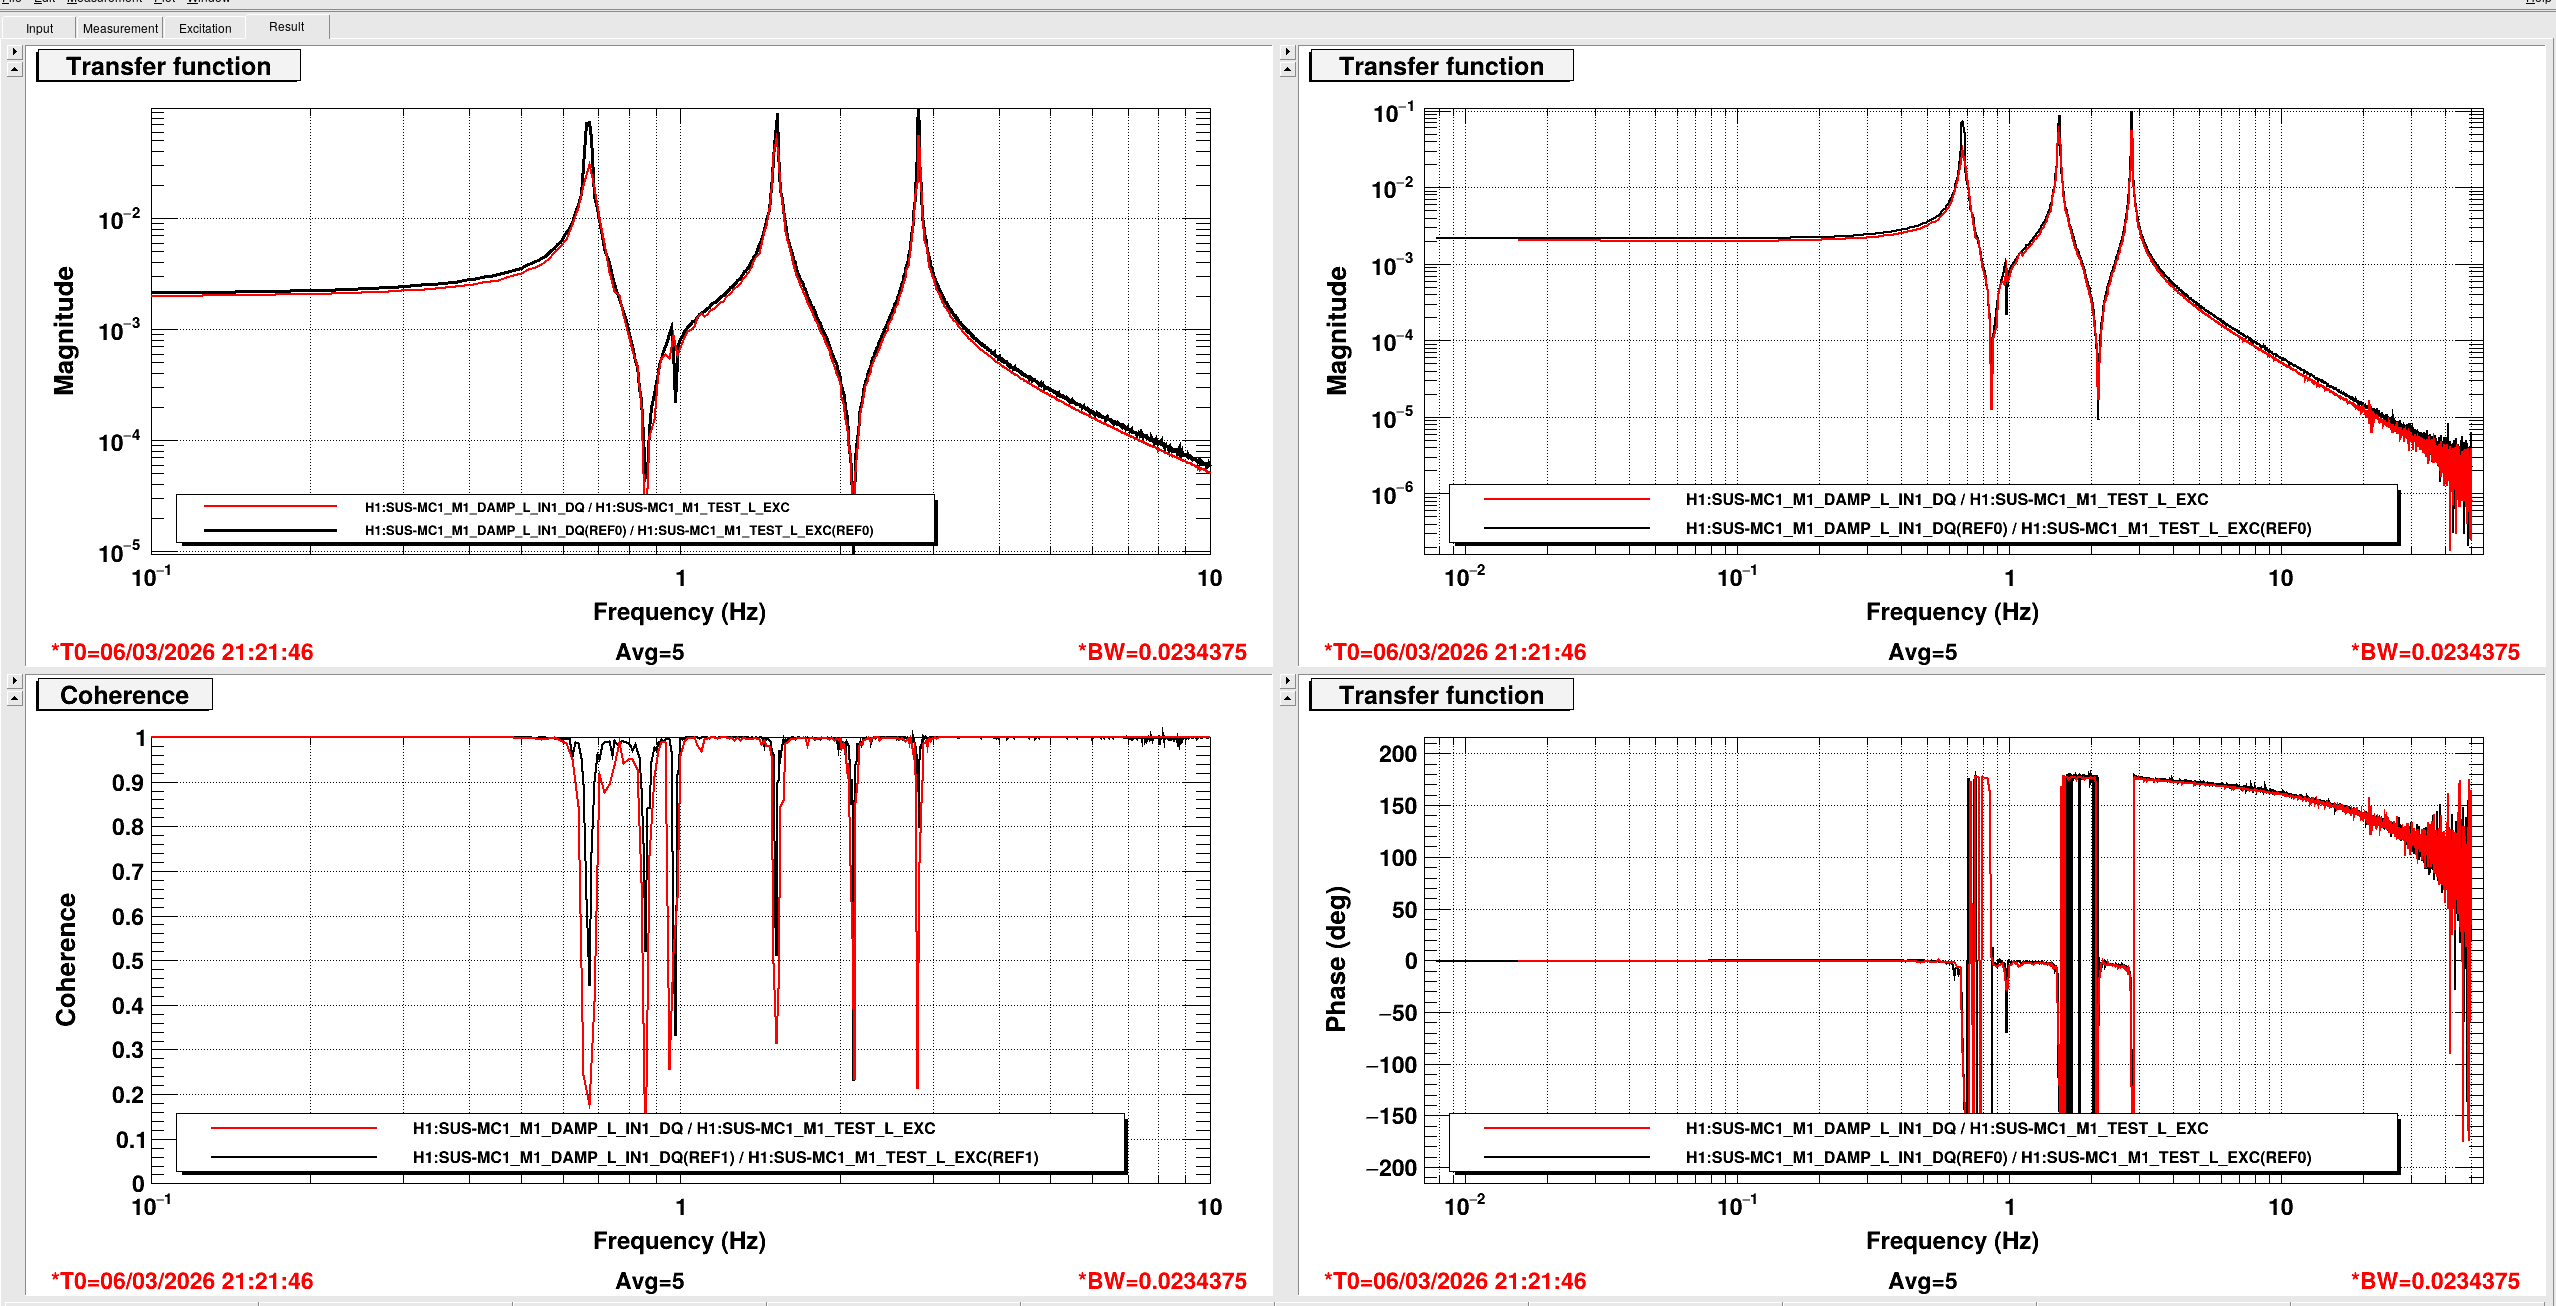
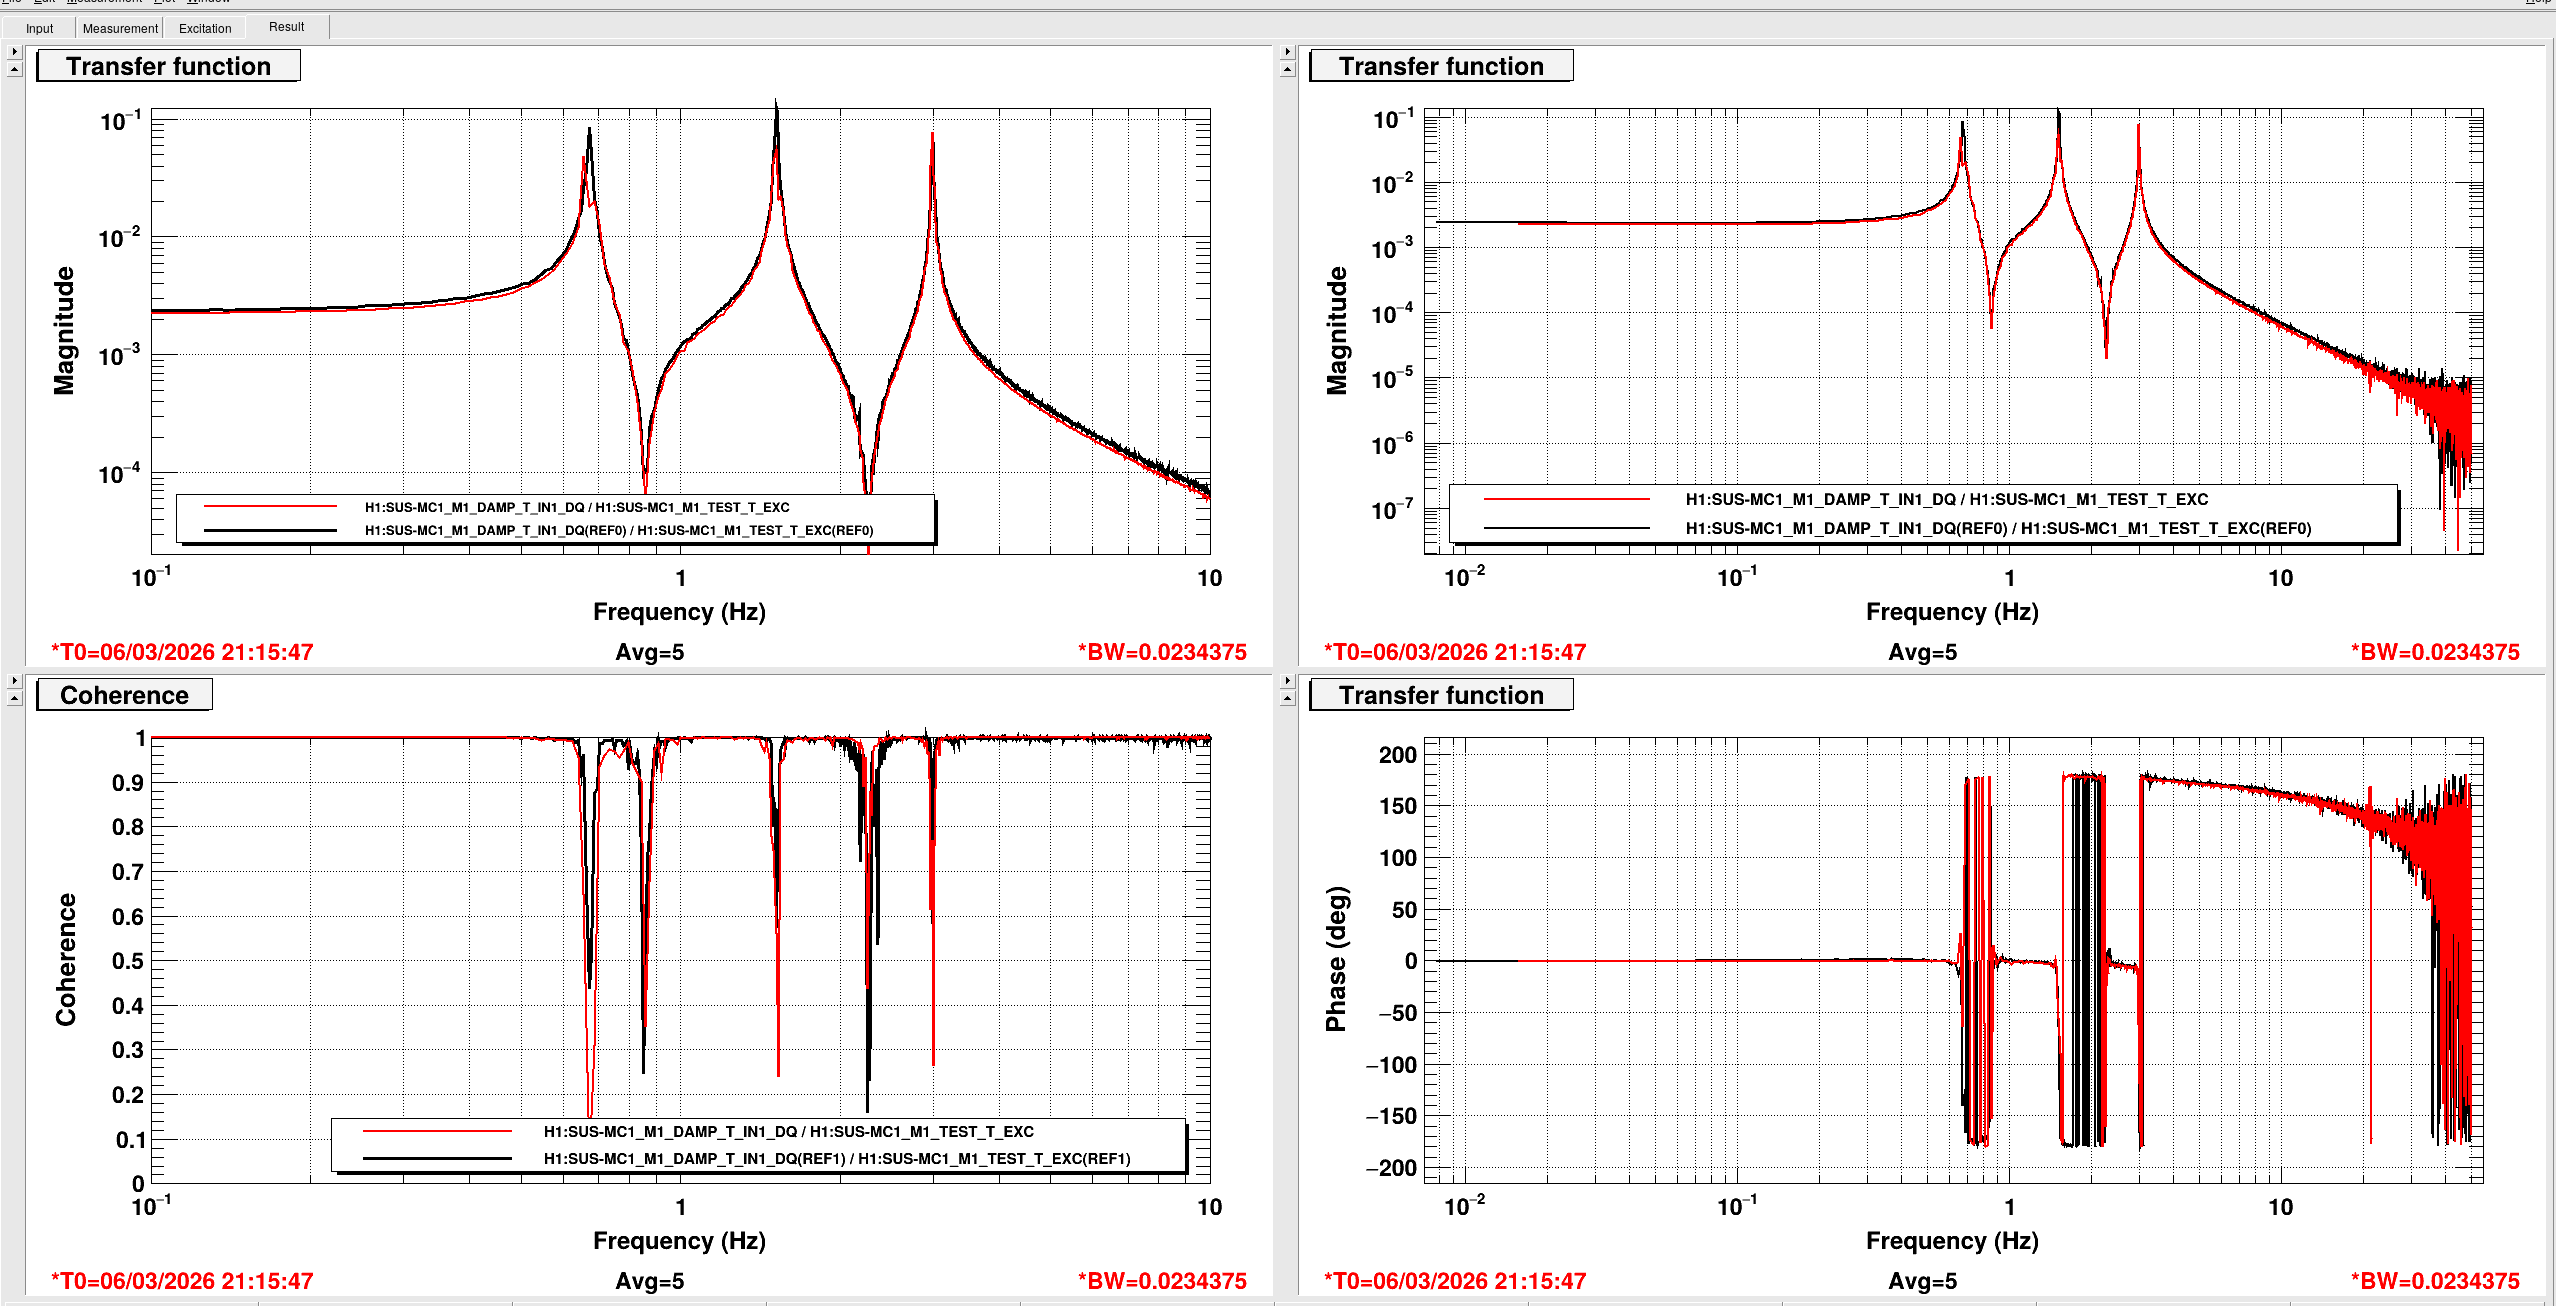
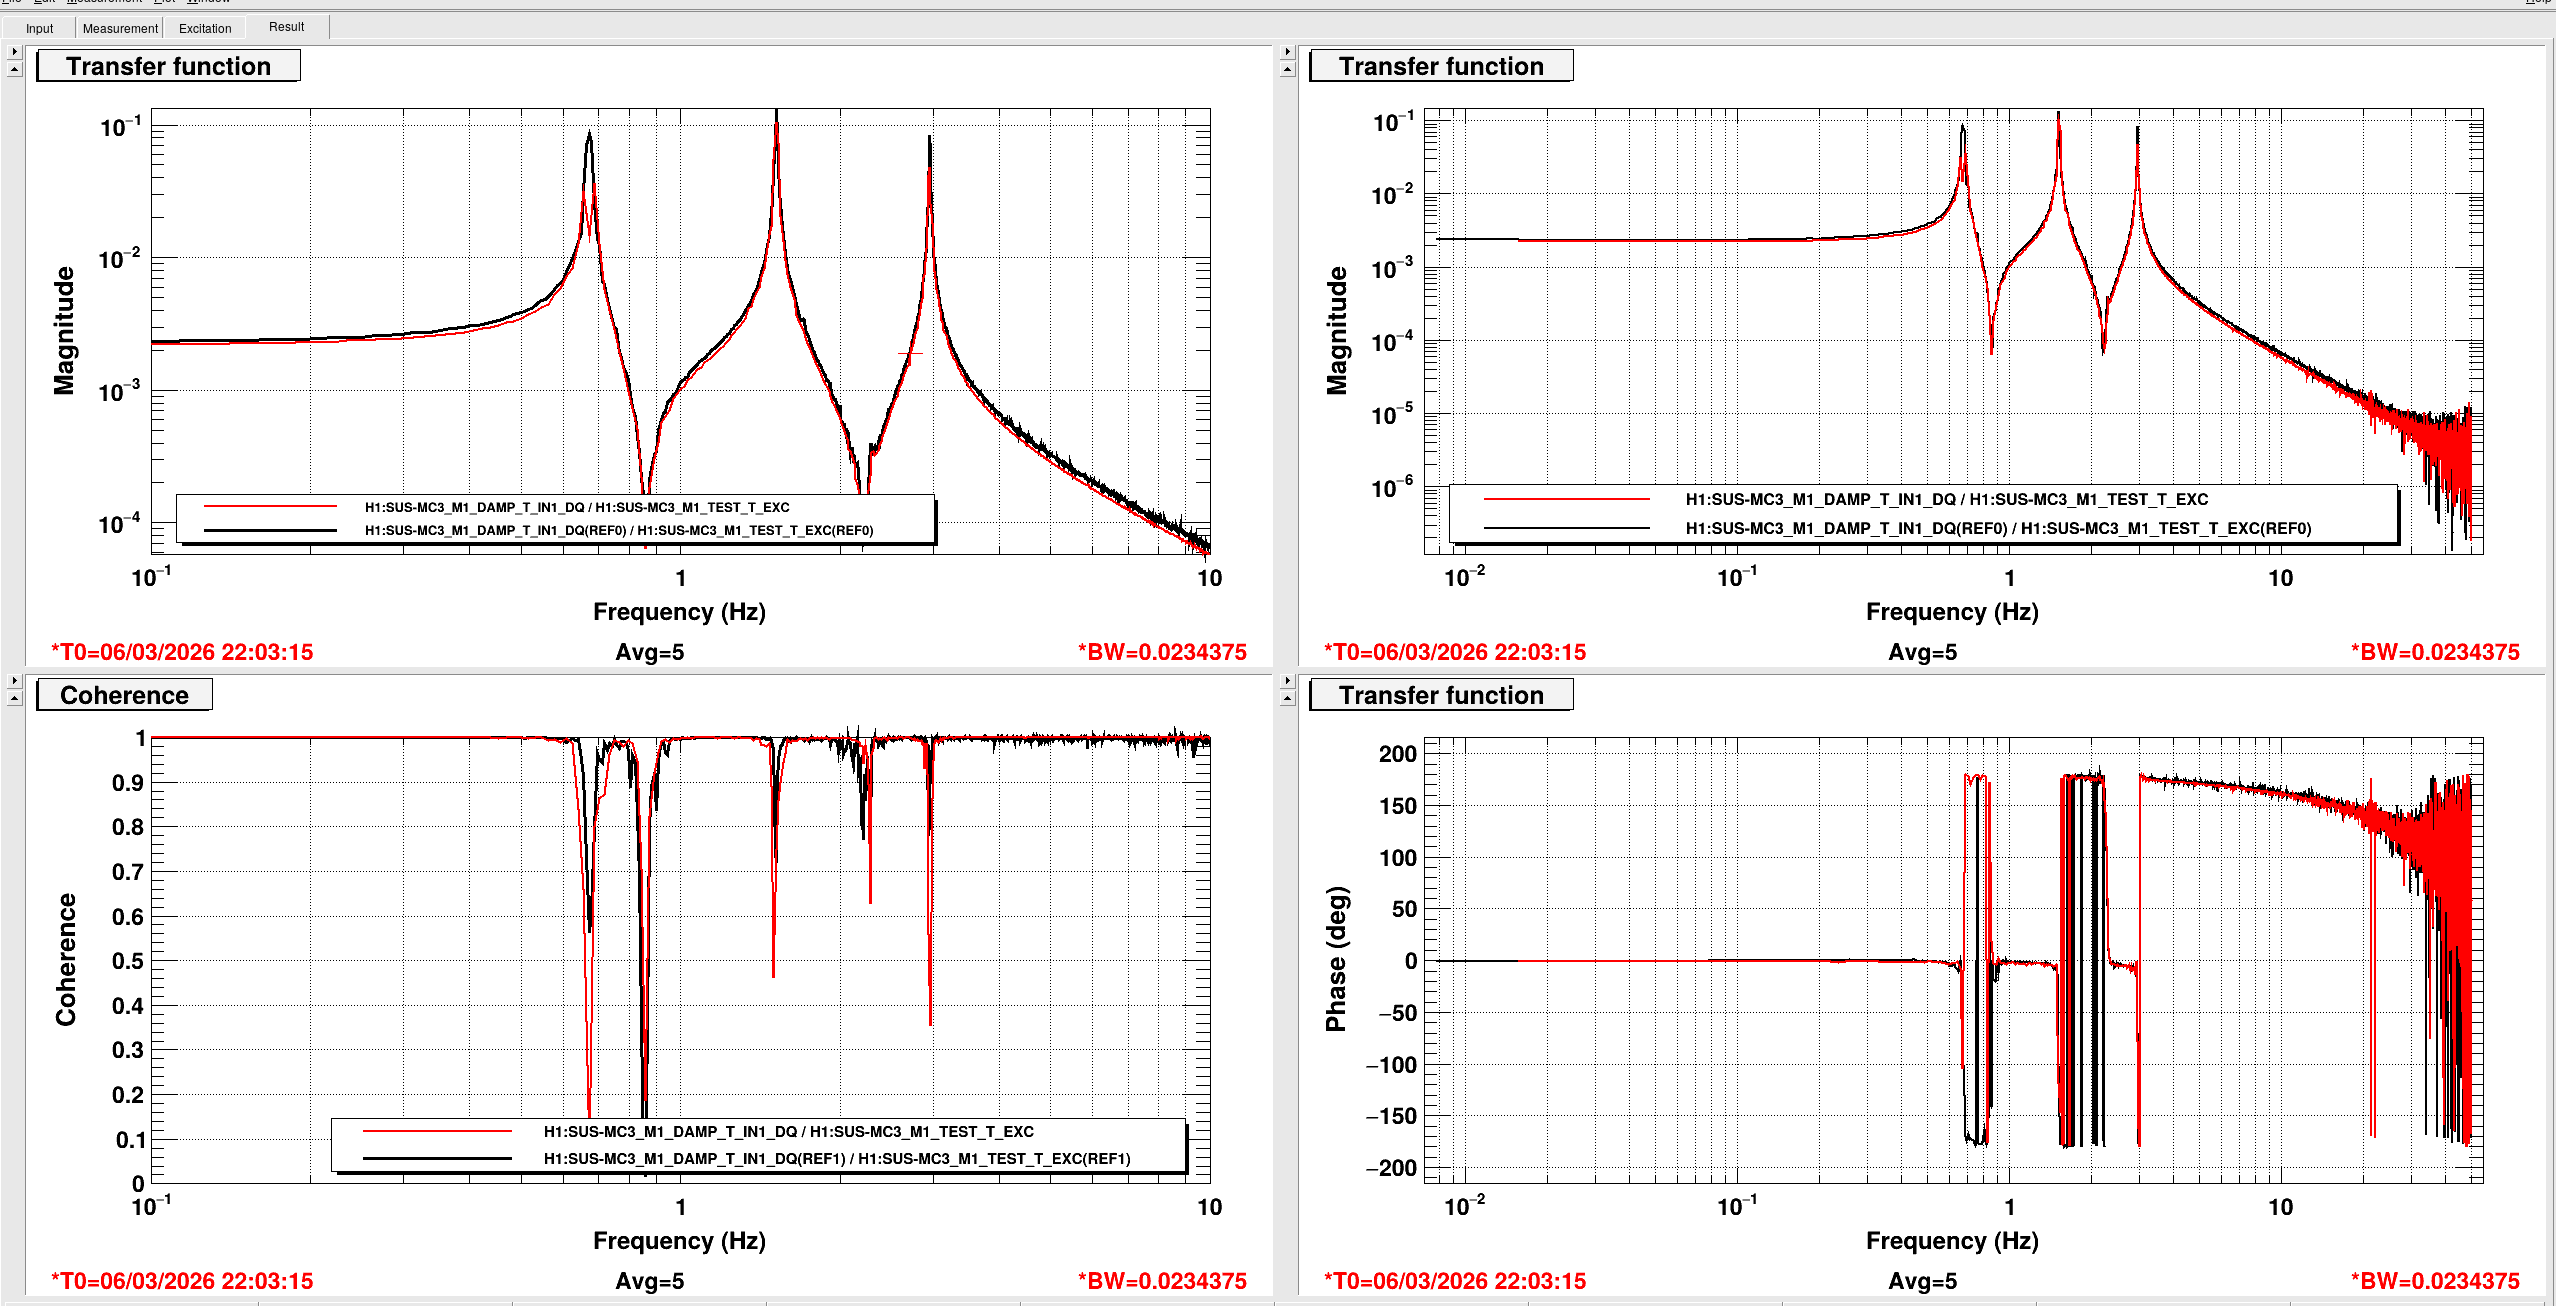
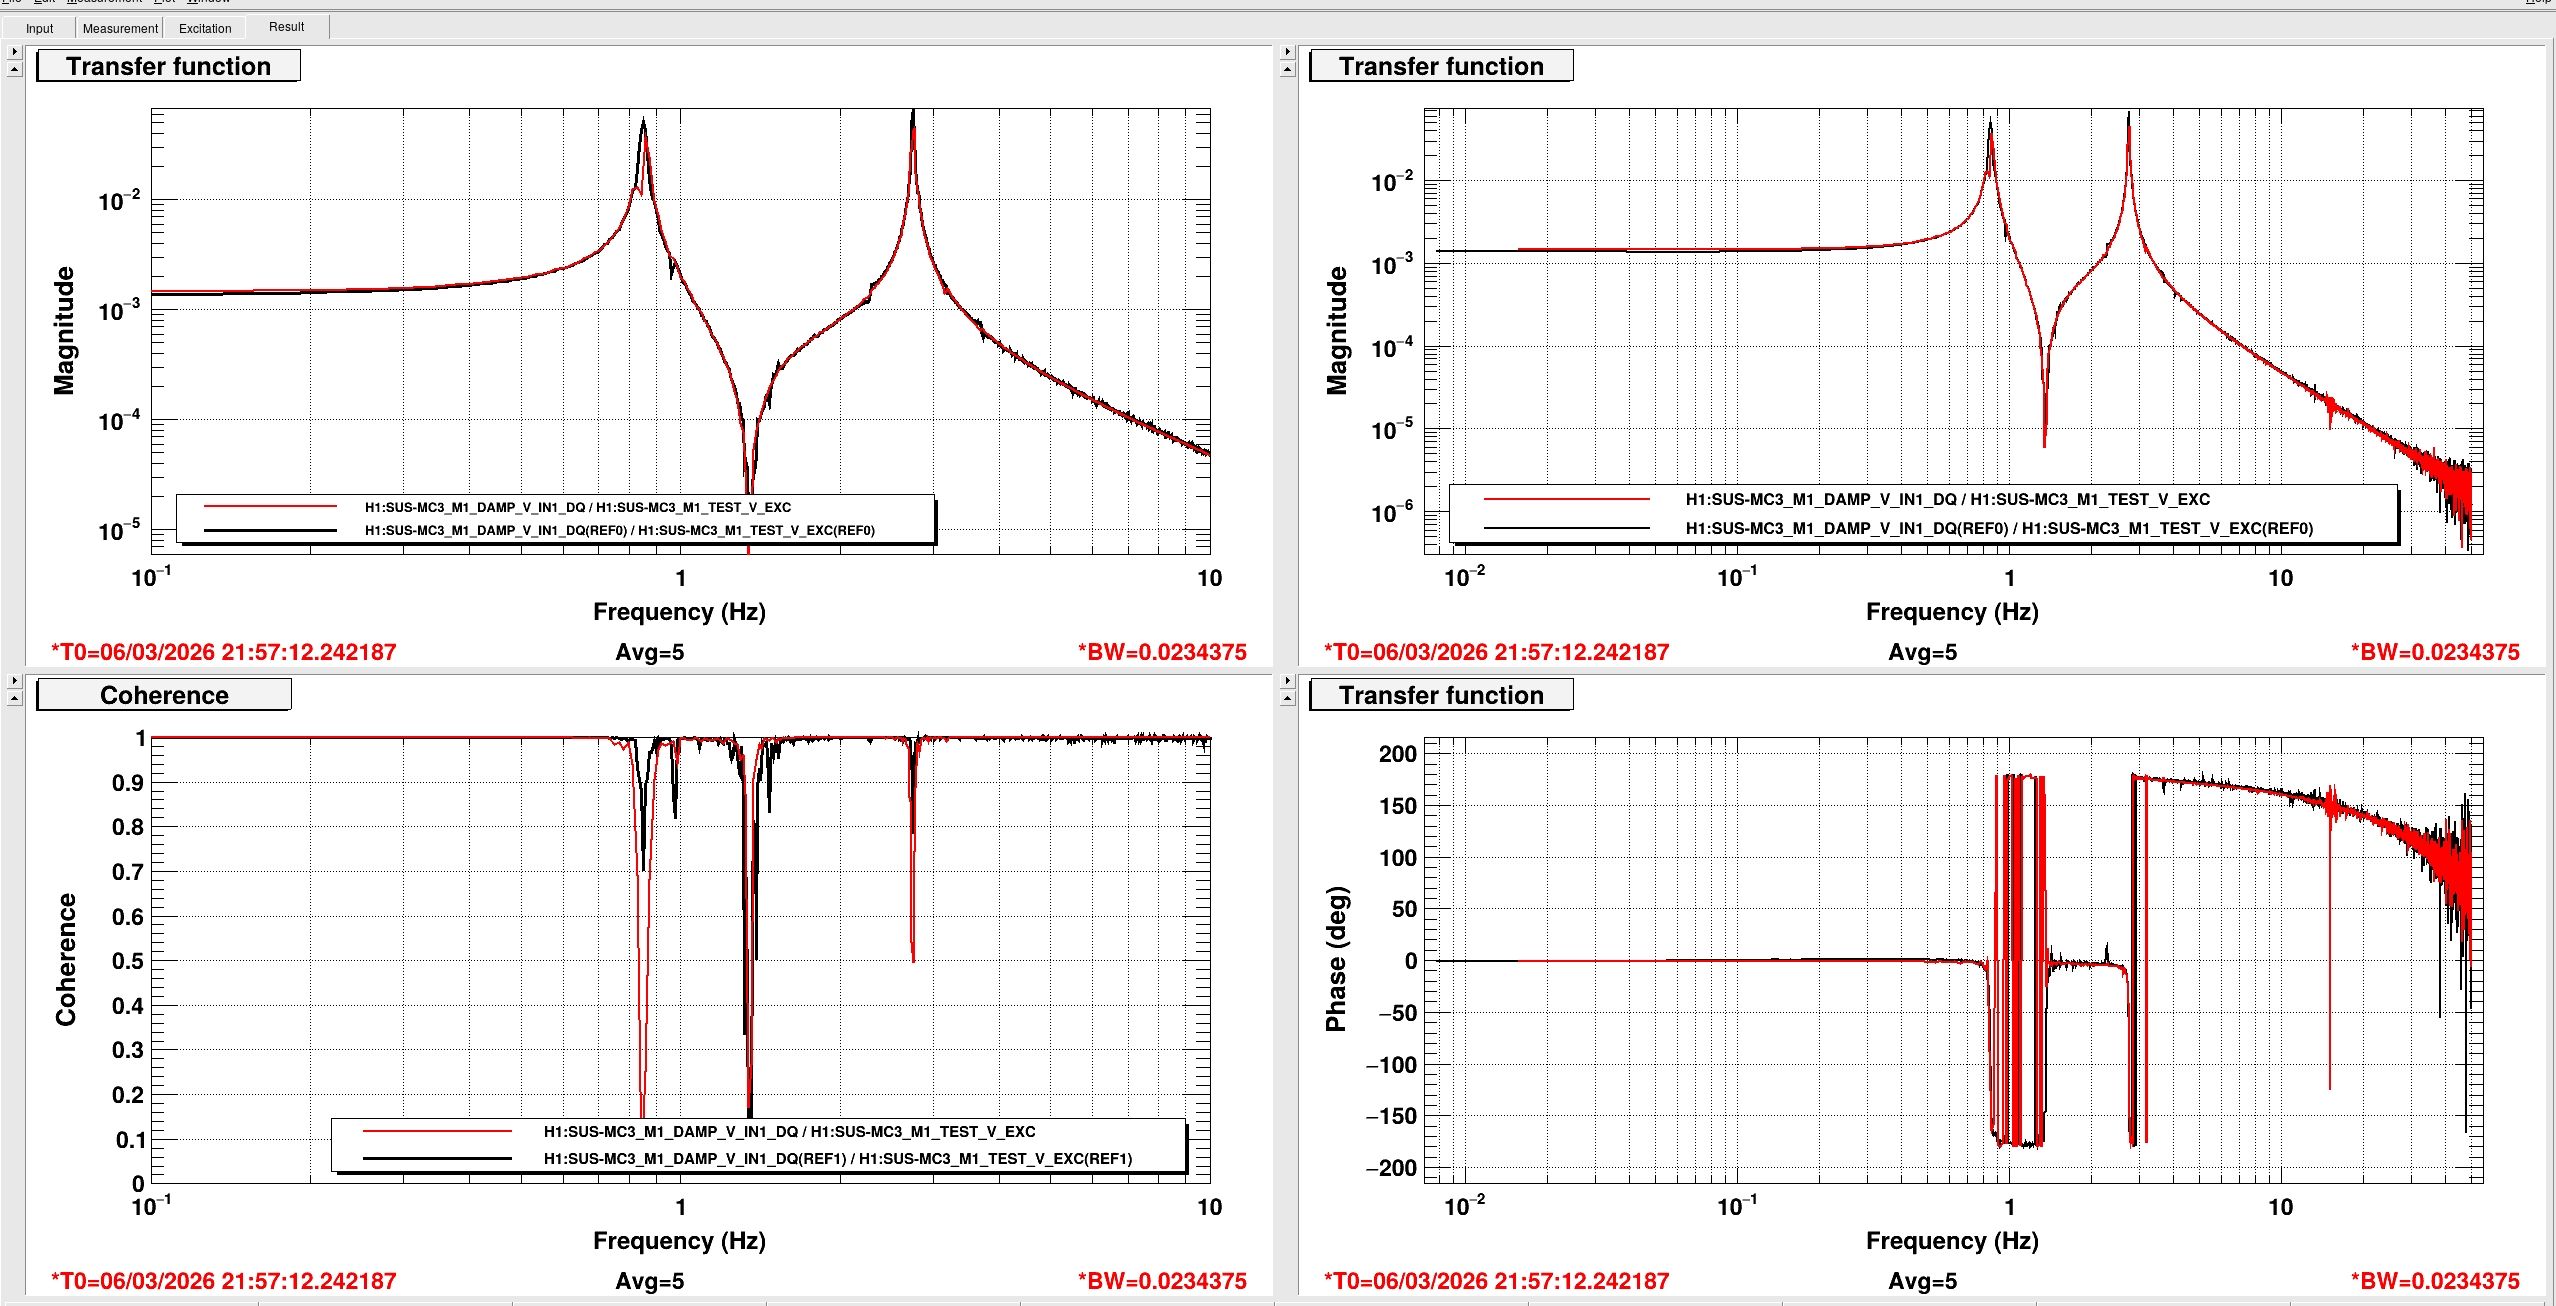
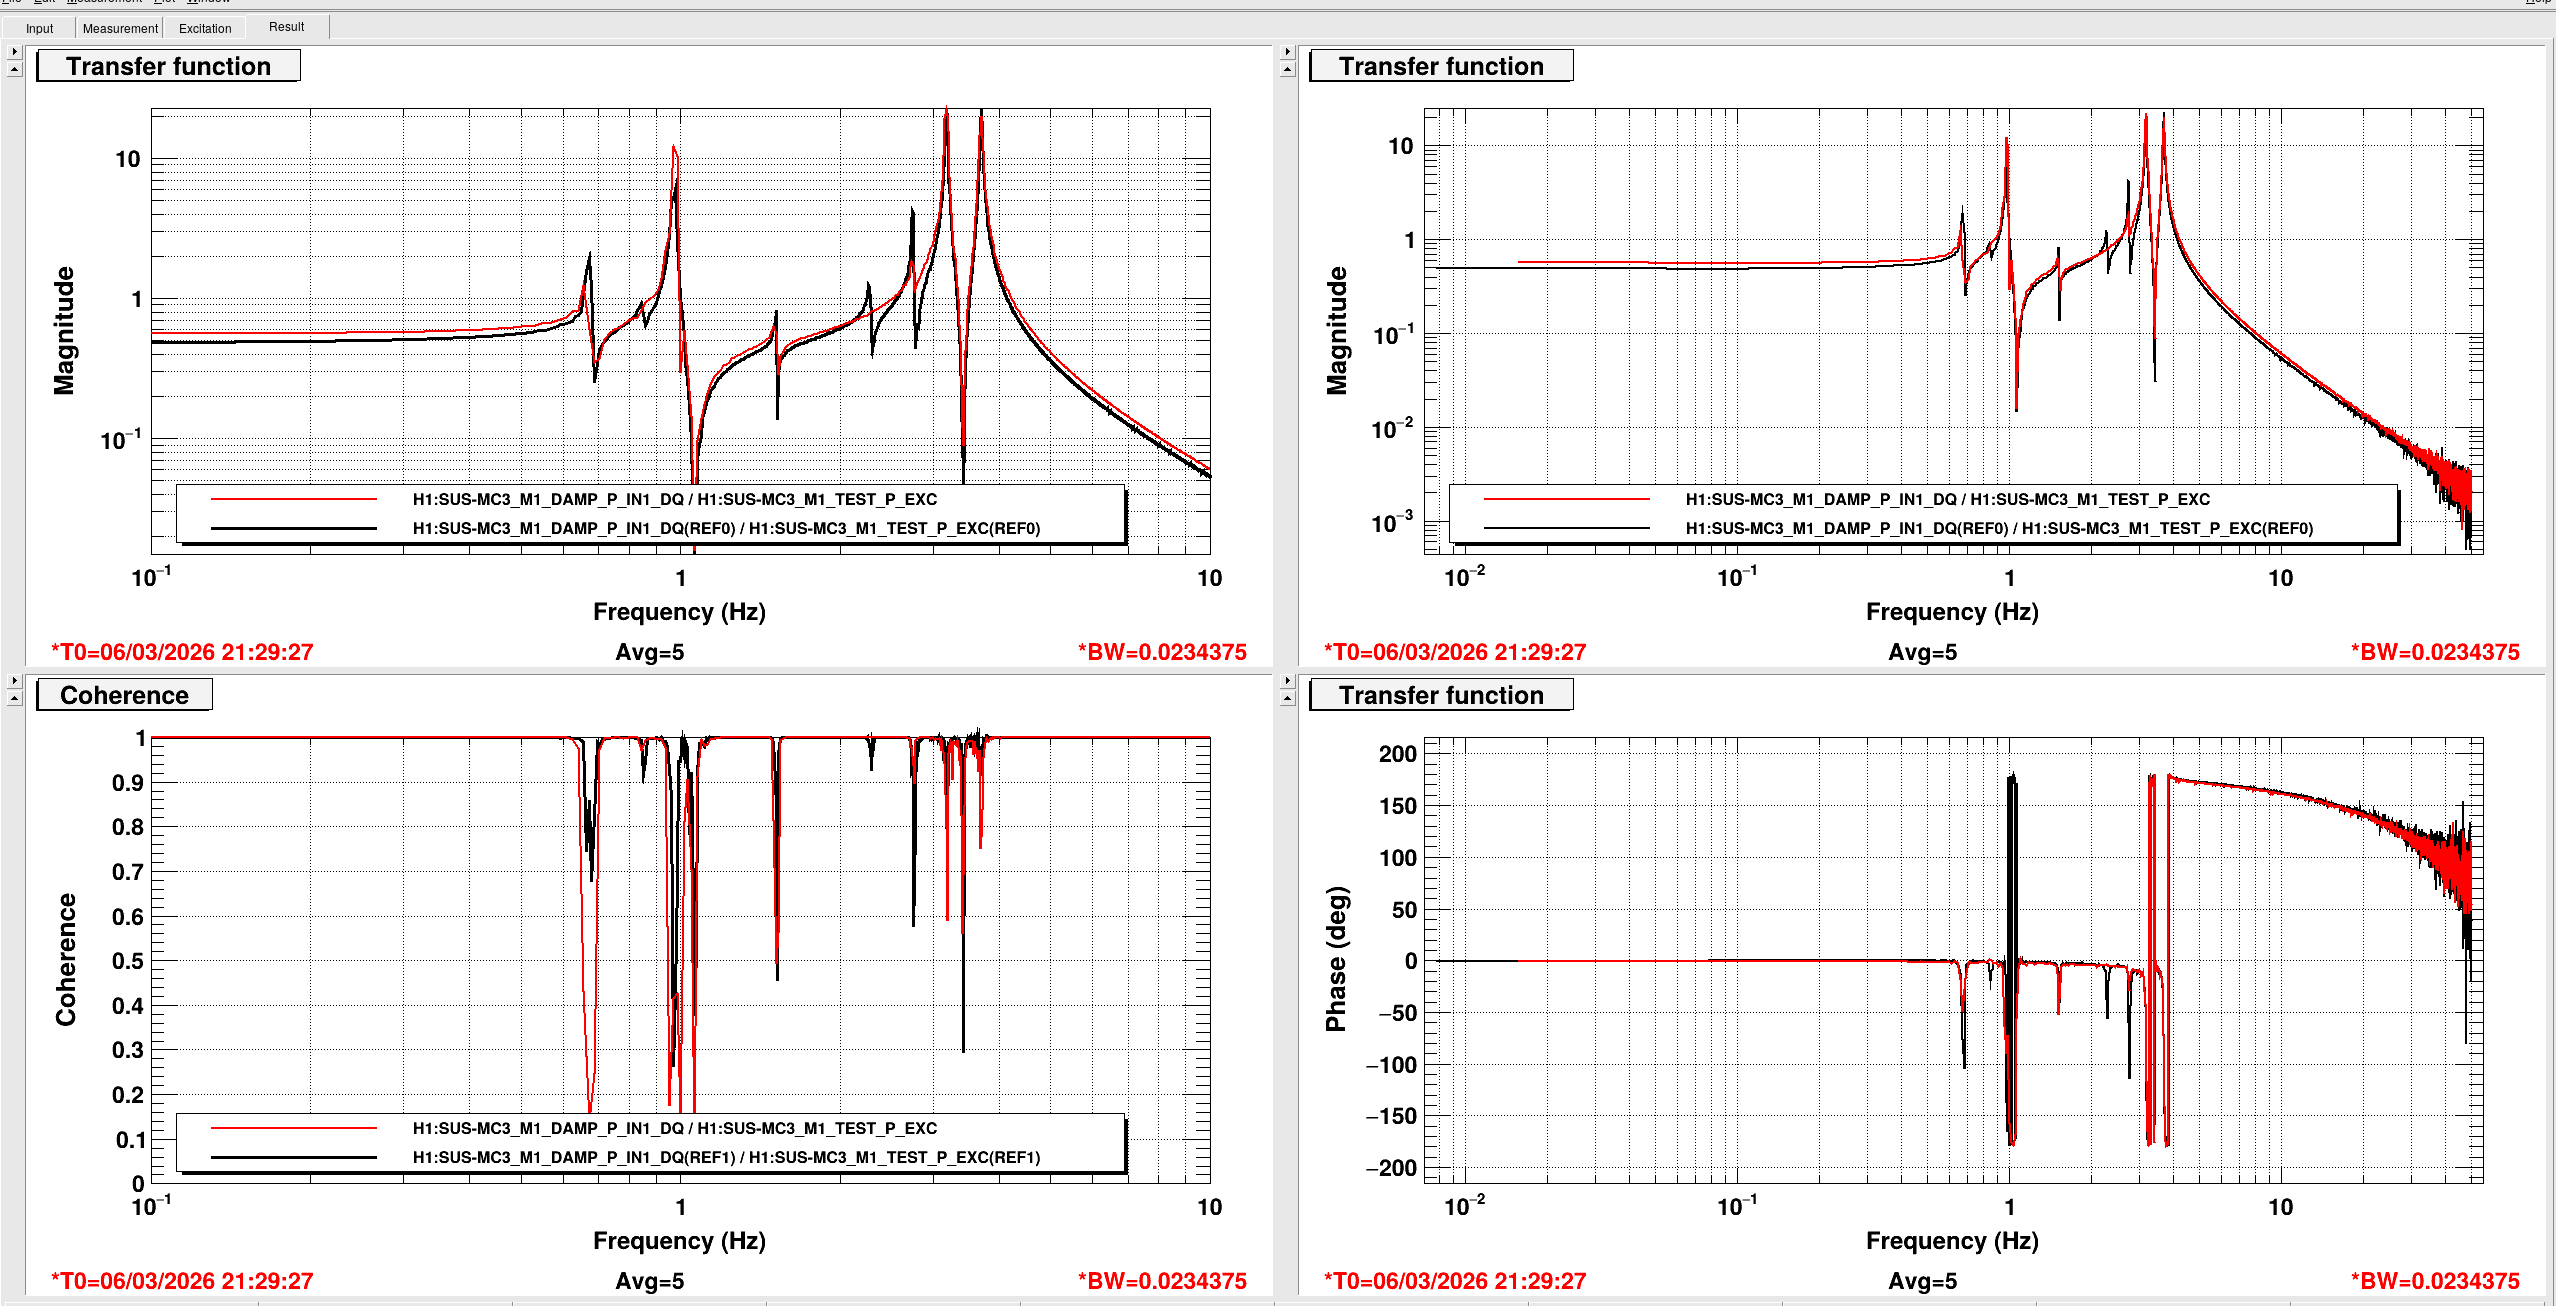
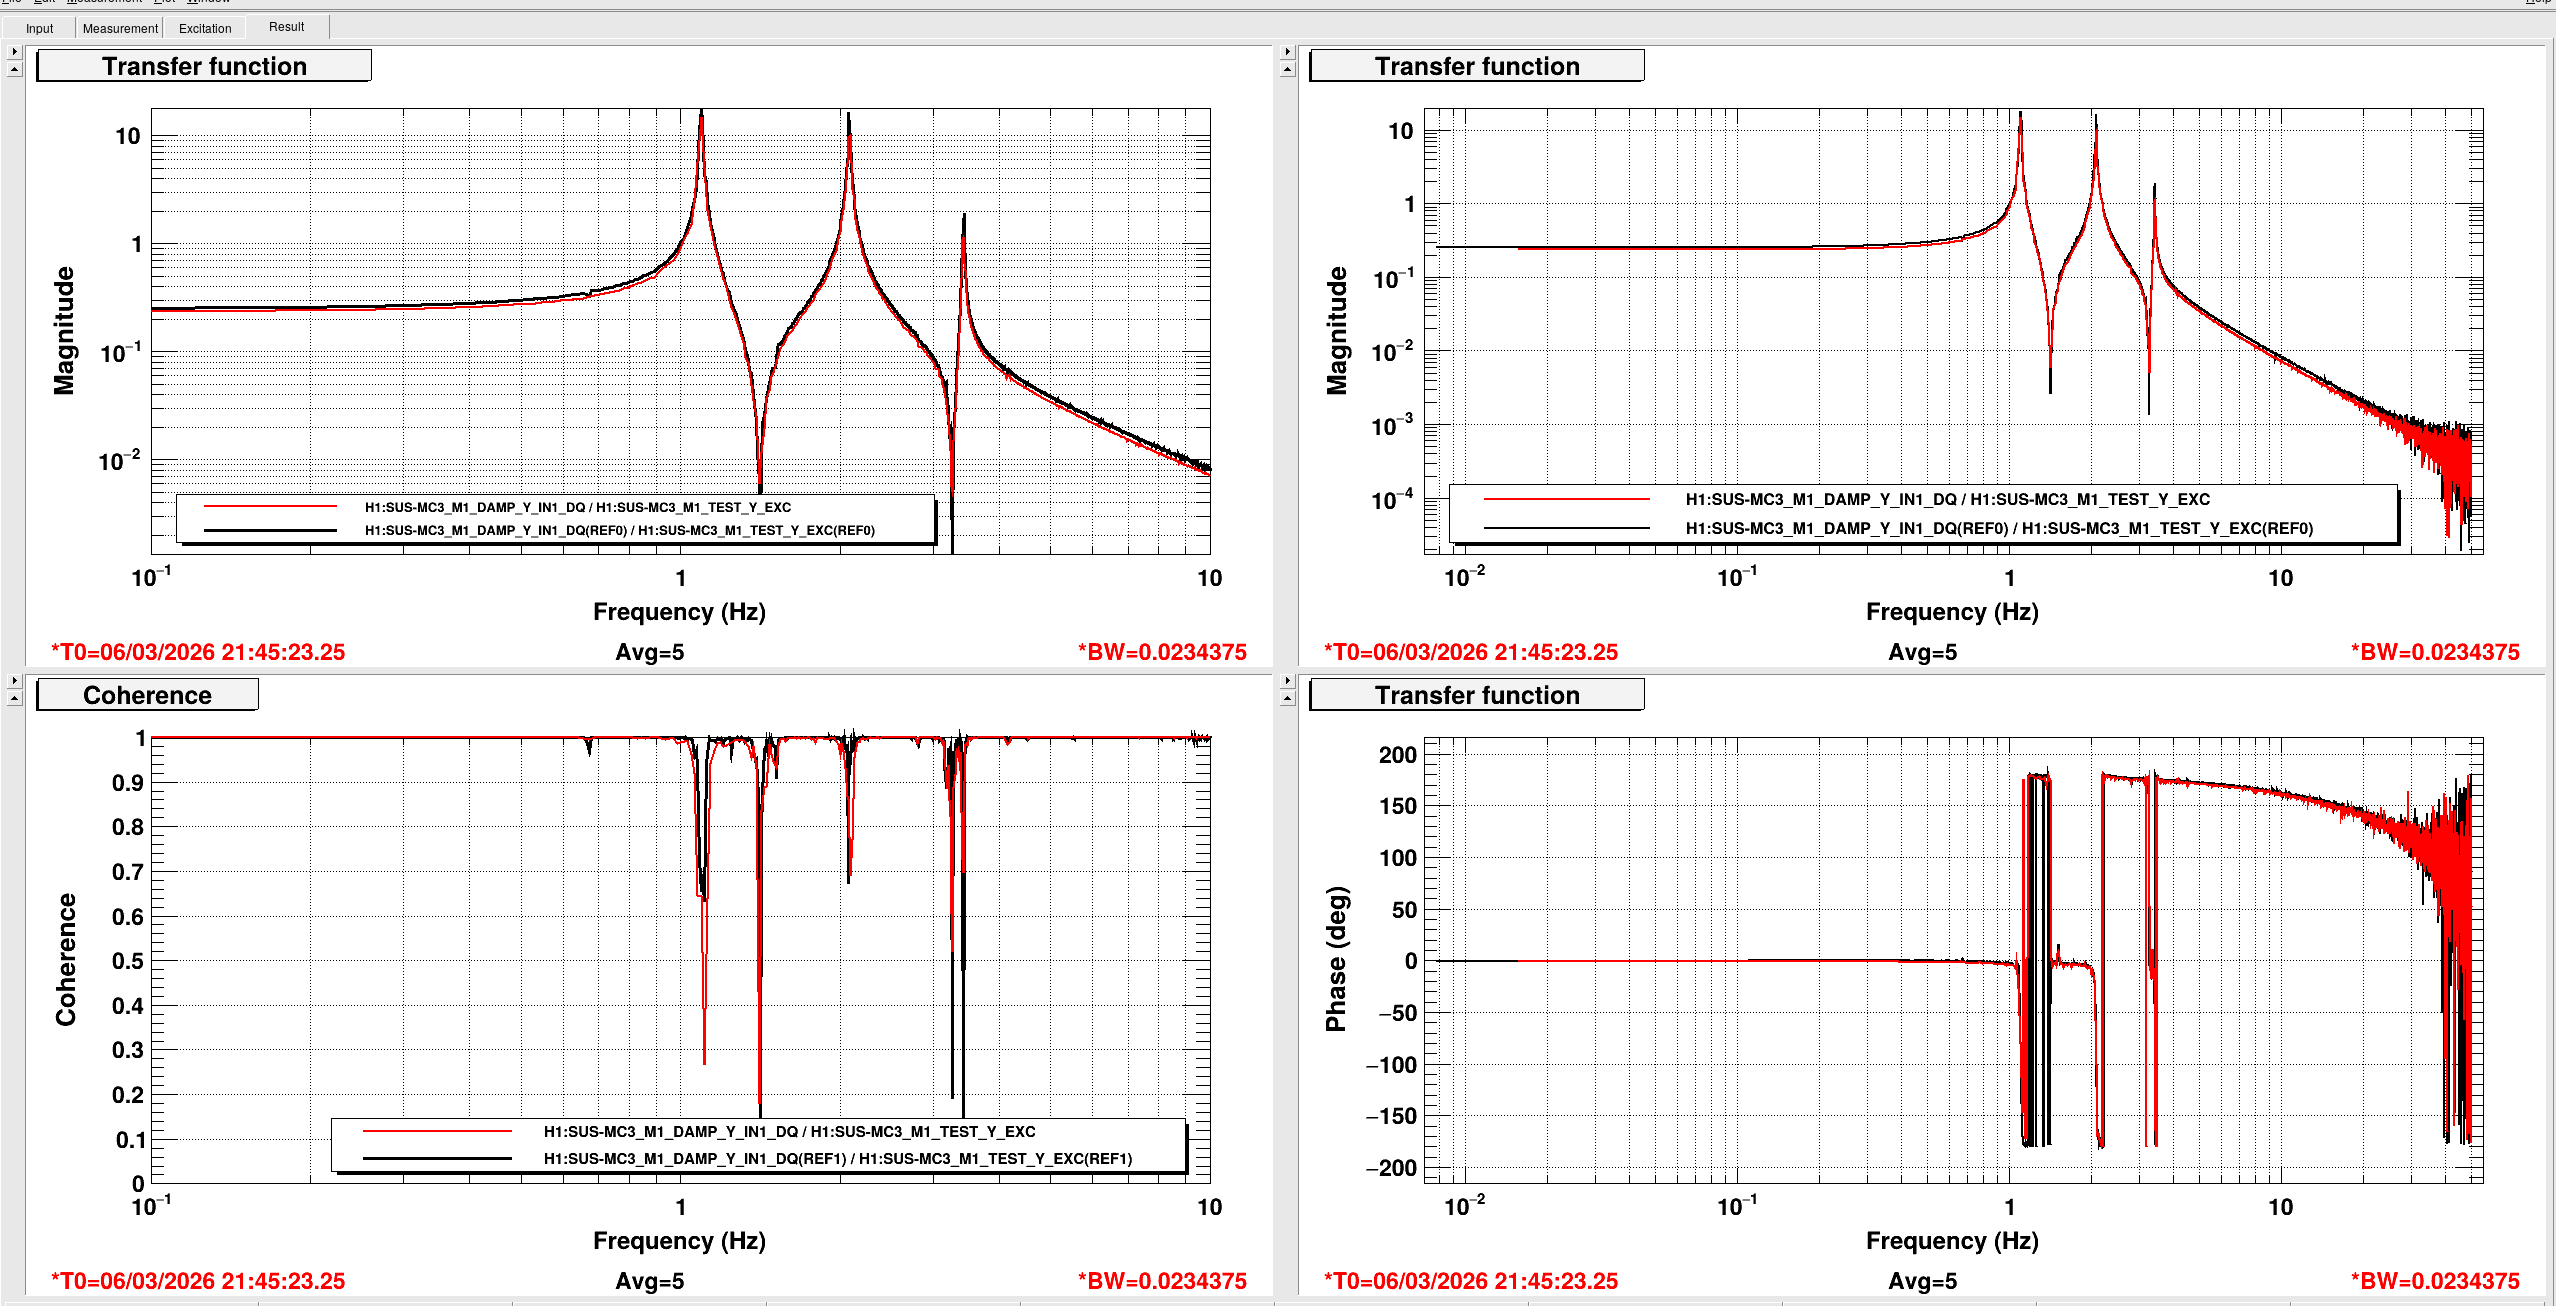
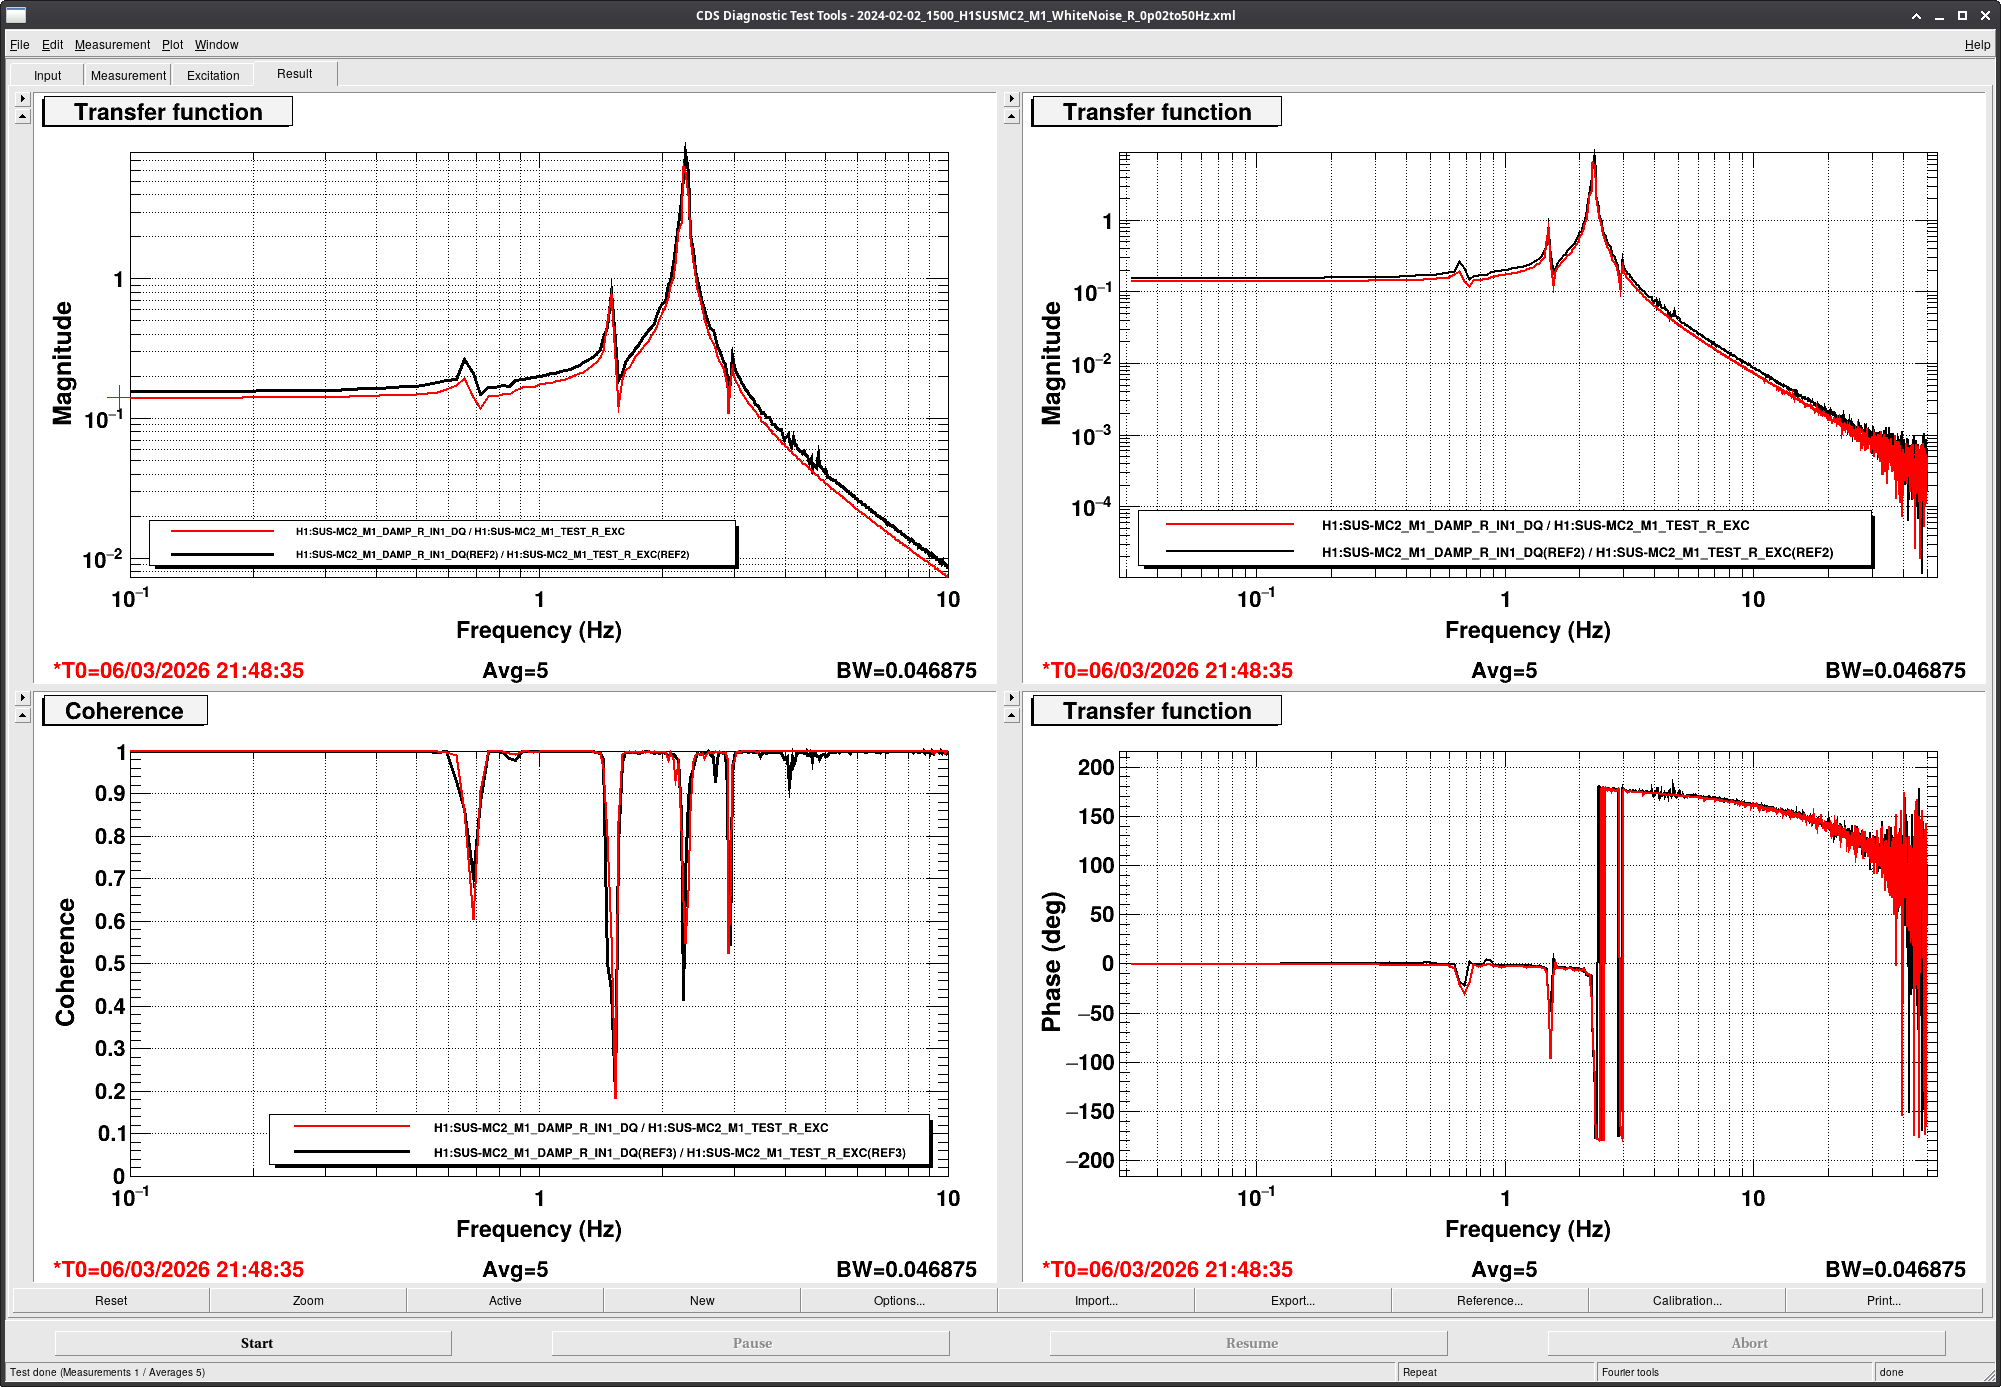
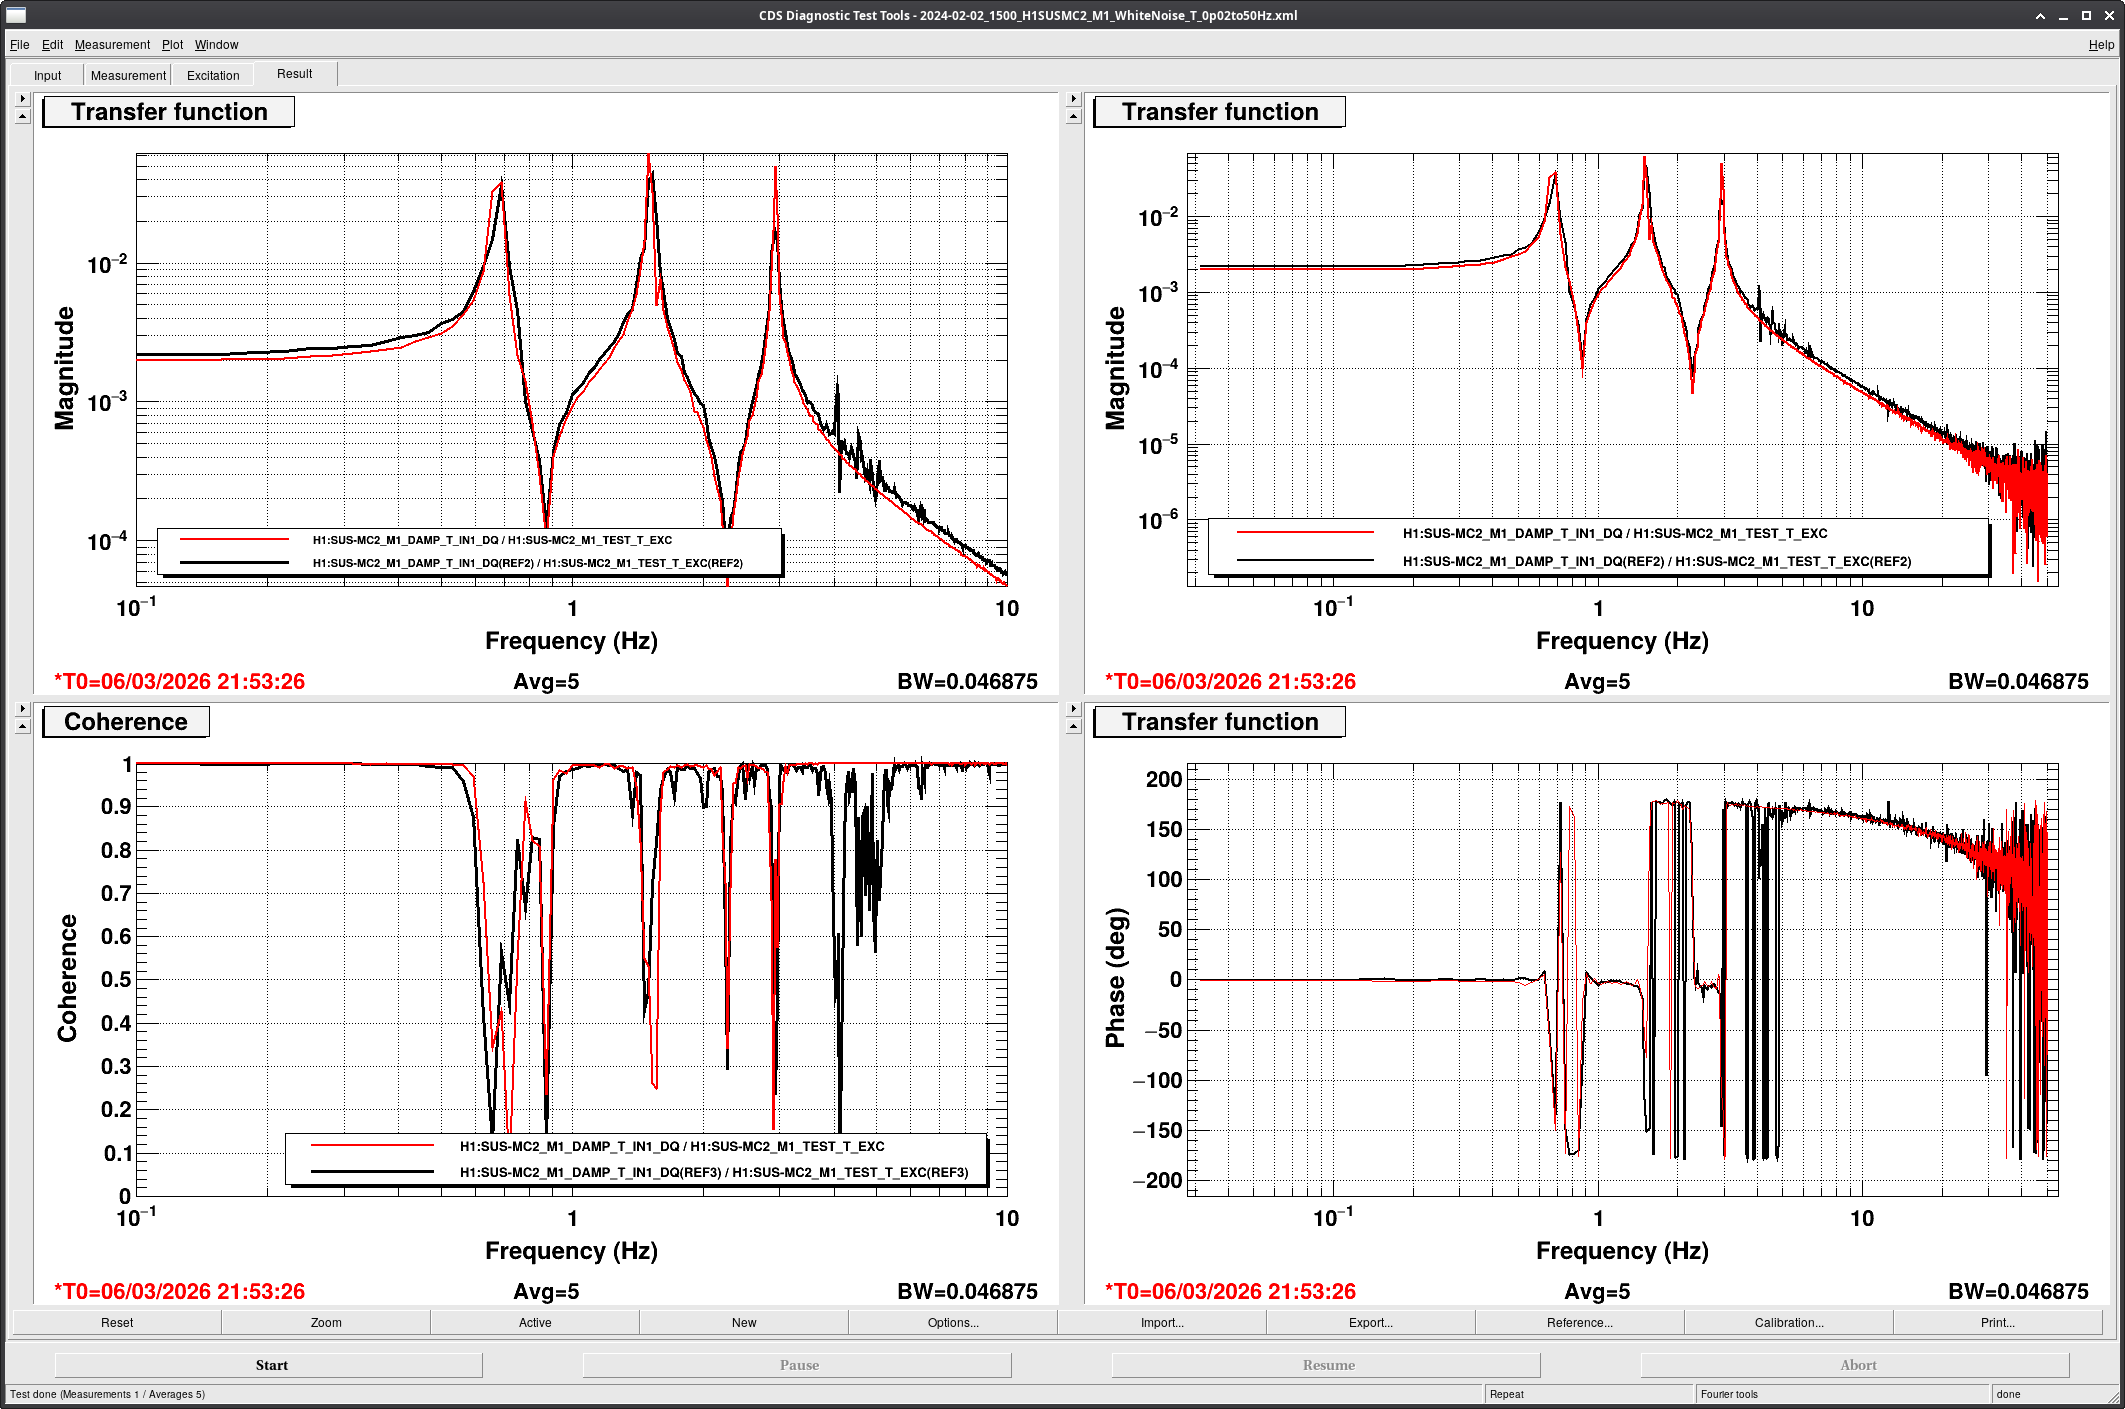
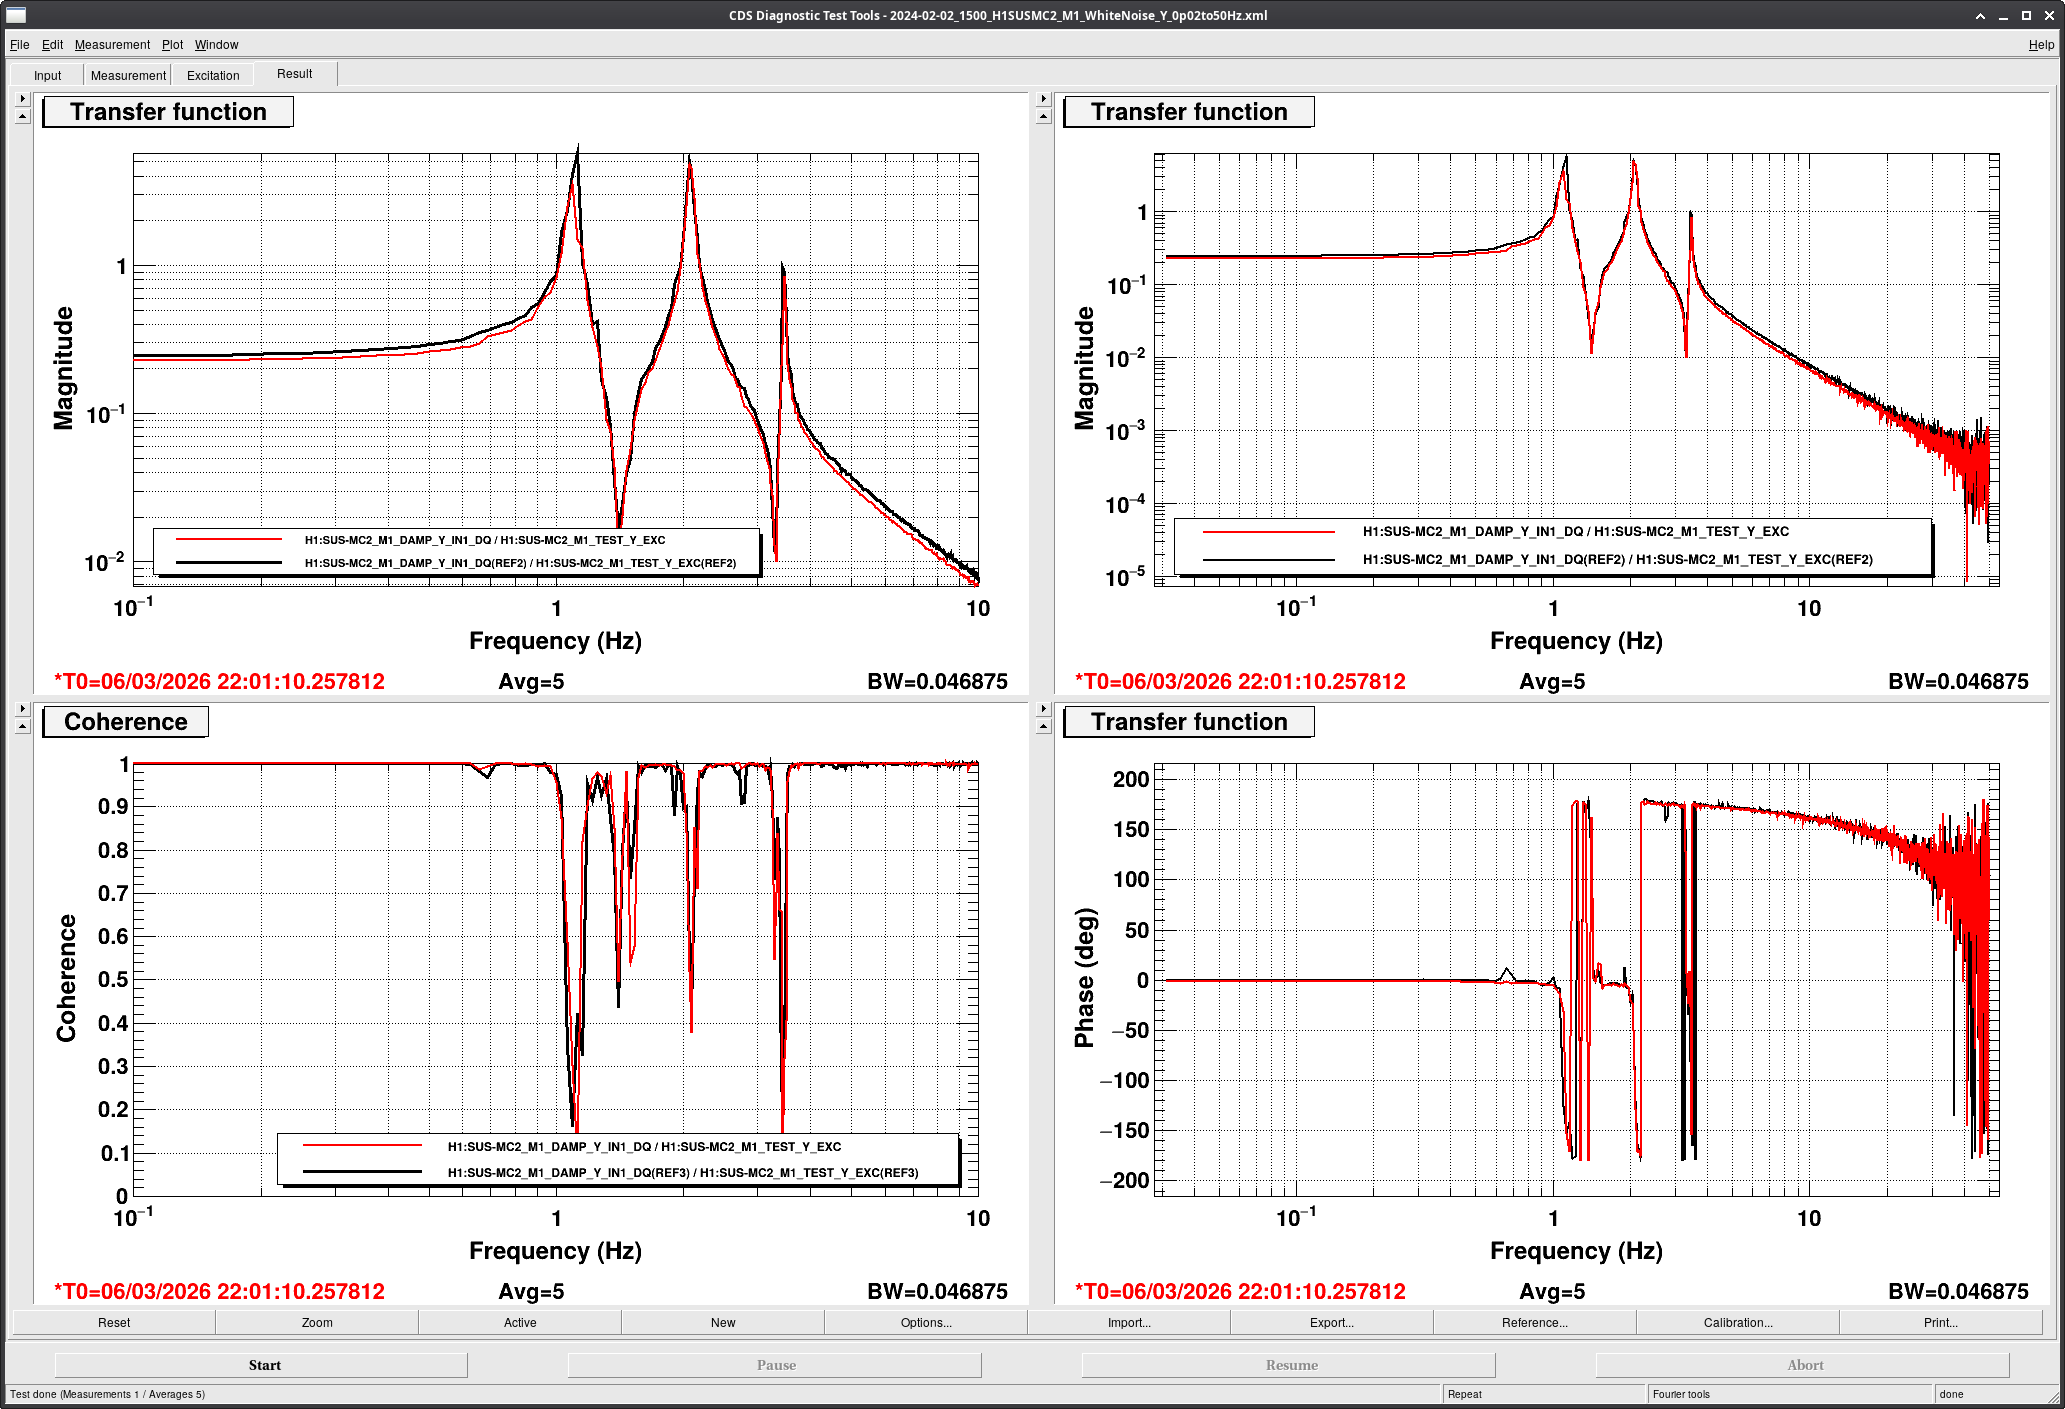
I ran an undamped no alignment offsets suite of transfer functions for MC1, and MC3, the state of HAM2 at the time was HEPI locked, ISI isolated. MC1 Pitch was the worst looking TF with multiple extra peaks. Looking at the OSEM signals for MC1 T3 shows a questionable drop during the time Sheila was looking at.
MC1:
/ligo/svncommon/SusSVN/sus/trunk/HSTS/H1/MC1/SAGM1/Data/
2026-03-06_1930_H1SUSMC1_M1_WhiteNoise_P_0p02to50Hz.xml
2026-03-06_1930_H1SUSMC1_M1_WhiteNoise_R_0p02to50Hz.xml
2026-03-06_1930_H1SUSMC1_M1_WhiteNoise_V_0p02to50Hz.xml
2026-03-06_1930_H1SUSMC1_M1_WhiteNoise_Y_0p02to50Hz.xml
2026-03-06_1930_H1SUSMC1_M1_WhiteNoise_T_0p02to50Hz.xml
2026-03-06_1930_H1SUSMC1_M1_WhiteNoise_L_0p02to50Hz.xml
MC3:
2026-03-06_2130_H1SUSMC3_M1_WhiteNoise_L_0p02to50Hz.xml
2026-03-06_2130_H1SUSMC3_M1_WhiteNoise_P_0p02to50Hz.xml
2026-03-06_2130_H1SUSMC3_M1_WhiteNoise_R_0p02to50Hz.xml
2026-03-06_2130_H1SUSMC3_M1_WhiteNoise_T_0p02to50Hz.xml
2026-03-06_2130_H1SUSMC3_M1_WhiteNoise_V_0p02to50Hz.xml
2026-03-06_2130_H1SUSMC3_M1_WhiteNoise_Y_0p02to50Hz.xml


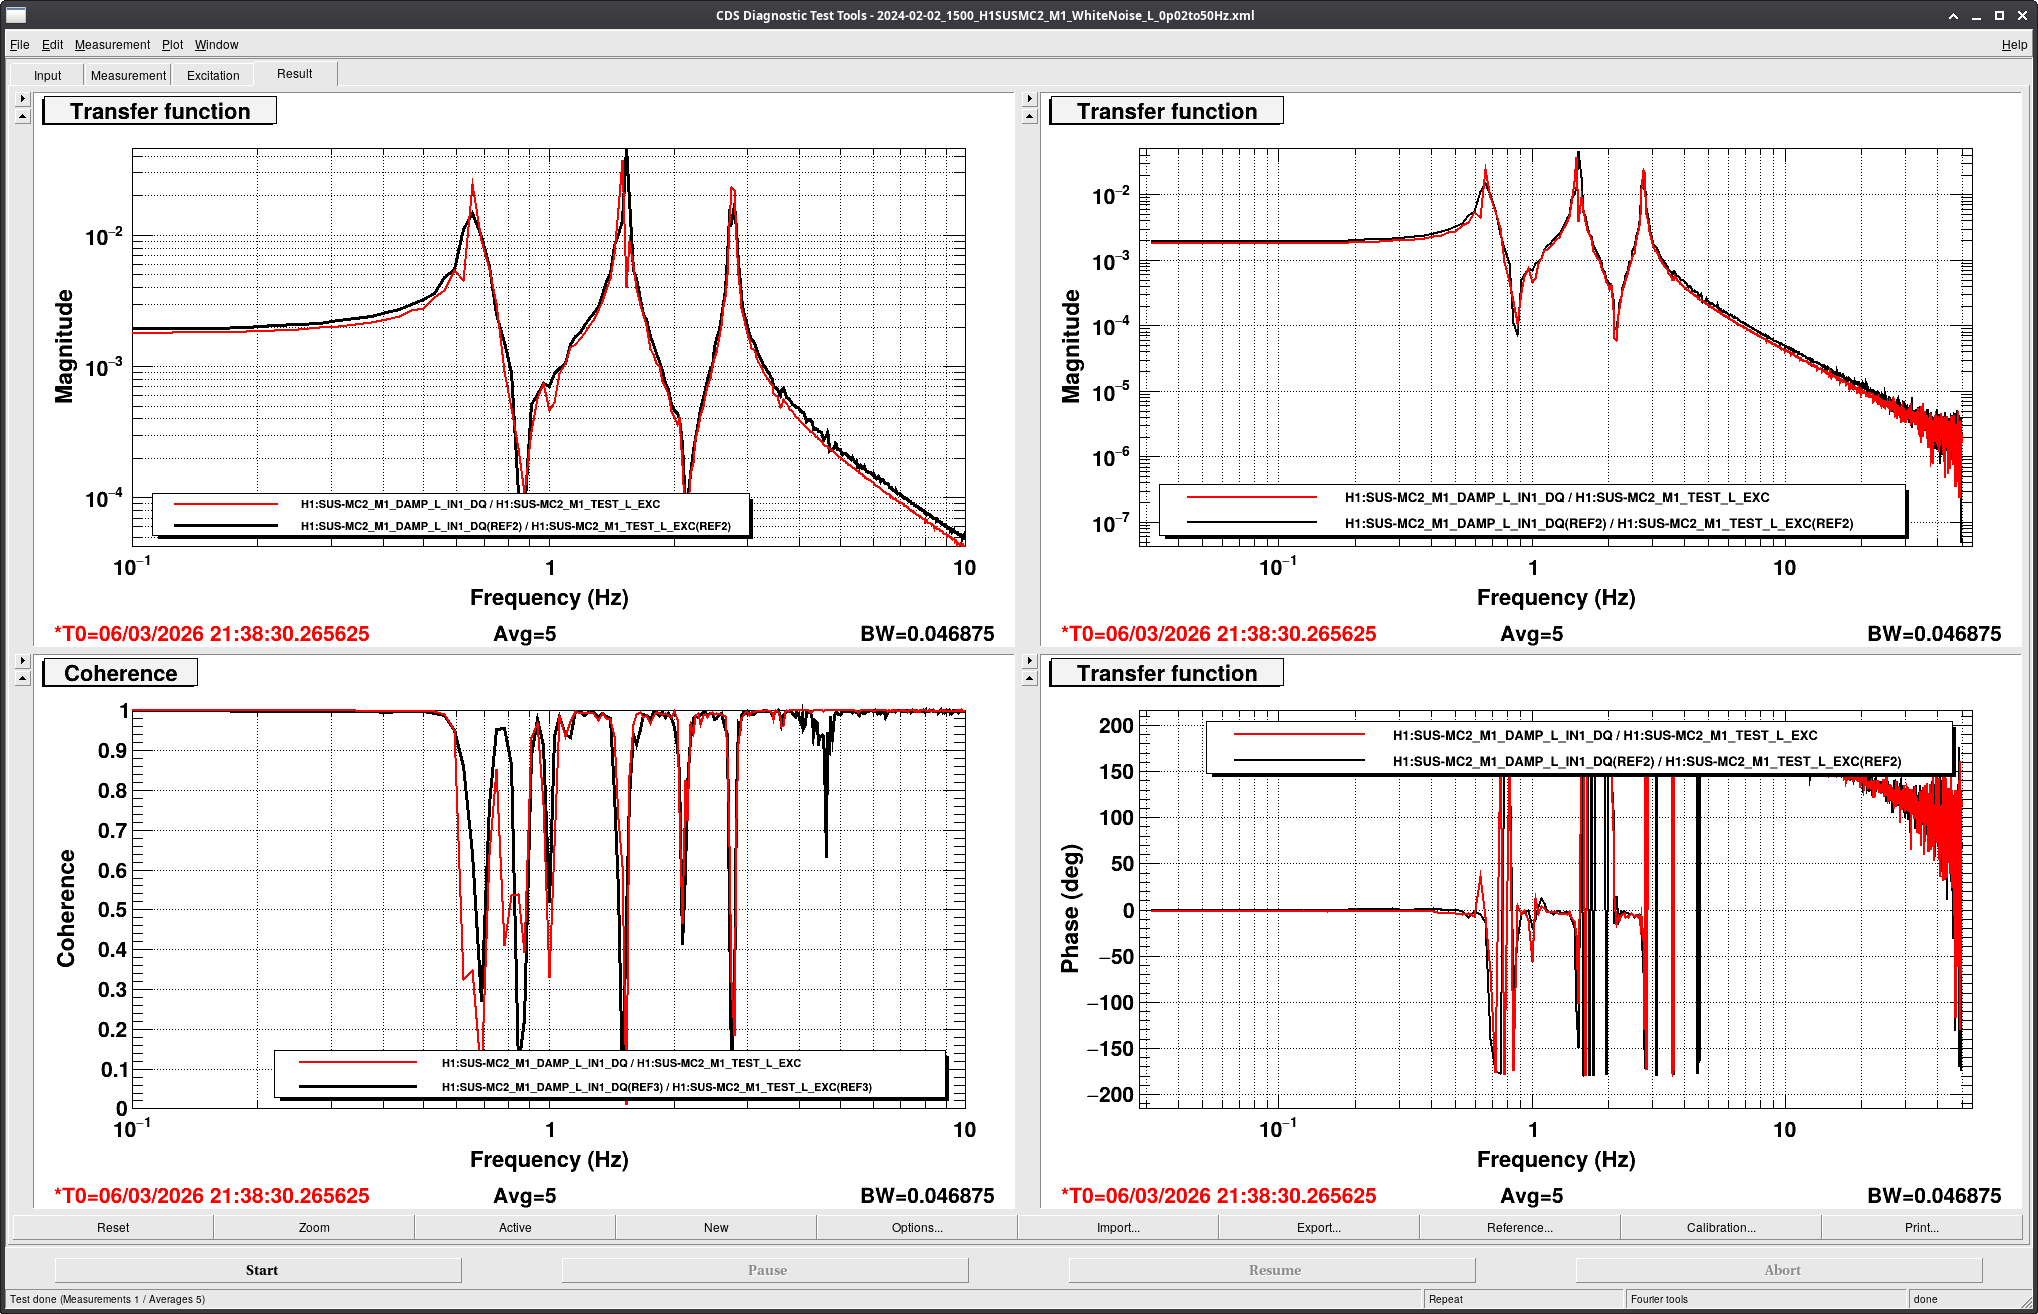
I ran the same set of transfer functions for MC2 while Ryan did the other MCs; nothing suspicious here.
Templates' location: /ligo/svncommon/SusSVN/sus/trunk/HSTS/H1/MC2/SAGM1/Data/2026-03-06_2145_H1SUSMC2_M1_WhiteNoise_{P,R,T,V,Y,L}_0p02to50Hz.xml
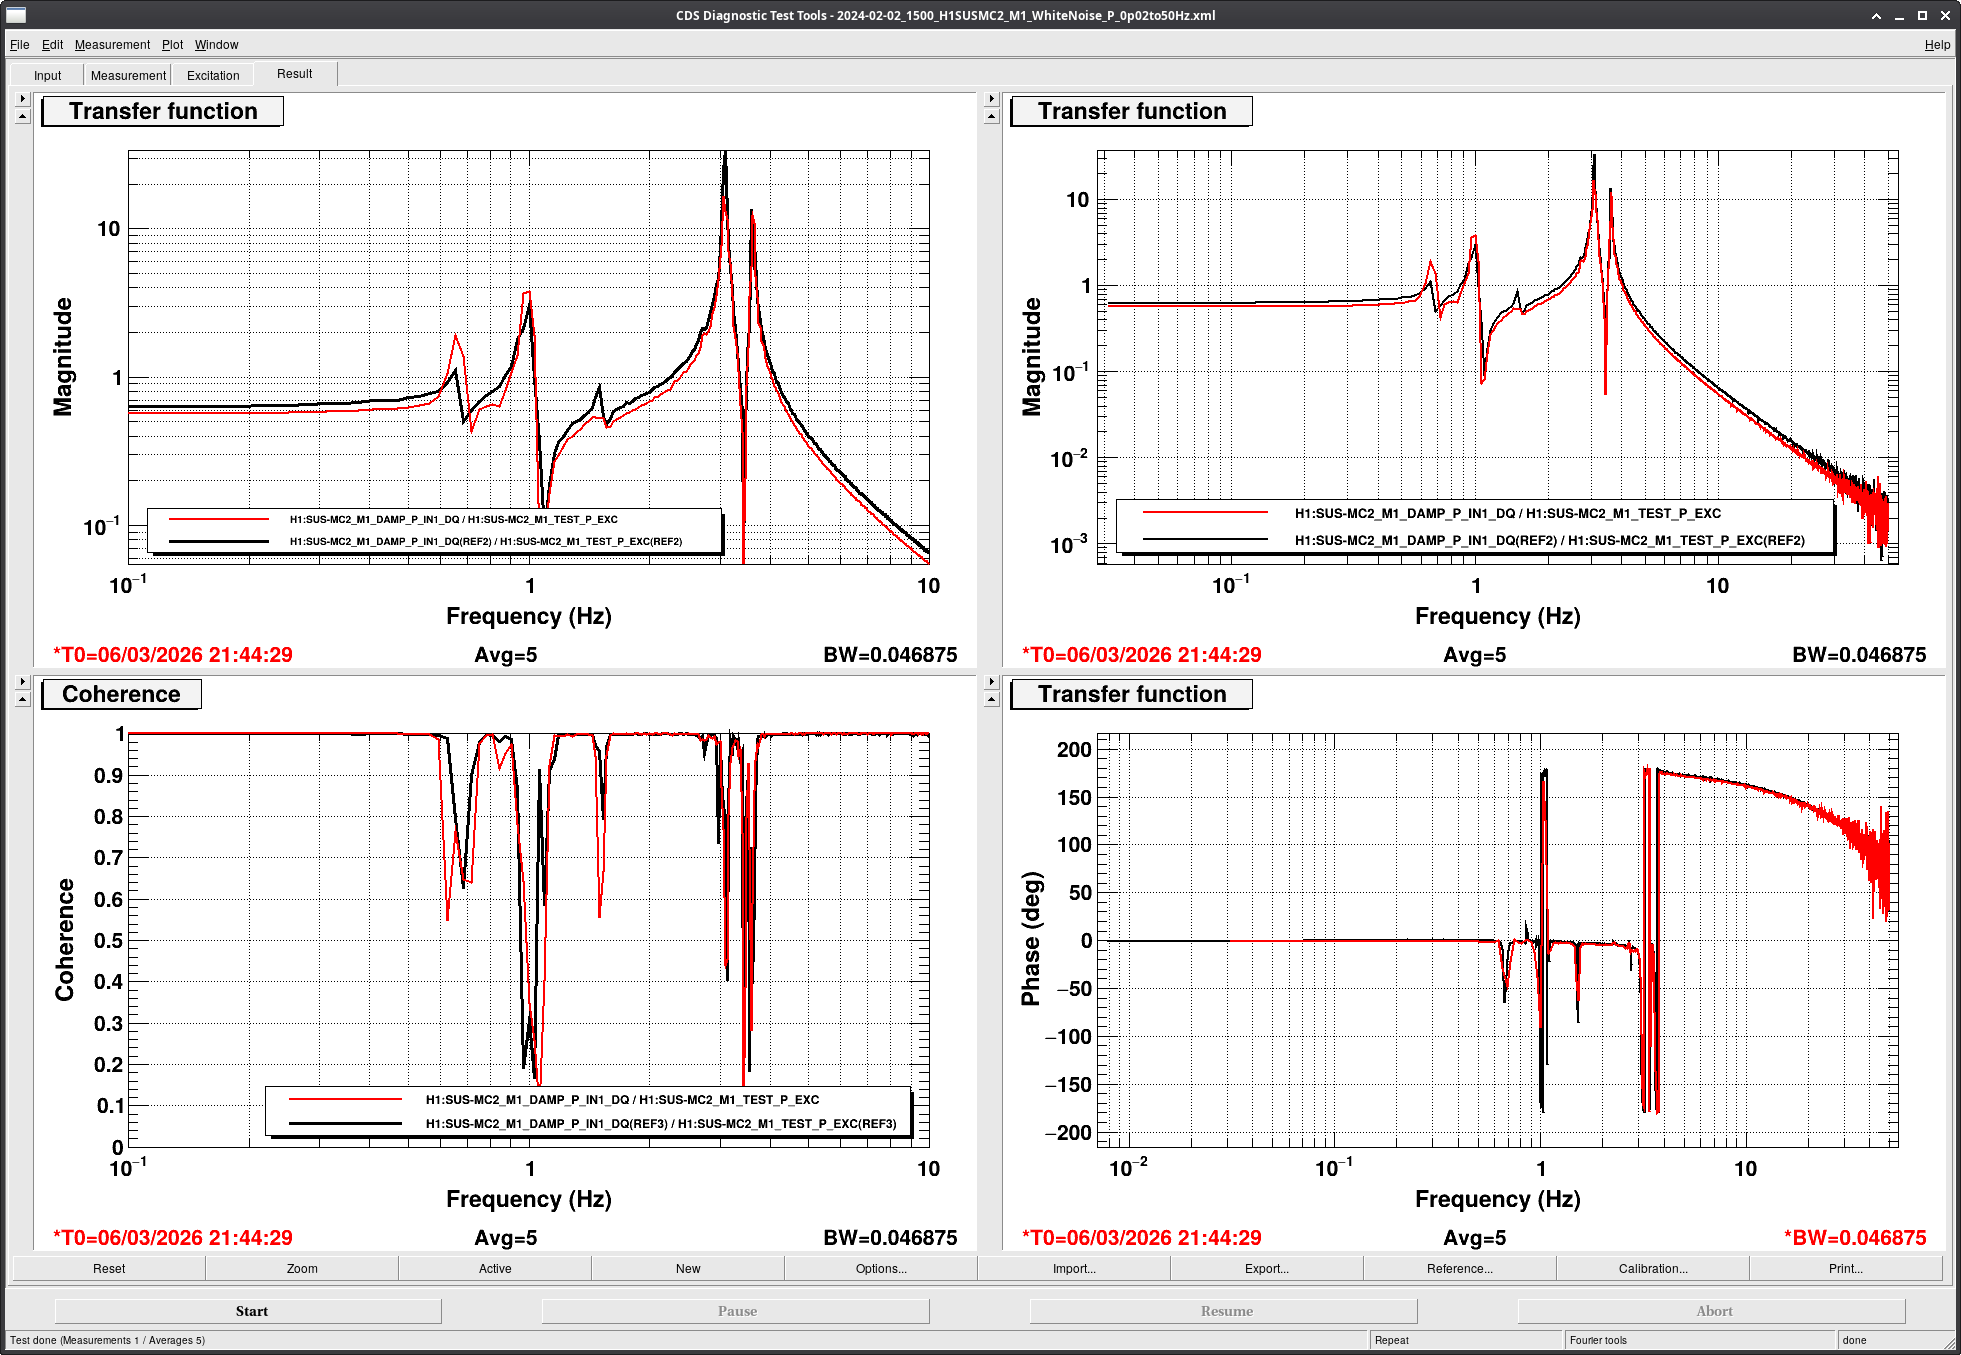

Remeasuring MC1_P after Marc swapped the coil driver reveals that the coil driver was not the issue.
(Travis S., Gerardo M.)
Pumpdown was started this morning, sorry no blowdown data. By the time I remembered to take the reading there was no more pressure inside the chamber. Travis connected all of the equipment while I wrestled with the viewport inspection.
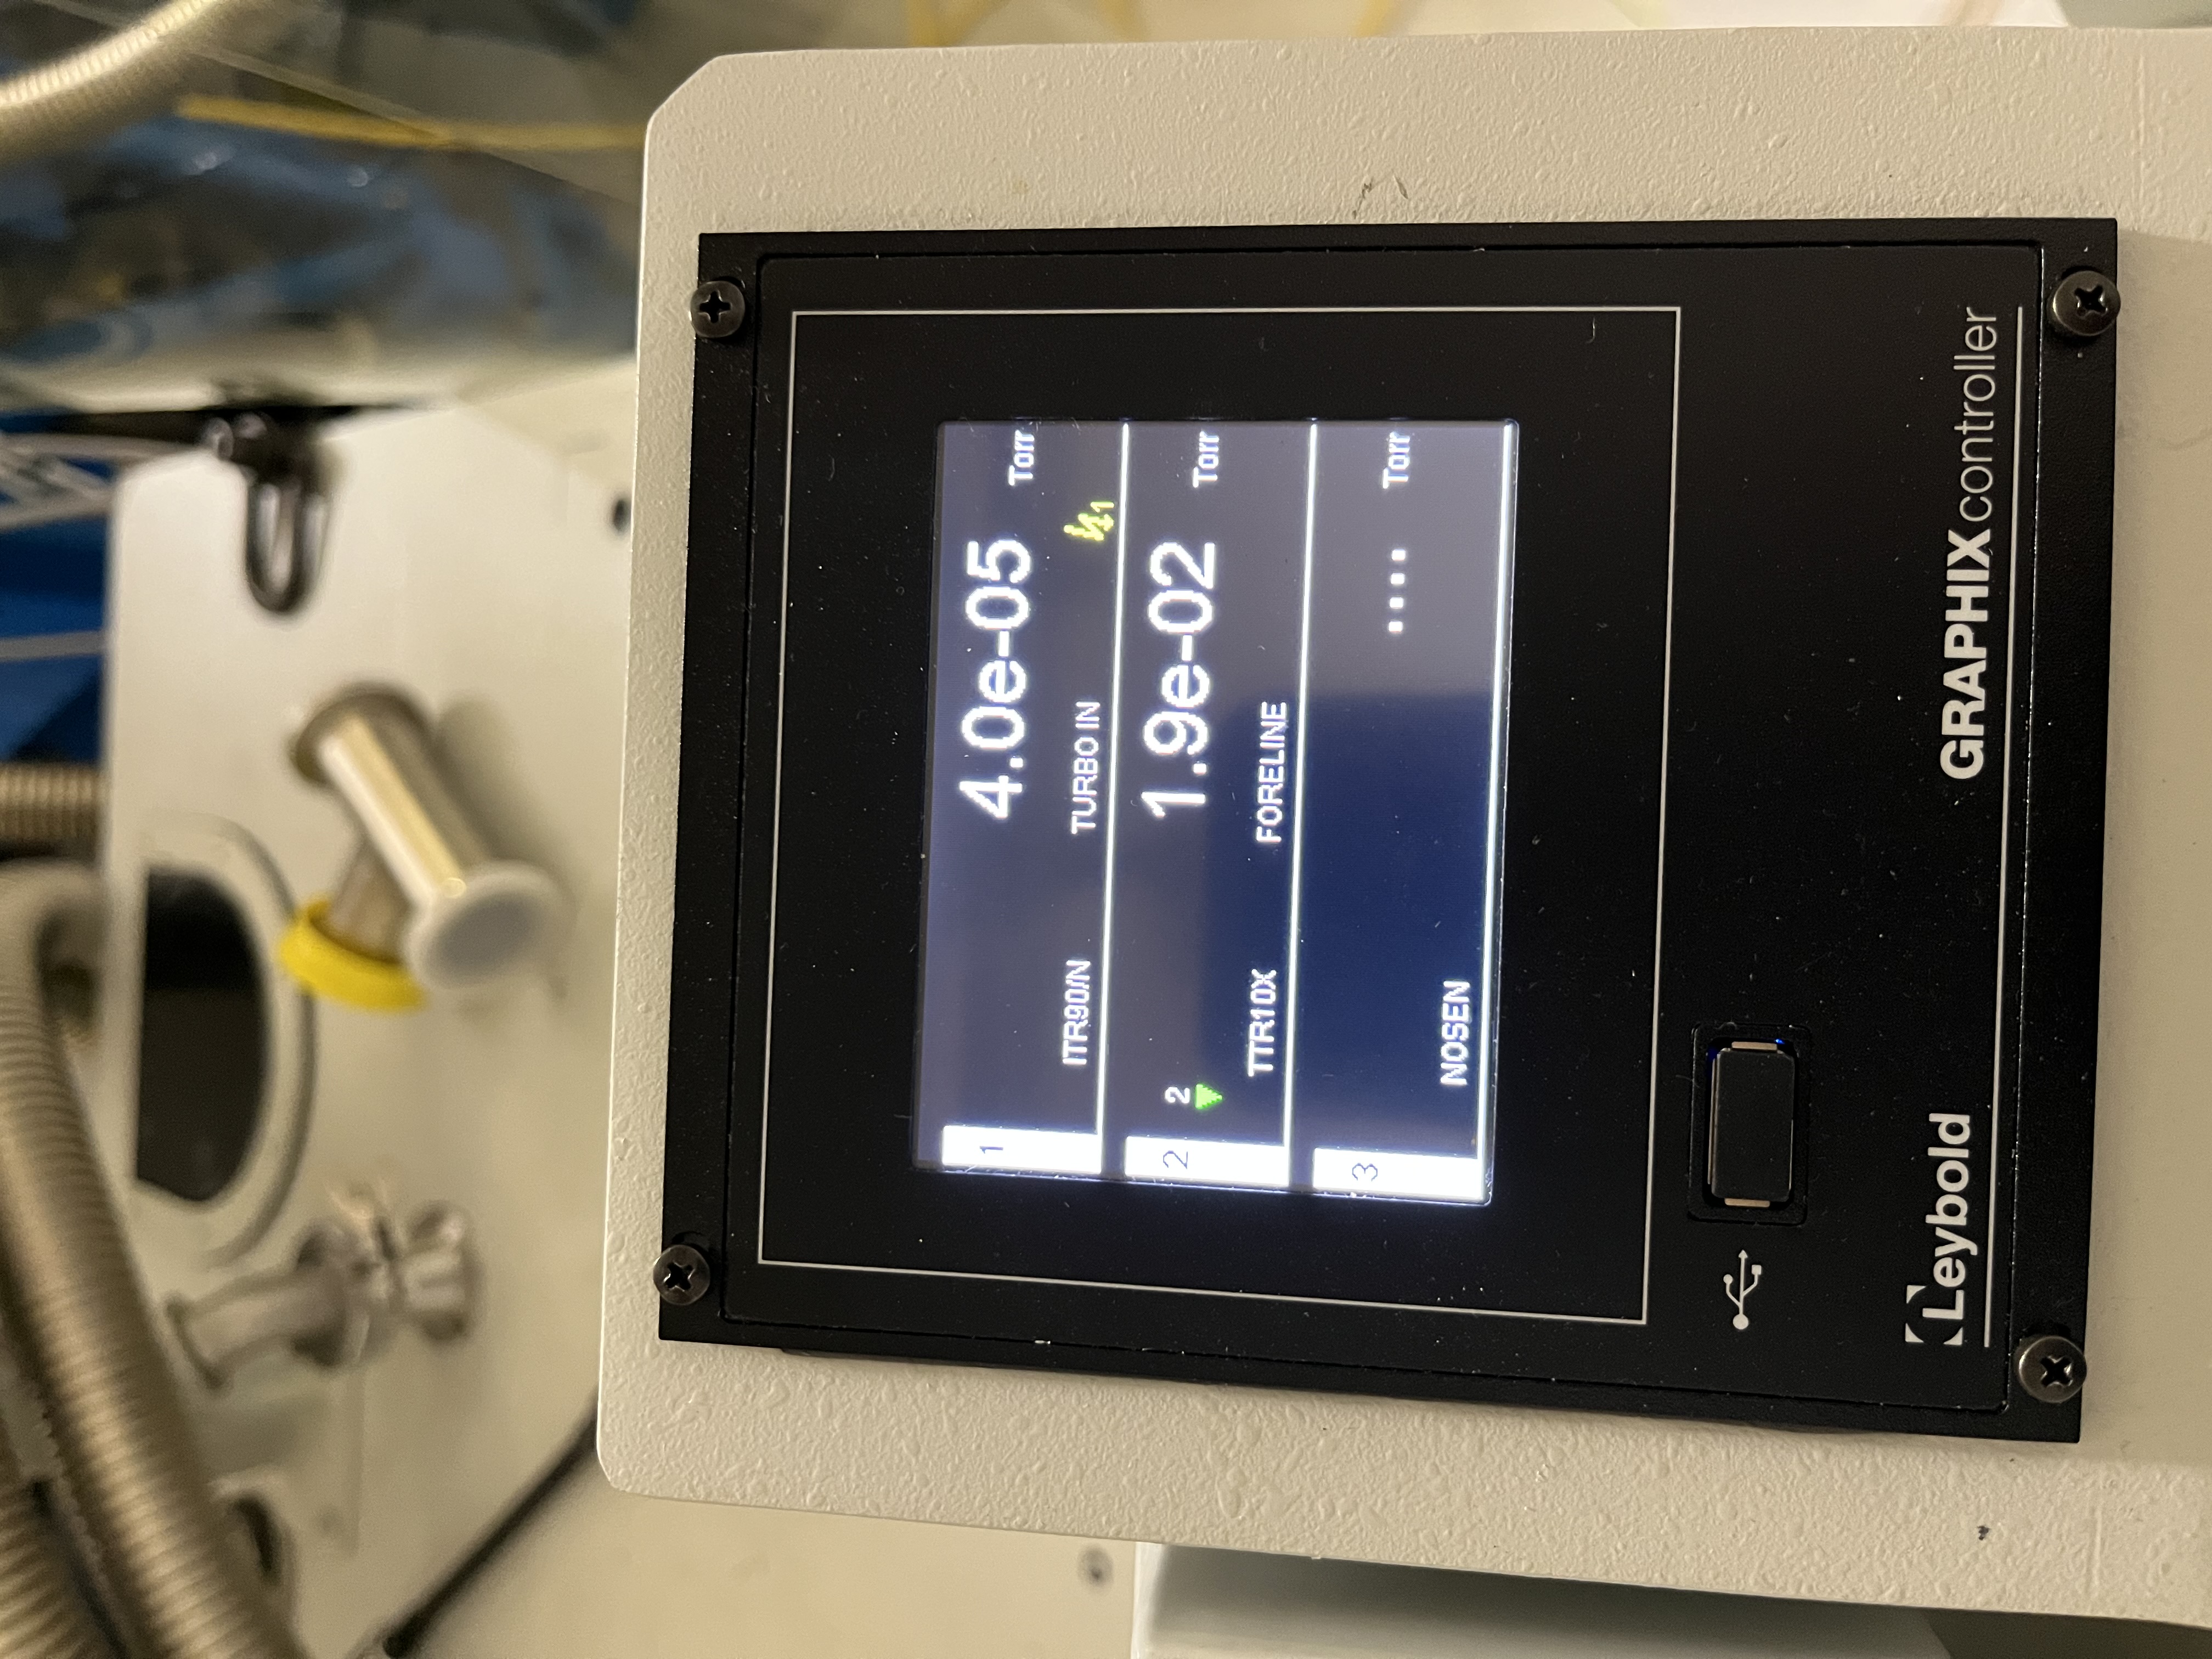
Pumpdown was started without an issue. We started with the scroll pump from the super sucker 500, the scroll pump of the SS500 cart brought the pressure down to 3.7x10-01 Torr, then we switched the cart to start pumping with the turbo pump/scroll pump. We had one trip of the system, usually due to a time out, but it only took a restart of the turbo pump and the pumpdown to continue.
Unfortunately the pumpdown had to be stopped at 8:00 PM local time, with a pressure of 4.0x10-05 Torr, at that pressure the set points had not activated on the SS500 cart controller, the set points are hard set and can't be modified from the SS500 controller screen.
Pumpdown will be restarted tomorrow morning.
Note, on the attachment, regarding the screens, no set points for channel 1.
Pumpdown Update.
Last Tuesday, HAM1 pumpdown was stopped for a few minutes to move the SS500 cart, the cart was moved away from the -Y door to open up space for the table. After the relocation of the SS500 cart the pumpdown for HAM1 was restarted.
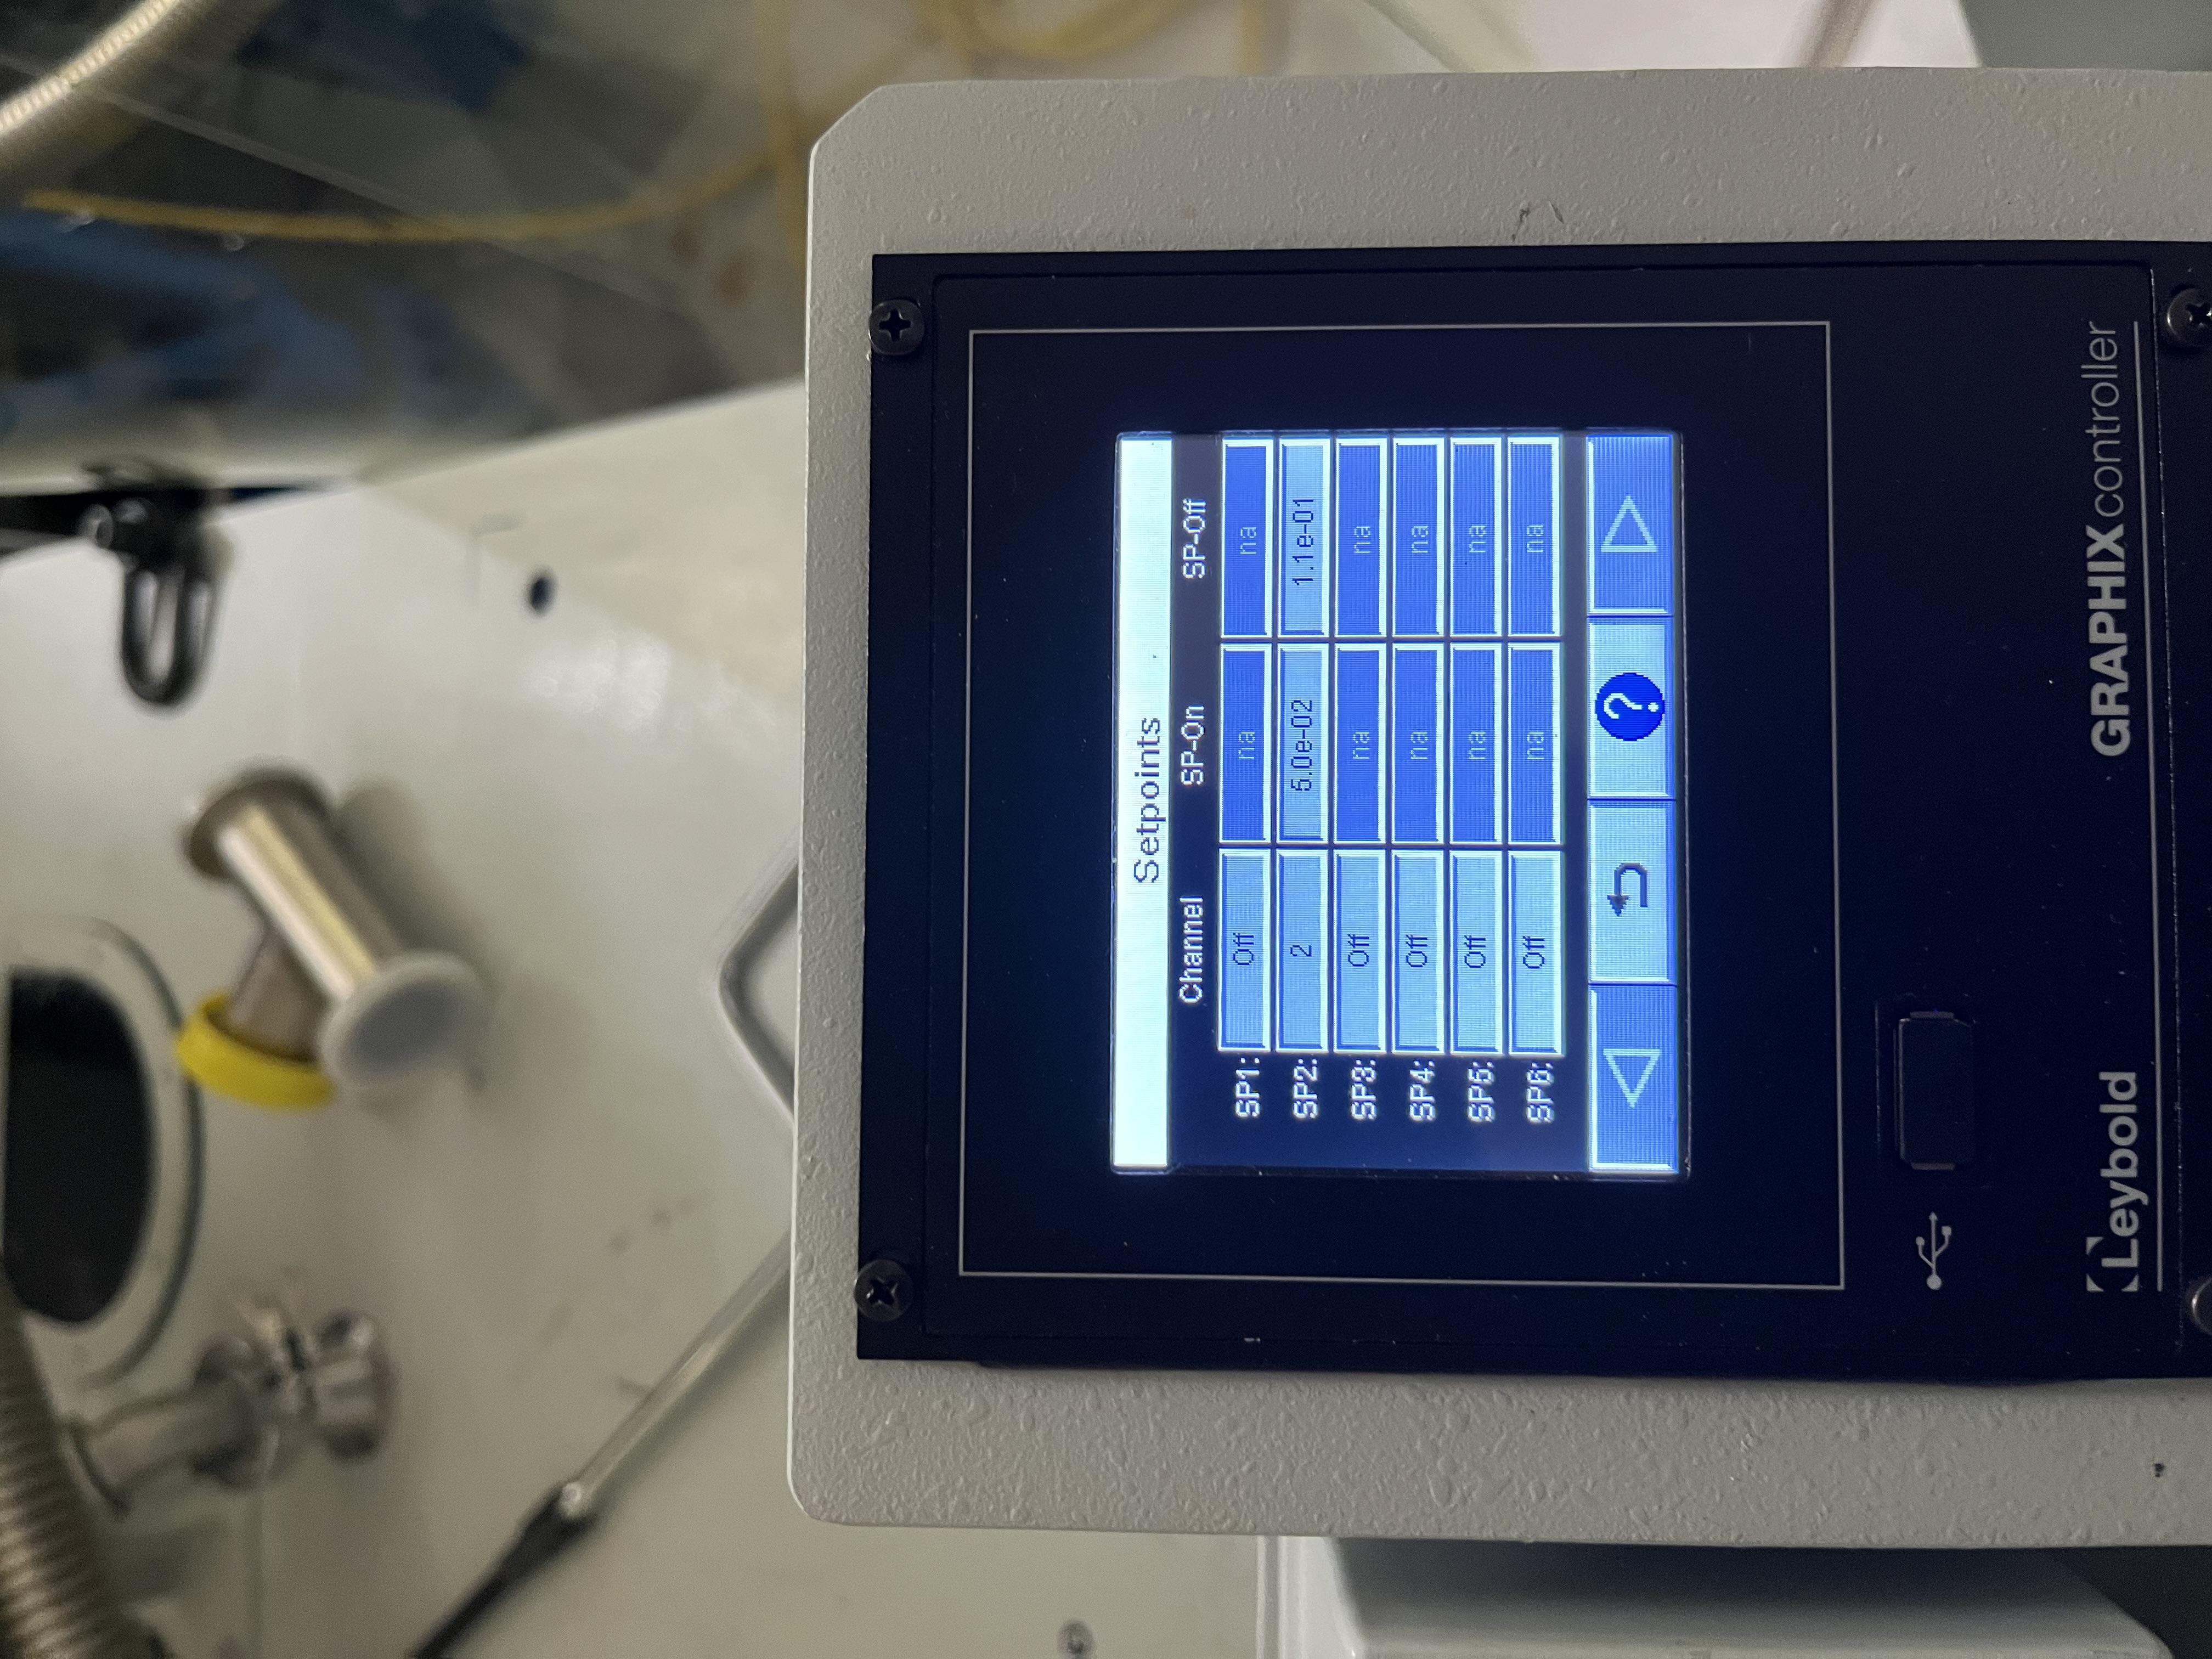
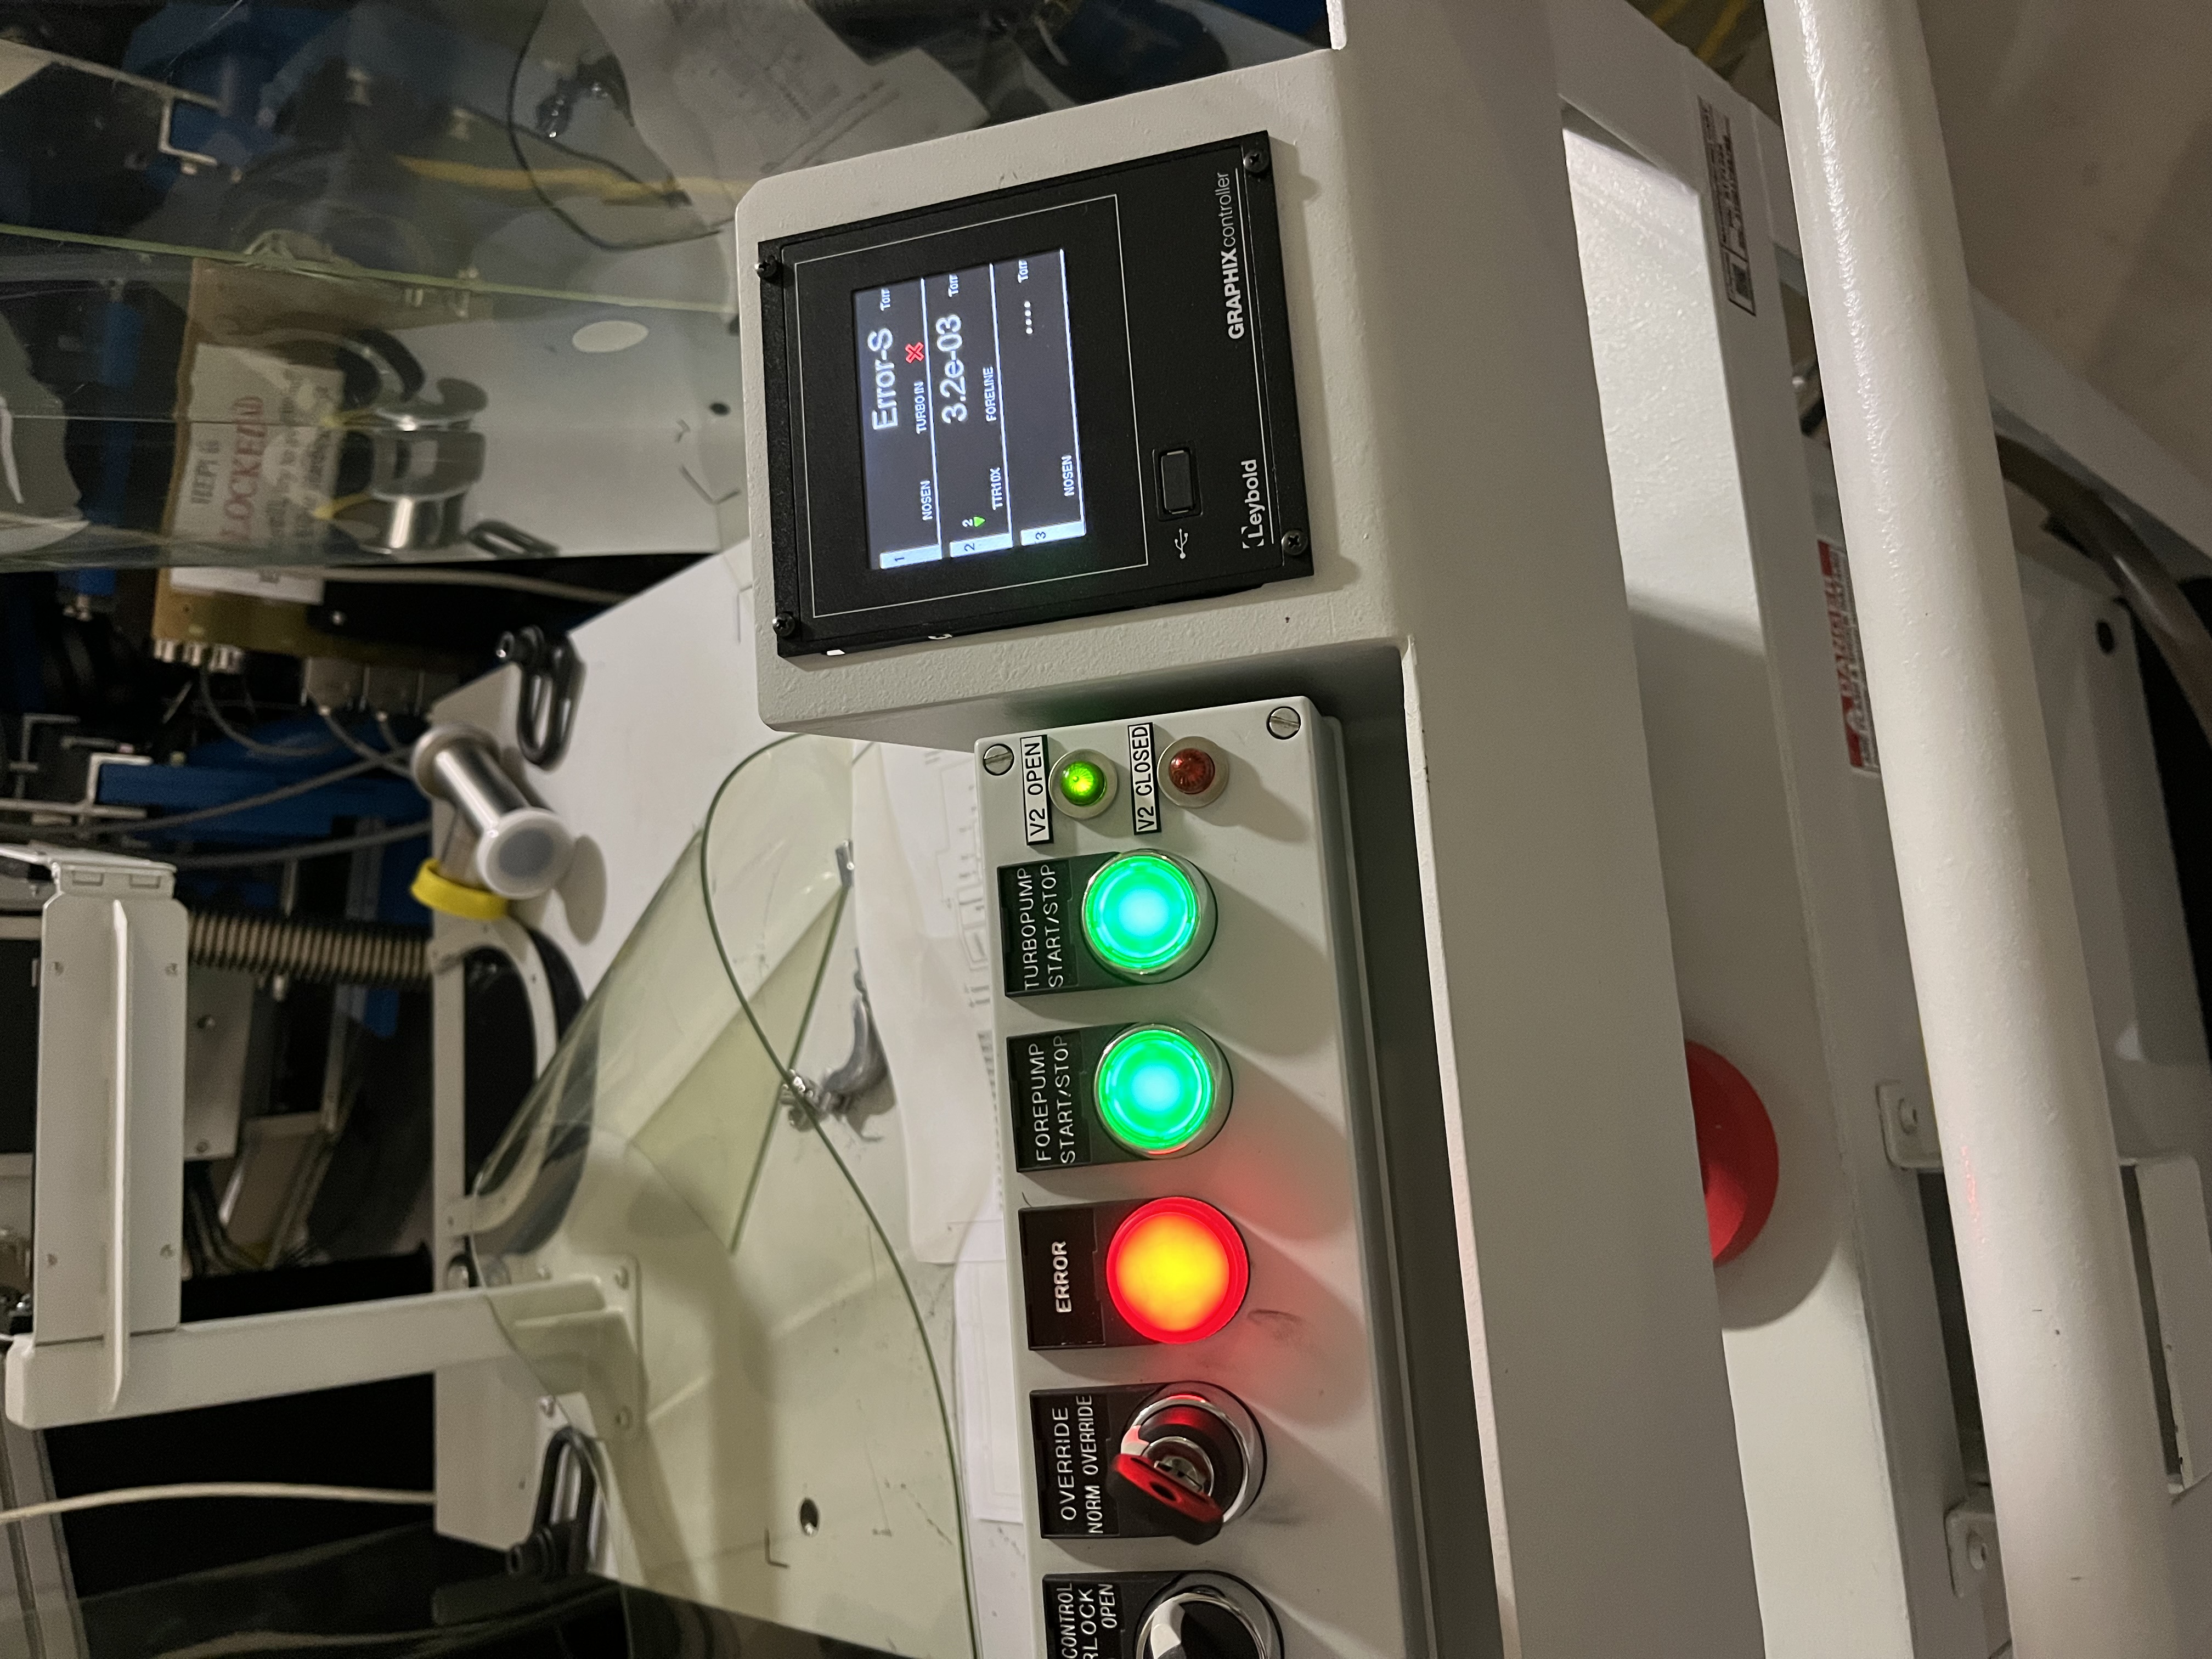
On Thursday we assisted Filiberto with the installation of a "split" cabling for the high voltage interlock at HAM1 gauge. Attached is a photo of the screen of the SS500 cart and its response to loosing gauge signal, the signal cable was removed from the vacuum gauge to install the "split". I set valve control to "open" and the override to "override" on the SS500 cart to prevent it from tripping, it worked. BTW, when the cart reported the Error-S it cleared the setpoints. Once the cable was restored and we had a signal at the SS500 cart, the setpoints were restored manually.
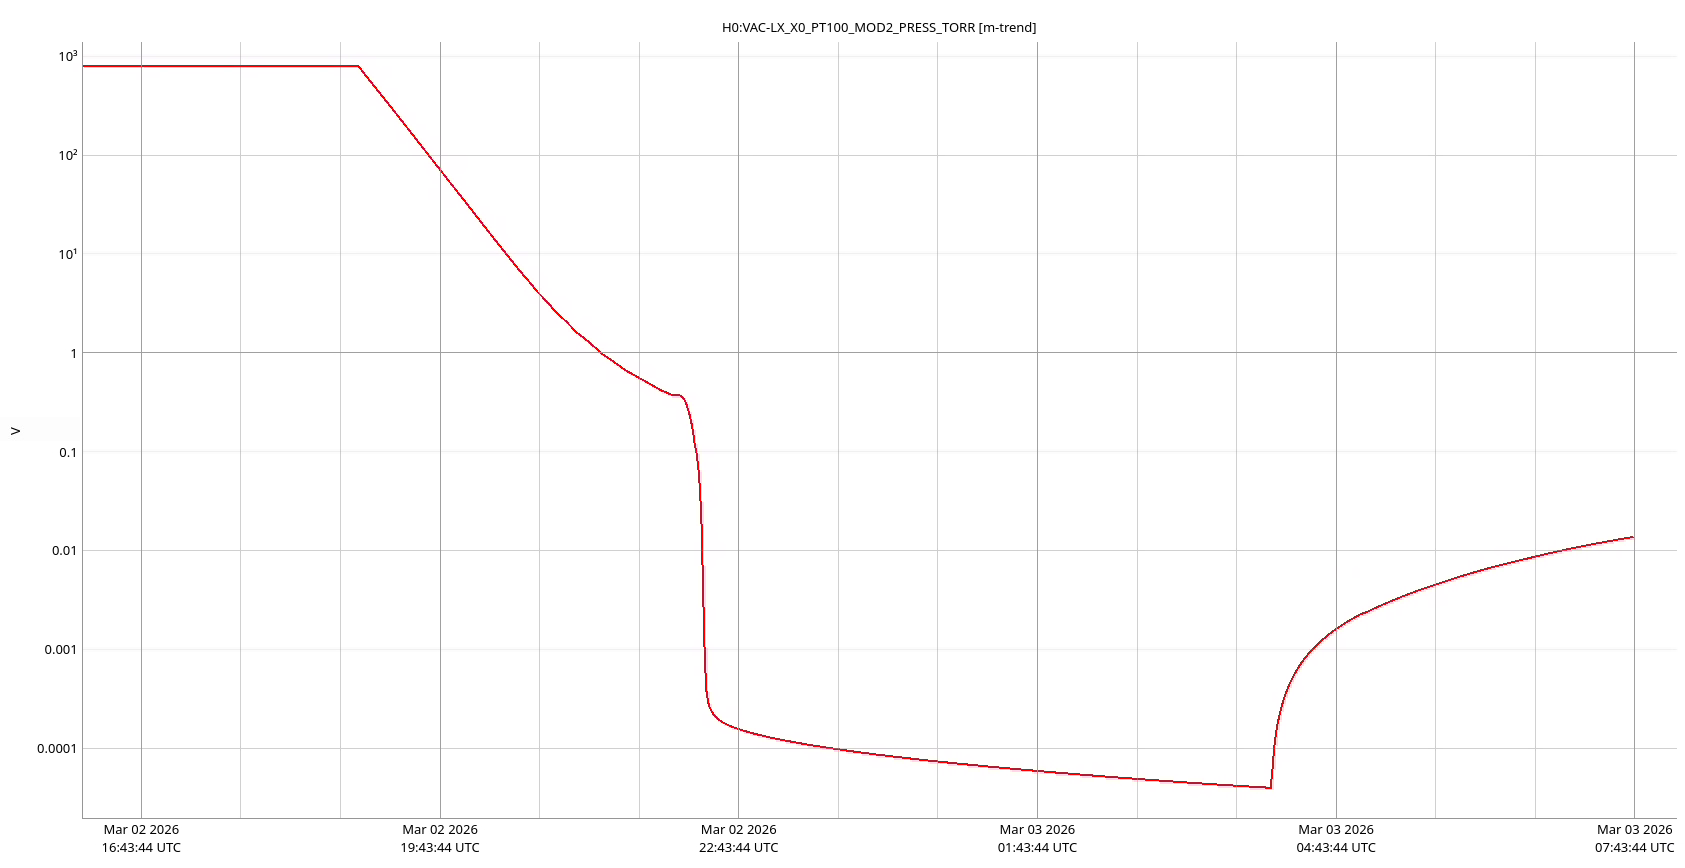
Pumpdown continues, pressure is currently at 2.77x10-06 Torr, attached is a trend of the pumpdwon pressure.
The HAM1 +Y door was installed today. Installation went smoothly and the O-ring cooperated by staying in place today. I will note that torquing the door bolts is becoming more of an issue due to wrench access being increasingly limited near the 5-way cross/feedthru areas now that all the in-air cables have been attached.
The HAM1/HAM2 annulus system is being pumped by 2 turbos/aux carts on the -Y side of the chambers. The mysterious ~order-of-magnitude pressure readout difference at the two carts on the shared annulus system is again present, as was noted the last time this annulus system was pumped down. Not an issue per se, just some vacuum phenomena that leaves us scratching our heads.
Vent Recovery Update
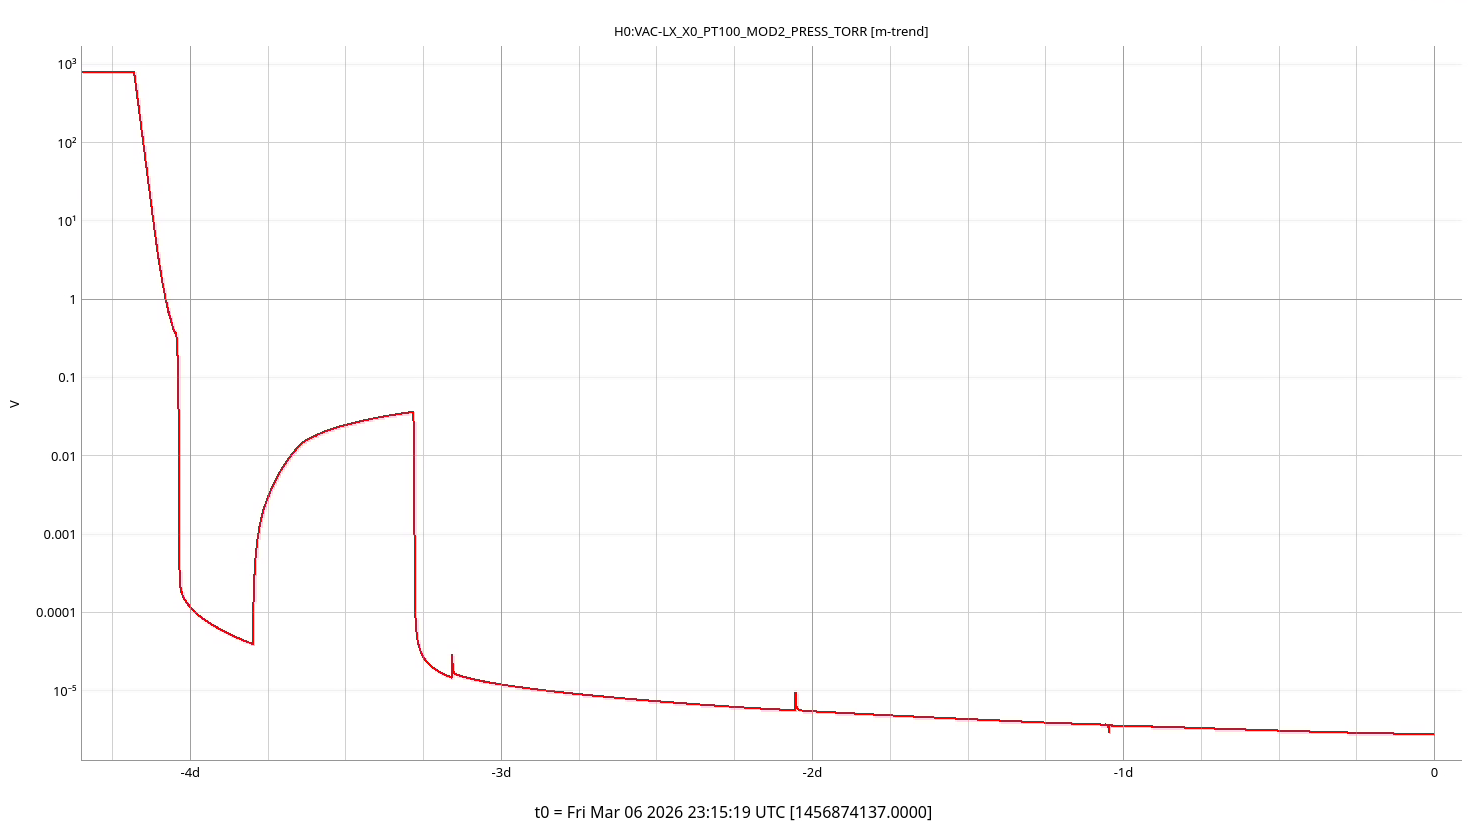
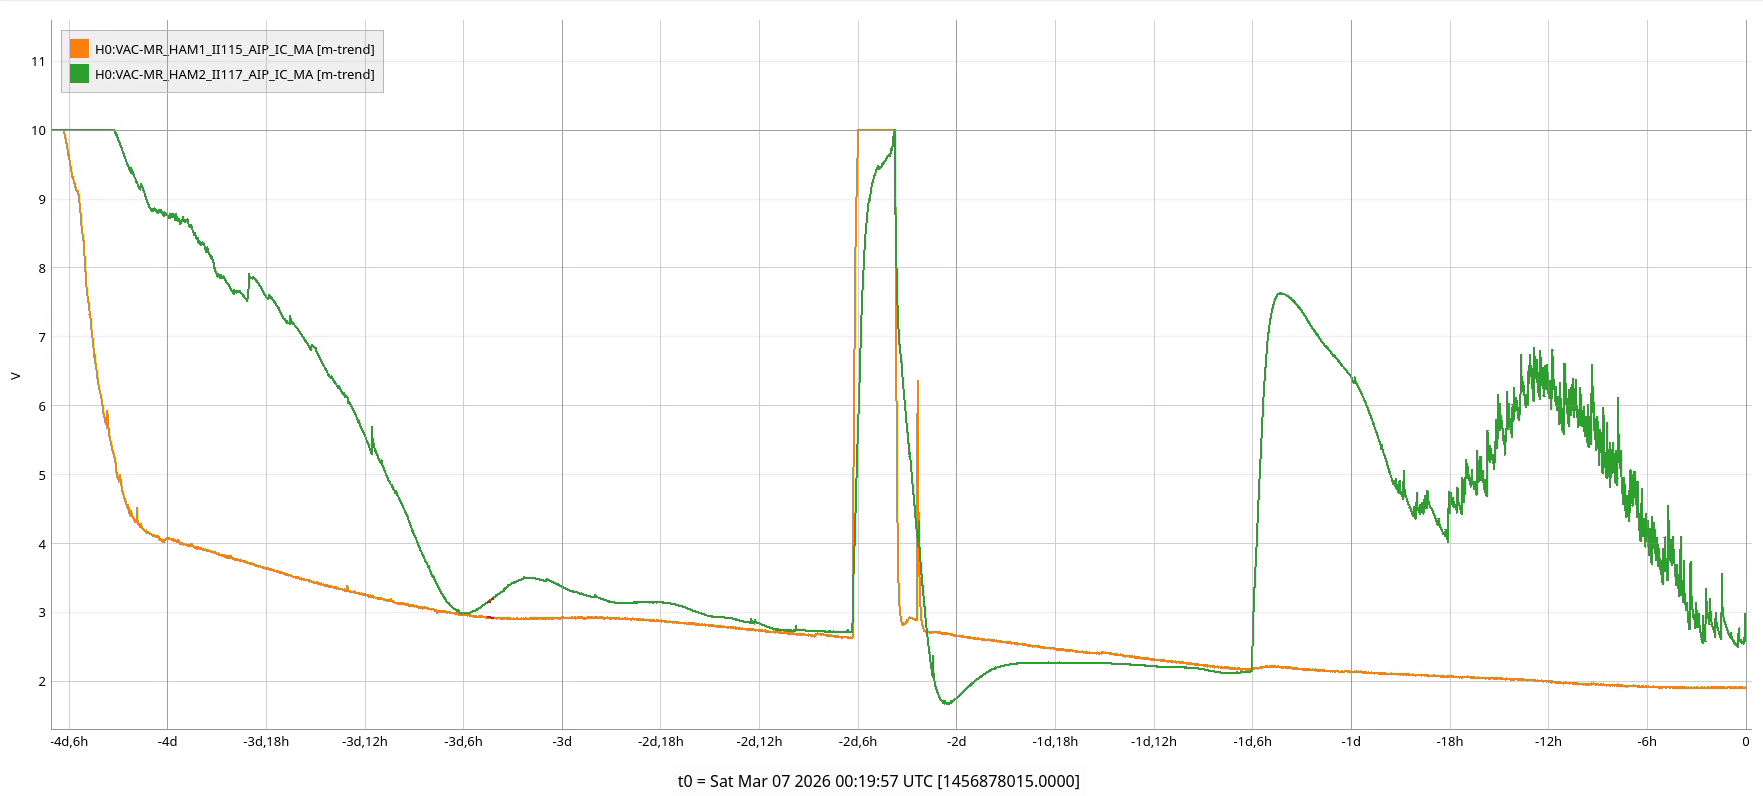
Annulus ion pumps for HAM1 and HAM2 continue to pumpdown, we closed the isolation valves for both of them, but the ion pumps were not able to maintain pressure. On 3/4/26 valves were opened again to continue using the aux carts, and yesterday (3/5/2026) we isolated the aux cart for HAM2 only, all of that can be seen on the attached plot.
Aux carts will be left pumping and annulus systems are going to be evaluated next Monday.
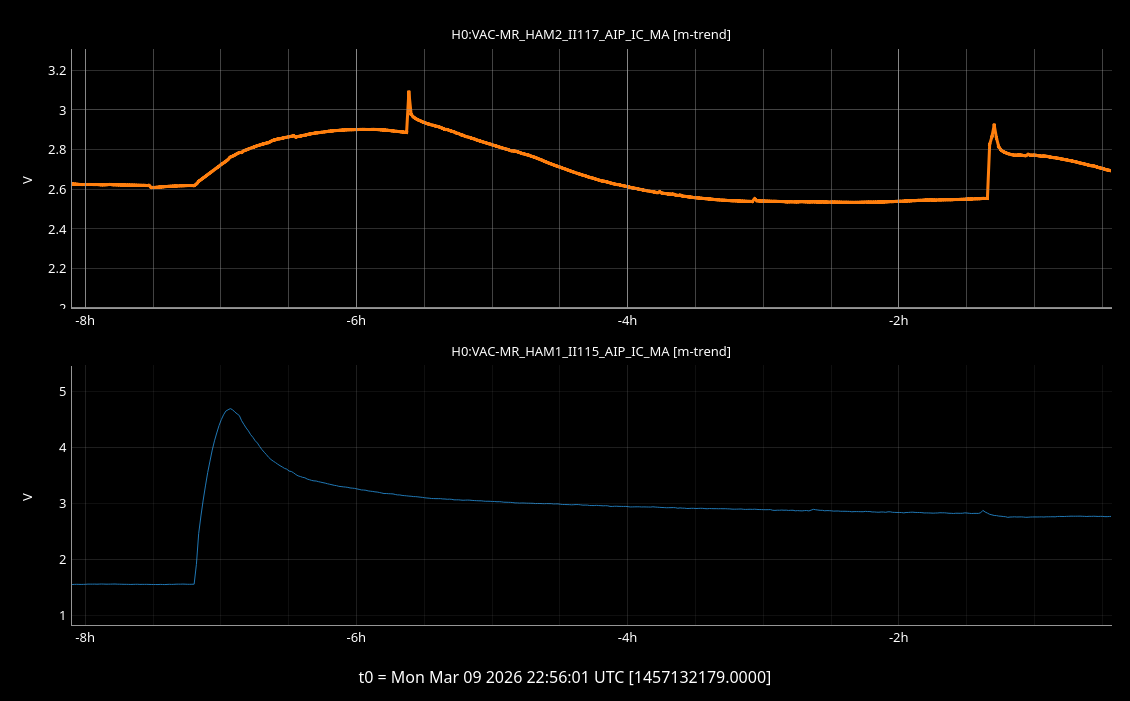
I isolated the HAM1 aux cart (HAM2 was isolated on Friday) from the annulus this morning. The IP current only rose to ~4.7mA before turning around showing it could hold the annulus pressure.
HAM1/2 annulus aux carts were shut down and decoupled this afternoon. The SS500 cart remains at HAM1 and will continue to pump until the pressure is low enough to valve in the HAM1 ion pump.
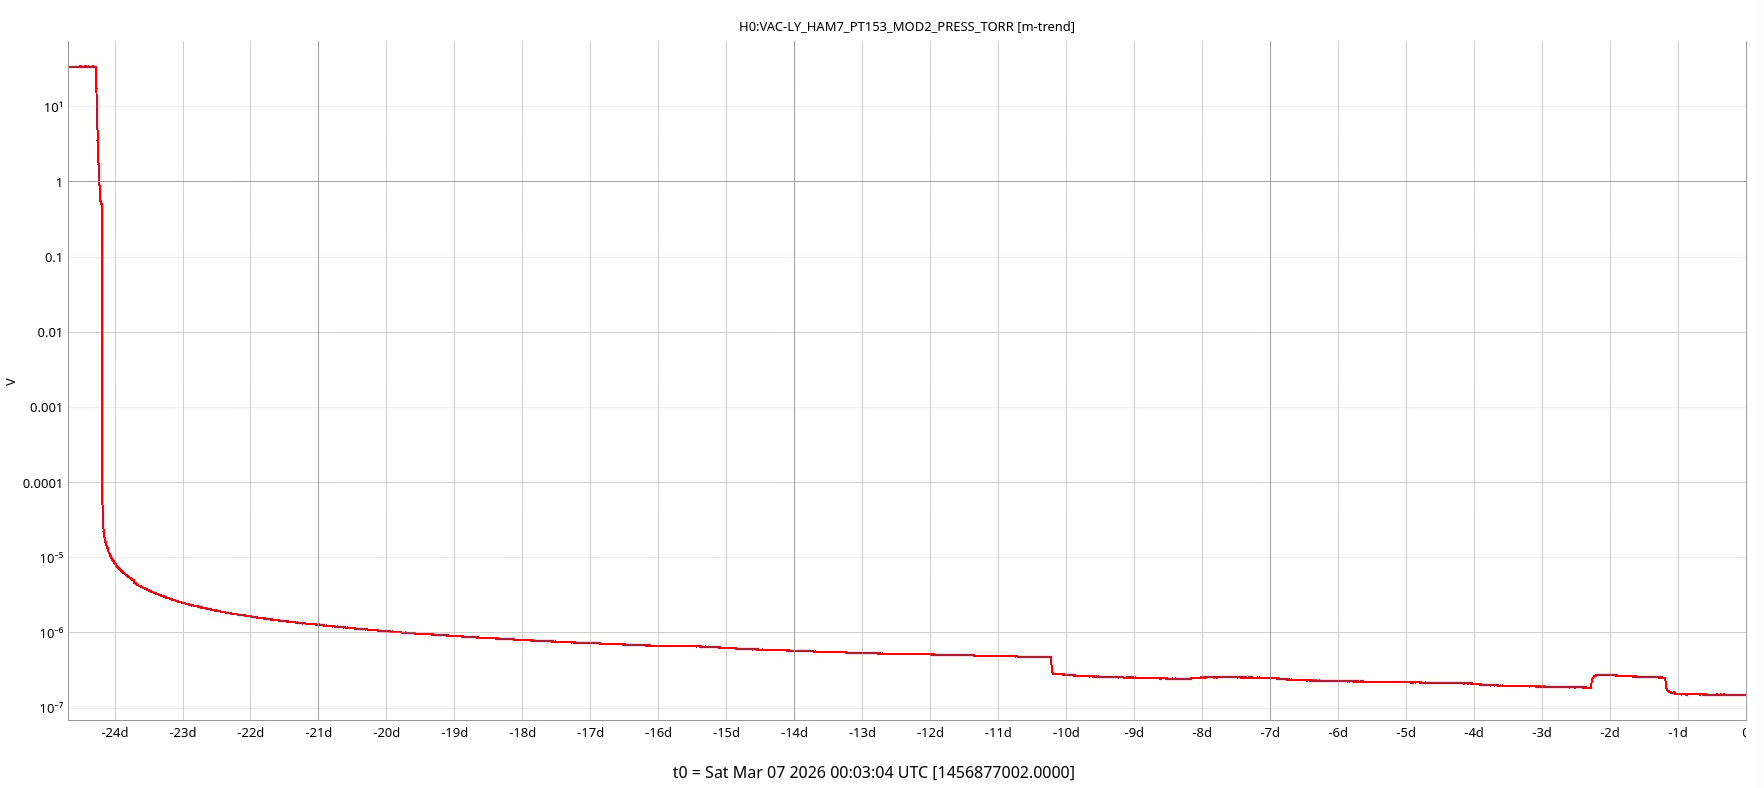
Now that HAM7 is at sufficient pressure (6.4E-7 Torr as of this post) we helium leak checked the two re-installed 12" CF blanks removed for table locking and the entire relay tube assembly which had been removed for the viewport adapter on HAM5.
The Helium background was unstable, so we turned on the HAM7 cleanroom (on 2/18 afternoon) to help flush the area of helium overnight.
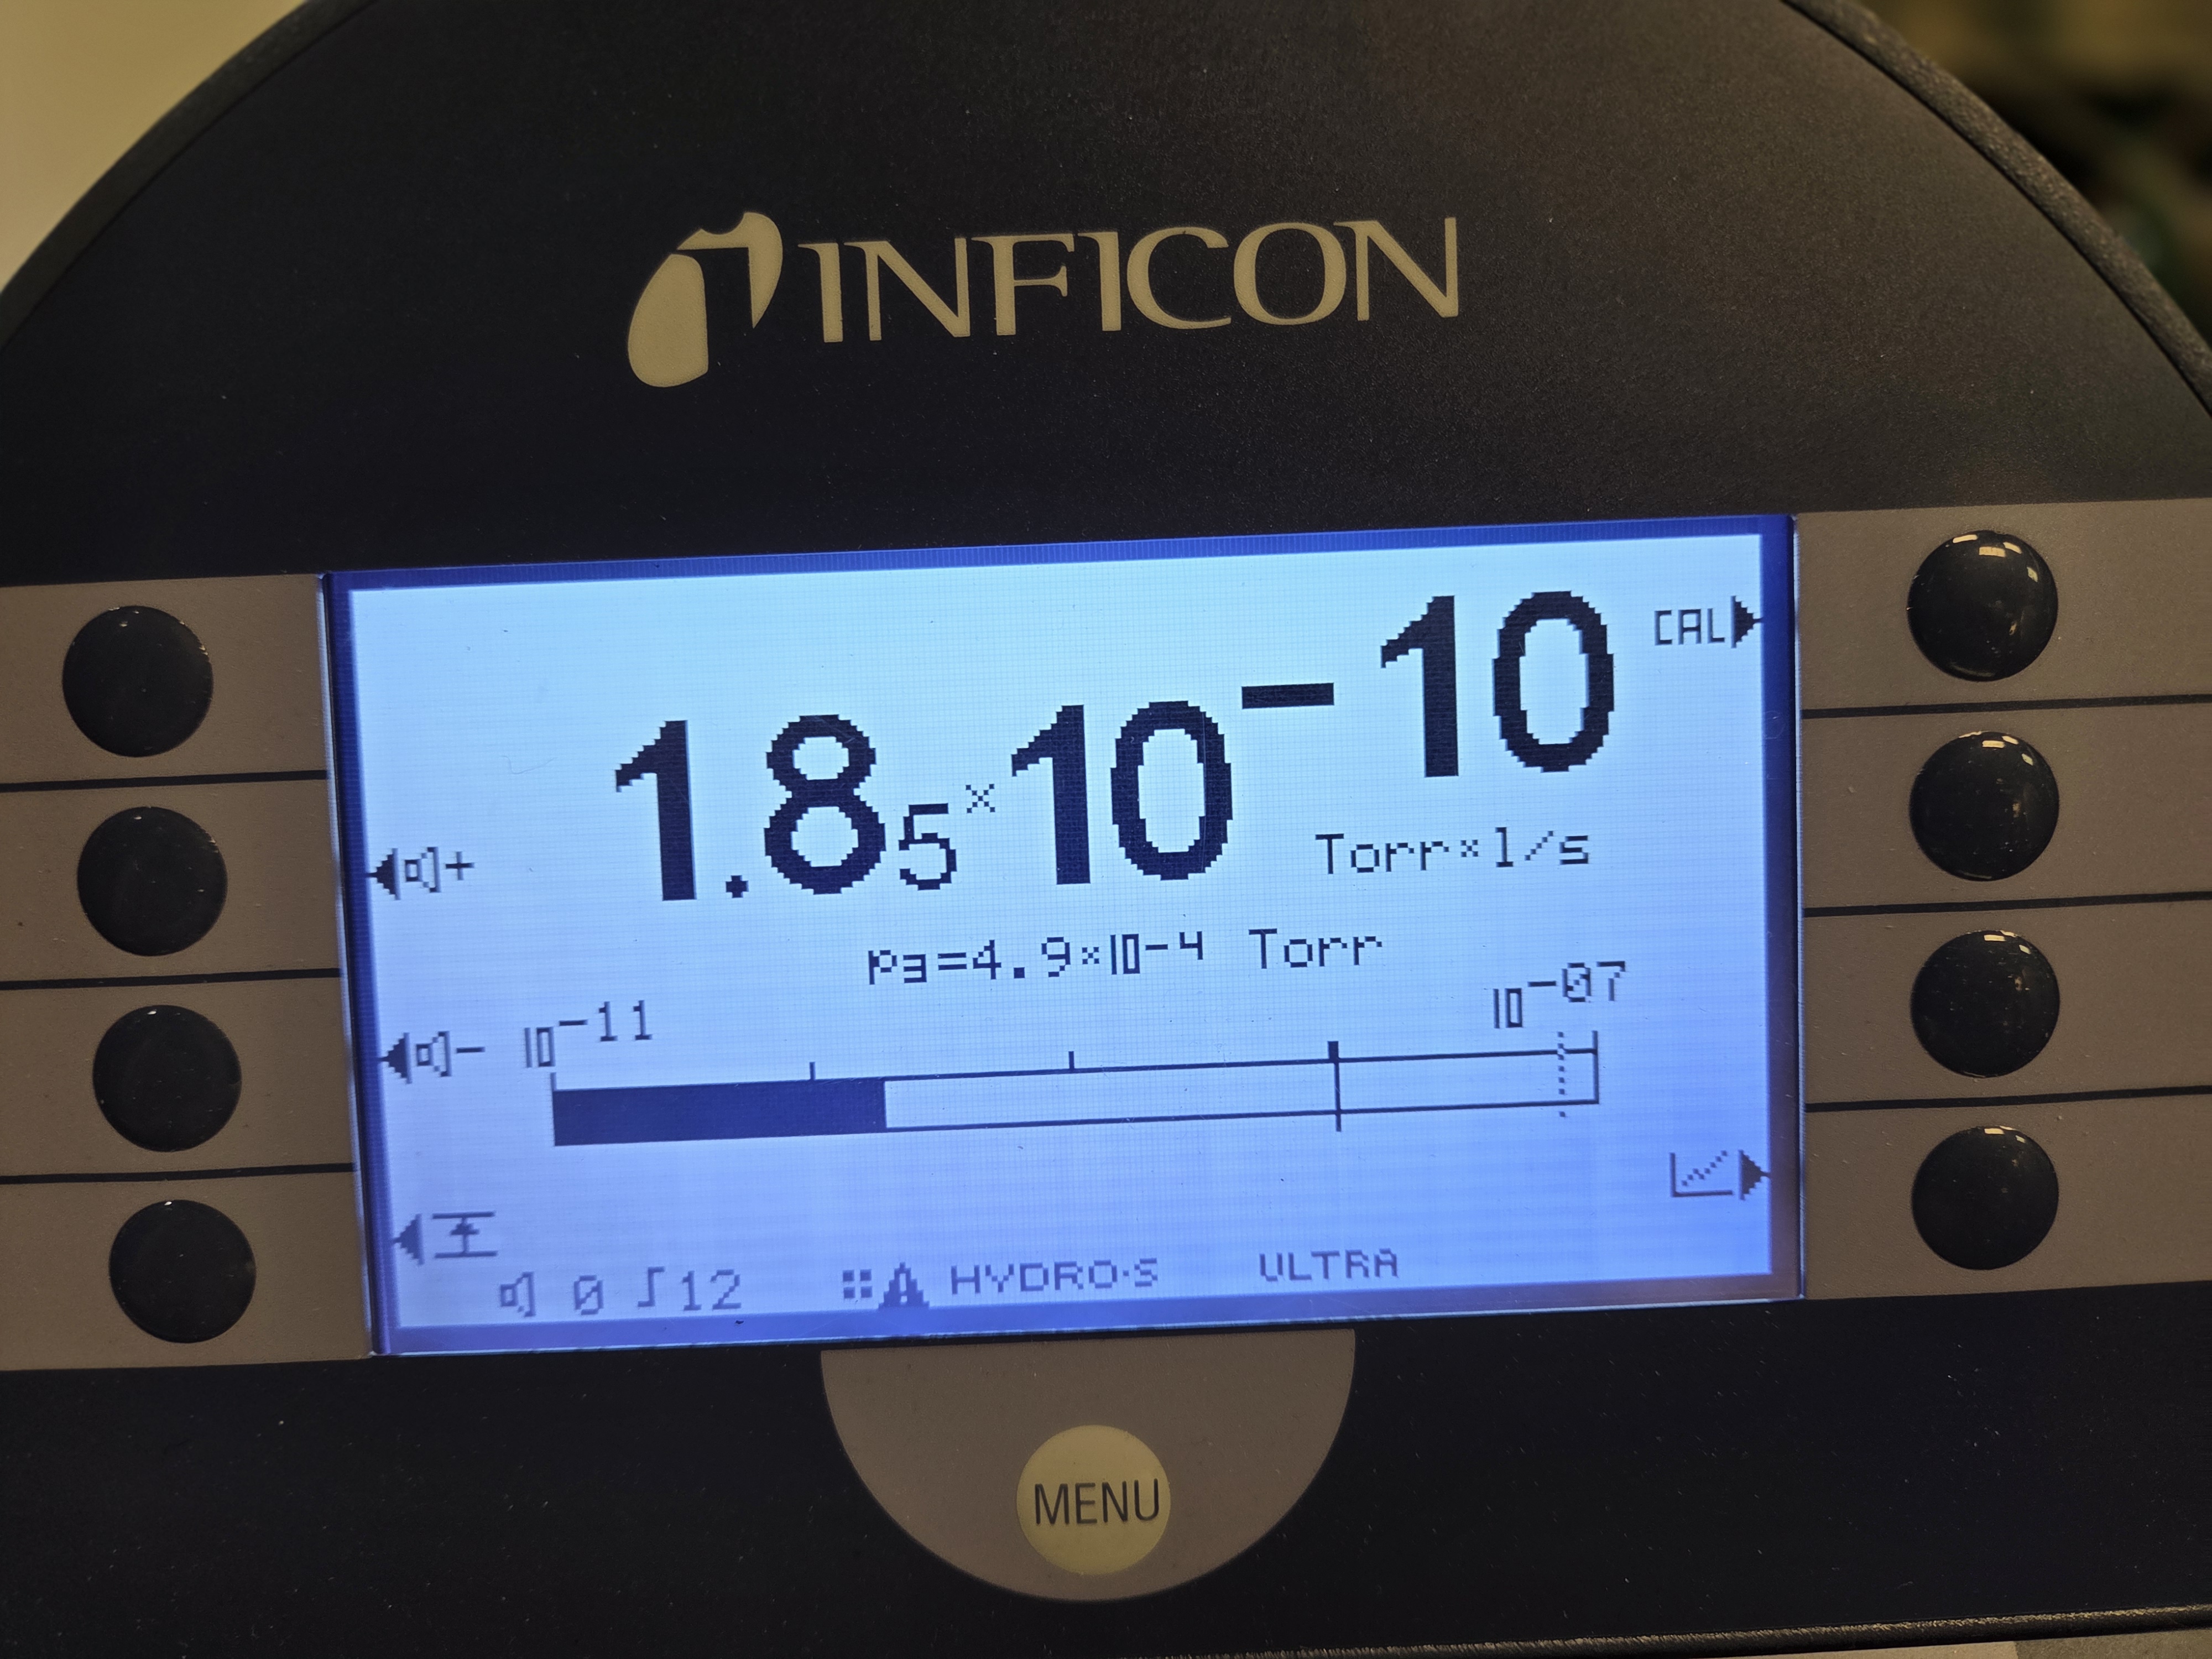
Today the background stabilized around 1.5E-10 Torr-l/s, so we were able to continue leak checking. No significant helium signal observed above the leak detector background which hovered between 1.5&2E-10 Torr-l/s during leak checking.
HAM7 continues to pump down with the turbopump, next steps are chamber RGA scans.
HAM7 RGA scans and scan information posted to T2600064. RGA is dirty, but the chamber comparison to last pumpdown (Mar 2024) is posted.
Late entry.
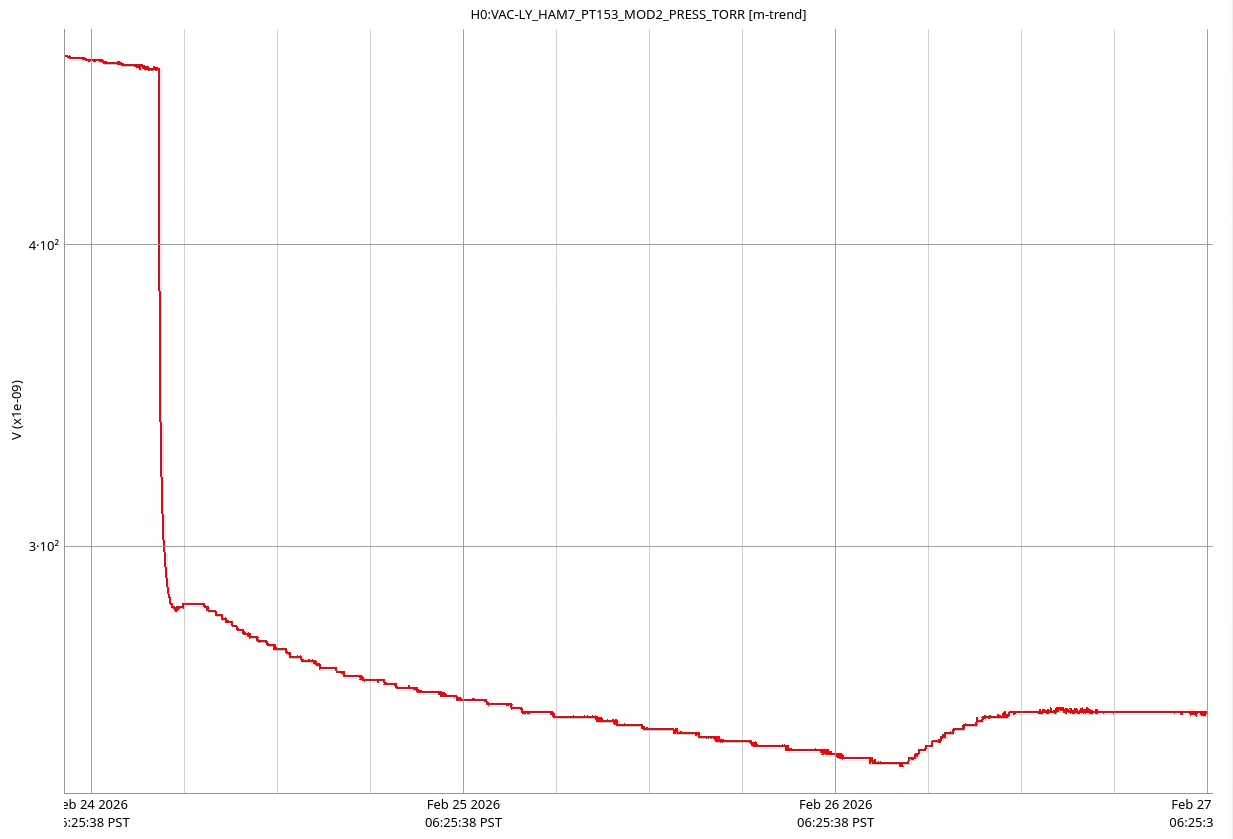
Last Tuesday, 2/24/2026, HAM7 ion pump was introduced to the chamber's main volume, and currently the chamber is pumped with both; the ion pump and the turbo pump. Attached is a trend snap of the chamber's pressure since the introduction of the ion pump.
Vent Recovery Update
On Wednesday (3/4/26) the turbo pump was isolated from HAM7 to leave the ion pump take care of the pumpdown.
Since the ion pump was able to take of the pumpdown on its own, on Thursday the SS500 cart then was turned off, and eventually detached from the turbo pump at HAM7. HAM7 is back to normal operations.