[Rodica, Kiwamu, Dick, Michael R., Keita, Paul]
Last night and today we finally managed to get what looked like a good measurement of the IMC pole response. Here is a brief description of the measurement setup:
Swept sine signal applied directly from the SRS785 to the AOM driver box inside the PSL. Frequency range was 1kHz to 100kHz, signal amplitude was 400mV pkpk. 1000 intergration cycles, and 101.56ms integration time. Measurement was a transfer function from the DCPD on the PSL installed recently (PDA55) to the DCPD on the IOT2L table (DET100A). ~200mW injected to modecleaner.
The PDA55 on the PSL table didn't give us an observable signal from the amplitude modulation previously when we tried on Wednesday. Rodica checked the Thorlabs recommendation for best linear performance, which states that the maximum intensity should be less than 10mW/cm^2. Even with a very low beam power we may have been exceeding this value due to the very small beam size. The PD was therefore moved to have a larger incident beam size.
We were struggling to get a decent signal on the SRS785 until Kiwamu suggested reducing the light power reaching the PDs to less than 1V. Once we brought the power down to less than 600mV, we were able to see a decent signals on the SRS785 and began taking TFs.
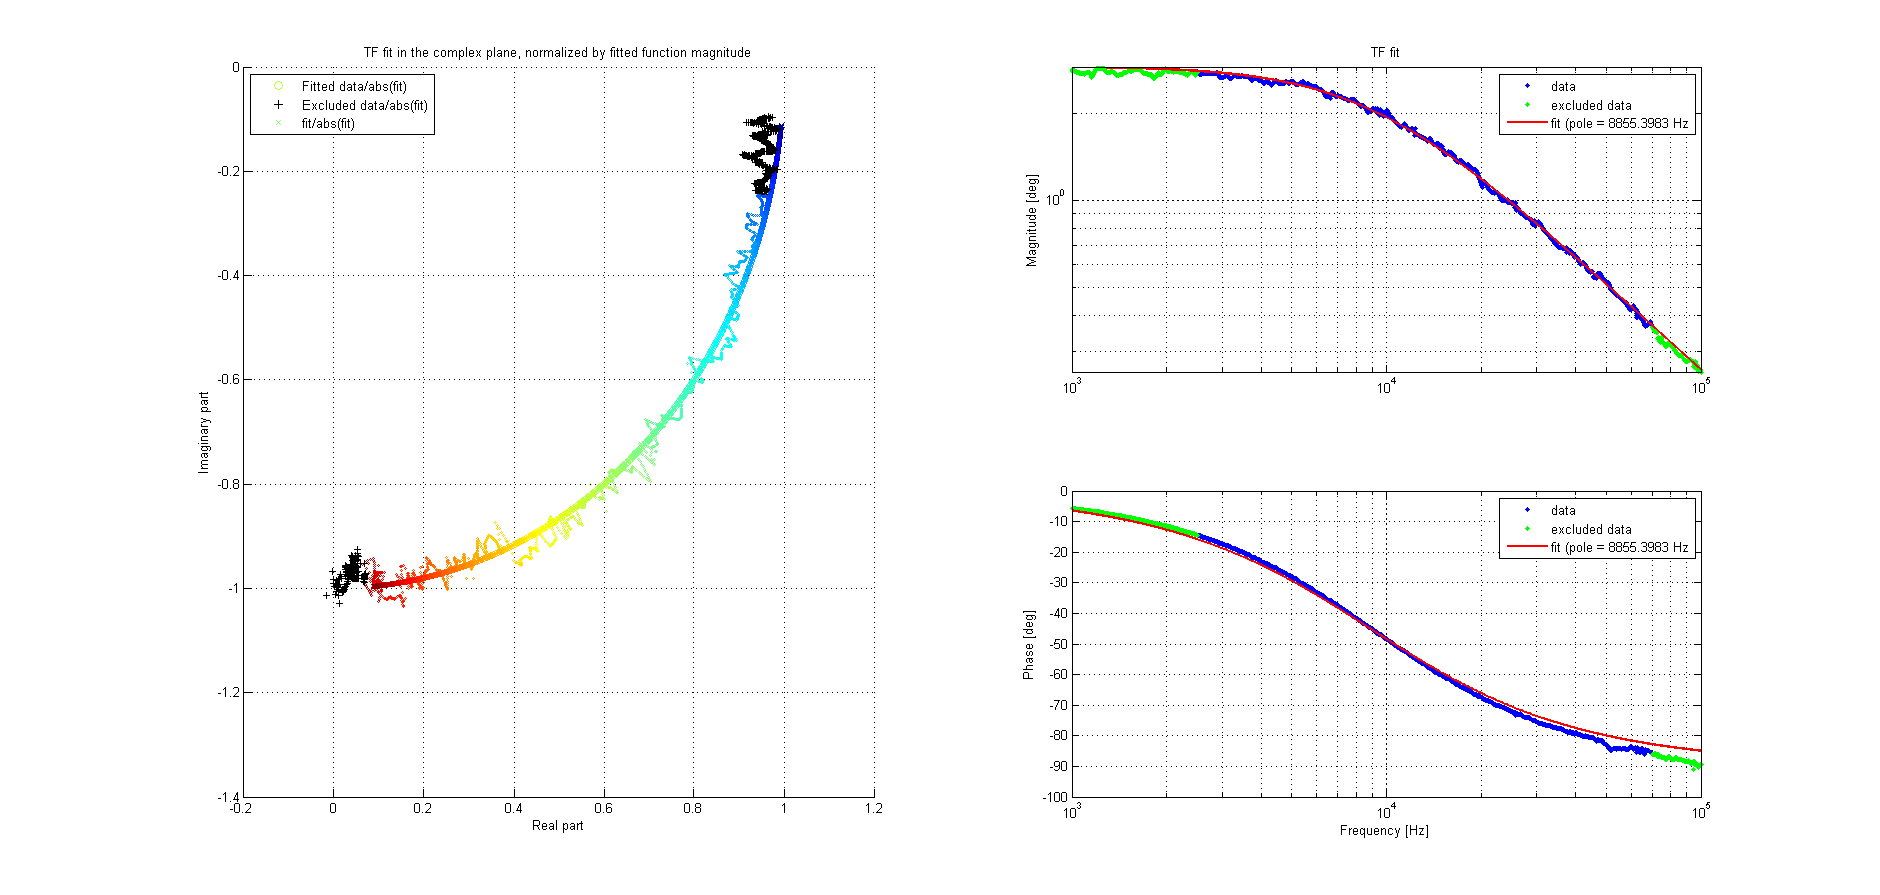
The first attached transfer function is directly from the PSL PD to the IOT2L PD. In the event that the response of both PDs is linear, this should just give the cavity response. However, we noticed that the phase dropped below -90deg on the TF, indicating the presence of another pole - likely that of one of the PDs. We therefore took a TF from the PSL PD to the IOT2L PD, with the IOT2L PD repositioned in the IMC REFL path and the cavity misaligned (as Giacomo did previously). This TF is the second attached plot, and shows the pole of the IOT2L PD. Finally, we then divided the first transfer function by the second to eliminate the different PD response, leaving us just with the cavity response. This transfer function, along with a fit, is shown in the third attached plot.
For now, I just fitted the phase of the pole measurement, which gave the result 8812.36 Hz for the cavity pole. I'll try a complex data fitting routine soon and post the result.