Displaying reports 821-840 of 89075.Go to page Start 38 39 40 41 42 43 44 45 46 End
Reports until 09:34, Thursday 02 July 2026
H1 CDS (SEI, VE)
filiberto.clara@LIGO.ORG - posted 09:34, Thursday 02 July 2026 - last comment - 16:27, Thursday 02 July 2026(90876)
EY Beckhof HEPI Controller - Level Sensor Monitoring

ECR E2200043

A RIB2401D relay was installed at EY for monitoring the HEPI reservoir level on 7/1/2026. The same scheme is used in the corner station. The RIB2401D relay is enabled by the reservoir level sensor. The outputs of the RIB2401D will be used to enable the motor control panel and status readback signal of the level sensor. The EL1094 terminal was replaced with EL1004.

While installing the new RIB2401D relay we glitched the 24V. This caused the Vacuum Beckhoff computer to reboot. See alog 90866.

D. Barker, F. Clara, P. Thomas, J. Vanosky

Comments related to this report
filiberto.clara@LIGO.ORG - 16:27, Thursday 02 July 2026 (90886)

Same work completed at EX. Vacuum Beckhoff computer glitched, same as EY.

H1 General
anthony.sanchez@LIGO.ORG - posted 08:07, Thursday 02 July 2026 (90870)
Ops Thursday morning report.

TITLE: 07/02 Day Shift: 1430-2330 UTC (0730-1630 PST), all times posted in UTC
STATE of H1: Planned Engineering
OUTGOING OPERATOR: None
CURRENT ENVIRONMENT:
    SEI_ENV state: MAINTENANCE
    Wind: 17mph Gusts, 9mph 3min avg
    Primary useism: 0.02 μm/s
    Secondary useism: 0.06 μm/s 
QUICK SUMMARY:

Work Trello is suggesting today:
HAM3/BSC2 - In chamber work, after FARO/HEPI work - Suspend, TFs (Ibrahim, Betsy, Oli)
Finish CPS upgrade in HAM3
Install CRS in HAM3
BBSS - Diagonalize Pit to Yaw coupling.... again? 
HAM7 - In-chamber SQZ work continued, in local laser Haz
VAC View port inspections

Notes: BS CPS glitch has been happening all night.


H1 SEI (SEI)
shoshana.apple@LIGO.ORG - posted 18:31, Wednesday 01 July 2026 - last comment - 09:24, Friday 28 August 2026(90851)
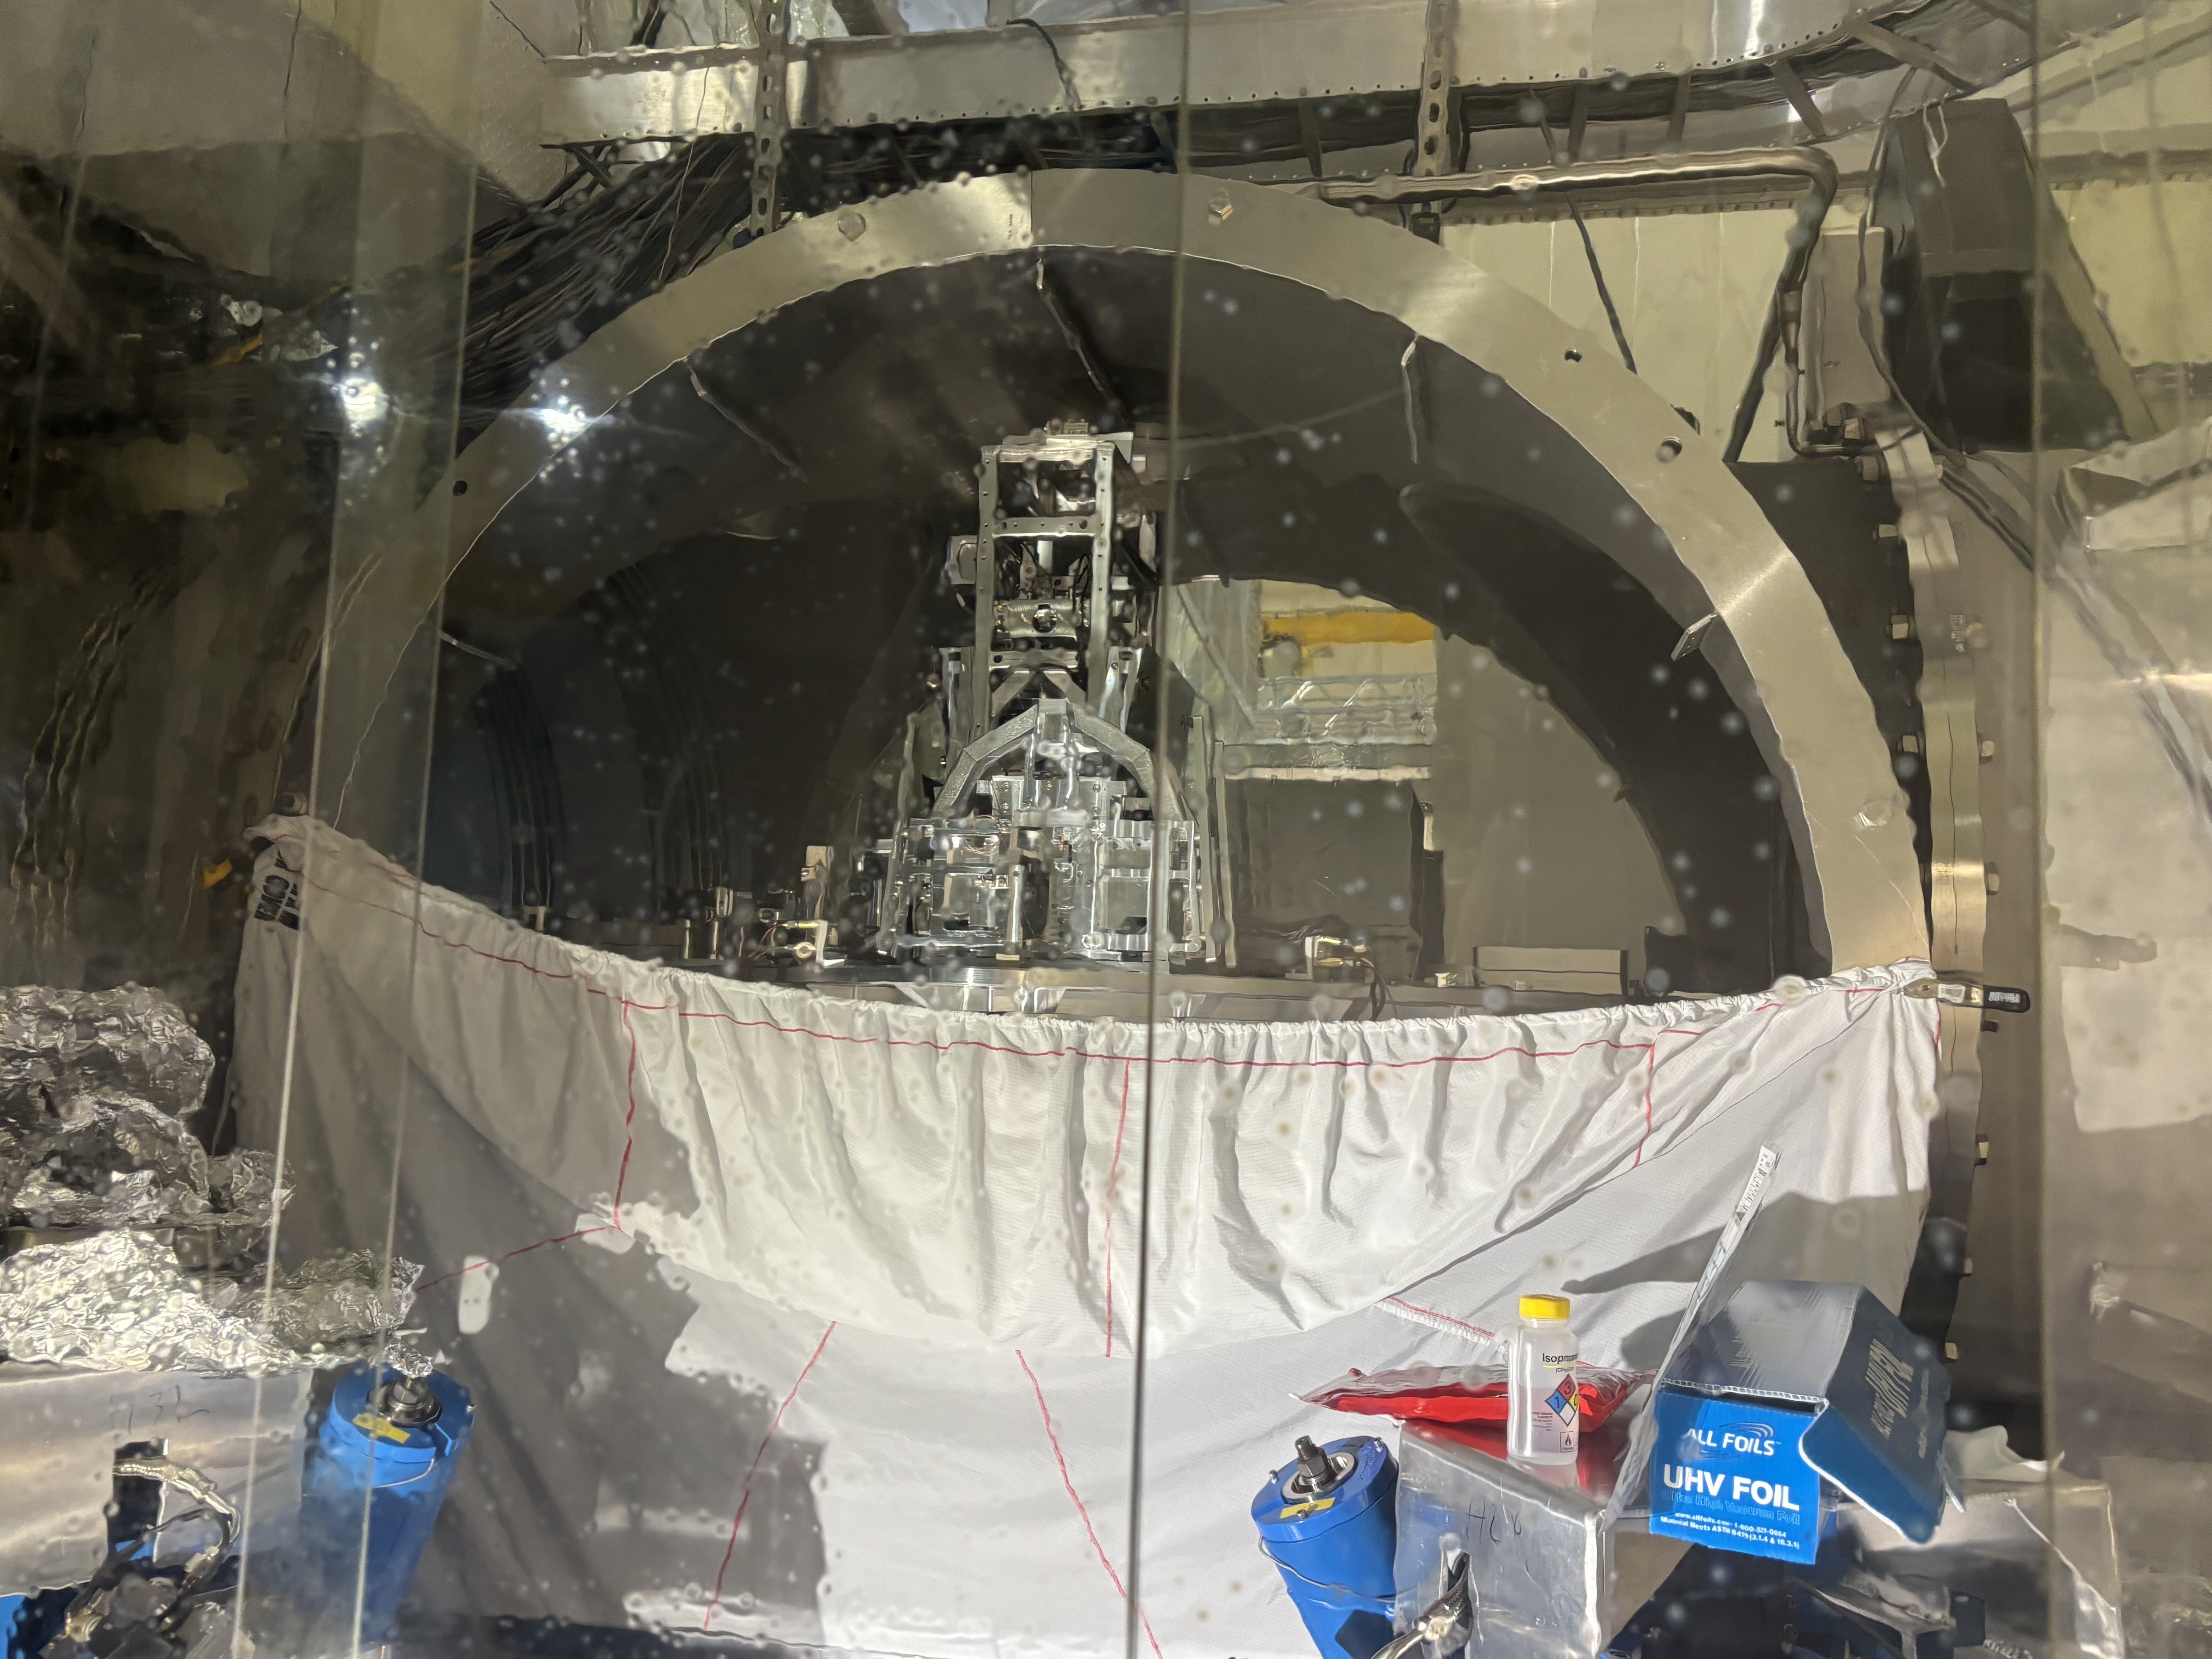
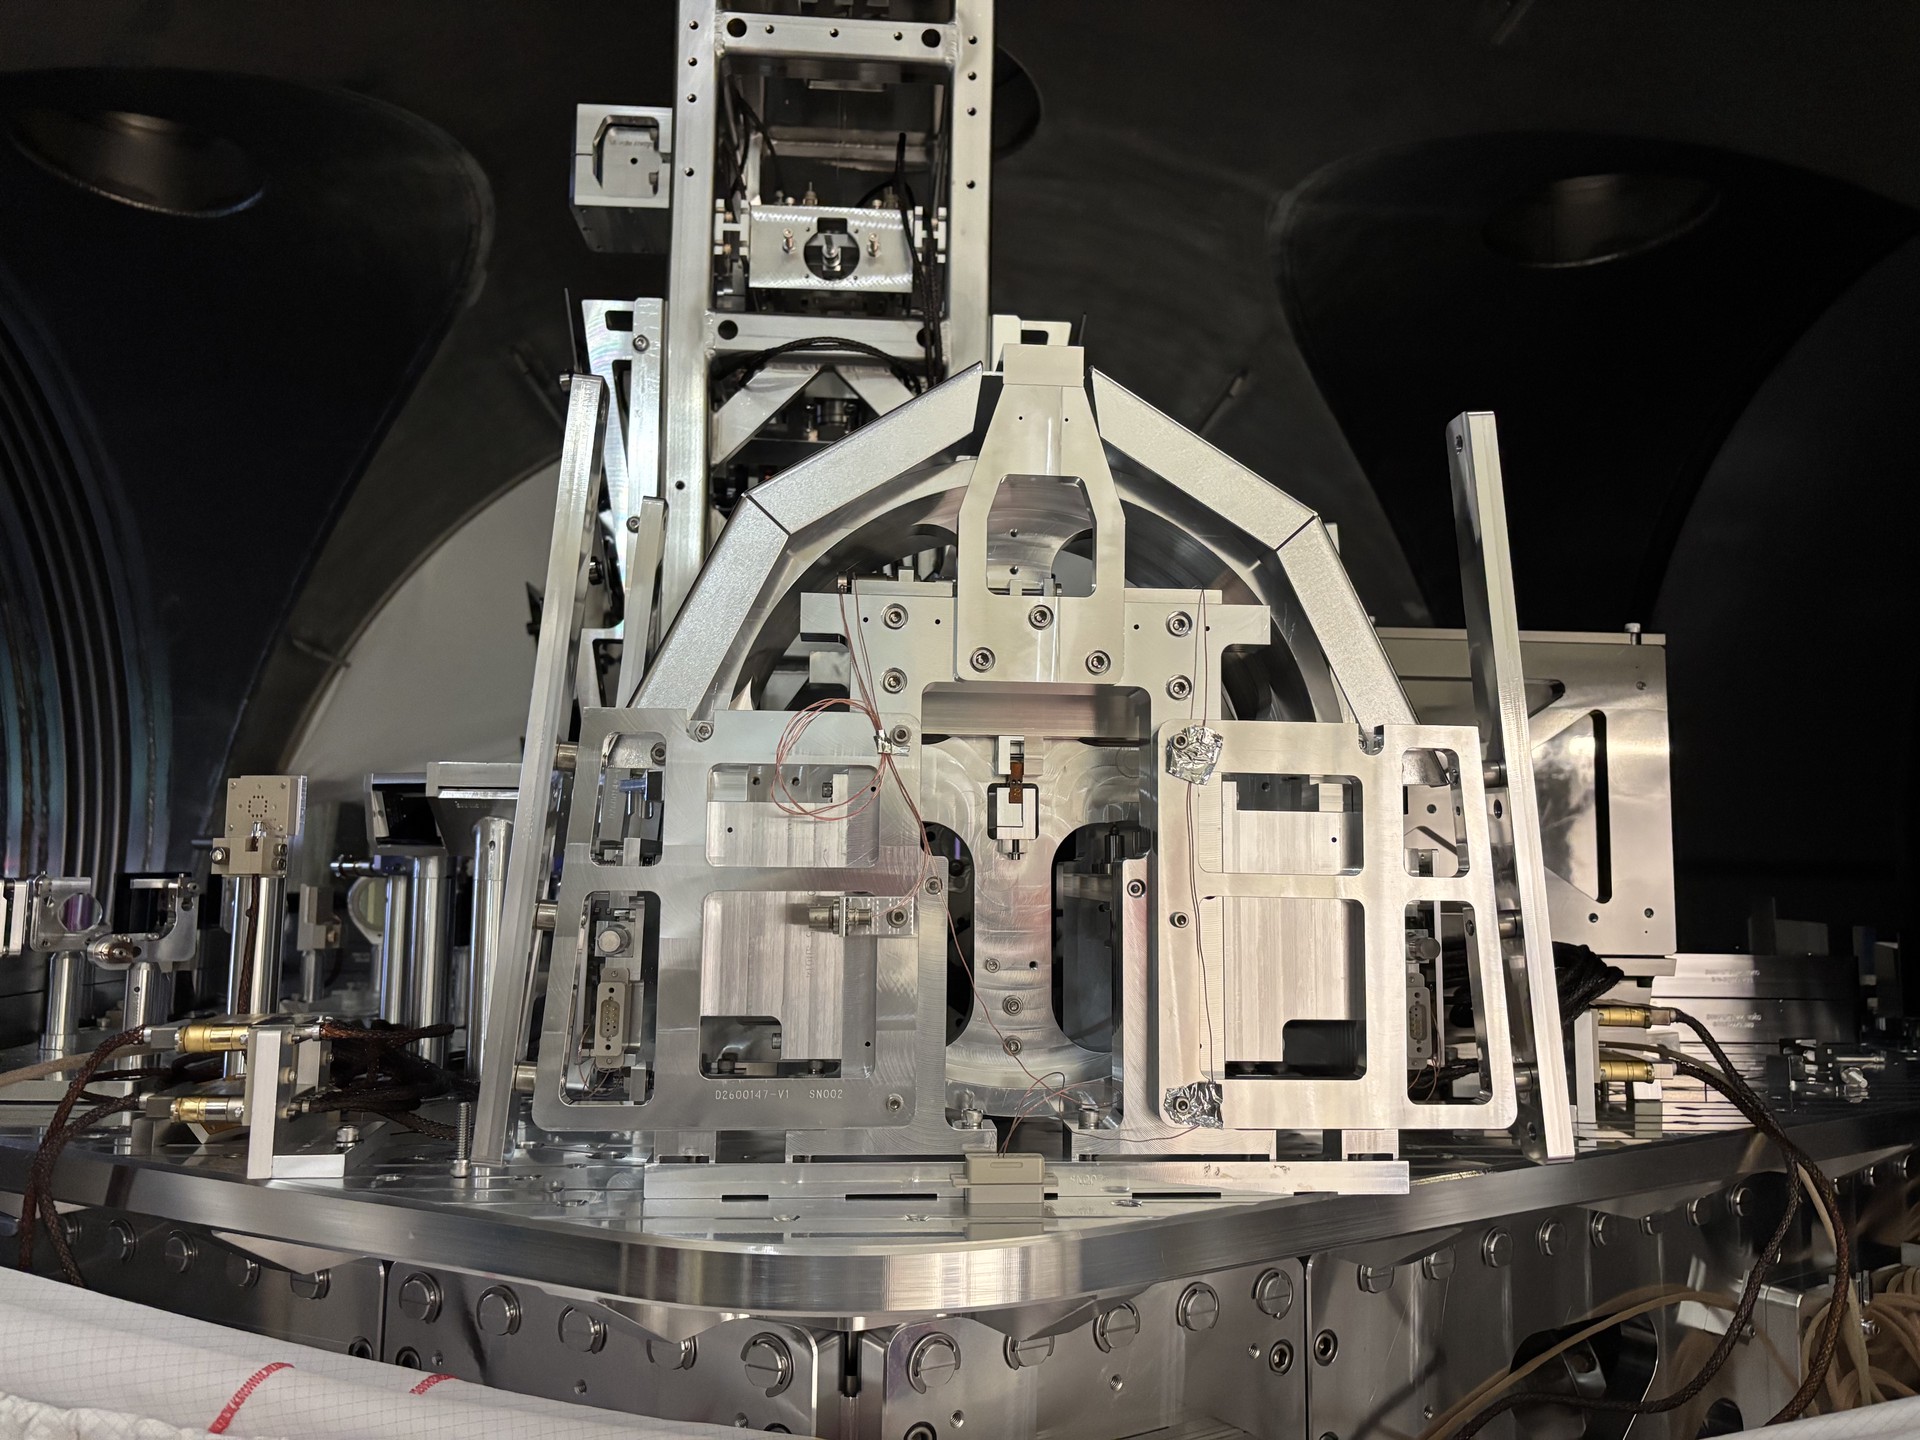
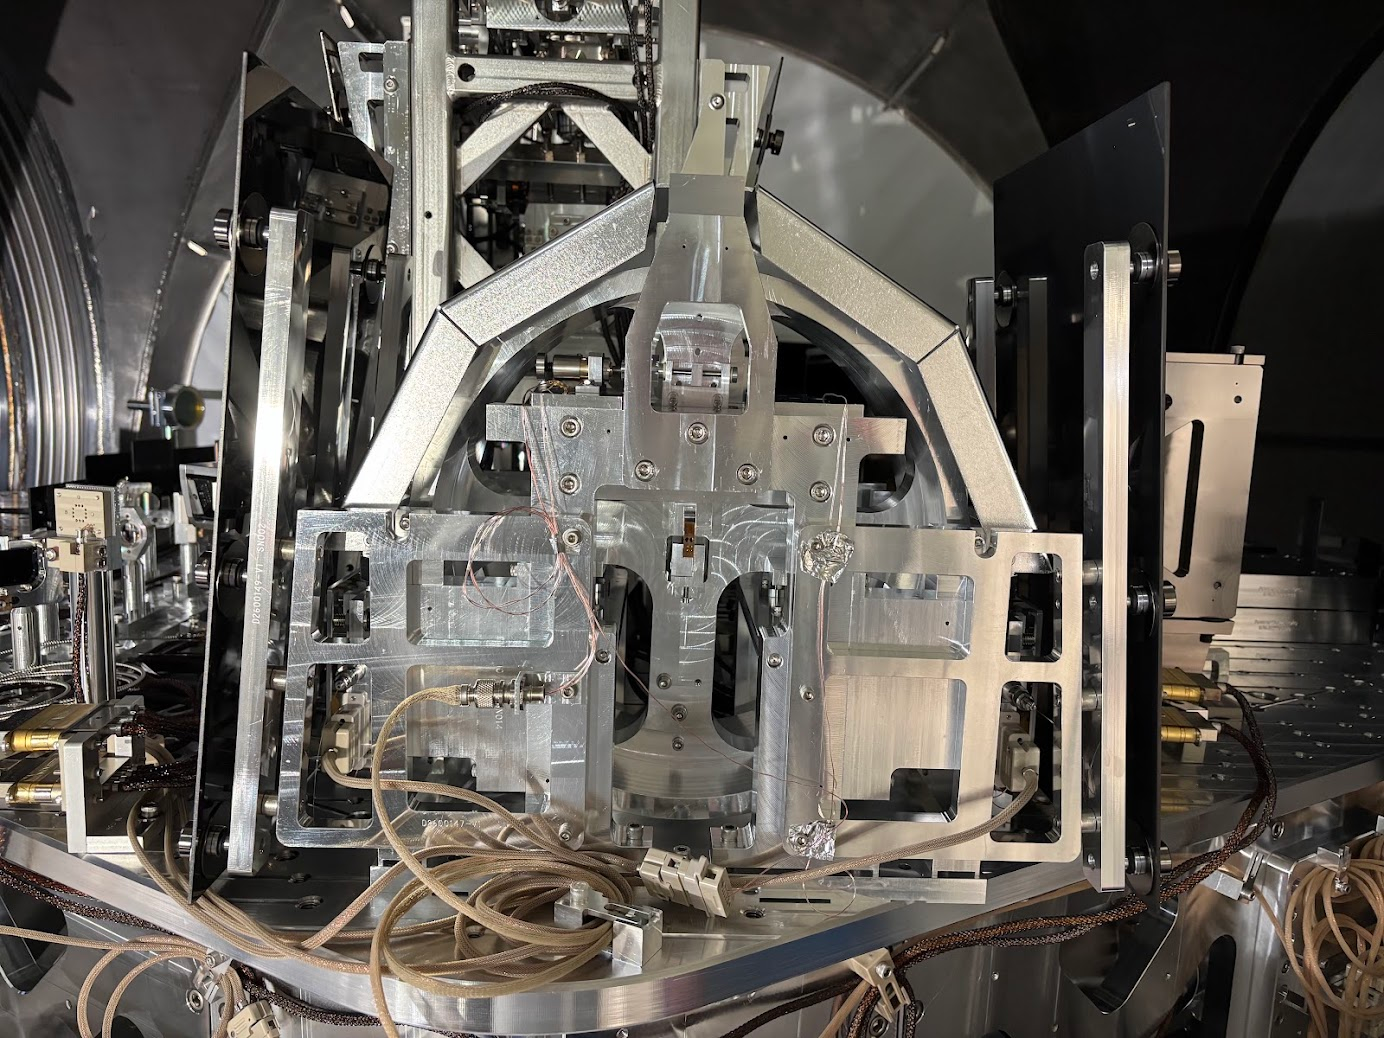
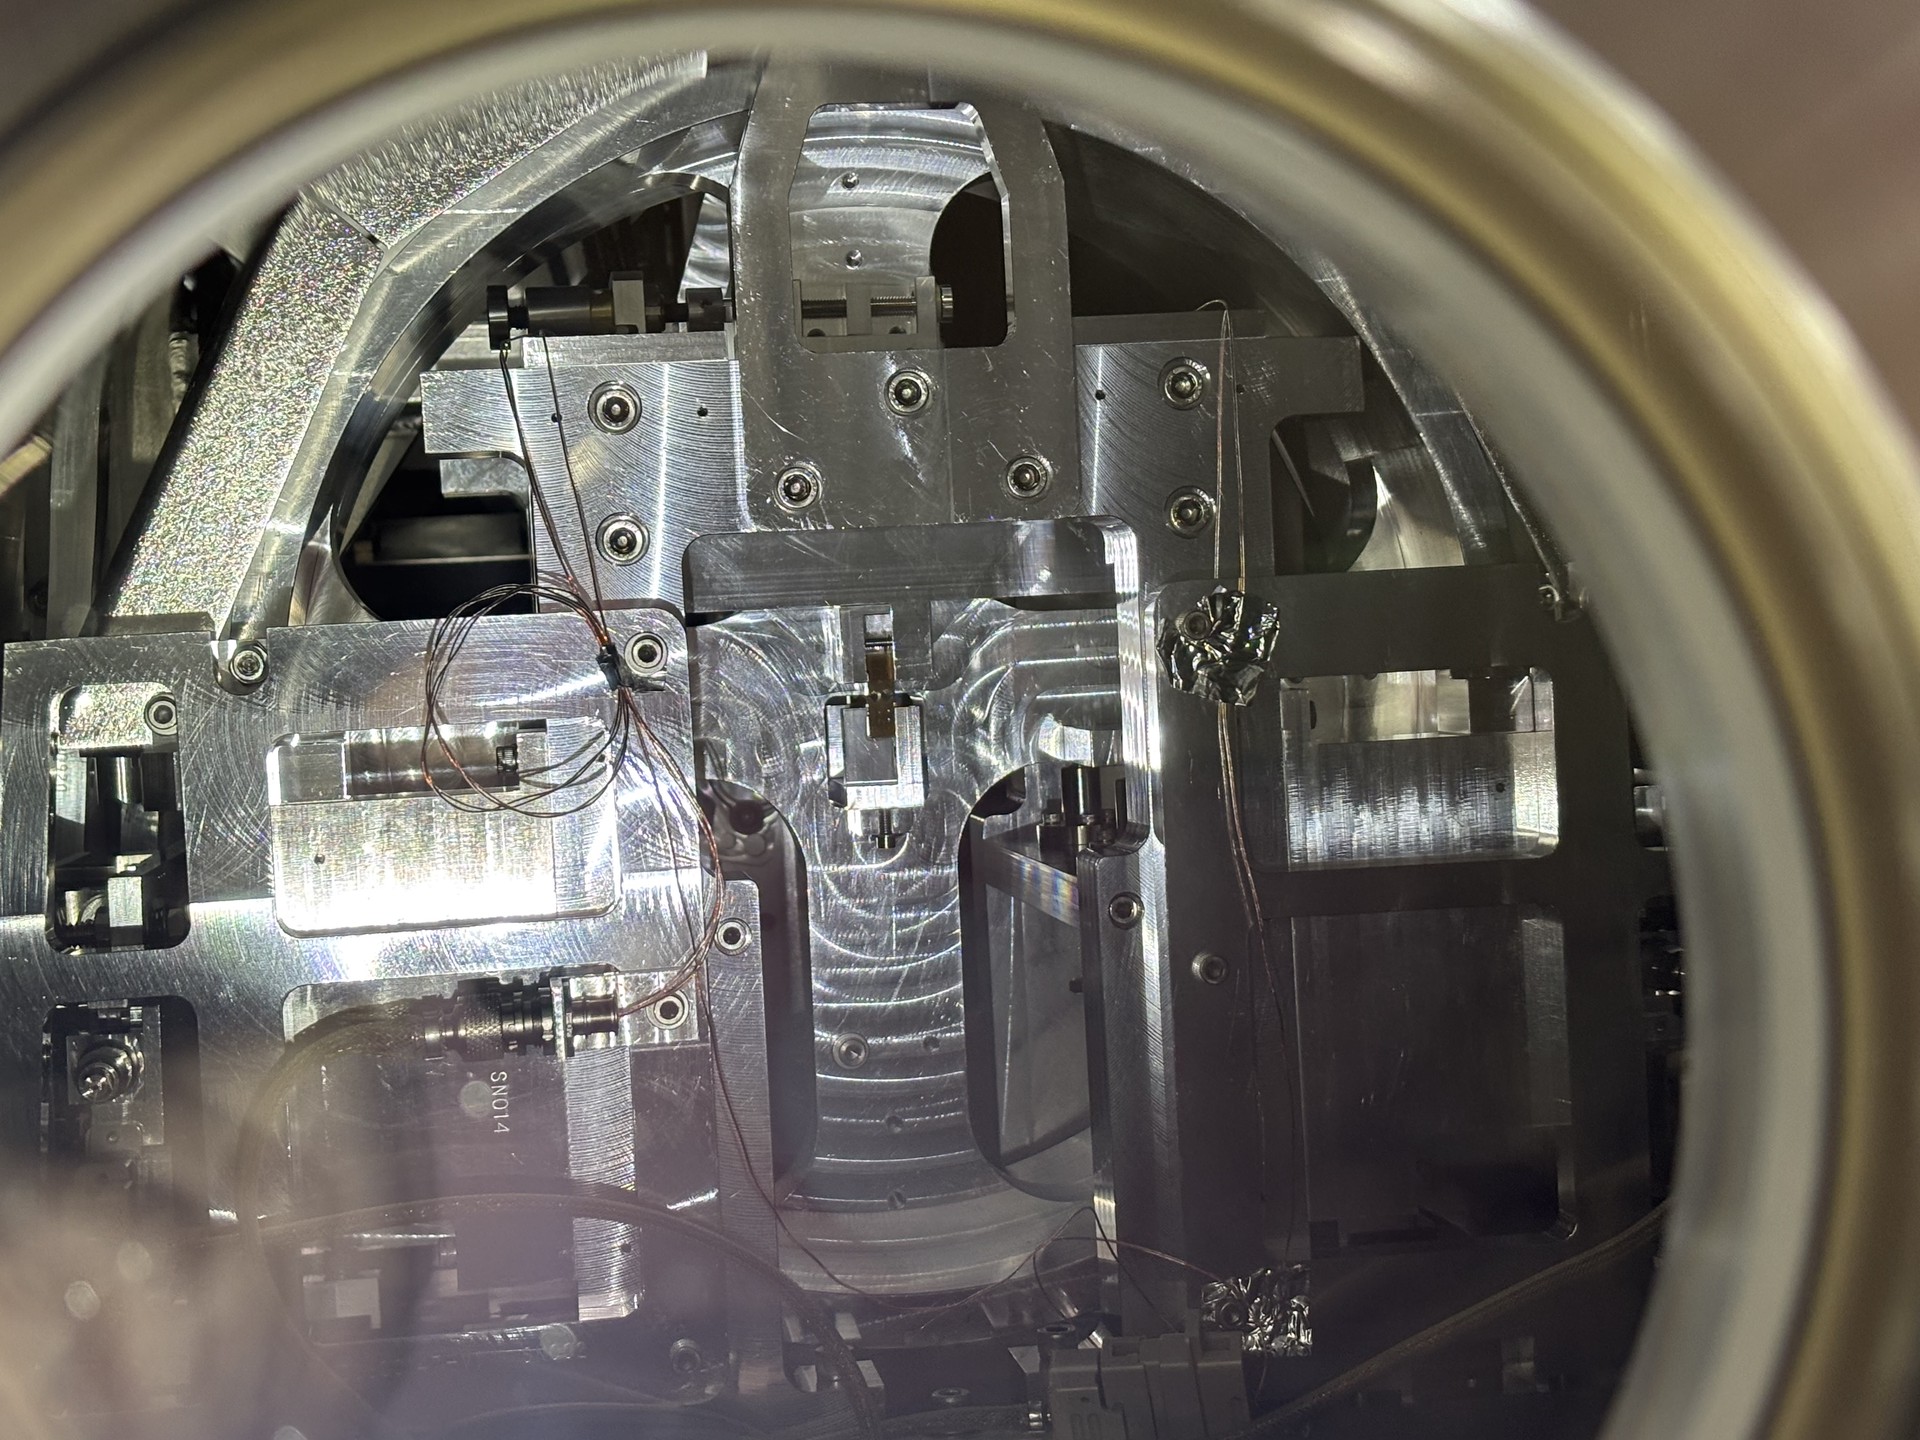
CRS Installed on HAM3

[Jim, Shoshana]

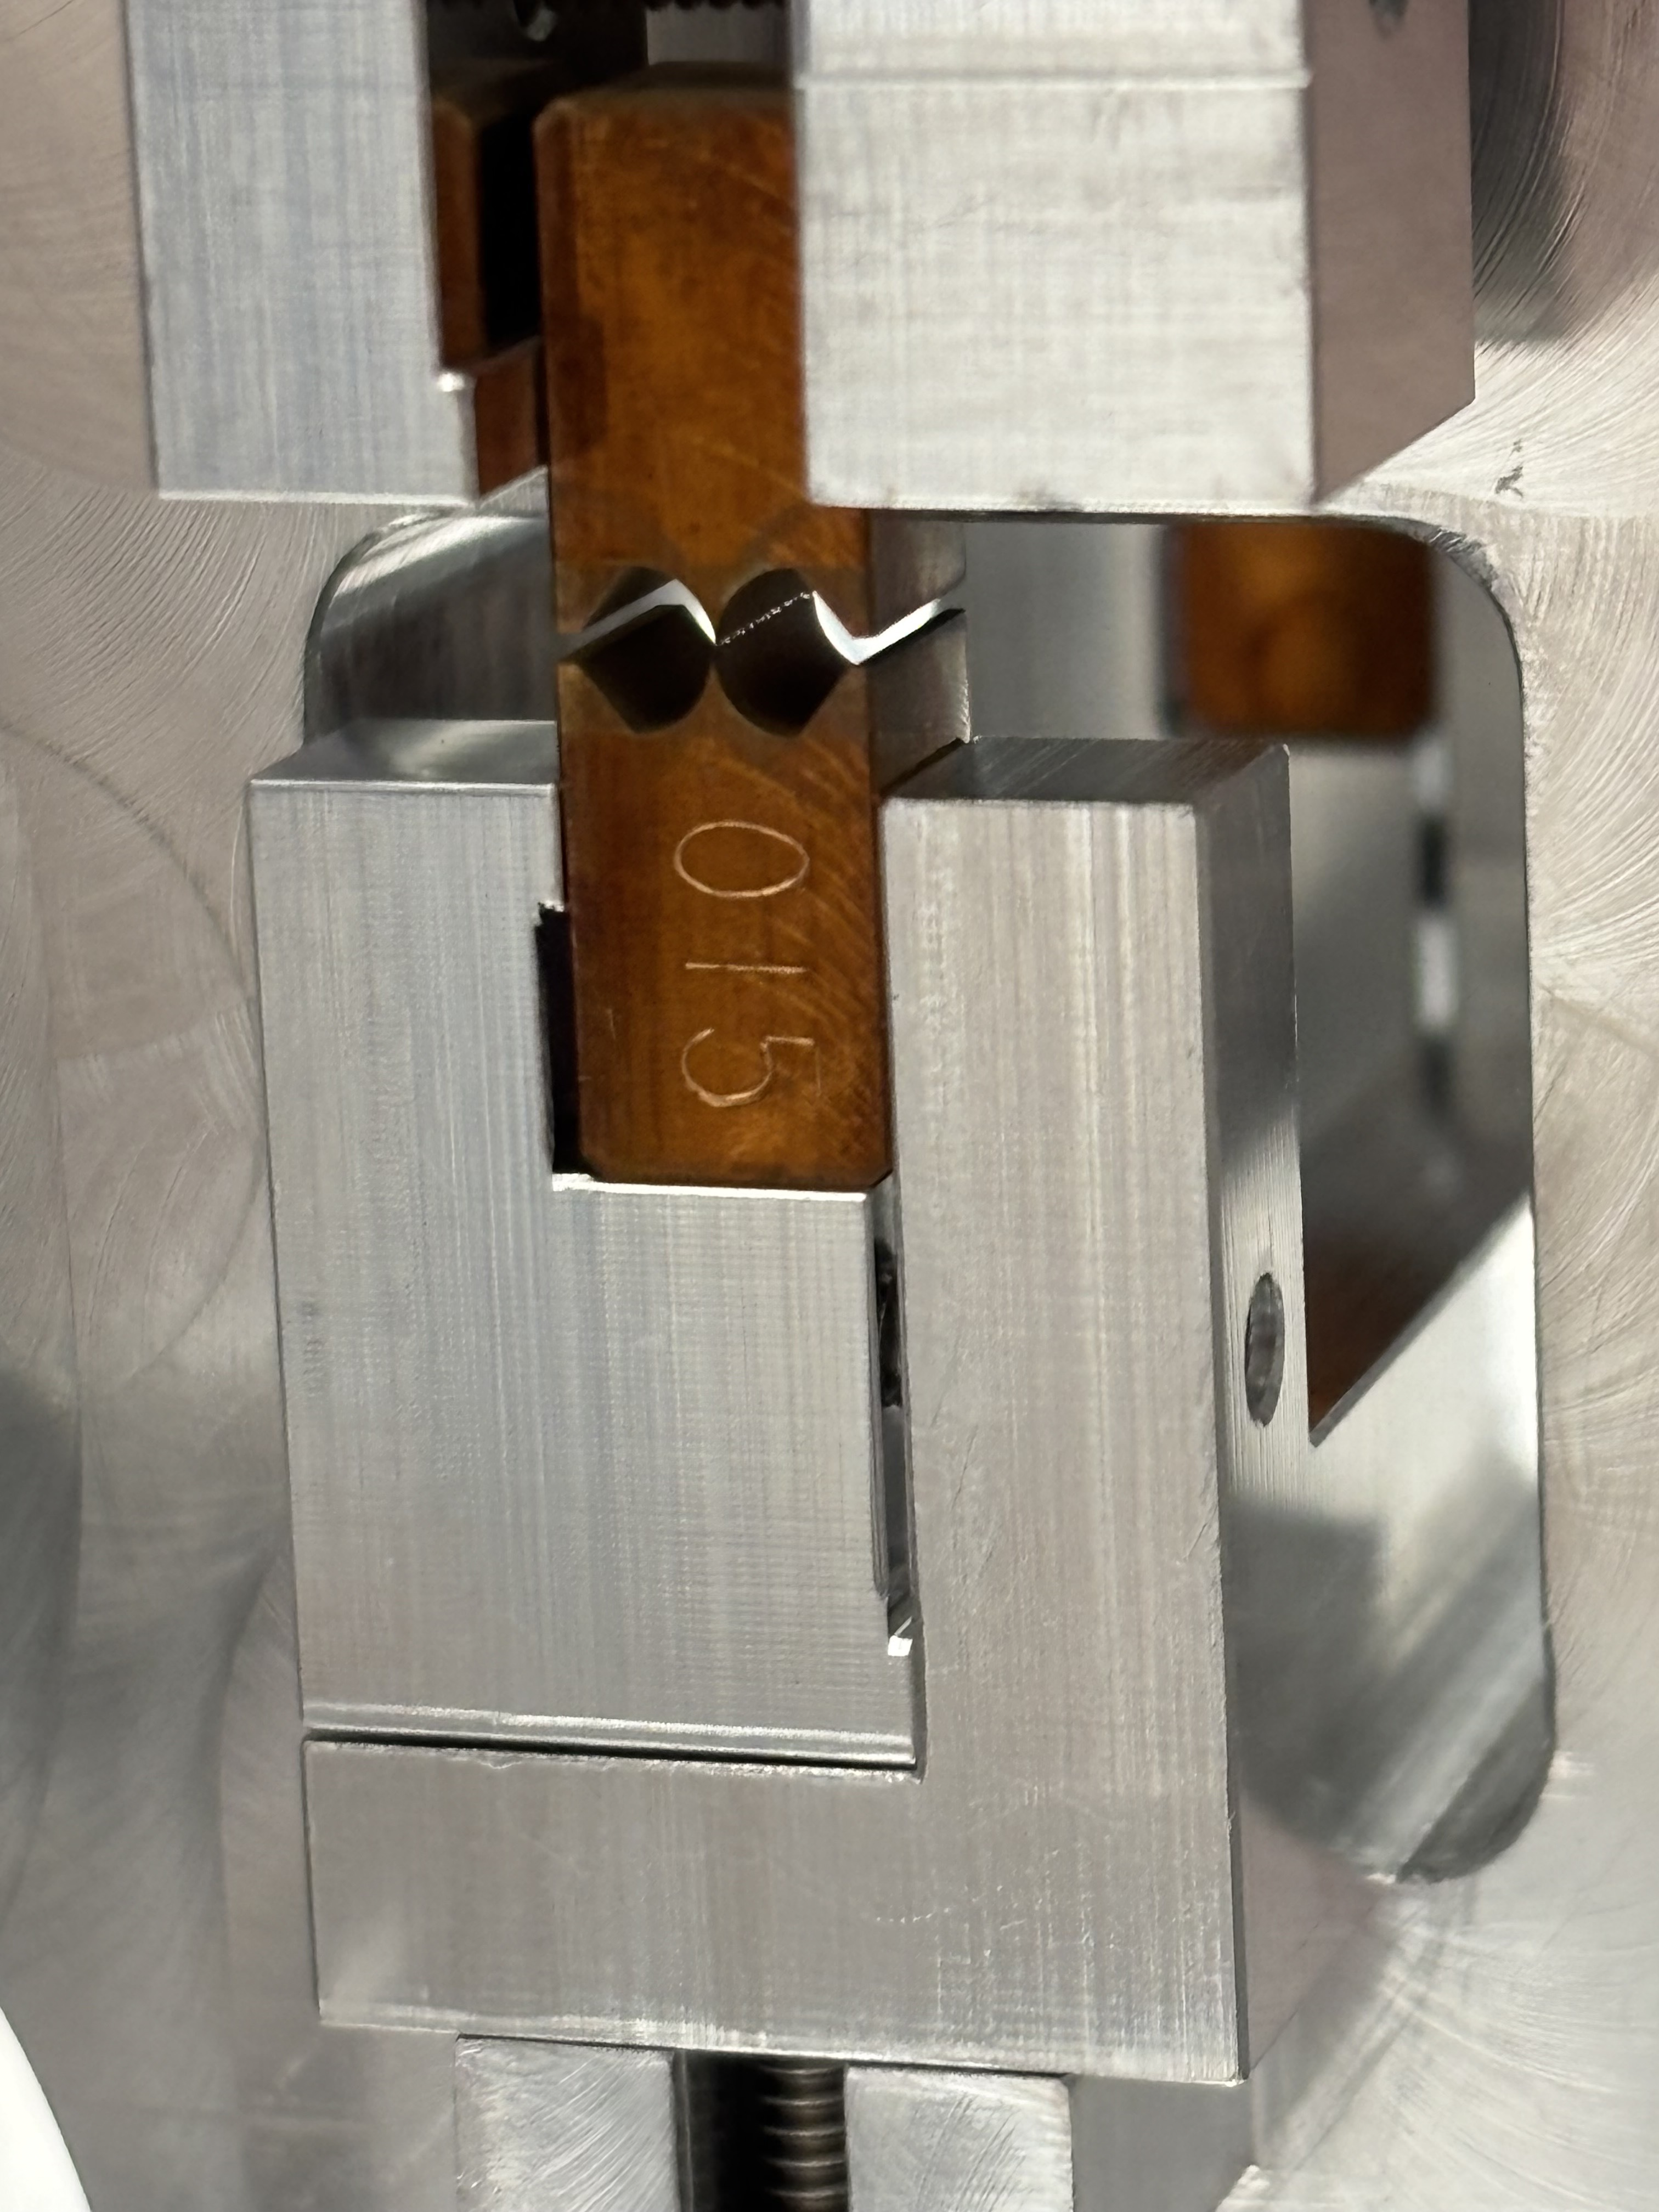
Yesterday when I went to put the cover on the CRS to get it ready to move to the clean area right next to HAM3, I noticed one of the flexures (SN 15) was broken [picture attached]. It's unclear how this flexure broke as it had been locked since last Wednesday (?), and it is strange that only one flexure broke.

We decided that it would be better to install a new pair of flexures and re-suspend next to the chamber rather than in the temporary clean room to reduce the risk of them breaking again. So today we wheeled the table the CRS is on to the space next to HAM3 and I re-suspended the CRS there and roughly balanced it.

Following the procedure outlined in E2600210 and work permit 13356,  we moved the CRS to the table and lined everything up so that the CRS baseplate can be bolted directly to the table in one spot.

We installed the fiber feedthrough, and dealt with all the cabling (fiber and DB25) that required Jim to be physically inside the chamber and we'll install the rest of the cable clamps which we can reach from outside the chamber tomorrow and finish connecting all the cables and dog clamping the CRS down (hopefully)

Comments related to this report
shoshana.apple@LIGO.ORG - 09:25, Thursday 02 July 2026 (90874)

Attaching pictures (which I forgot to do last night)

Images attached to this comment
brian.lantz@LIGO.ORG - 09:10, Friday 03 July 2026 (90892)EPO

Congratulations on getting the CRS onto HAM3! I'm tagging EPO

Looking forward to seeing it running

shoshana.apple@LIGO.ORG - 09:24, Friday 28 August 2026 (91721)
Images attached to this comment
H1 CDS
david.barker@LIGO.ORG - posted 17:36, Wednesday 01 July 2026 - last comment - 08:34, Thursday 02 July 2026(90866)
Restored EY CP7 PID controls following computer reboot

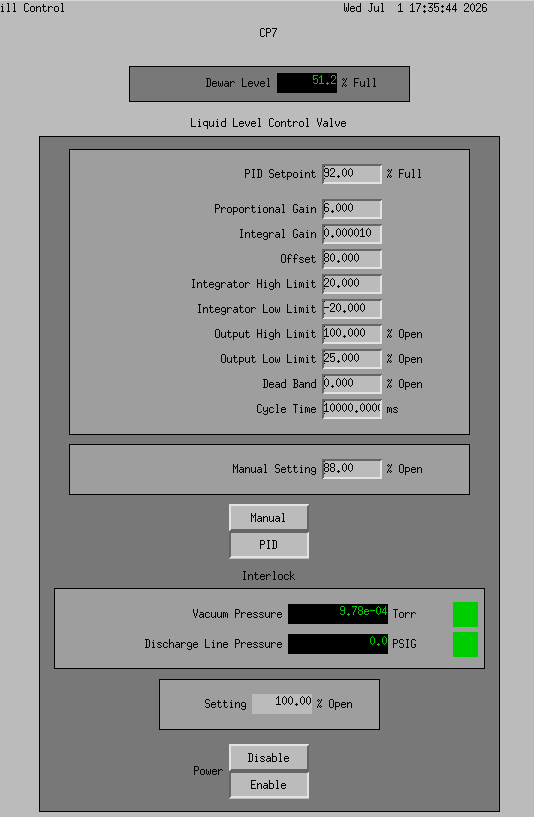
Following the reboot of h0vacey at 15:37 this afternoon the CP7 PID fill parameters needed to be reset. Using the values in h1vacuumsdf's safe.snap file, I ran the following caput commands as user vacuum on zotvac0

caput H0:VAC-EY_CP7_400_LLCV_CTRL PID
caput H0:VAC-EY_CP7_400_LLCV_MAN_POS_PCT 8.80000000000000000000e+01
caput H0:VAC-EY_CP7_400_LLCV_PID_CYCLE_TIME 1.00000000000000000000e+04
caput H0:VAC-EY_CP7_400_LLCV_PID_ITERM_MAX_LIM 2.00000000000000000000e+01
caput H0:VAC-EY_CP7_400_LLCV_PID_ITERM_MIN_LIM -2.00000000000000000000e+01
caput H0:VAC-EY_CP7_400_LLCV_PID_KI 1.00000000000000008180e-05
caput H0:VAC-EY_CP7_400_LLCV_PID_KP 6.00000000000000000000e+00
caput H0:VAC-EY_CP7_400_LLCV_PID_OFFSET 8.00000000000000000000e+01
caput H0:VAC-EY_CP7_400_LLCV_PID_OUT_DEAD_BAND 0.00000000000000000000e+00
caput H0:VAC-EY_CP7_400_LLCV_PID_OUT_MAX_LIM 1.00000000000000000000e+02
caput H0:VAC-EY_CP7_400_LLCV_PID_OUT_MIN_LIM 2.50000000000000000000e+01
caput H0:VAC-EY_CP7_400_LLCV_PID_SETPT_PCT 9.20000000000000000000e+01
caput H0:VAC-EY_CP7_XV400_LLCV_ENABLE_CTRL Enable
caput H0:VAC-EY_CP7_LT400_PUMP_LEVEL_MA_SMOO 9.98999999999999999112e-01
 

Images attached to this report
Comments related to this report
david.barker@LIGO.ORG - 07:08, Thursday 02 July 2026 (90869)

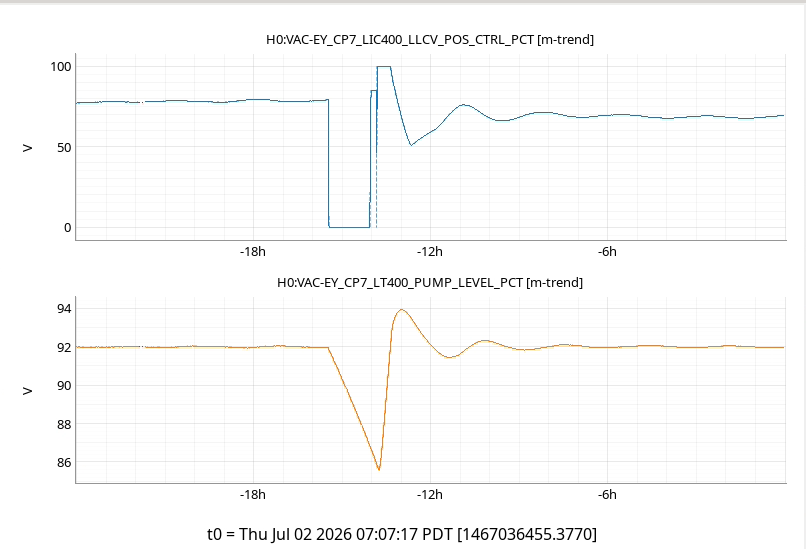
1 day trend of CP7 LN2 level drop and recovery

Images attached to this comment
david.barker@LIGO.ORG - 08:34, Thursday 02 July 2026 (90871)

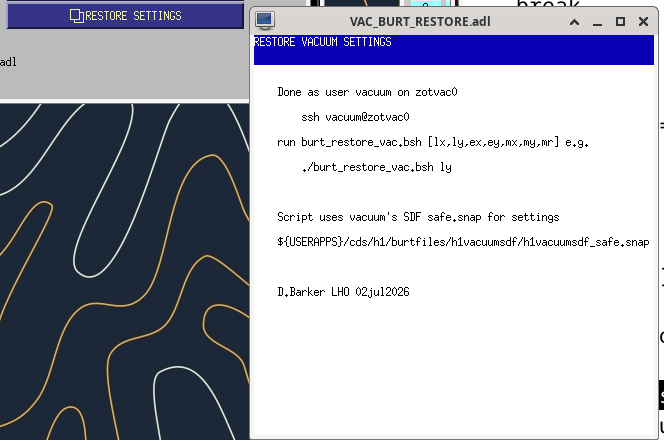
I've added a RESTORE SETTINGS button to the Vacuum Overview which gives instructions on how to restore CP PID settings per vacuum control system.

This can only be done by the vacuum account on zotvac0. All other workstations have read-only access to VAC EPICS channels.

Images attached to this comment
H1 General
anthony.sanchez@LIGO.ORG - posted 17:05, Wednesday 01 July 2026 (90863)
Wed ops shift report.

TITLE: 07/01 Day Shift: 1430-2330 UTC (0730-1630 PST), all times posted in UTC
STATE of H1: Planned Engineering
INCOMING OPERATOR: None
SHIFT SUMMARY:

CDS restarts started ~16:15:55 UTC 
BS CPS glitch at 18:19:20 UTC <---- lots of these throughout the day.
Dome has been flown back on!
Beam splitter QOsums are shorting, and unfortunately there is now a shortage.  
Ground Loops were checked. 
PEM Stray light checks in HAM3. 

CRS still on going.
CPS still on going. 

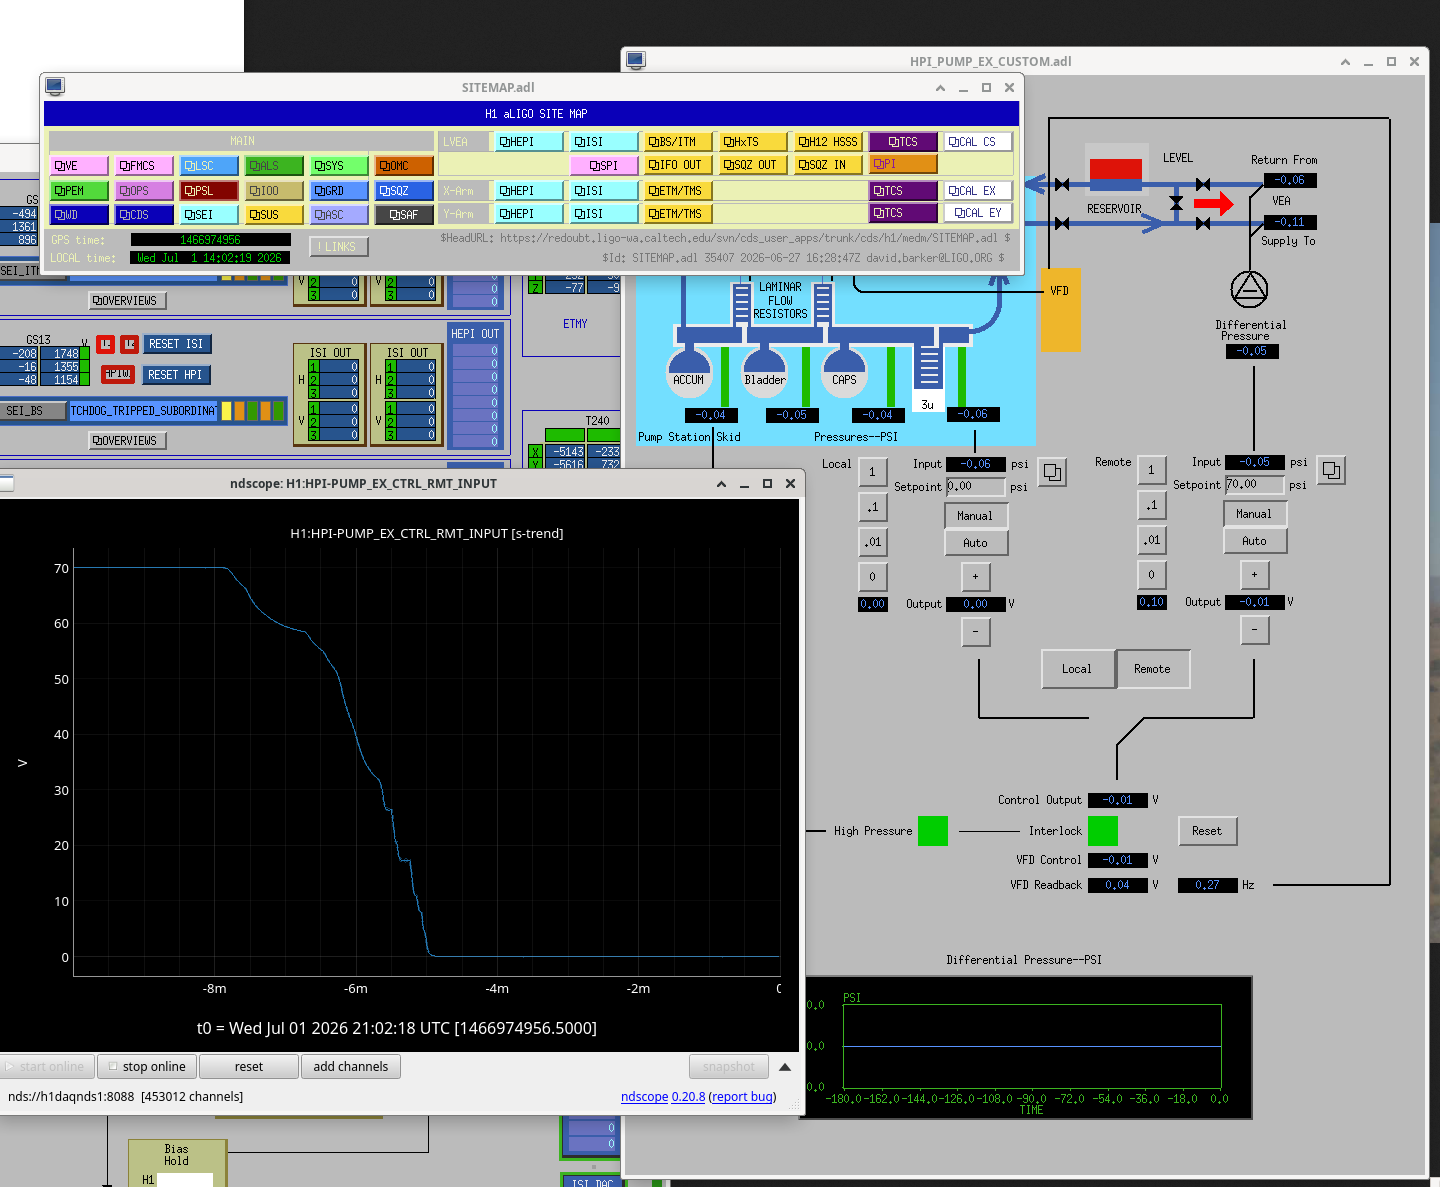
Patrick went to EY to work on HEPI beckhoff, before he went he had me take the  H1:HPI-PUMP_EX_CTRL_RMT_OUTPUT Voltage down Slowly while watching H1:HPI-PUMP_EX_CTRL_RMT_INPUT. 

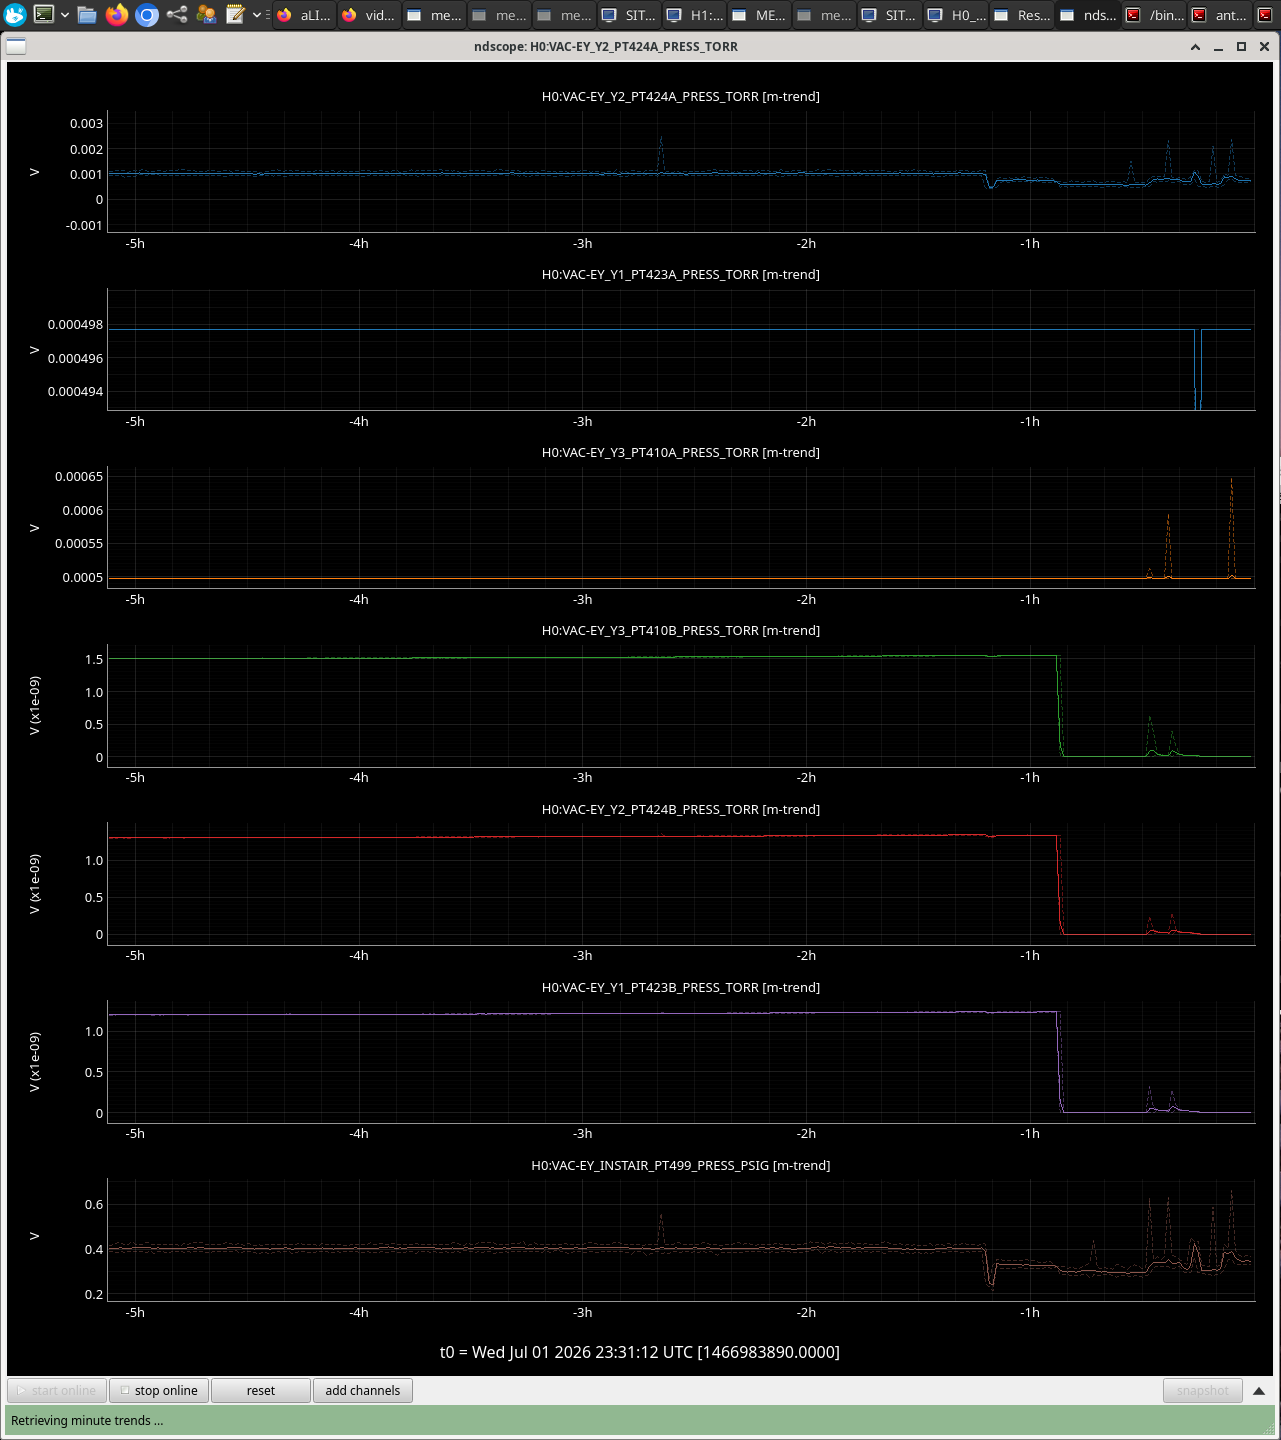
The following channels have been having technical difficulties while Fil and Patrick were at EY working on HEPI Beckhoff:
H0:VAC-EY_Y3_PT410B_PRESS_TORR
H0:VAC-EY_Y2_PT424B_PRESS_TORR
H0:VAC-EY_Y1_PT423B_PRESS_TORR
H0:VAC-EY_INSTAIR_PT499_PRESS_PSIG
Jordan is aware and watching it. Says it's a "waiting game now".
 

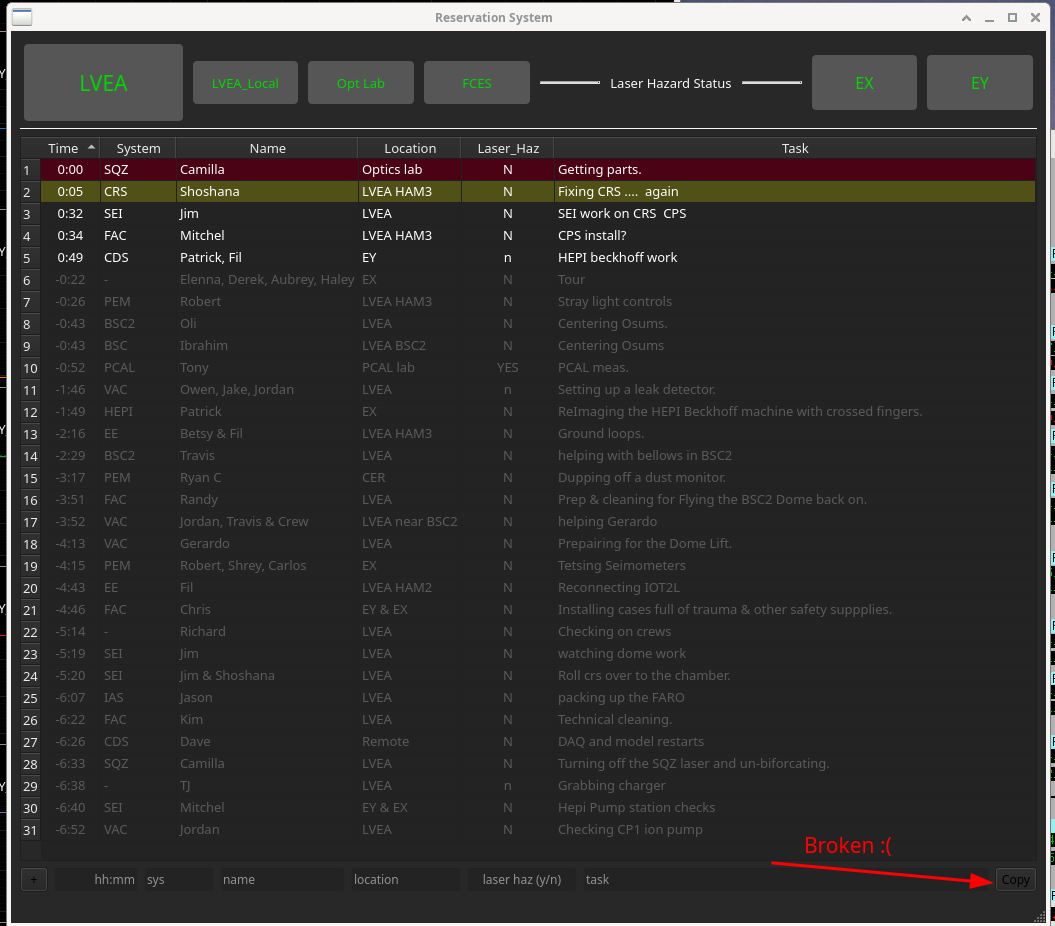
LOG: Copy button broken on Reservation System.
 

Images attached to this report
H1 SUS (SUS)
ibrahim.abouelfettouh@LIGO.ORG - posted 16:59, Wednesday 01 July 2026 (90865)
Shorting Issues on QOSEMs

Ibrahim, Oli, Betsy, Thomas

Today, we had a call with Thomas to diagnose LHO's QOSEM shorting issues - found in alog 90864, alog 90838, alog 90834

LHO broken QOSEMs:

S2600013 - Pins 23 and 10 grounded to chamber:

S2600025 S2600010 - Shorted (likely)

Tom's Suggestions On dead OSEMs

On Sat Amp

After the qosem broke, we swapped our last spare, requested more from LLO and carefully centered the QOSEM such that it's on the PD and roughly centered. Now, all our QOSEMs are working and are roughly (very roughly) centered.

Next:

We'll wait until the spare QOSEMs arrive to continue centering (now with a renewed meticulousness about shorting). Then, we can send the 3x broken LHO QOSEMs and 1x broken LLO QOSEM to CIT to Ali to resolder the LEDs and return them as viable spares. 

H1 SUS
ibrahim.abouelfettouh@LIGO.ORG - posted 16:46, Wednesday 01 July 2026 (90864)
Swapped SD QOSEM SN 10 with QOSEM 15

Oli, Ibrahim

We likely shorted another QOSEM likely at the area of the microDB pins on top of the flexi-circuit. The counts went to 0 immediately. This was probably done during the OSEM centering where the Y centering involves having a tool on top of the danger area to move the Cams.

H1 SUS
elenna.capote@LIGO.ORG - posted 16:24, Wednesday 01 July 2026 - last comment - 09:27, Thursday 02 July 2026(90852)
Status of BBSS cross coupling

[Betsy, Oli, Ibrahim, Elenna, with online help from Arnaud, Marie and Gabriele]

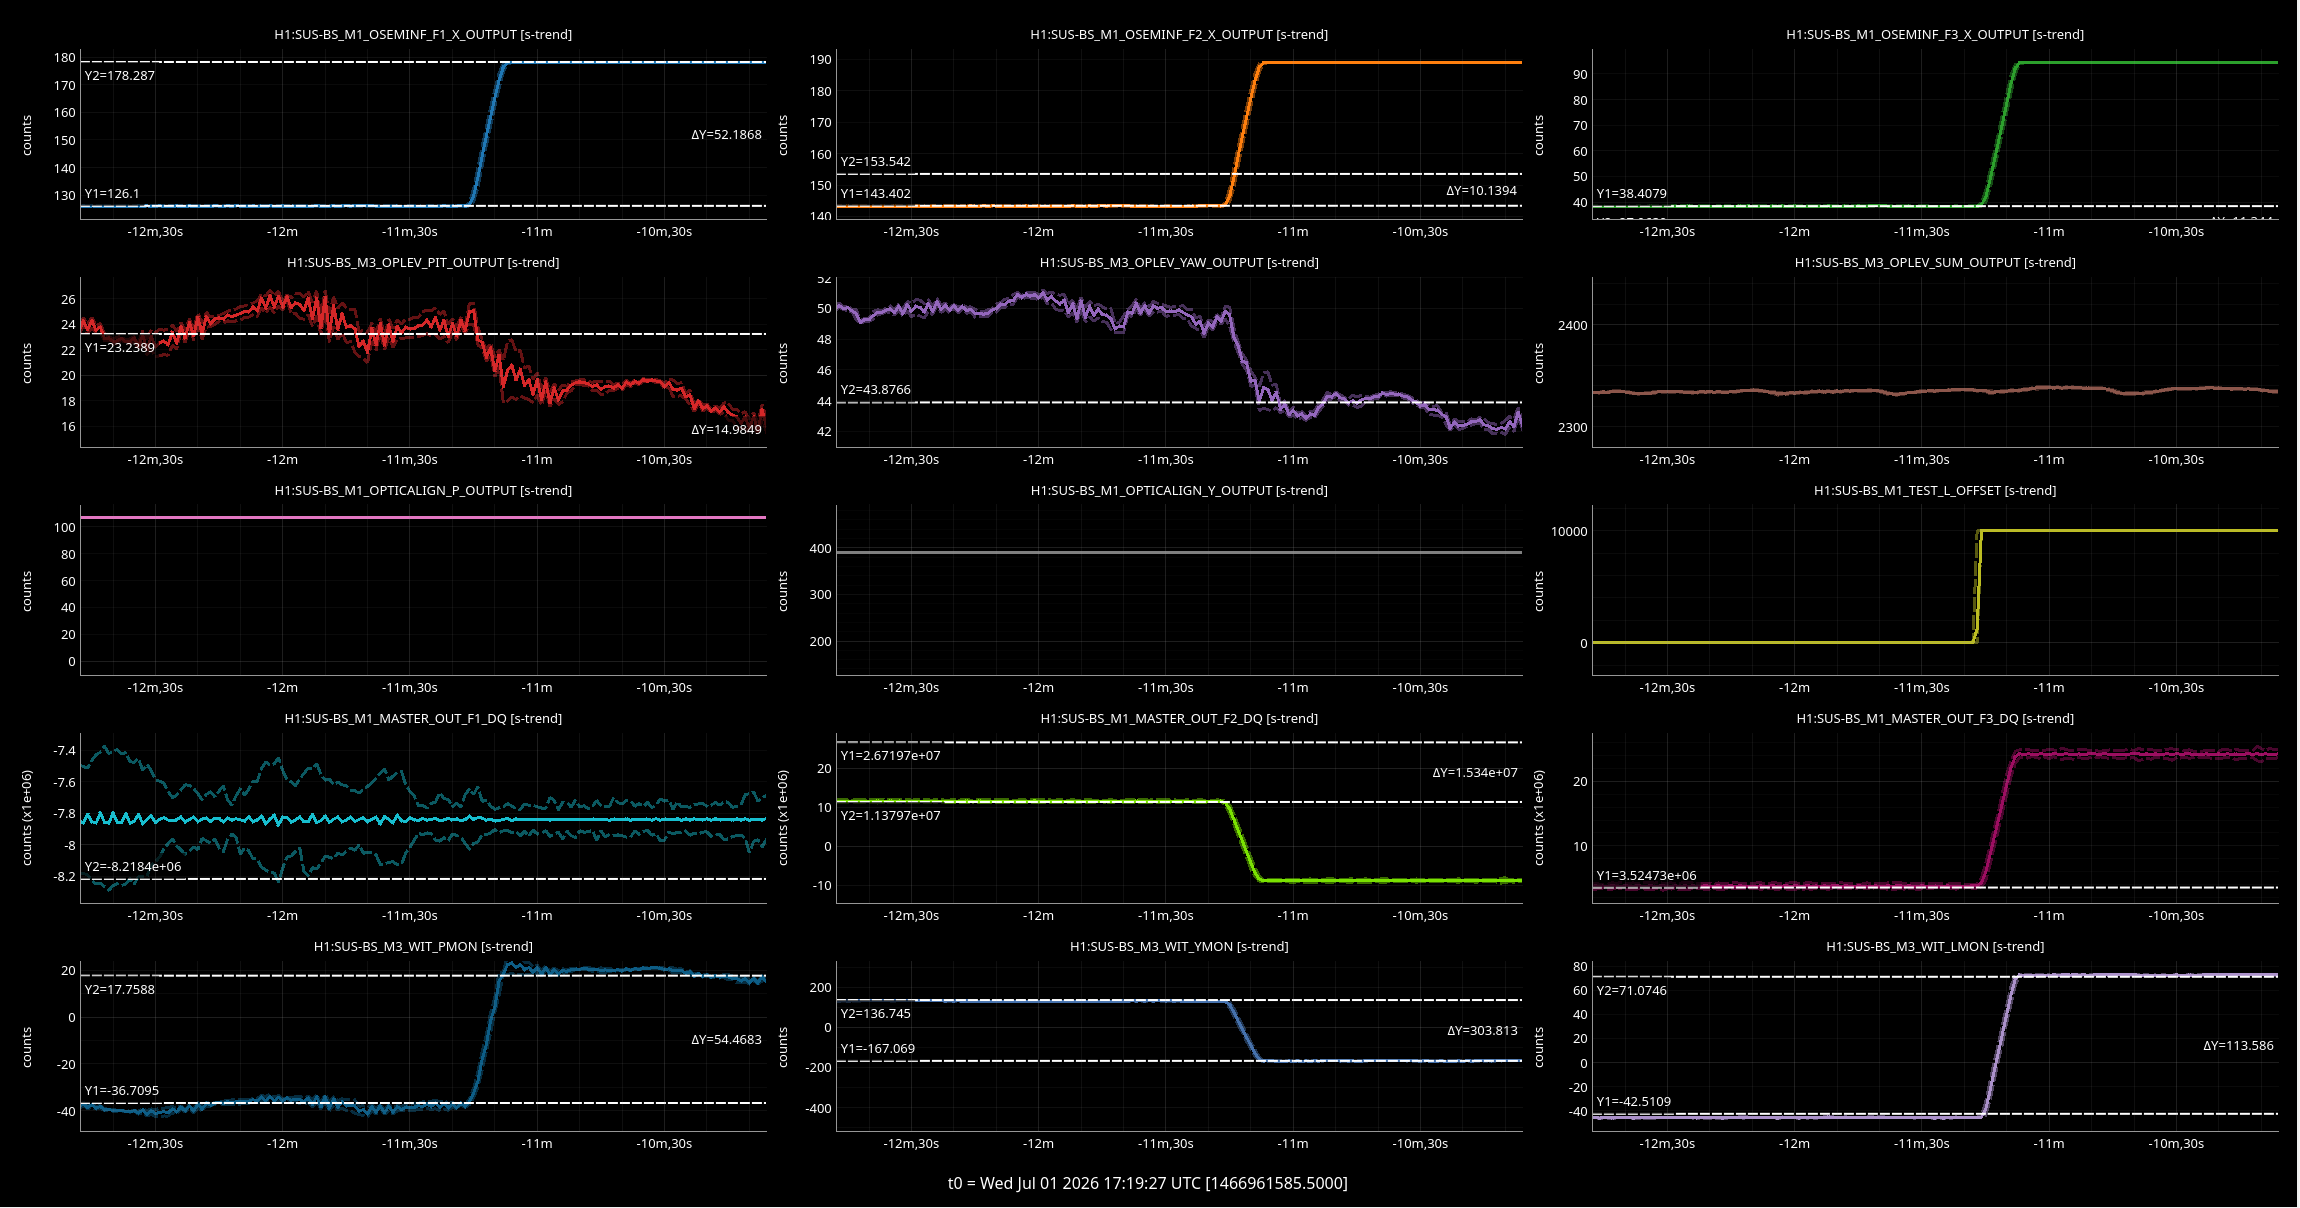
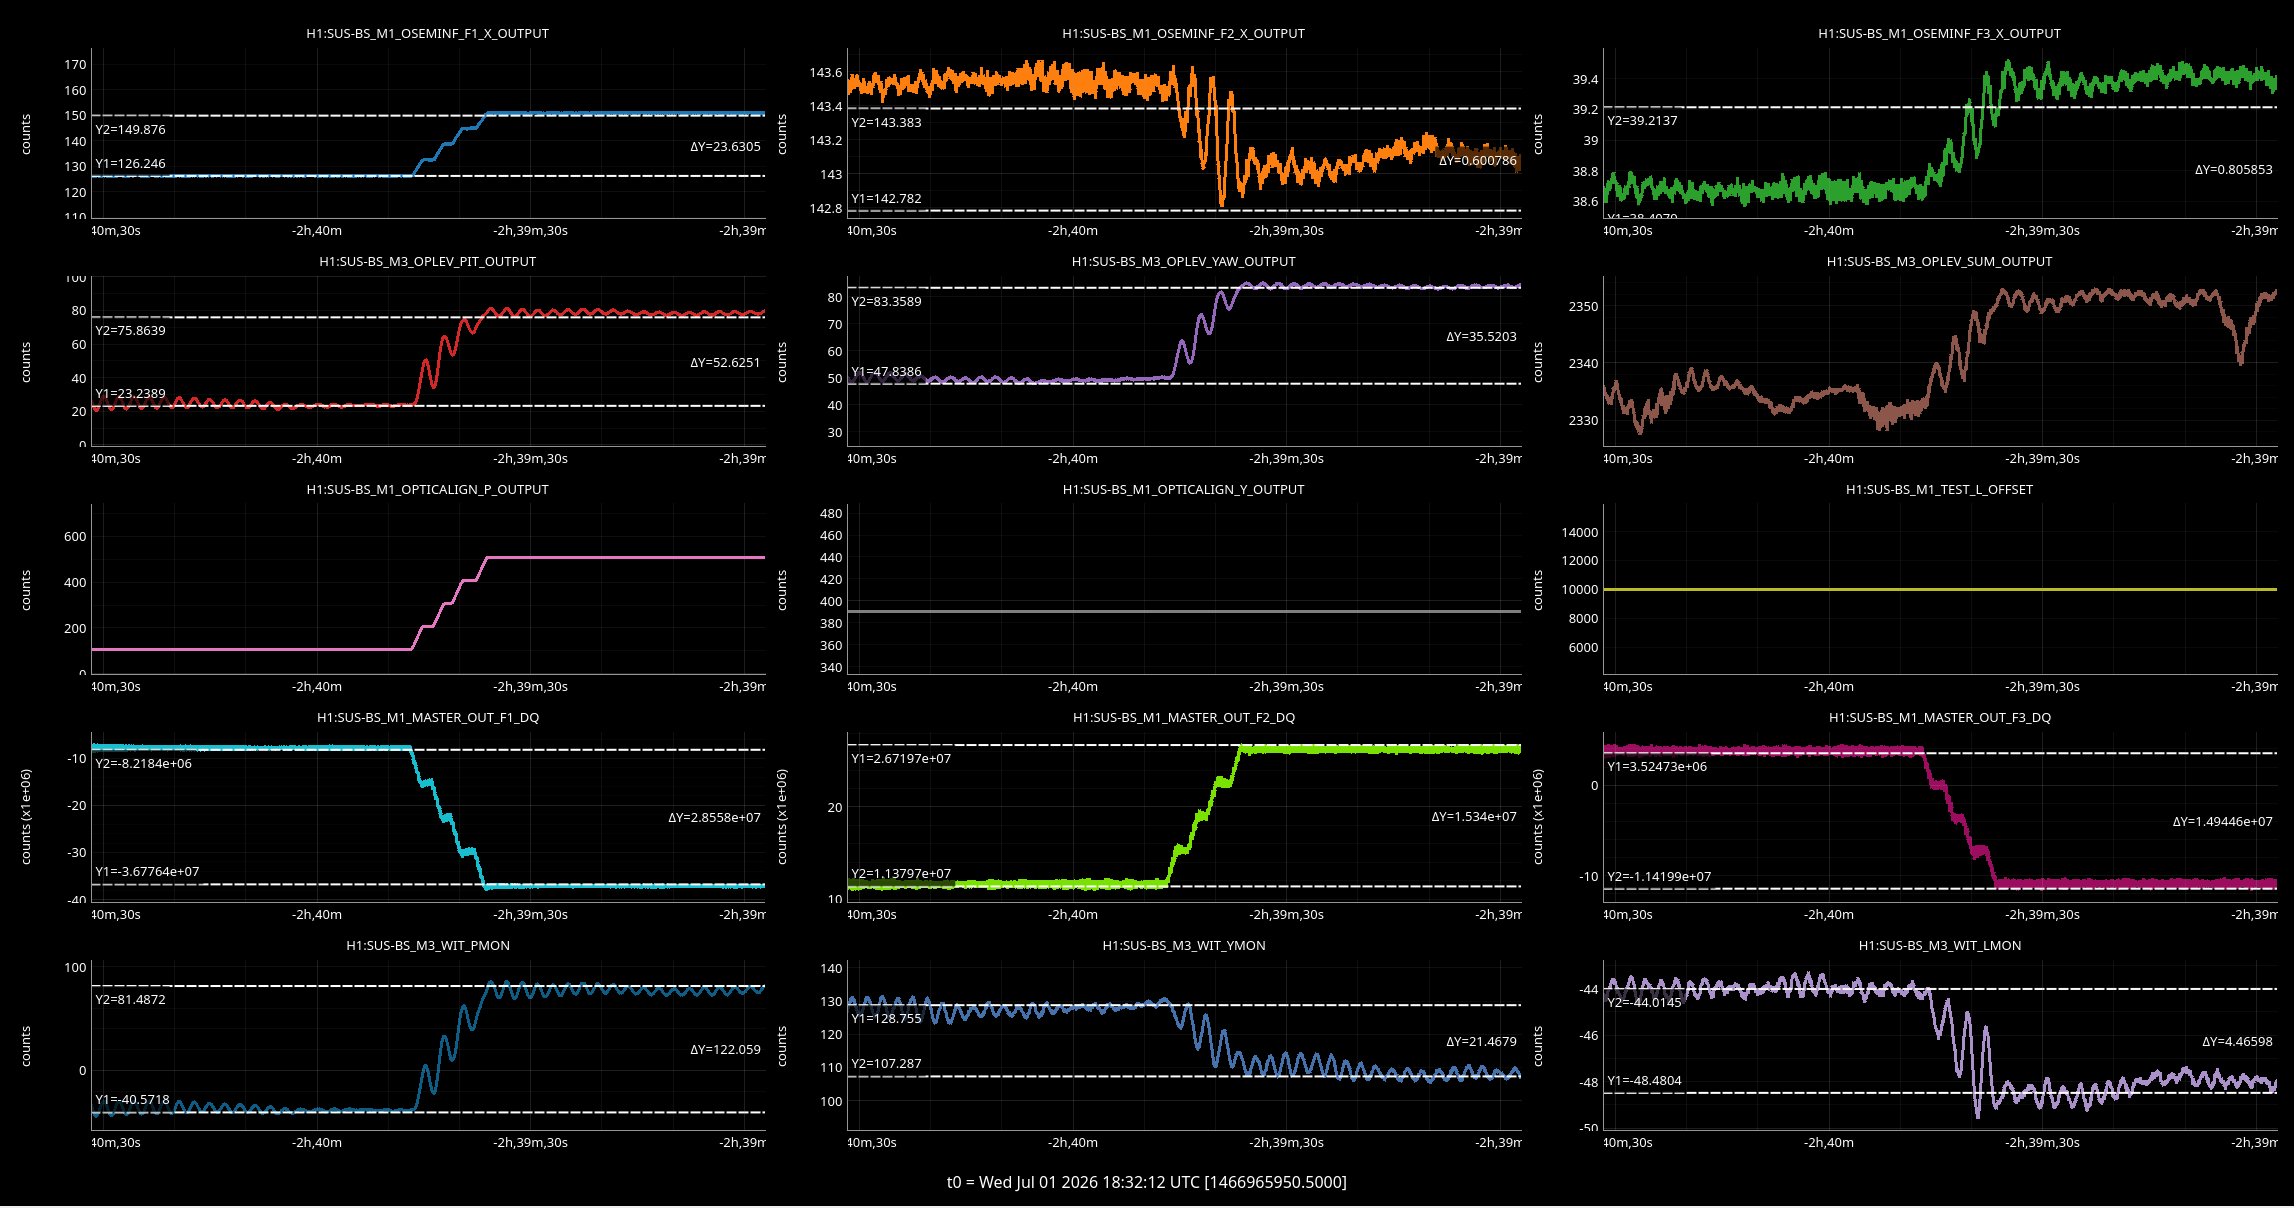
Today we began by attempting to follow the same steps that LLO did to decouple pitch and yaw, as described in 81817. To summarize, they applied a length offset and adjusted coil driver gains to ensure the same amount of motion is sensed on M0 F2 and F3 oseminfs.

Betsy and I immediately found that following that same process was not going to work. As a reminder, Ibrahim and Oli swapped the F3 osem yesterday due to ground loops, 90838. To get straight to the point, here are some results:

Arnaud notes that overall this is an improvement, because last week the P2Y cross coupling was much worse, roughly 1x pitch to 2x yaw. The overall numbers are different depending on which sensor you trust. However, Betsy and I think that the top mass drive versus sensed motion (master outs versus oseminfs) should be relatively straightforward. It seems like we have a mechanical imbalance on the suspension. However, the improvement that has occured was only due to swapping an osem, which seems electrical.

Oli will revisit the derivation of the osem2eul/eul2osem matrices. We also plan to recheck the suspension transfer functions to see if the P2Y coupling is reduced.

Images attached to this report
Comments related to this report
arnaud.pele@LIGO.ORG - 09:27, Thursday 02 July 2026 (90875)

Last week's measurement showing worse P2Y coupling than in this alog: 90739

H1 CDS
erik.vonreis@LIGO.ORG - posted 15:24, Wednesday 01 July 2026 - last comment - 11:52, Thursday 02 July 2026(90862)
ndscope-test now has scatter plots

ndscope-test can now show "scatter" plots.

Plot one channel against others.  Each plot can have one channel giving the X value, and any number of channels giving Y values.  The plot will show one trace per Y value channel using the color of that channel.

Create a scatter plot from the command line by running "ndscope-test --scatter <x-channel> <y-channel-1> <y-channel-2> ..."

Create a scatter plot from a time domain plot.
1. Right click to get the pop up menu.
2. Select configure channels.
3. Select at least two of the channel names in the window with Control + click or Shift + click. The first selected channel is always the X channel
4. Press the Add Scatter Plot button at the bottom of the screen.
5. Press the OK button.


The timespan of the traces matches the time span of the traditional time-domain plots. Pan and zoom a time domain plot to 
change how much is shown on the scatter plot.

WARNING: This is a development release.  

There may be bugs.

Some bits are not working for scatter plots.  For example, the configure channels window does not appear for these plots.

Some needed interface is not yet included.  There's no way to change the X channel for a scatter plot yet, other than to 
open a new window and add the new X channel to the command line.  Scatter plots cannot be saved to or configured in yaml files.  Many more bits aren't done.

Comments related to this report
arnaud.pele@LIGO.ORG - 11:52, Thursday 02 July 2026 (90878)

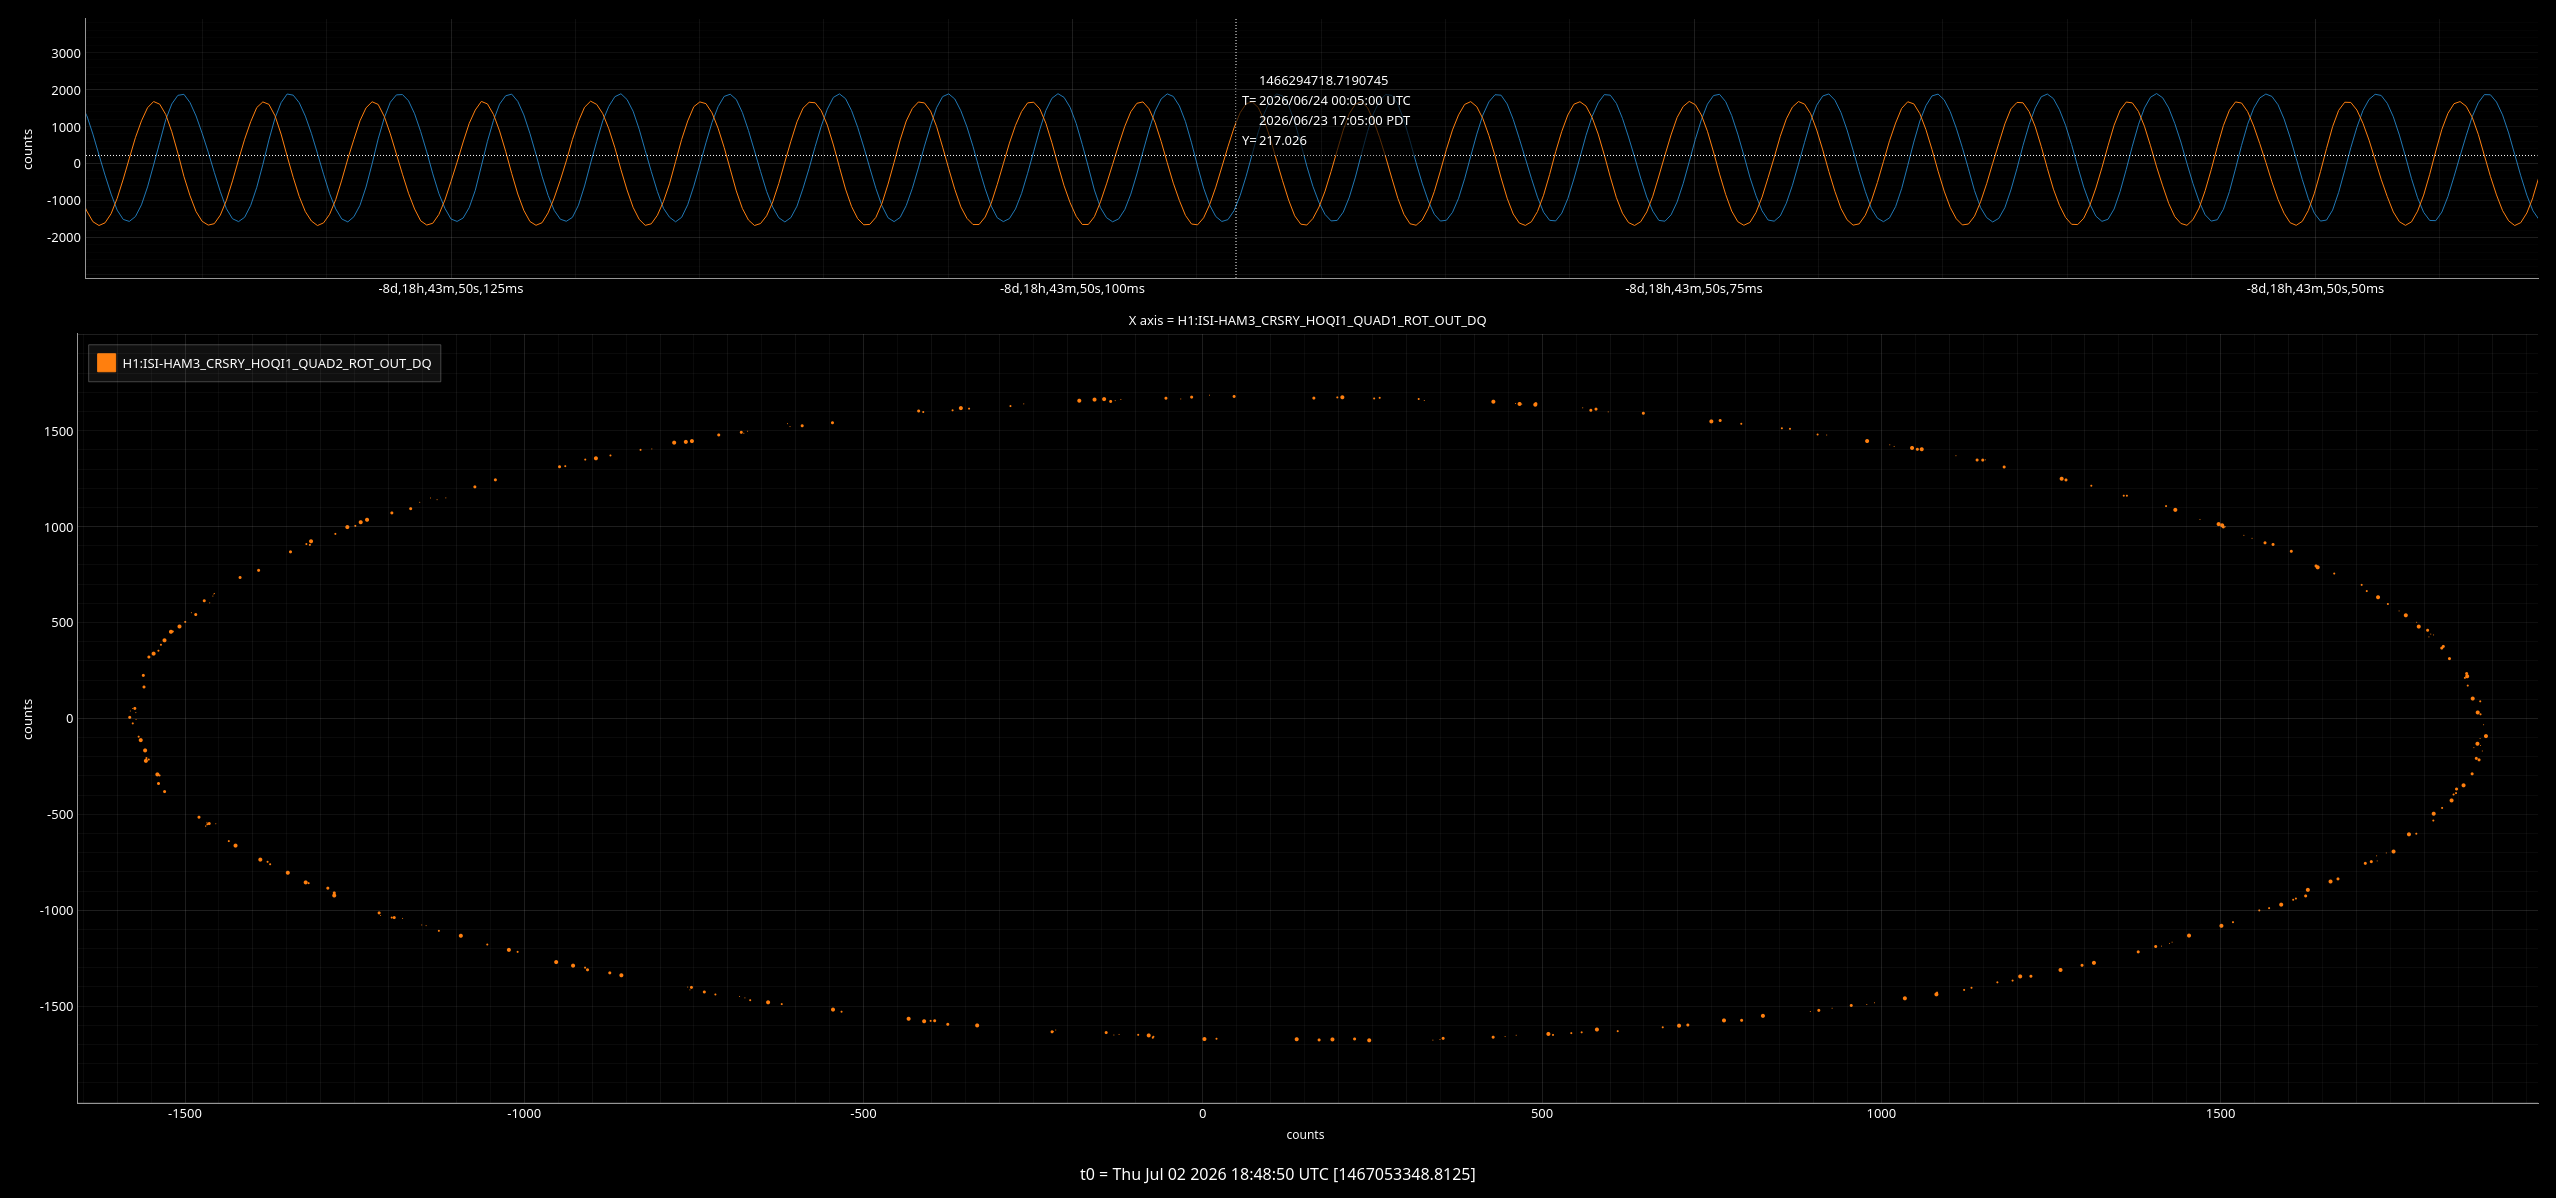
Thank you Erik, this is going to be a useful feature for the CRS commissioning. 

I tested it with the following channels and confirmed that it works well (looking back in time when the CRS was online) : 

ndscope-test --scatter H1:ISI-HAM3_CRSRY_HOQI1_QUAD1_OUT_DQ H1:ISI-HAM3_CRSRY_HOQI1_QUAD2_OUT_DQ

The only feature request that I have is to set the X-Y to the same dimensions (or force the figure to be a square). In our application, we are evaluating how circular is the scatter plot, so having the X-Y different dimensions distorts the circle to an ellipse. For the same reasons, we would always set both axis limits to the same values, so having a way to do this quickly would be helpful.  

Images attached to this comment
H1 SUS
thomas.shaffer@LIGO.ORG - posted 15:18, Wednesday 01 July 2026 (90857)
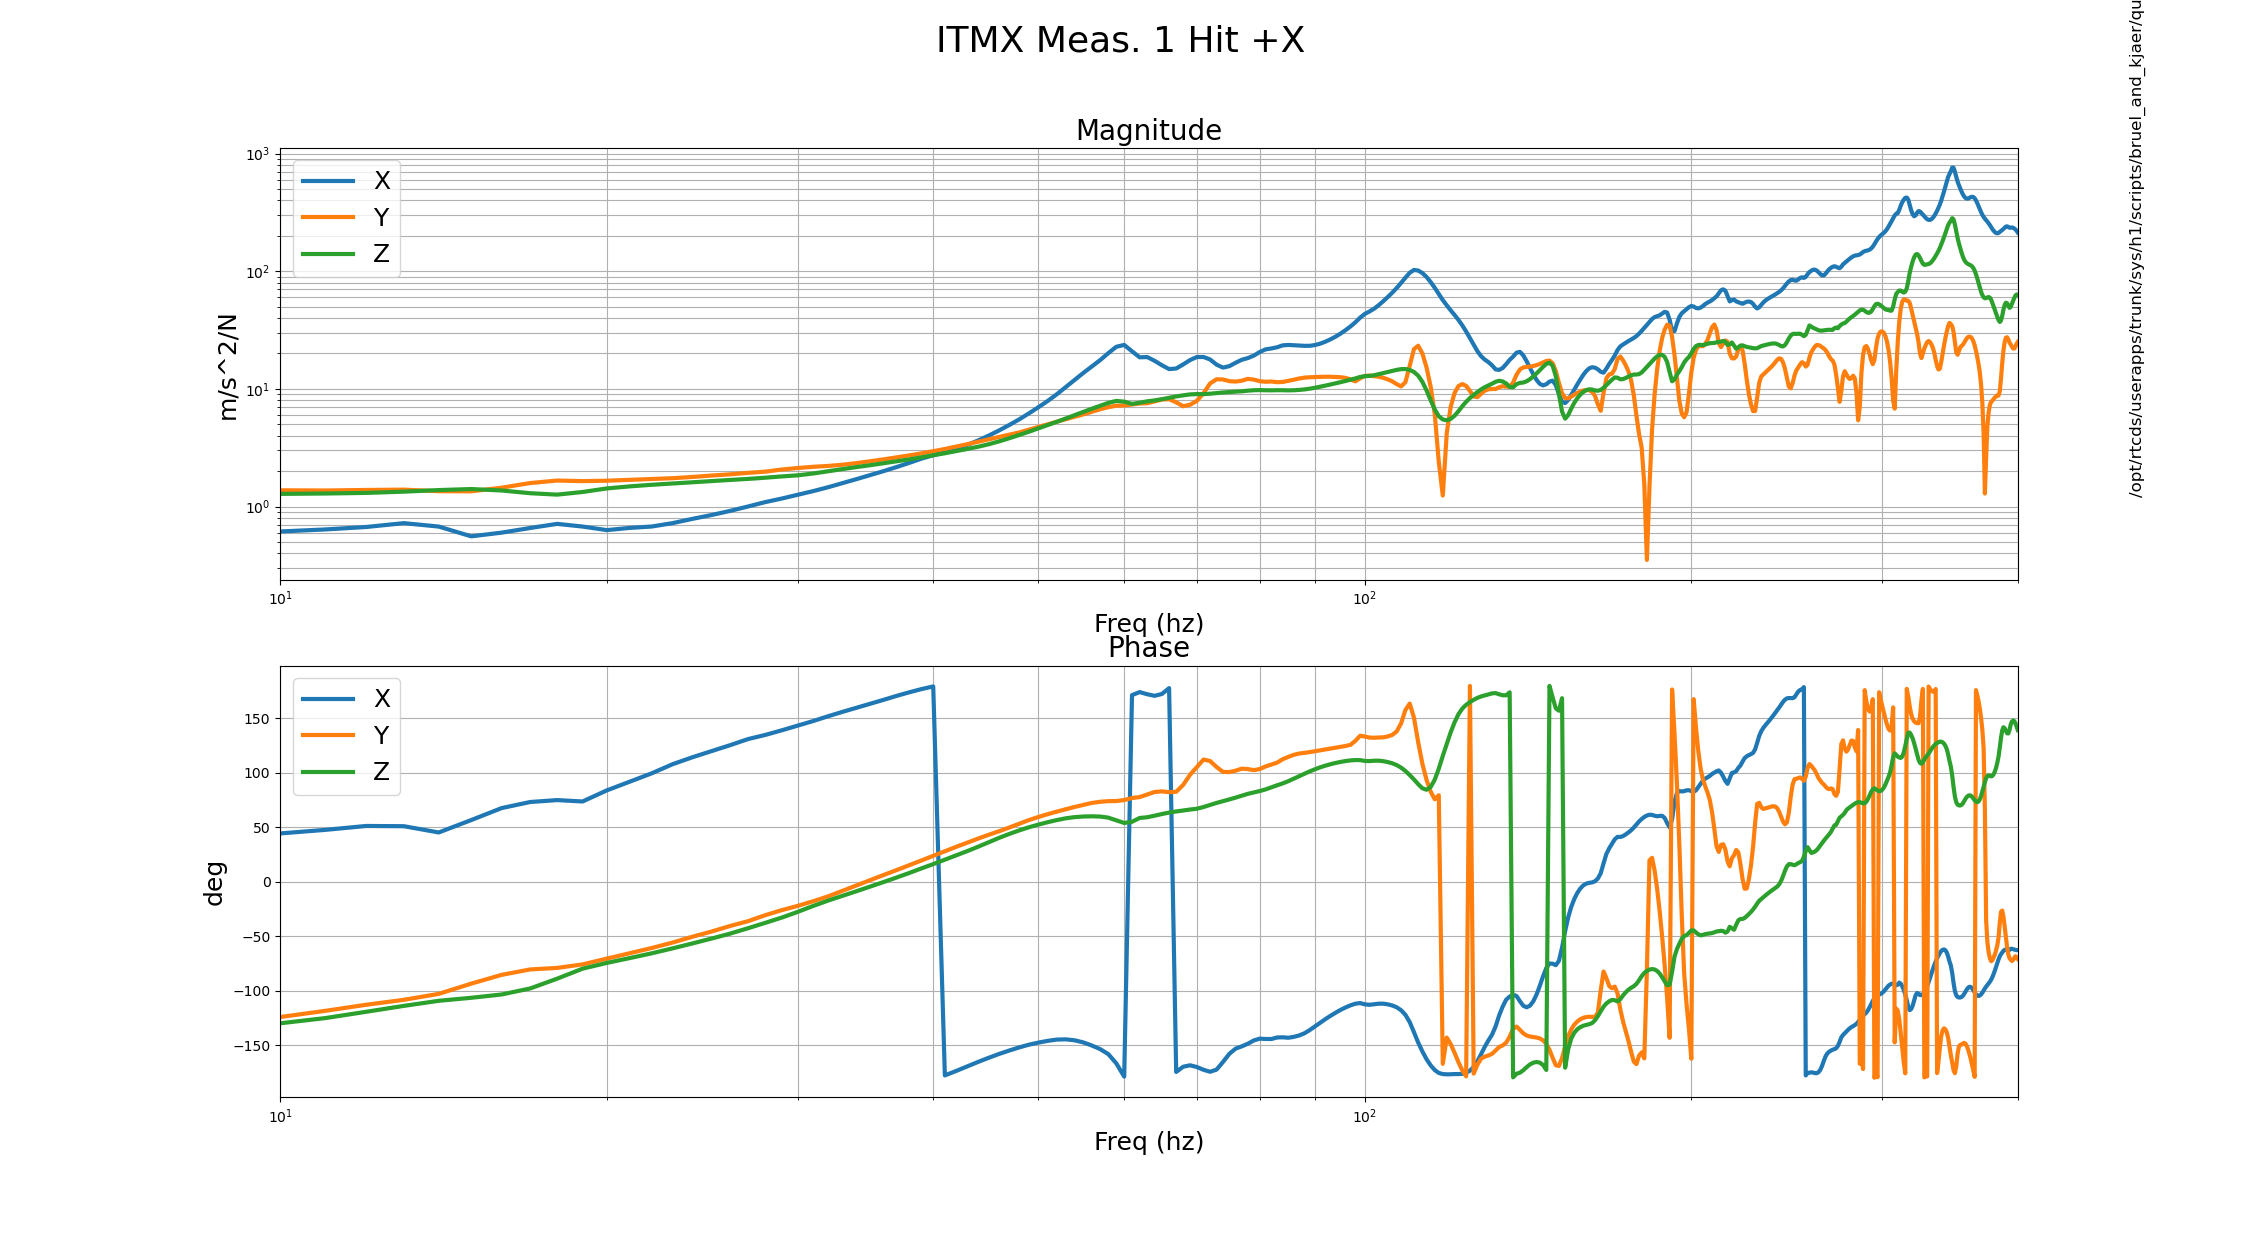
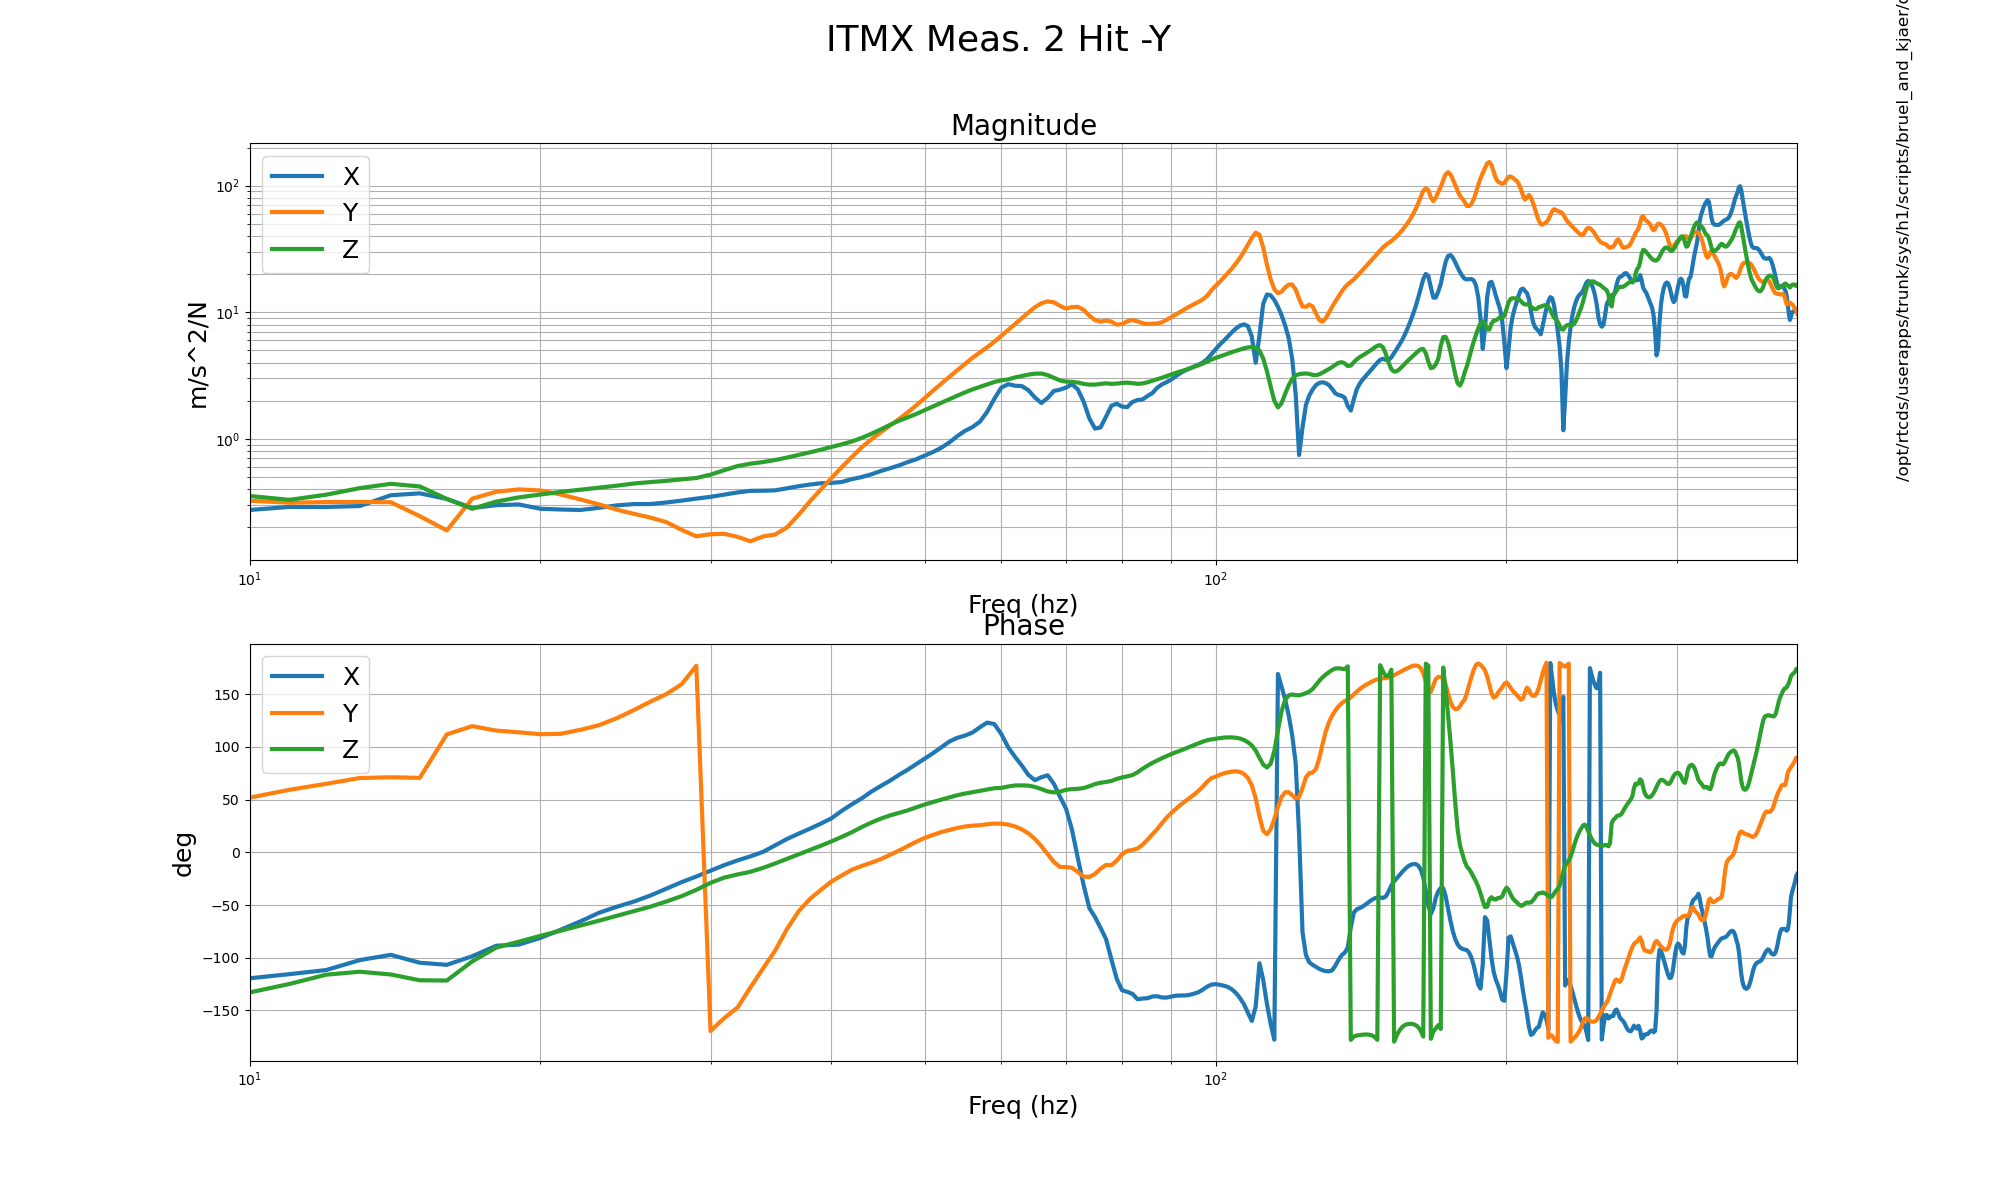
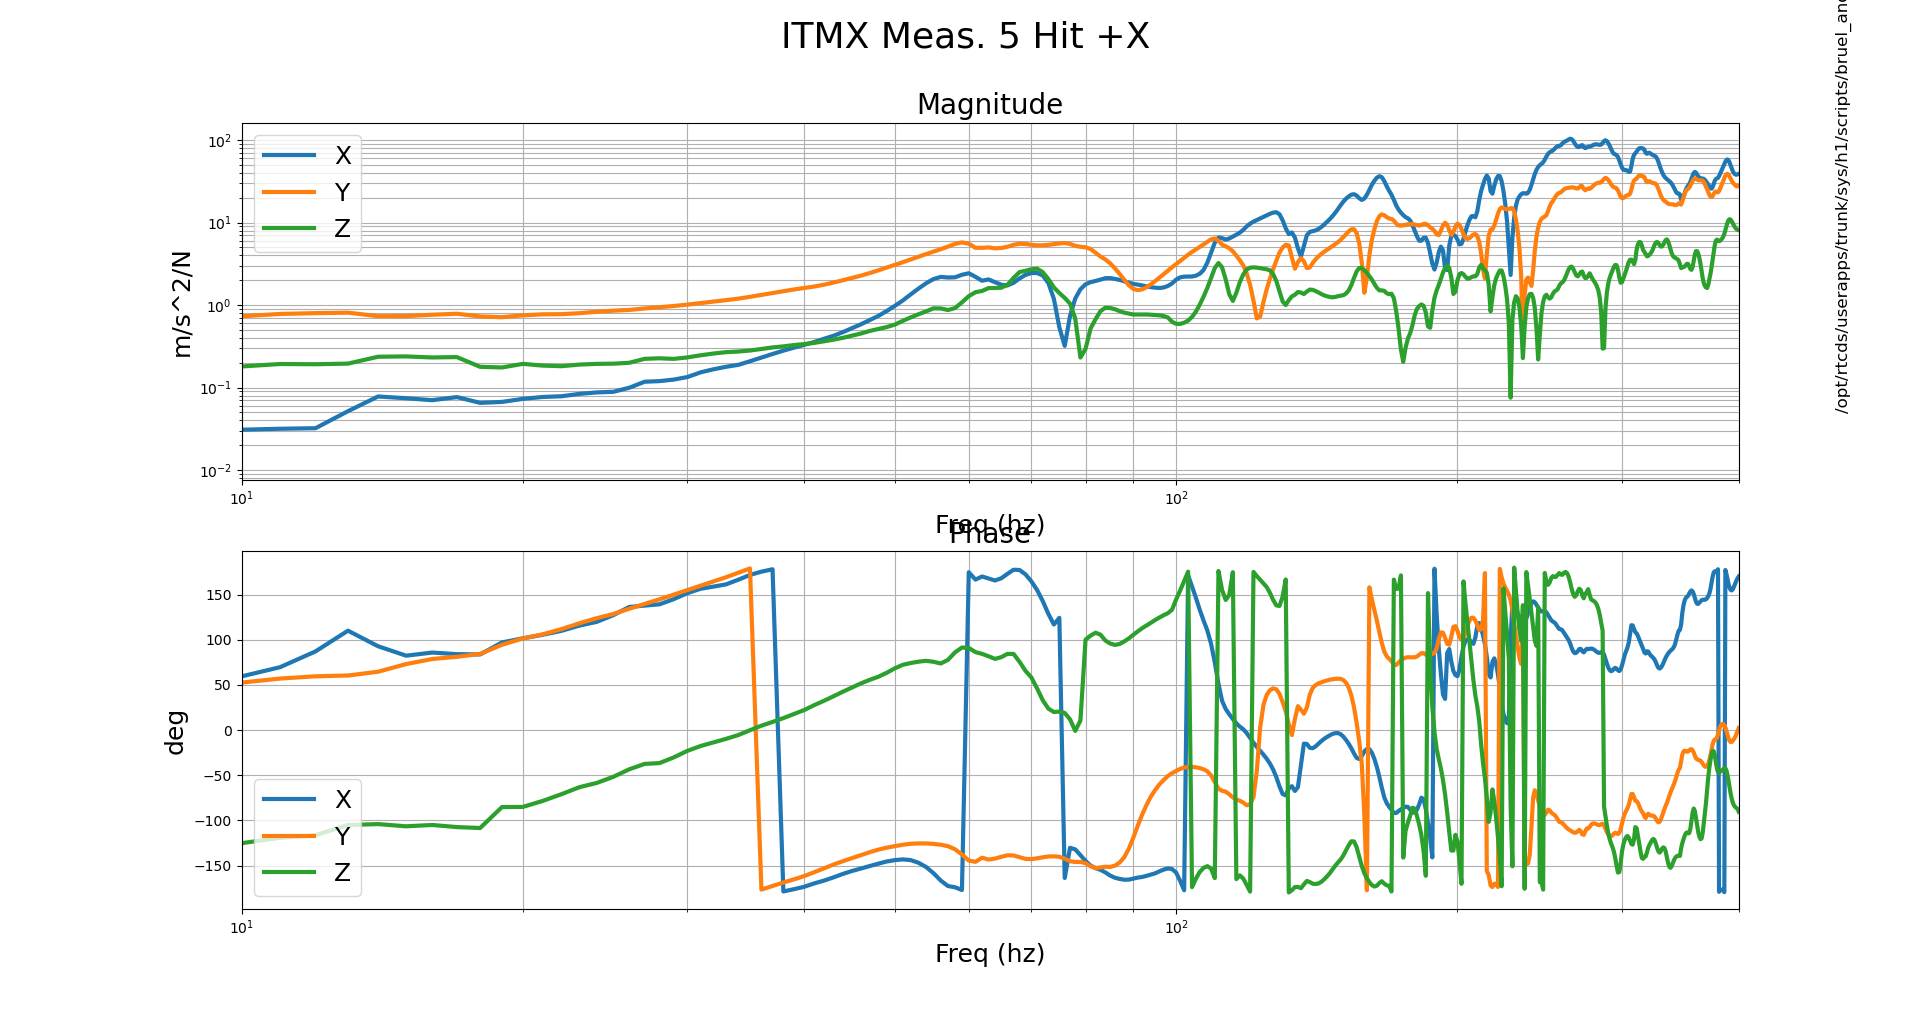
ITMX B&K results

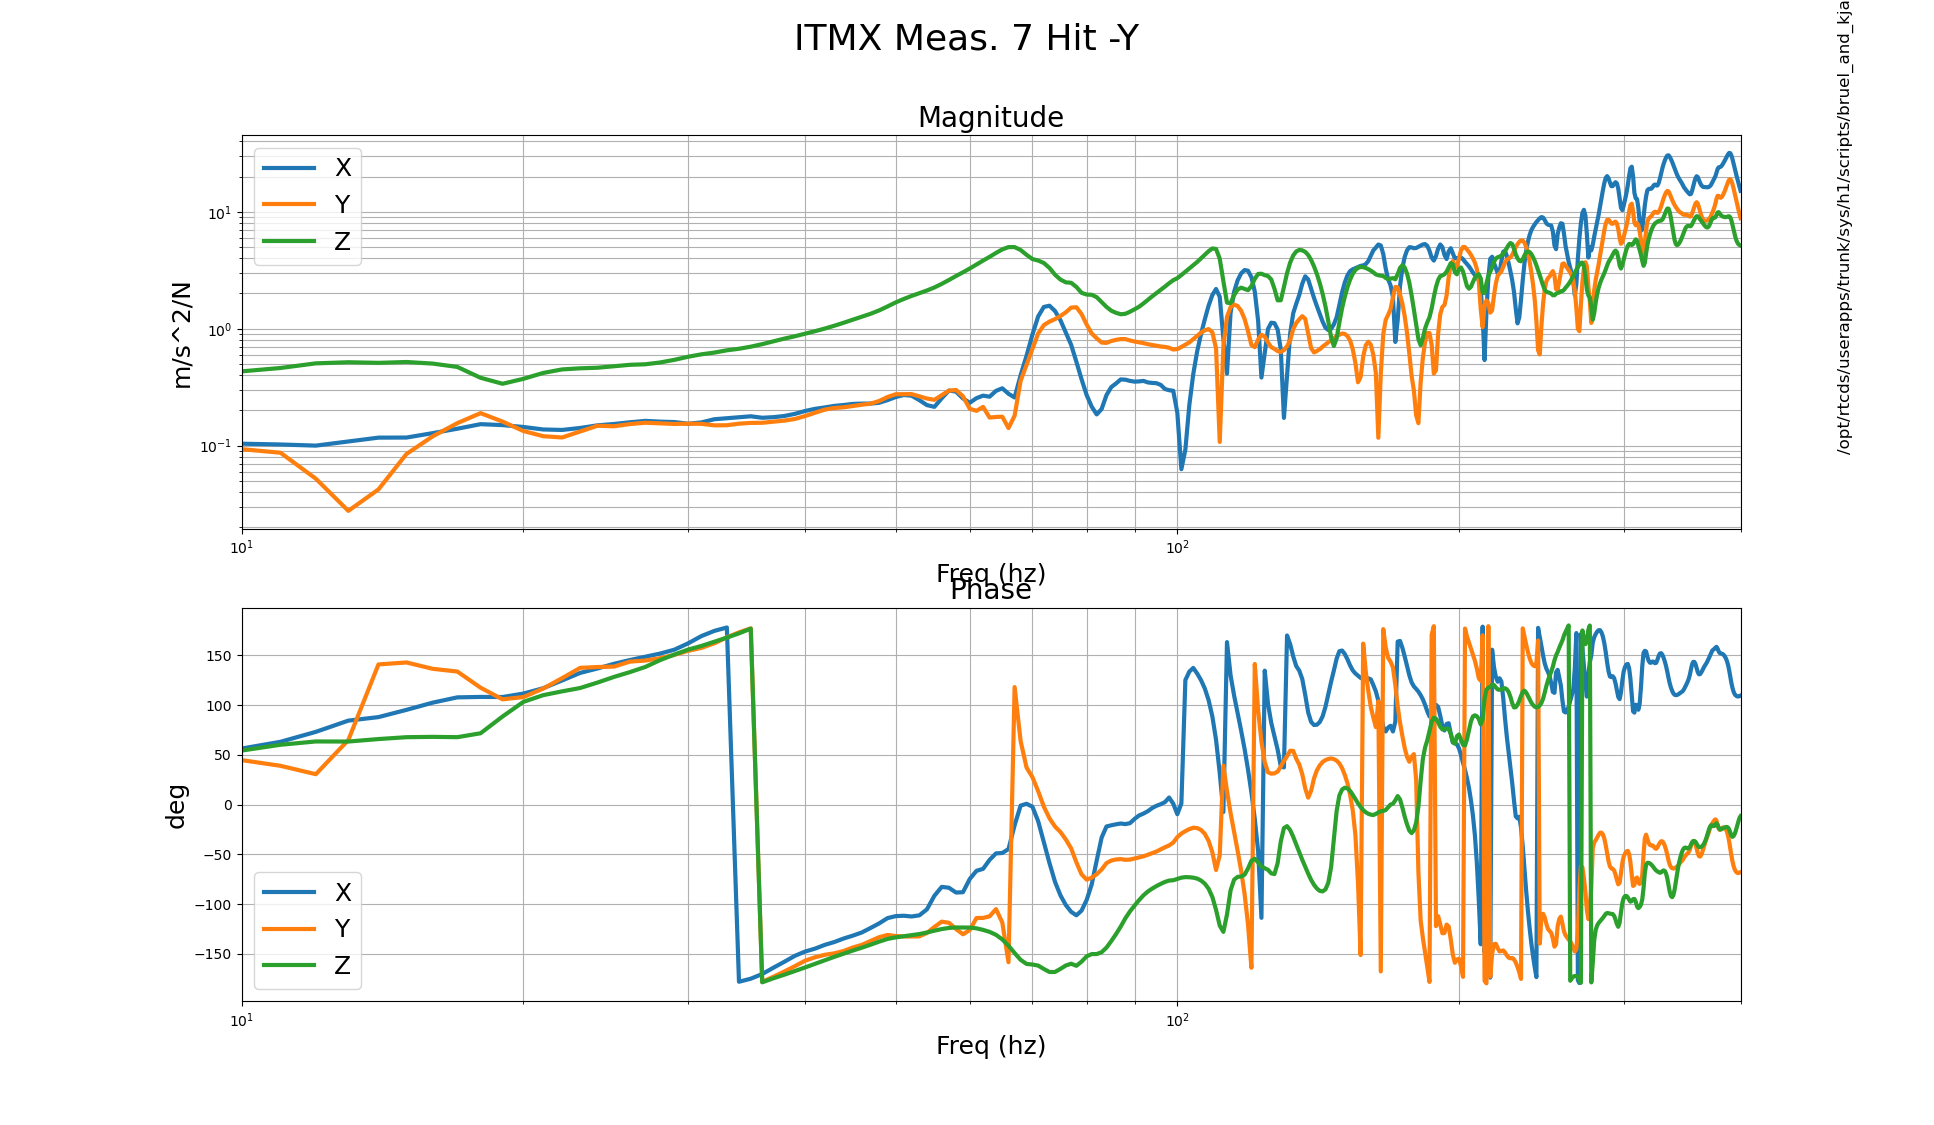
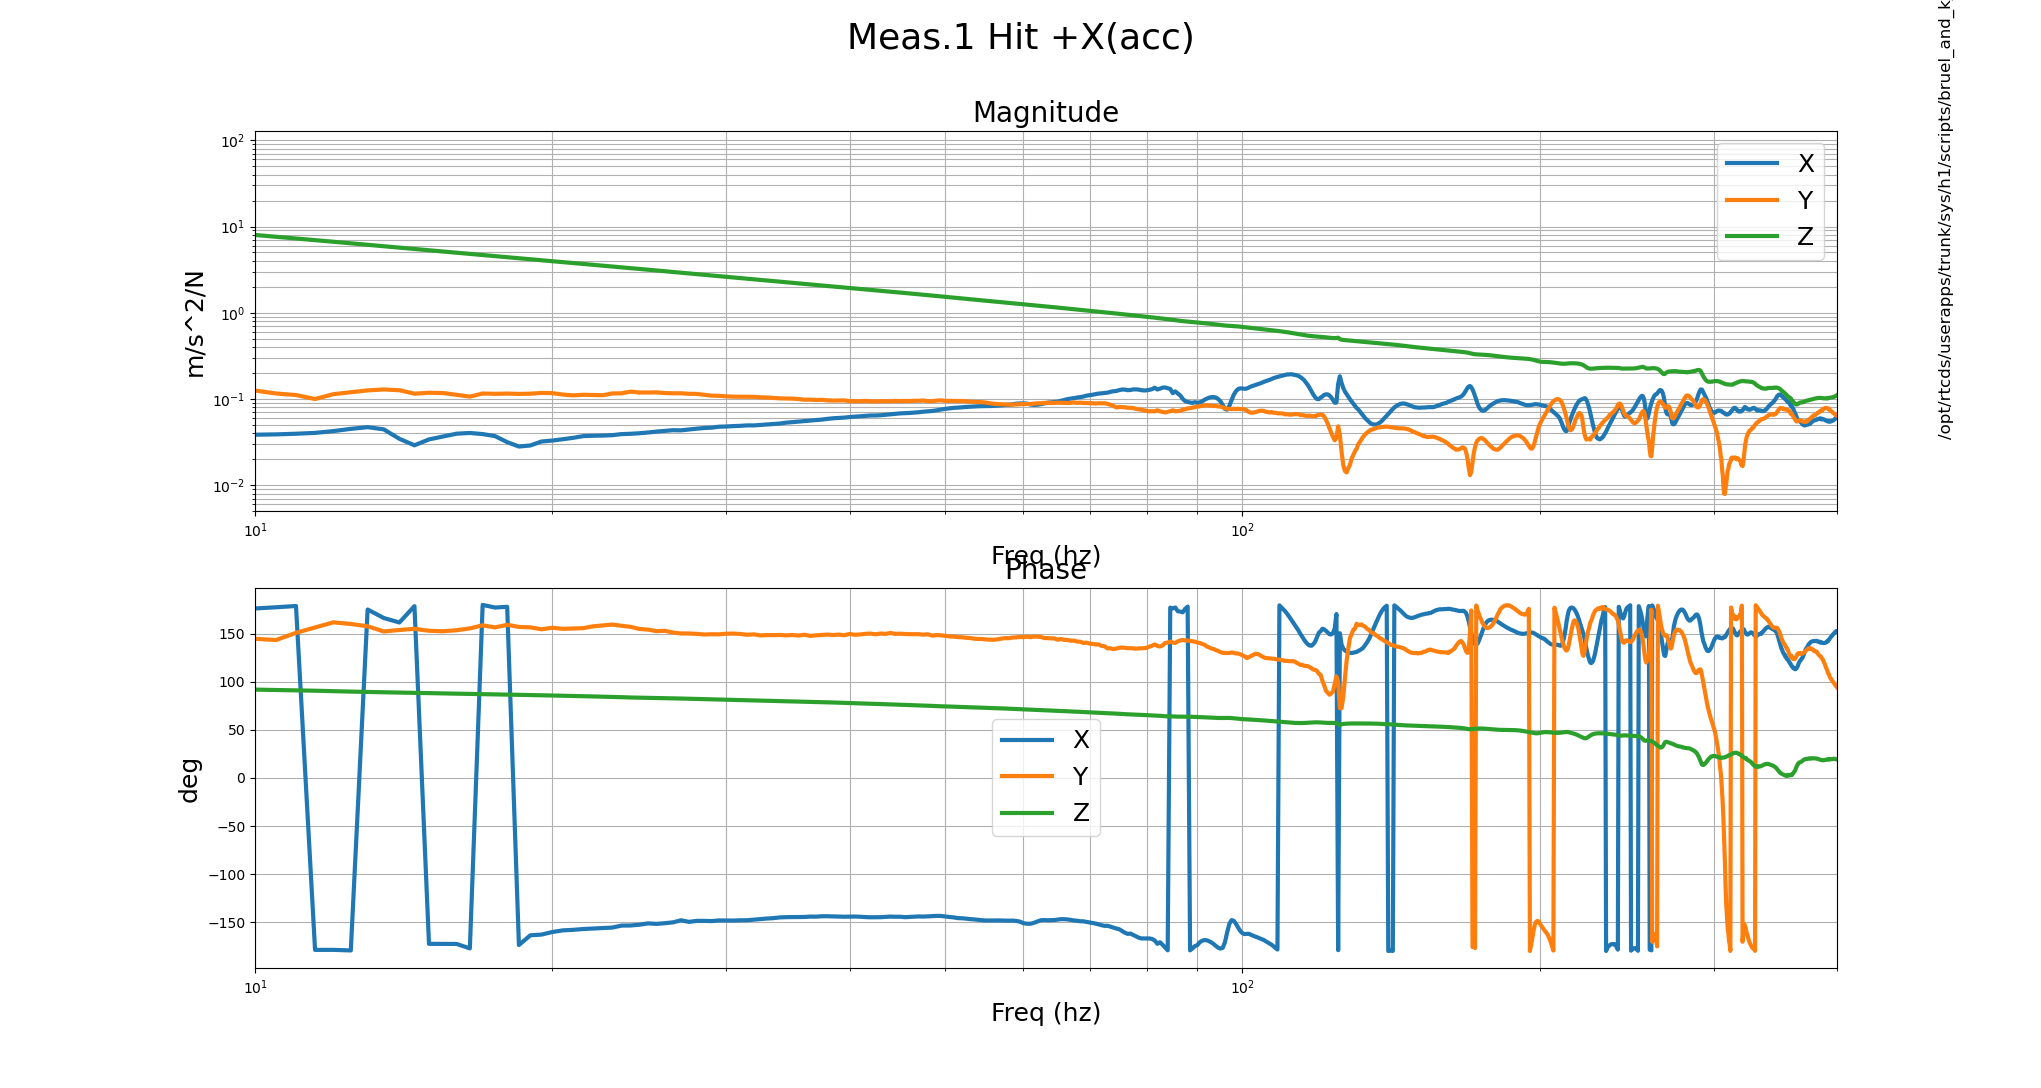
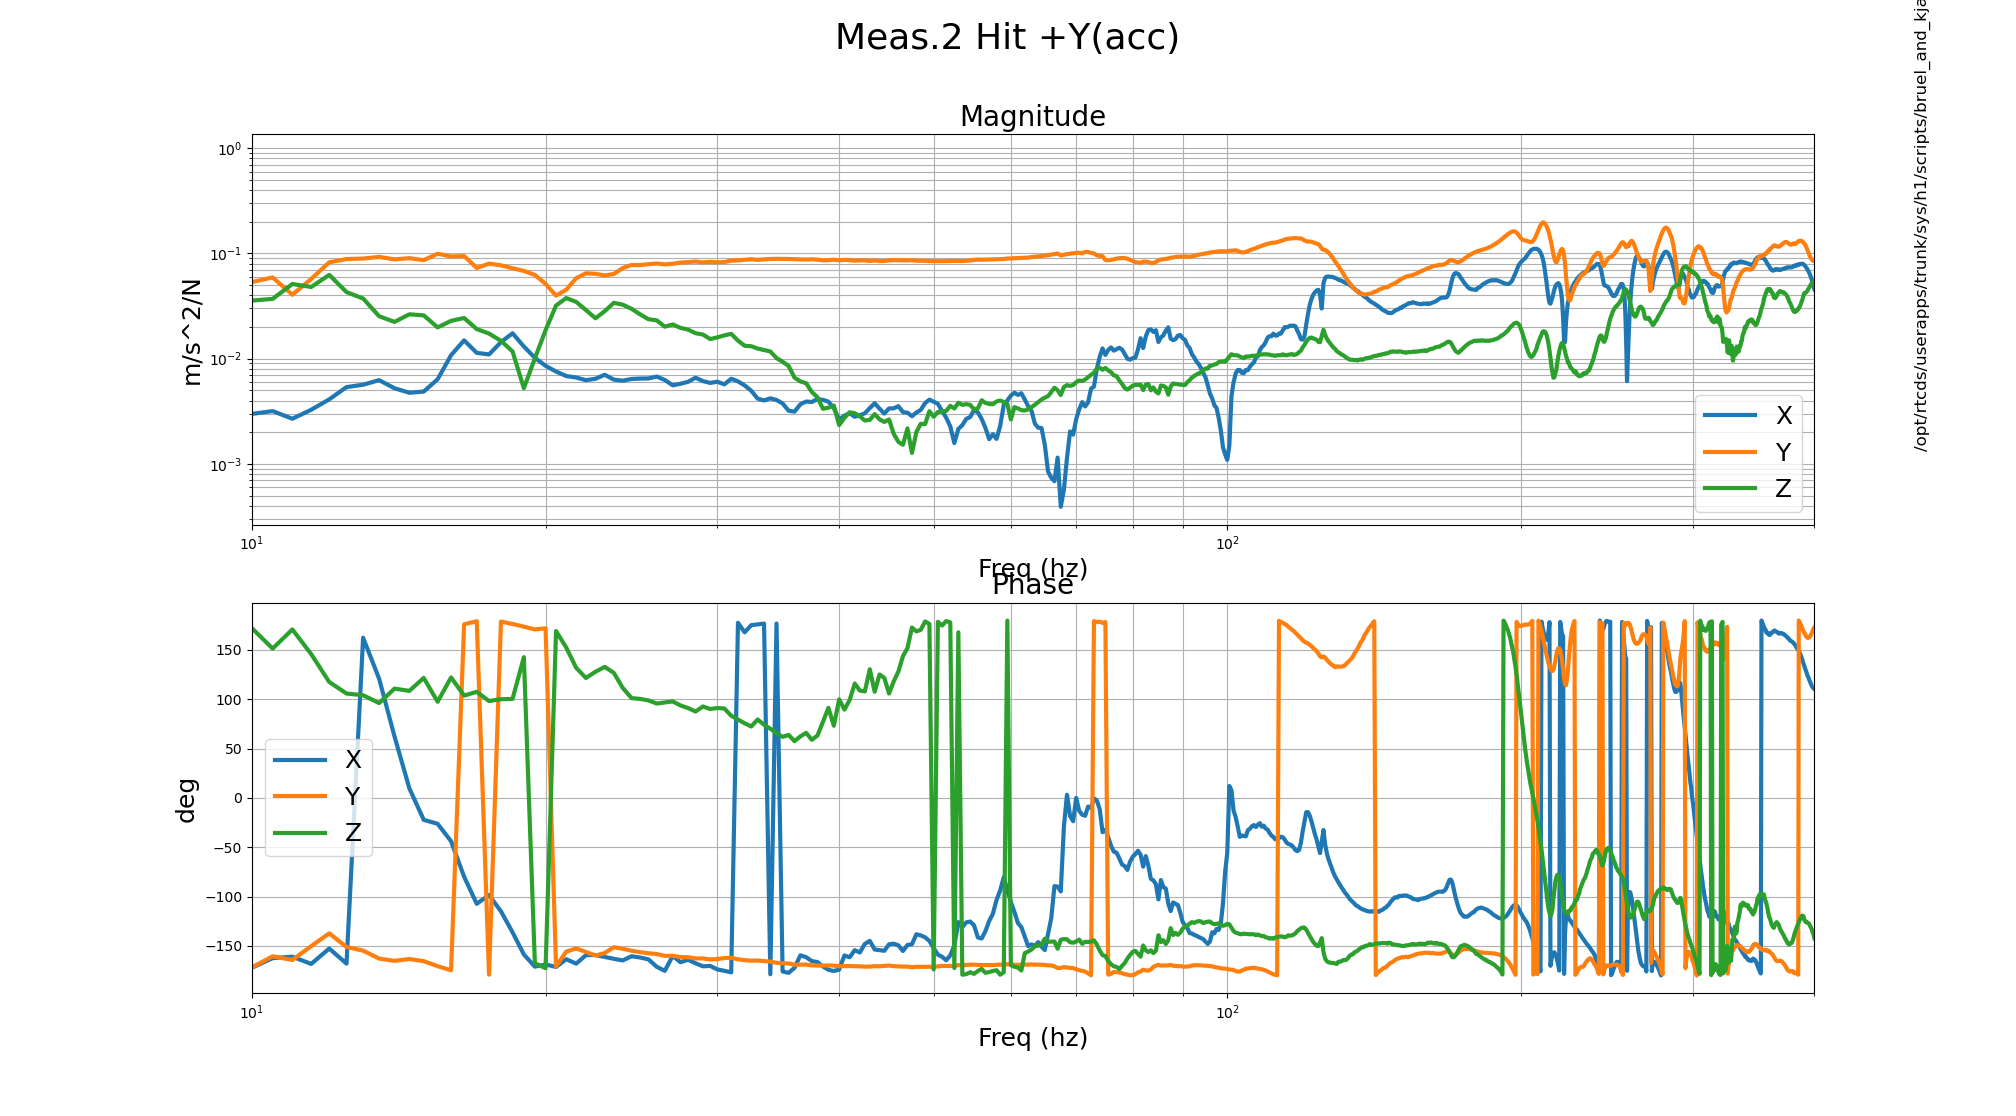
Rahul K, Ibrahim A., TJ S

SEI & SUS configuration: BSC3 ISI and HEPI were locked, suspension unlocked and damped.

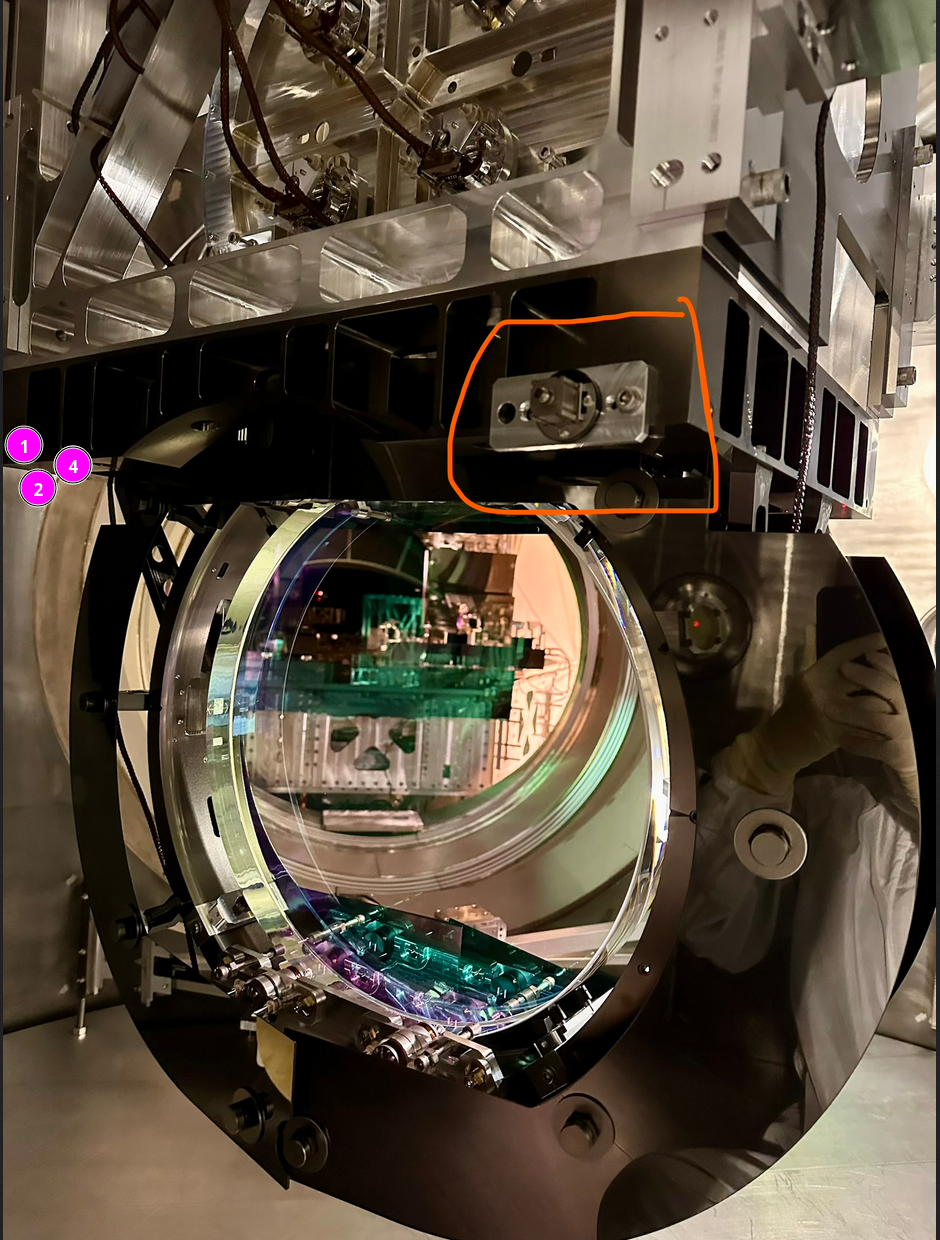
Accelerometer position 1 - Mounted at the bottom of the cage near the 7oclock position as seen in this photo. Accelerometer axis=IFO axis.

Meas 1 - Hitting near the accelerometer at around the 7 o'clock position in the +X direction.

Meas 2 - Hitting -Y around the 9 o'clock position.

Meas 4 - Hitting in +Z at the 6 o'clock at the bottom of the cage.

Accelerometer position 2 - This was the analagous spot to the ITMY measurements, on the cross bar between the penultimate mass and the bottom stage. Accelerometer axis to IFO axis (X,Y,Z=-Z,+X,-Y)

Meas 5 - Hitting in +X(ifo) on the crossbar under where the accelerometer is mounted.

Meas 6 - Hitting down, -Z (ifo), on the crossbar near accelerometer.

Meas 7 - Hitting in t -Y(ifo) direction on the +Y structure around the 9 o'clock position around the TM.


The logitudinal and transverse modes were about 0.5Hz lower with the accelerometer mounted in the second position, but hard to tell with this resolution.

First Mode Frequency (Hz)
Longitudinal 59-59.5
Transverse 66.5-67


LHO ITMY B&K results found at alog90512. To save you the click, ITYM long. = 57.5Hx and Trans.=64,67.5Hz

Images attached to this report
H1 SUS
thomas.shaffer@LIGO.ORG - posted 15:18, Wednesday 01 July 2026 (90843)
BBSS B&K results

Rahul K, Ibrahim A., TJ S

SEI & SUS configuration: BSC2 ISI and HEPI were locked, suspension unlocked and damped.

Accelerometer position #1 - Mounted in a similar position from when Rahul B&K'd the BBSS in the staging building last year (T2500205). Axis for the accelerometer are +X=perpendicular to BS surface, +Y parallel to BS in the -X-Y direction, and +Z=IFO+Z. DOFs mentioned from here on will be in the accelerometer axis unless otherwise specified.

Meas 1 - Hitting in the +X direction on the corner opposite of the accelerometer.

Meas 2 - Hitting +Y on the same corner.

Meas 3/4 - Hitting in +Z on the same corner (data from measurement 4 but 3 in my notes)

Accelerometer position #2 - The accelerometer was then mounted on the bottom structure on the AR side, at the 4o'clock position. Unfortunately, the data from this set seems to all be noise, something I couldn't quite tell chamberside.

This isn't the best data and I don't' see any clear peaks other than the 21Hz and 47Hz on the 3/4 measurement. The first longitudinal mode that I see is maybe at 111Hz. If we compare to LLO (LLOalog81300), our 111Hz should be the second order of this mode, so we might be in the right ballpark. Either way, I don't see anything egregious, so that's a good sign. It's unfortunate we didn't get the second accelerometer position as I think that would have given us some better movement of the cage. 

For reference LLO's inchamber BBSS results can be found at LLOalog81300.

Images attached to this report
H1 SQZ
eric.oelker@LIGO.ORG - posted 11:21, Wednesday 01 July 2026 - last comment - 14:32, Wednesday 29 July 2026(90845)
Determining the ROC for ZM4 and ZM5

[Sheila, Camilla, Ryan, Eric]

We would like to verify that our recent mode measurements after ZM5 ( 90783) and before ZM4 (90815 ) make sense by connecting the two.  We decided to use the q value from the measurement at the nominal ZM2 strain in 90815 (ZM2 strain = 3.15V) and propagate that mode through the path containing ZM4 and ZM5 and calculate the overlap with the q values from 90783 measured at different strain settings for ZM4/ZM5.  The goals here are as follows:

  1. Improve our model of the ZM4 - to - SEC path and verify that we're interpreting our mode measurements (with M^2 > 1) correctly.  
  2. Determine the ROC for ZM4 and ZM5 as a function of the strain gauge voltage.  This is particularly important since we are going to replace ZM5 and Camille would like to know what ROC to shoot for with the pre-stressing procedure.


First, I address item 1.

Mode Measurements with M2 > 1:

Our system seems to be adding some higher order abberations to the beam.  As a result, our mode measurements indicate that we have an M^2 number significantly above 1 (between 1.2 - 1.5 depending on the PSAM settings).  When M^2 is > 1, the presence of HOM content in the beam prevents one from focusing down to as tight of a waist, for the same divergence angle, the beam radius at the waist will be larger by a factor of M.  The thorlabs beam profiler accounts for this by fitting the data to the following formula (which we confirmed by doing our own independent fit):

w(z)2 = wM2[1 +(z - z0)2 (pi*wM2/(M2*lambda))2]

Where wM2 = M2*w02  Is the waist for a beam with M2>1, and w0 is the waist for the TEM00 component of the beam (ie for M2 = 1). 

The q parameter ends up the same as before:

q(z) = (z-z0) + i*zR

where zR = pi*w02/lambda = pi*wM2/(lambda* M2)

Knowing that M2 > 1 tells us that our beam is a mixture of TEM00 and some higher order mode content.  However, from the M2 value alone we don't know which higher order modes are excited (in principle one might be able to make some rough projections using the surface abberation measurements of the PSAMs from Caltech, but that sounds tricky and is beyond the scope of today's post).  If we want to do mode matching calculations, the only thing we can do at the moment is back propagate the TEM00 component and do all mode calculations for TEM00.  

We use the same beam propagation matricies as always to back propagate the TEM00 component to determine what the TEM00 mode looks like in HAM 7.  

Determination of the ZM4 and ZM5 ROCs

I then took the q value (for the nominal ZM2 = 3.15V) from the measurement before ZM4, back propagated it to ZM4 using our length measurements.  I then propagated the q through ZM4 and ZM5 and calculated the overlap with the q values measured after ZM5 for various values of the ZM4/ZM5 strain gauge settings in ( 90783)

Then, the ROCs for ZM4 and ZM5 were chosen for each strain gauge settings to maximize the overlap.  The overlap is => 98% over the entire 2D grid of ZM4/ZM5 strain gauge values, which gives us some confidence that the ROC values are accurate.  One thing that gives us pause is that the change in ROC for ZM5 doesn't appear to change linearly in diopters with the strain gauge reading.  ZM4, on the other hand is roughly consistant with a 5 mD/V change though because the beam spot is quite small on ZM4, we are relatively insensitive to its ROC value.

ZM4 Strain (V) ZM4 ROC (m)
2.0 -12
4.0 -11
6.0 -10
8.0 -9


ZM5 Strain(V) ZM5 ROC (m)
-4.5 3.8
-2.0 4.05
0.0 4.4
2.0 4.55


These values give the following overlaps for the x and y direction (our mode measurements indicate we have non-negligible asitgmatism on this path) for propagating the nominal q value from (90815 where ZM2 strain = 3.15) to the q vales from ( 90783) .

ZM4 \ ZM5 -4.5 -2.0 0.0 2.0
2.0 x = .994, y = .995 x = .998, y = .997 x = .990, y = .995 x = .9874, y = .993
4.0 x =.996, y = .997 x = .994, y = .995 x = .986, y = .992 x = .983, y = .991
6.0 x =.995, y = .997 x =.992, y = .993 x =.983, y = .989 x =.980, y = .984
8.0 x =.993, y = .995 x =.990, y = .992 x =.980, y = .984 x =.977, y = .980

The fact that this set of ROC values gives good overlap over the entire 2D grid suggests that these ROCs are a resonable model for ZM4 and ZM5 at these strain gauge settings.


Attached is an a la mode file for doing the beam propagation.  One could do some more intellegent fitting of the data to extract the best ROC estimates; I'm just sorta hand fitting it at the moment.

Non-image files attached to this report
Comments related to this report
camilla.compton@LIGO.ORG - 15:08, Wednesday 01 July 2026 (90859)

We have ZM5 SN4 installed now. Original data before we changed the preloading (E2100297) had the ROC range 3.0m to 3.9m. With at 0V applied 667mD optical power, with 200V applied 508mD.

In alog 75709 we increased the preload from 20 in lb to 47 in lbs. An estimated linear increase of 65mD as according to T2300426, changing the preloading changes the optical power by 2.4mD/in.lb.The preloading should make the magnitude of the optical power larger, so it should be increased to 667mD - 2.4mD/in lb * 27 in lbs = 602mD mD with 0 V on the PZT, 443mD with 200V on the PZT. This is an estimated ROC range of  3.3 to 4.5 meters for strain gauge -5.0 to +2.6V (it's range with 0V and 200V applied). This mostly agrees with Eric's data. 

We have ZM4 SN1 installed now. Original data before we changed the preloading (E2100289) had the ROC range -19.3m to -9.0m. With at 0V applied -104mD optical power, with 200V applied -221mD.

In alog 75677 we increased the preload from 46 in lb to 75 in lb. An estimated linear increase of 70mD.  This should be increased to -104mD - 2.4mD/in lb * 29 in lbs = -174mD mD with 0 V on the PZT, -291mD with 200V on the PZT.  This is an estimated ROC range of -11.5 to -6.9 meters for strain gauge 1.0 to 8.3V. This mostly agrees with Eric's data.

eric.oelker@LIGO.ORG - 09:02, Thursday 02 July 2026 (90873)

I attempted to confirm these values by repeating this exercise with a second dataset from 90827.  This was an additional set of q measurements made directly after ZM4.  The idea here is that this should allow us to fit the ROC values for ZM5 only by taking these measured qs, propagating them through ZM 5 and comparing with the measurements from 90783.  Unfortunately this did not proceed as smoothly.  The fits and mode overlap values are tabulated below.  This isn't too far from the old ROC range, but the agreement between the q values isn't nearly as good as before


Rough values for ZM5:

ZM5 Strain (V) ZM5 ROC (m)
-4.5 4.0
-2 4.3
0 4.7
2 4.9

 Mode overlap after propagating through ZM5 assuming the above ROC values.  I was mostly optimizing the y value; the astigmatism seemed to be quite different in this dataset, leading to poor x/y agreement when propagating and comparing with the other data.  

ZM4 \ ZM5 -4.5 -2 0 2
2 x = .975, y = .996 x = .976, y = .990 x = .954, y = .986 x = .948, y = .982
4 x = .981, y = .994 x = .971, y = .986 x = .956, y = .982

x = .947, y = .981

6 x = .974, y = .992 x = .969, y = .990 x = .946, y = .977 x = .937, y = .971
8 x = .969, y = .990 x = .955, y = .980 x = .940, y = .970 x = .930, y = .963


Non-image files attached to this comment
sheila.dwyer@LIGO.ORG - 16:46, Monday 06 July 2026 (90909)

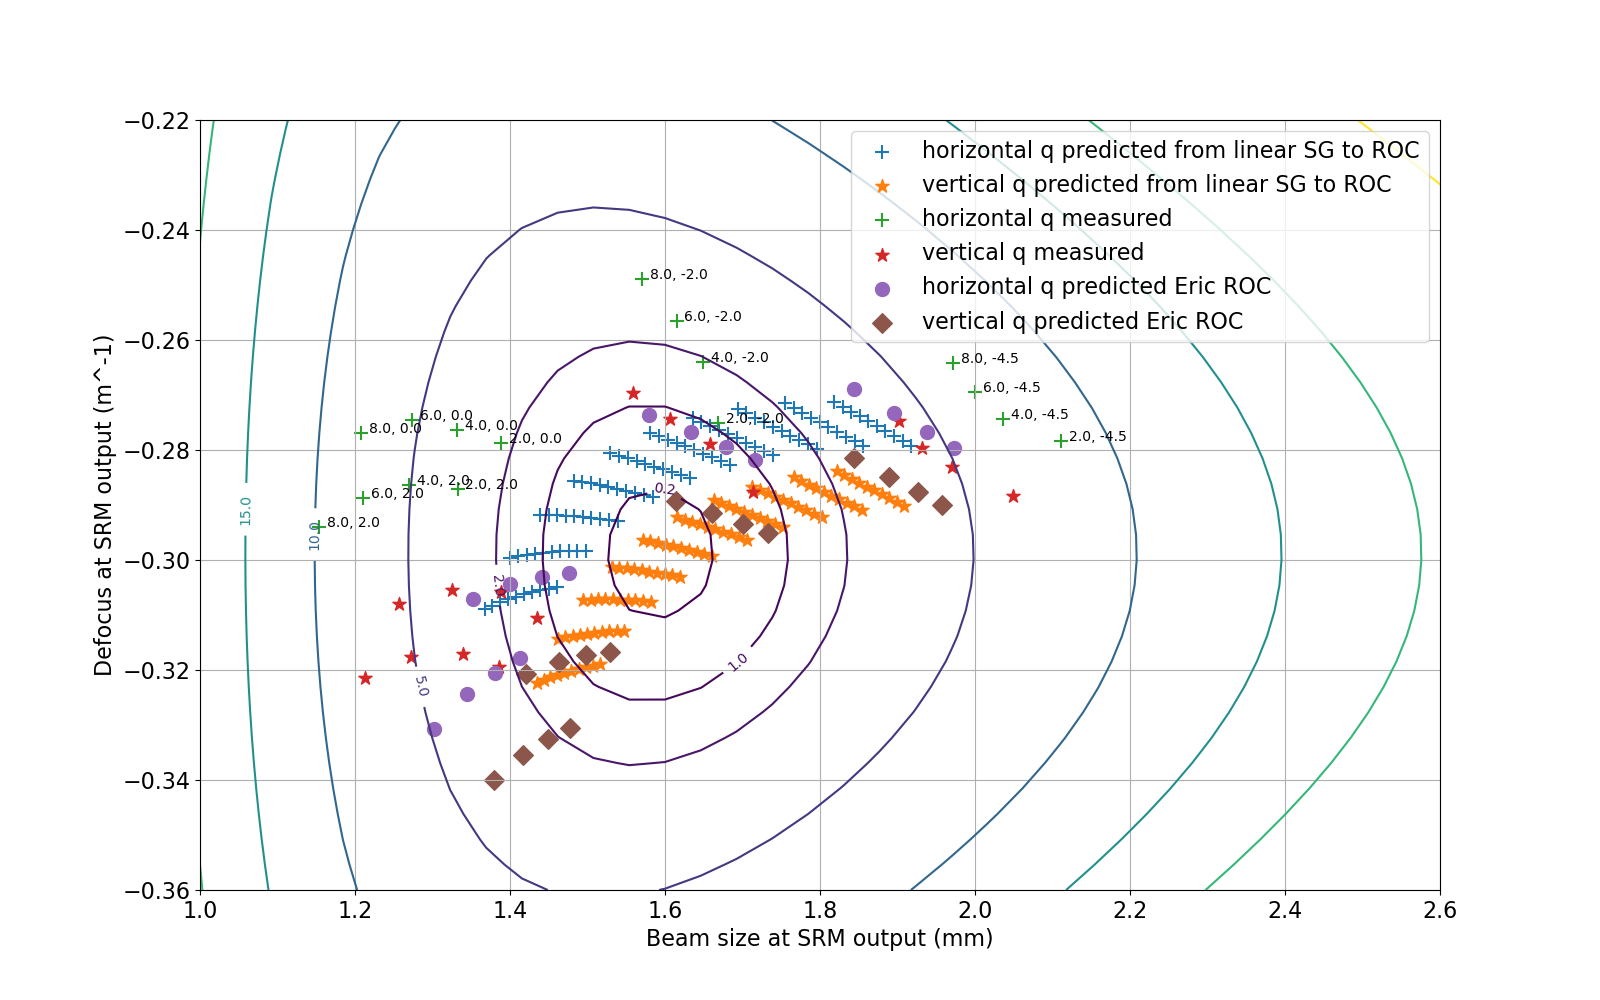
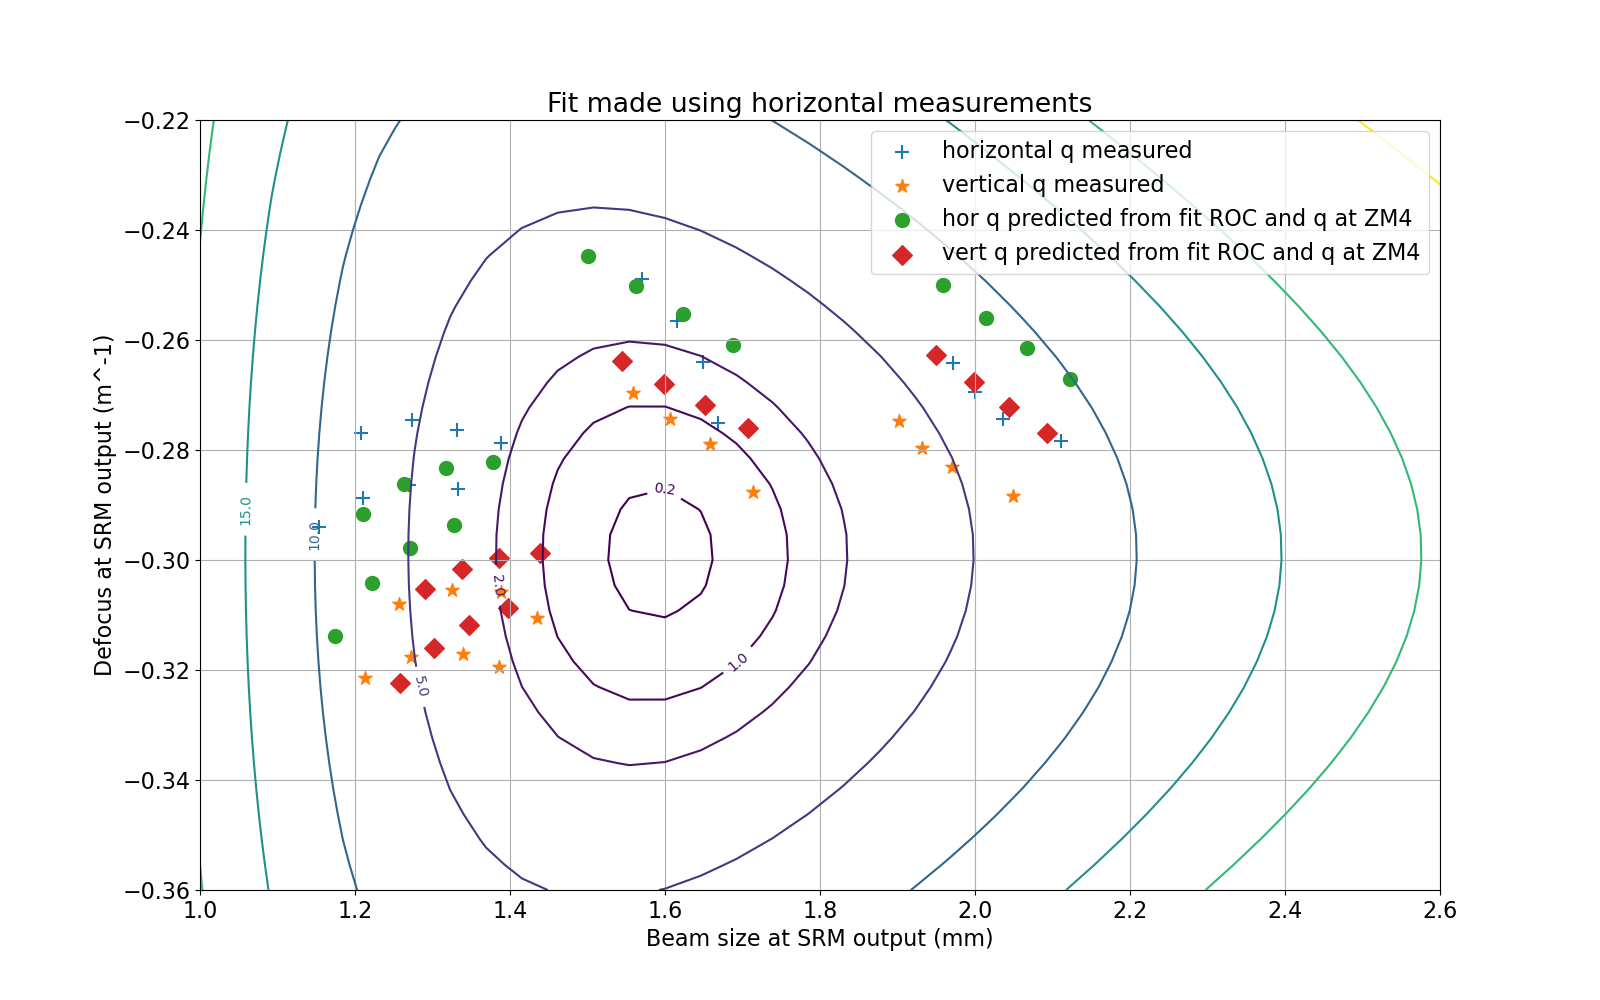
Attached is a Sw plot at SRM made using the ROCs Eric logged above, and the measured q at the input of ZM4.

The measurements seem to be systematically different from the prediction based on ROC and the input q.  I reproduced the overlaps that Eric listed above, and they are similarly above 98% for all of these (the overlap between the prediction and the measurement for each strain guage pair).  

I also made a linear estimate of the diopters per strain guage based on the ROCs that Eric listed above, for ZM4 this give -7mD/ strain guage volt (for -11m ROC at 4V SG), for ZM5 -10.5mD/ SG V (for 4.05m ROC with SG at -2V).  This is shown by the orange stars and blue + in the attached plot, there is some discrepancy with the red and brown "predicted" points (based on just the ROCs that Eric listed above and the input q), because of the nonlinearity of Eric's ZM5 ROCs.  


Images attached to this comment
sheila.dwyer@LIGO.ORG - 09:38, Tuesday 07 July 2026 (90919)

Continuing from Camilla's accounting of where we want the ZM4 preload to be.  

Eric's ROC values above show the range to be from -12m ROC to -9meters (this is not quite the full range but close to it), which is -170mD to -220 mD, so the range of ZM4 psams seems to be close to 50mD.  In Camille's original charachterization data before the preload change E2100289 the range was 118mD.  

If we make a decision on where we want to move ZM4 based on the OMC matching grid in the attachment to 90804, we would gues that we'd want the lower edge of the ZM4 range to be in the middle of the range.  This means we want to reduce the pre-load by 25mD,  reducing the pre-load by 10 in lbs, to 65 in lbs.  

sheila.dwyer@LIGO.ORG - 15:46, Tuesday 14 July 2026 (91013)

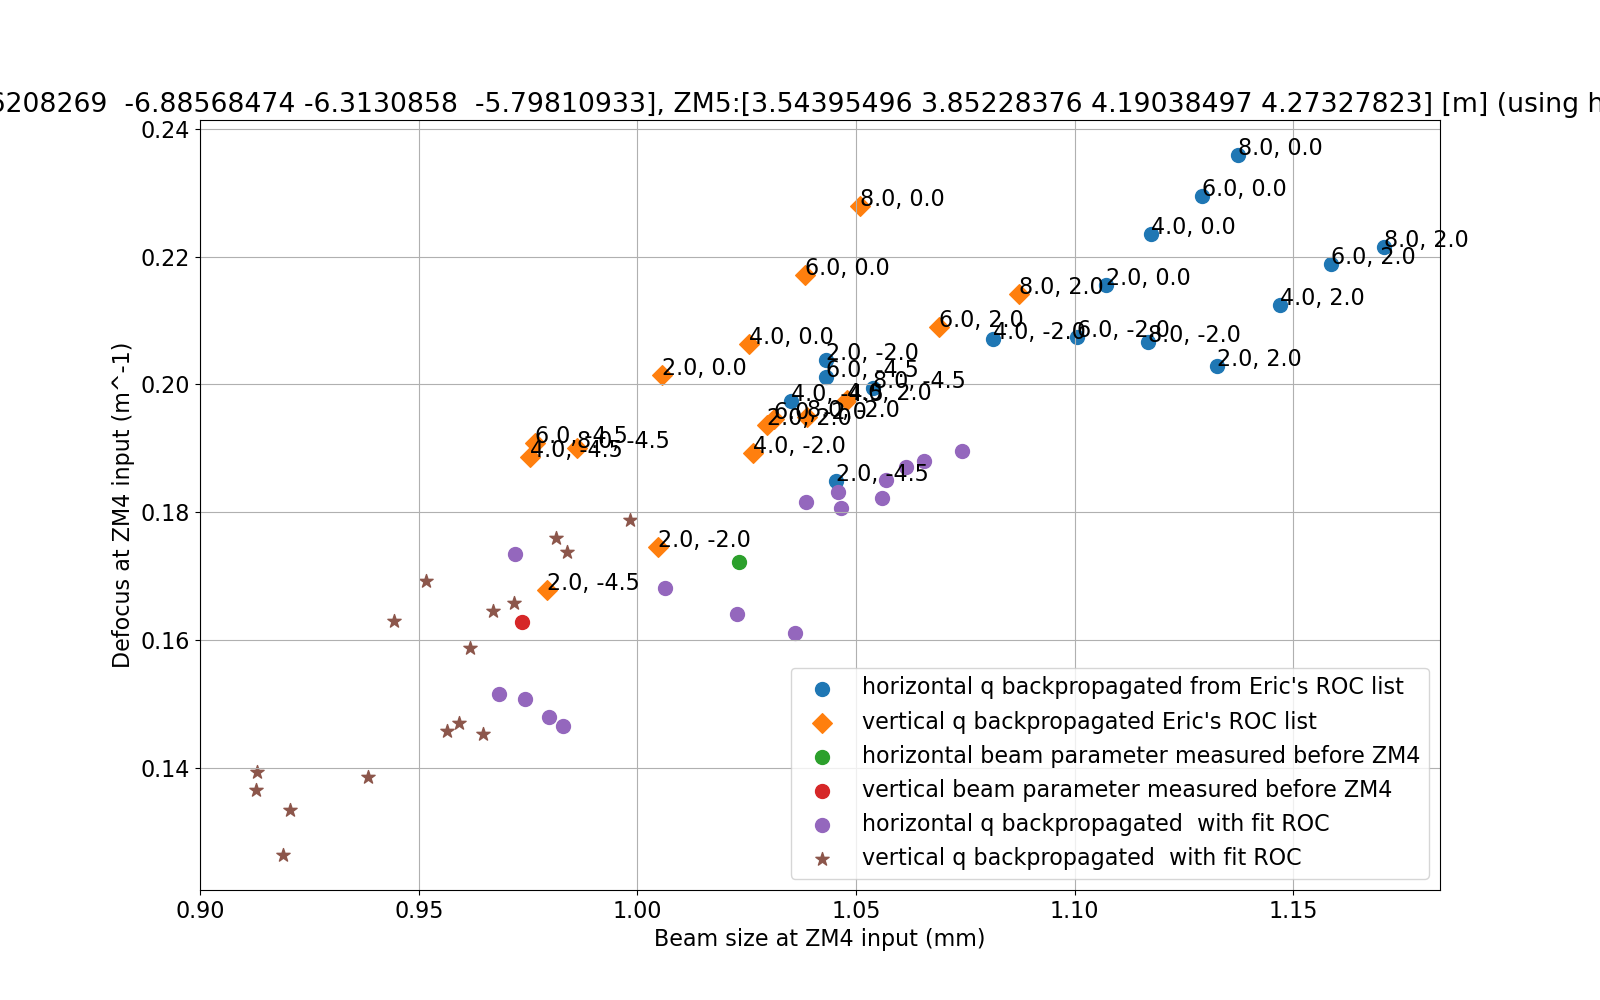
Above, Eric found ROCs for each strain guage value that can predict our measured q's after ZM5 (90783) starting with the measured q before ZM4, where the predicted qs overlapped with the measured qs by more than 98%.  We are aiming for sqz to OMC mode matching of better than 99%, so I wondered if we can get better agreement than this with our measurement technique.  If we want to be able to set ROCs or distances based on these measurements, we want to know if they are repeatable and consistent with a model at a level better than the mode matching that we are trying to acheive.  In O4 we had squeezer to OMC mode mismatch of 2.2%, we would like that to be less than 1%.

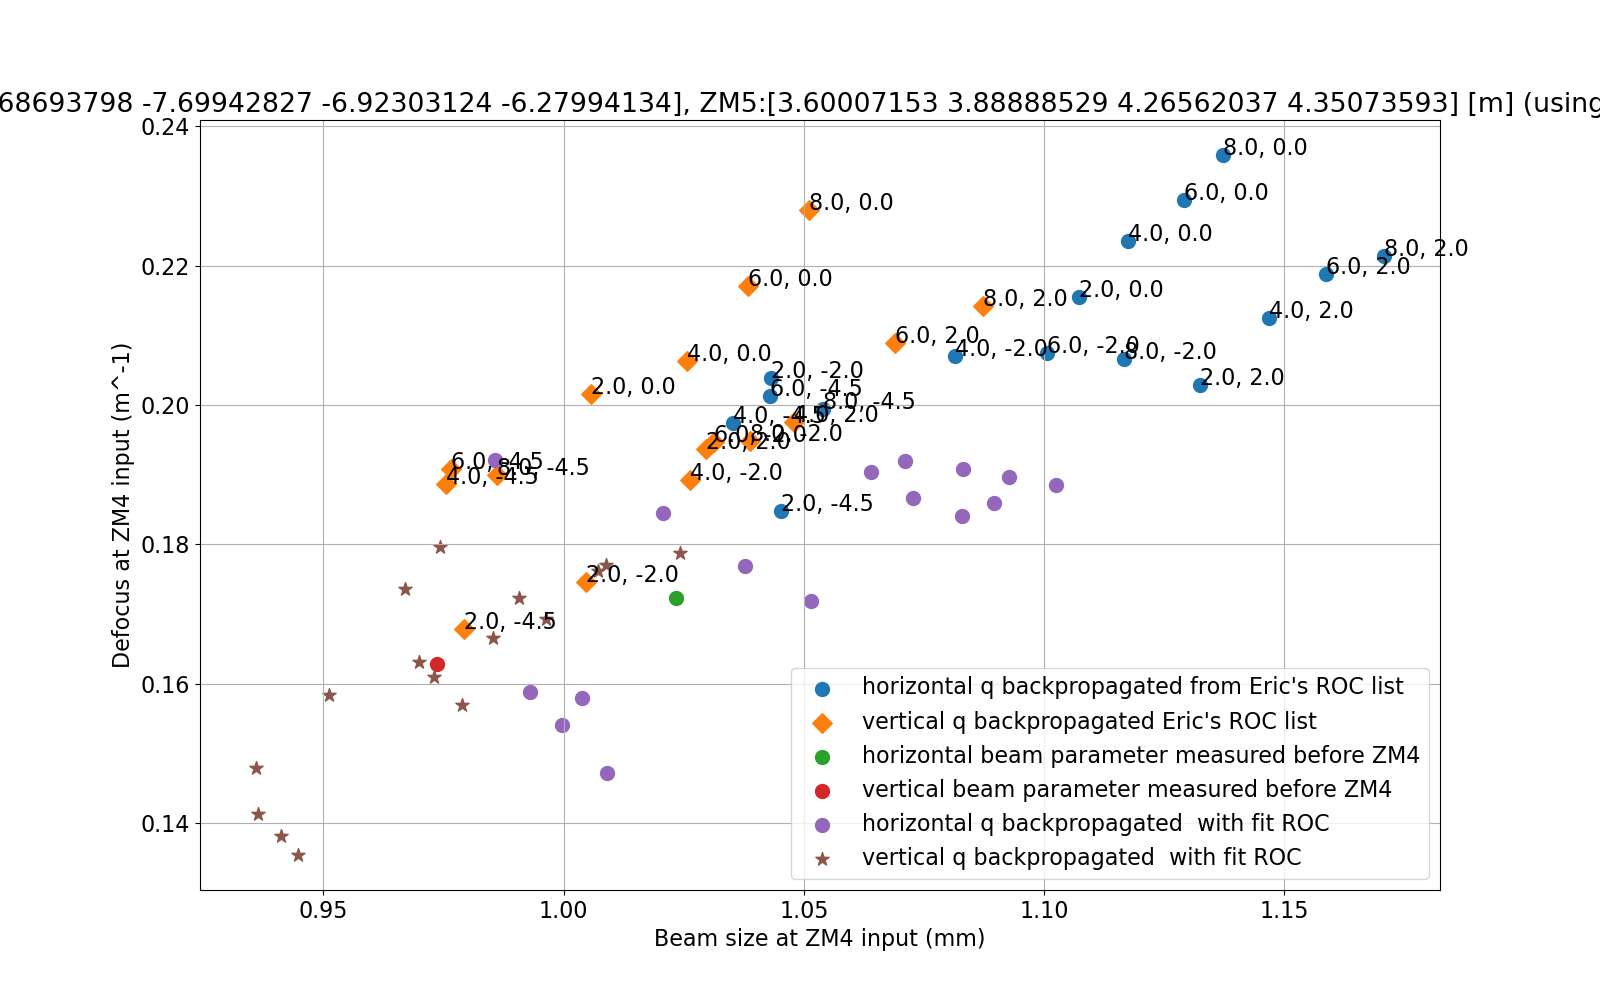
I take the q's measured after ZM5, propagate them back to before zm4 using the guesses for ROCs and the AOIs from the finesse .yml file, and calculates the overlap with the measured q before ZM4 for each.  The sum off the mode mismatches is the cost function used to fit either vertical or horizontal ROCs.  In this version of the script, it is fitting either the vertical or horizontal data, I would like in the future to have it include both in the cost function.

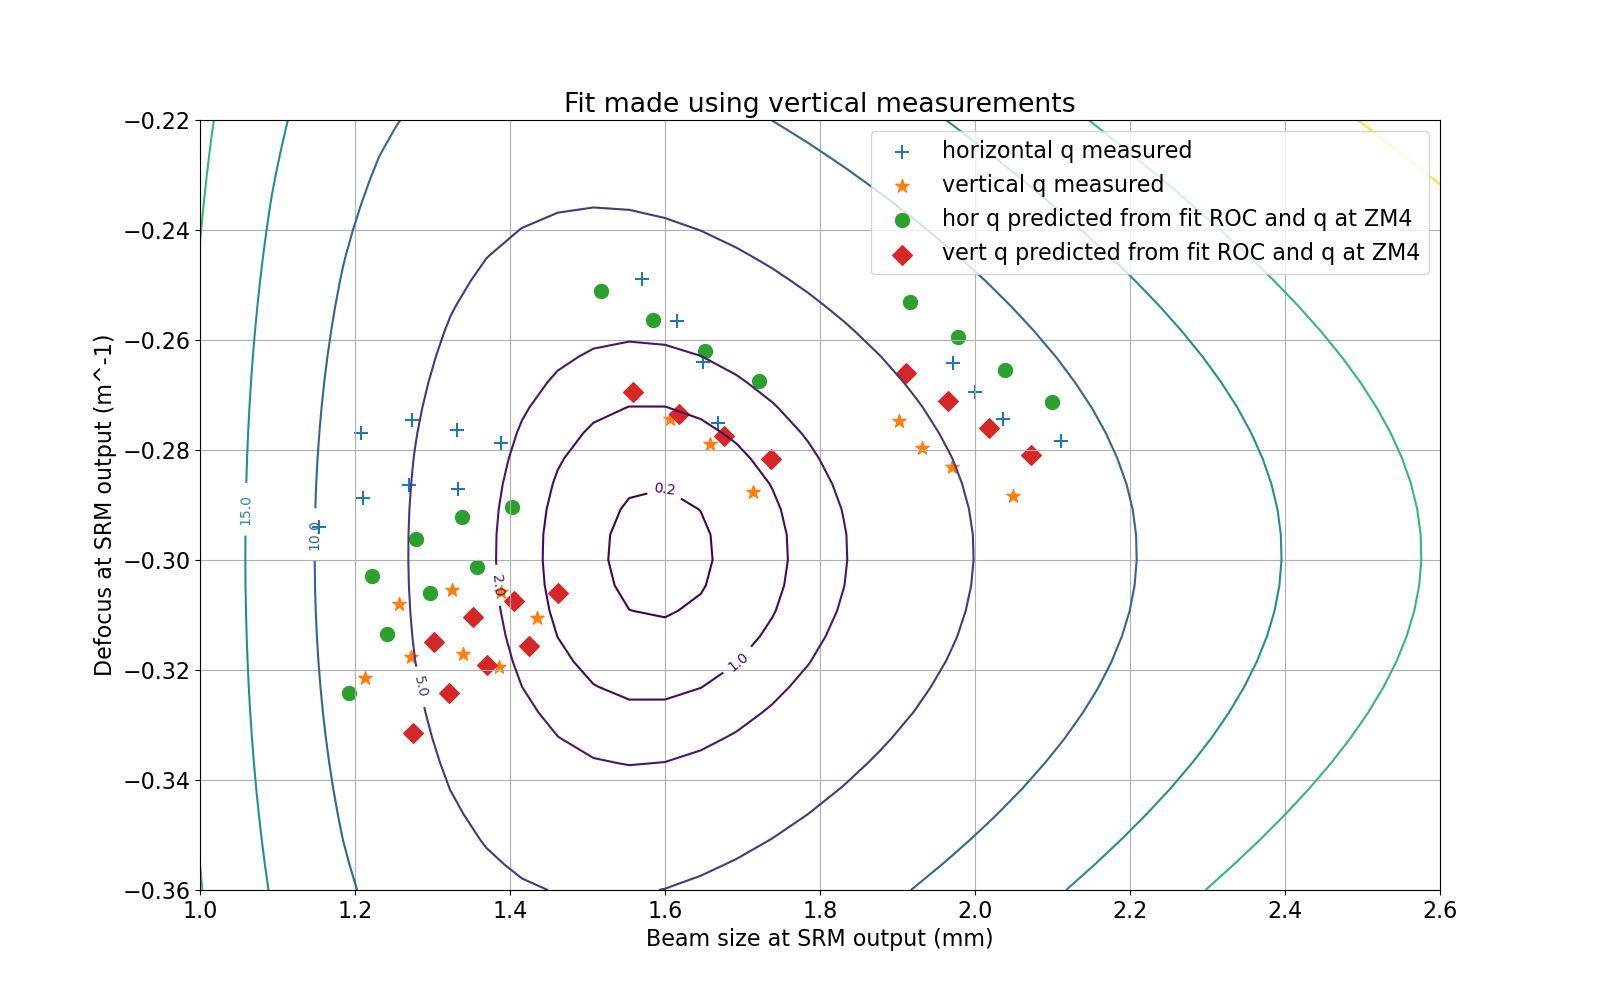
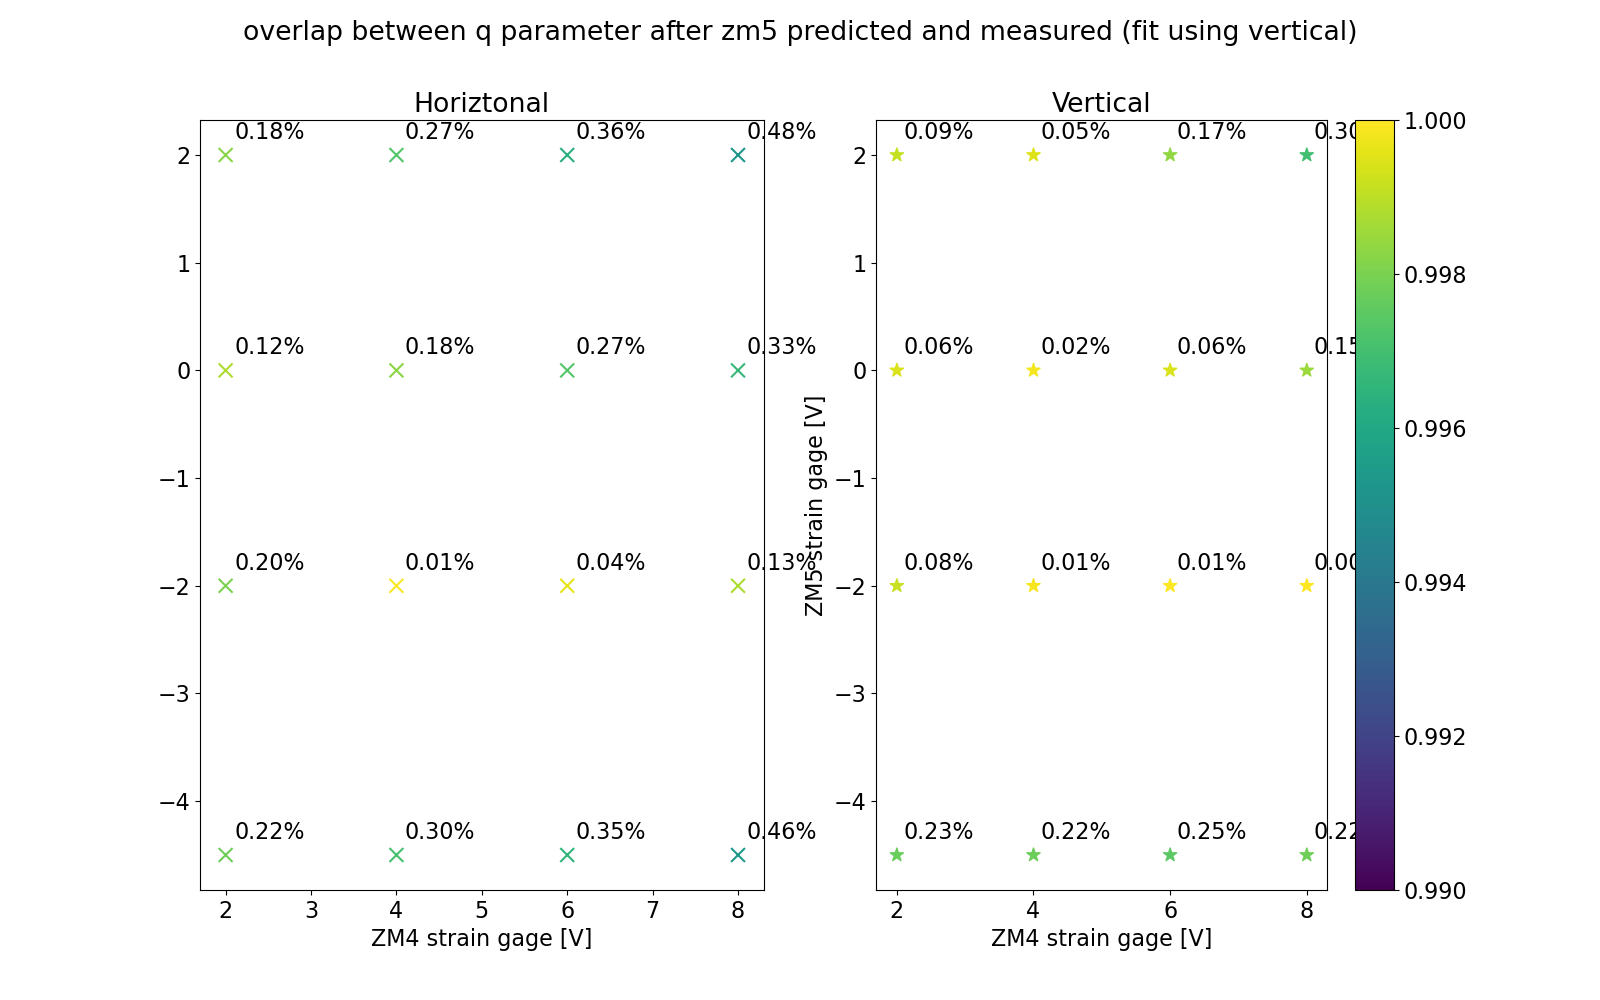
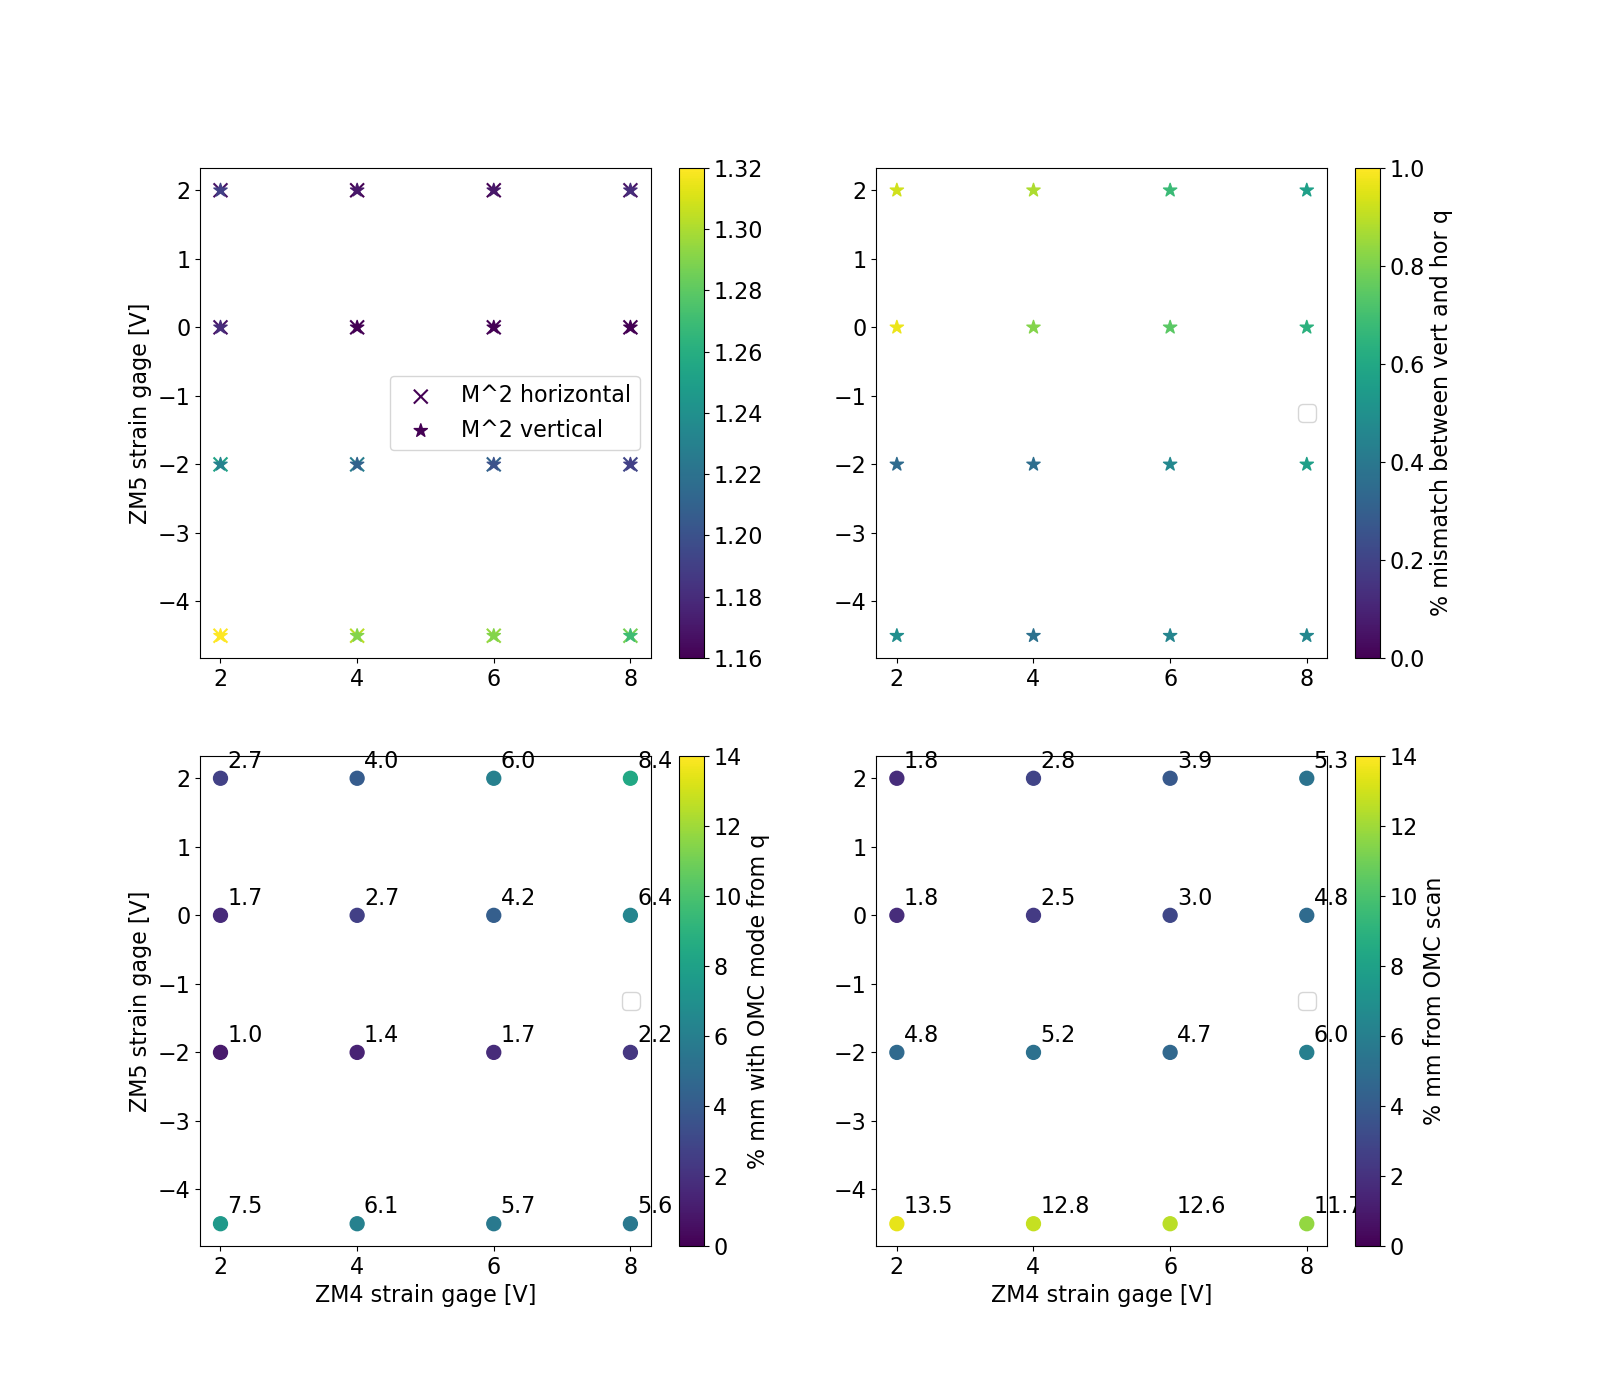
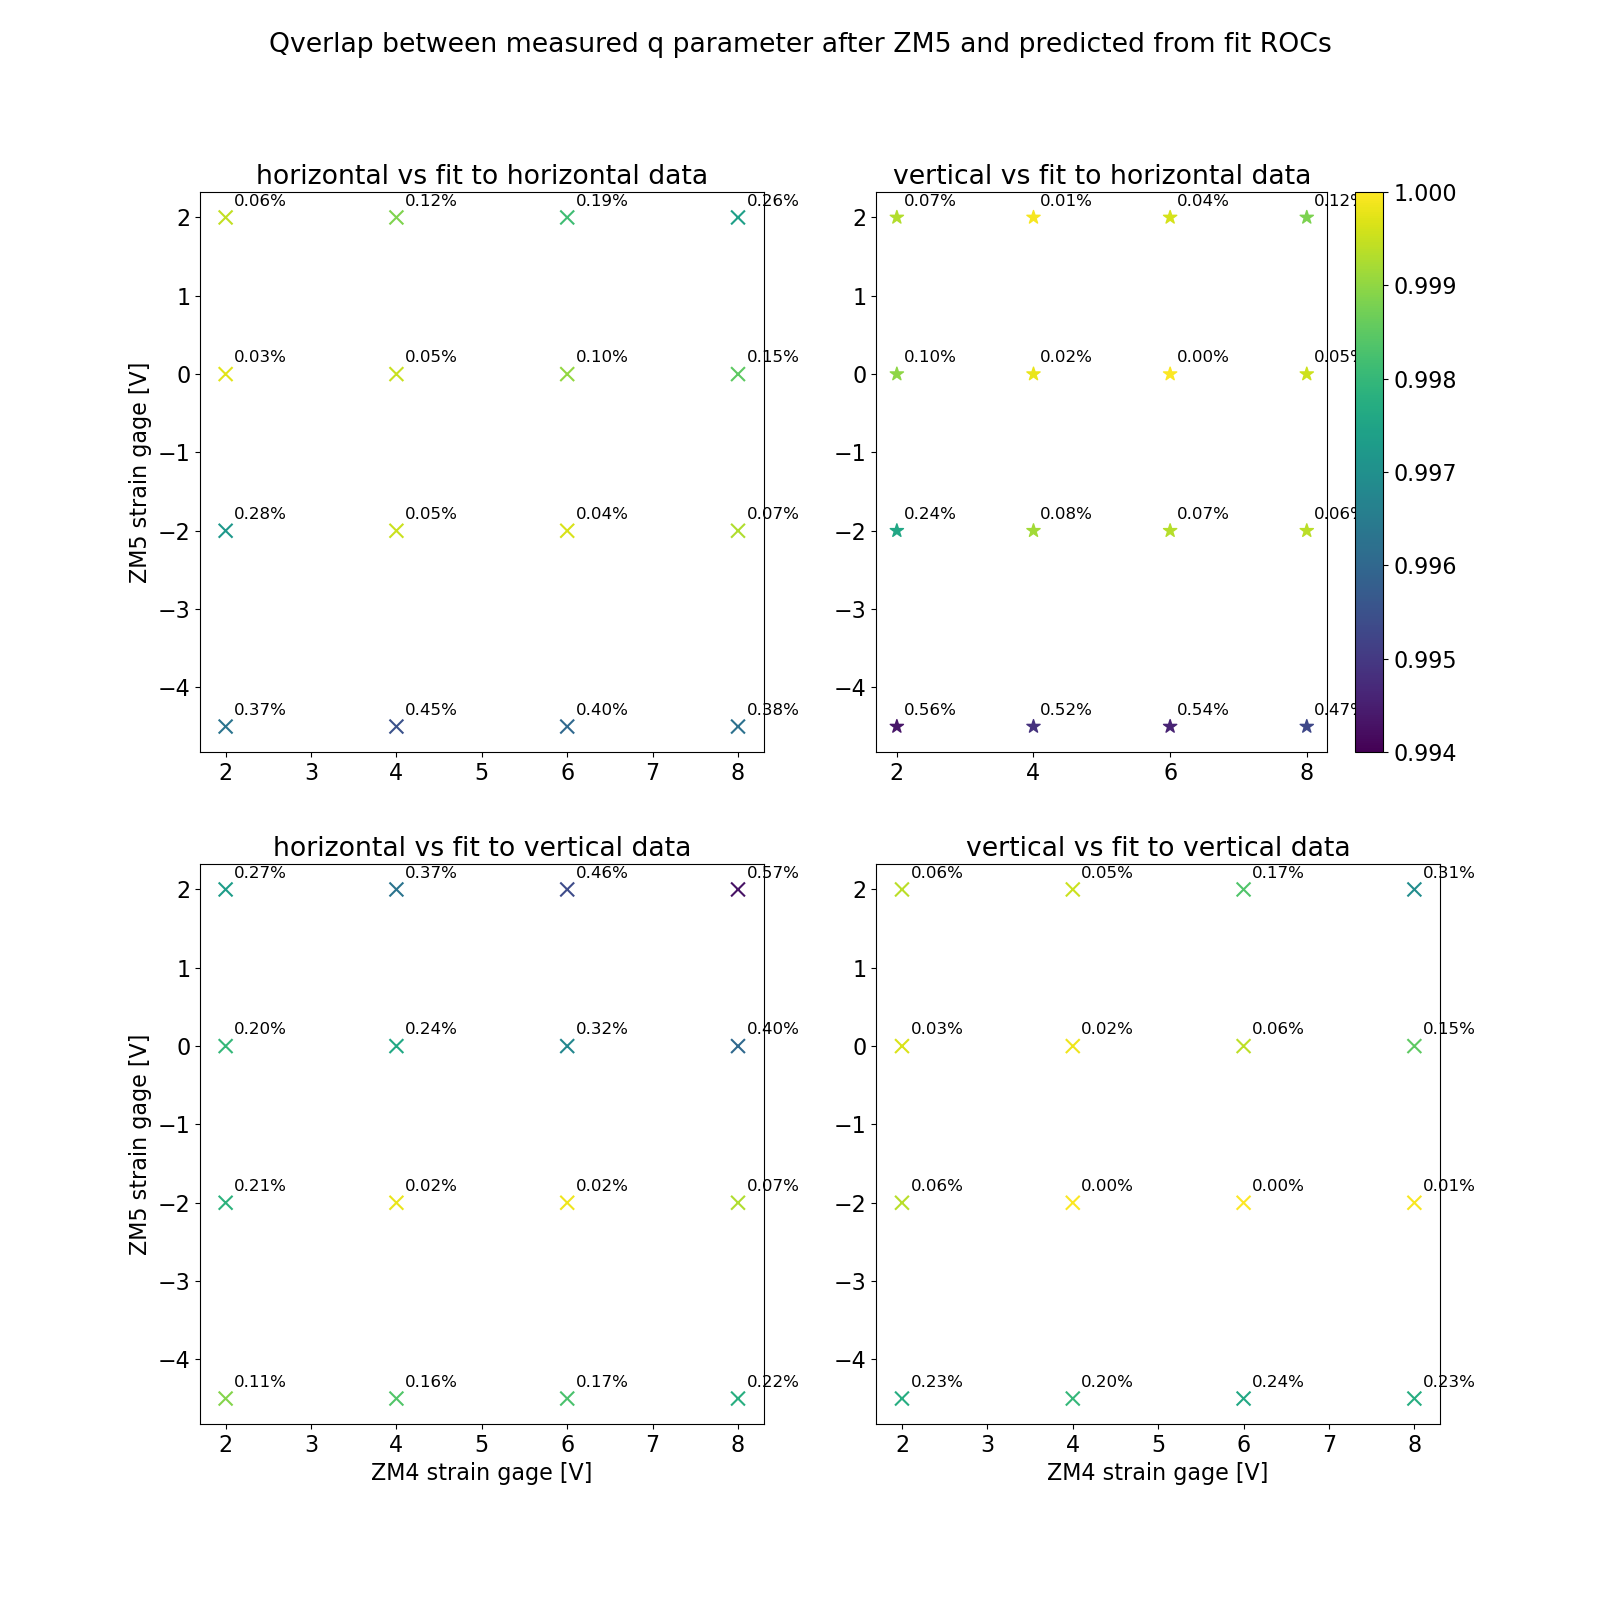
These plots (horizontal and vertical) show that this fitting results in overlap between the measured beam and the forward propagated beam using the fit ROCs is better that 99.5% for all the data.  This is true when I use only the horizontal (vertical) data in the fit, and use those ROCs to propagate the vertical (horiztonal) mode.  The worst overlaps are all for points measured where ZM5 strain guage was at -4.5V, which also had the worst values of M^2 (see top left panel).  

Using these fit ROCs and the measured q before ZM4, we can propagate to the usual Sw plot on the AR side of SRM, using either vertical or horizontal data gives us an sw plot that looks a lot closer to the measured data than the guesses above.  I think this means that we can use this kind of fit data to determine what ROC we need to move us to a particular place in Sw space in the future, at least at the level of 0.5% mode matching. 

ZM4 (strain guage voltage) 2 4 6 8
ROC fit with vertical data[m] -8.687 -7.699 -6.923 -6.280
ROC fit with horiztonal data [m] -7.621 -6.886 -6.313 -5.798
ZM5 (strain guage voltage) -4.5 -2 0 2
ROC fit with vertical data [m] 3.600 3.889 4.266 4.351
ROC fit with horizontal data [m] 3.544 3.852 4.190 4.273

The script to make these fots and plots can be found here


Images attached to this comment
eric.oelker@LIGO.ORG - 10:01, Wednesday 15 July 2026 (91046)

I was curious to see what Sheila's improved fits imply for our hunt for the source of astigmatism in HAM 7.  Below I've tabluated some calculations for the astigmatism, which I define as the difference in focusing power between the horizontal (X) and vertical (Y) directions for ZM4/5


For ZM4

ZM4 SG 2 4 6 8
Rx (m) -7.621 -6.886 -6.313 -5.798
Ry (m) -8.687 -7.699 -6.923 -6.280
Dx - Dy (mD) -32.2 -30.7 -27.9 -26.5
Dx/CosT - Dy*CosT (mD) -50.5 -51.1 -50.4 -51.1

Here T is the angle of incidence (15.5 degrees for ZM4).  The total astigmatism (line 5 in the table) includes both the physical astigmatism (line 4 in the table) due to non-uniformity in the ROC of the PSAM optic as well as the astigmatism resulting from non-normal incidence.  By comparing lines 4 and 5, we see that, for ZM4, the impact of the relatively large angle of incidence is also a significant source of astigmatism.  


For ZM5

ZM5 SG -4.5 -2 0 2
Rx (m) 3.544 3.852 4.190 4.273
Ry (m) 3.600 3.889 4.266 4.315
Dx - Dy (mD) 8.8 4.9 8.5 8.4
Dx/CosT - Dy*CosT (mD) 13.0 8.9 12.1 11.9

Here T is the angle of incidence (5 degrees for ZM5)


The physical astigmatism (Dx - Dy) of the PSAM optics appear to be typical of the characterization data at Caltech in 2021.  

See this presentation from Lee McCuller:  https://docs.google.com/presentation/d/12UynUfIfyXmggvRKFq-OTcJKO3U0TrhD8XnKnrJE1CA/edit?usp=sharing

And his corresponding calcuations from the raw data:  https://git.ligo.org/wieldphysics/wield-ligo-mcculler/-/tree/main/src/wield/LIGO/mcculler/mirror_maps?ref_type=heads


Implications for X/Y overlap in HAM 7:

Note:  I do my best here to calculate the expected impact of the various ZM mirrors on our X/Y mismatch. I'm fairly new to analyzing AWC optics, so take these calculations with a grain of salt.  


From this we can calculate the astigmatism-induced mode mismatch between the x and y directions due to reflection off of ZM4 and ZM5.  This can be done using Equation 23 in the following technical document:  https://dcc.ligo.org/LIGO-T1900144

I believe that one wants to take the square root of eqn 23, since we are interested in calculating a 1D overlap integral between X and Y of a single beam rather than a 2D overlap between two separate beams.


We use the following paramters in Eqn 23:

 w = beam spot size on ZM4 or ZM5 (roughly 1 mm and 2 mm respectively)

D = difference in defocus between X and Y for either ZM4 or ZM5 (Just the last line of the two tables above)


I find roughly that |k00|2 = 0.997  for both ZM4 and ZM5.  The impact is small and, because the astigmatism appears to have the opposite sign for each optic, the effect of ZM4 and ZM5 will probably cancel one another to some degree (this should be straightforward to calculate, I just haven't done it here). This suggests that the impact on our X/Y overlap due to the astigmatism on ZM4 and ZM5 is likely not a significant limit to our squeezing level at present.  I'll take a look at the raw q values later to see if they tell a consistant story, will hopefully confirm that these back-of the envelope calcs using this T-doc are reliable.  
 

However, our measurements on SQZT7 suggest that we do have noticible astigmatism.  ZM2 seems like a more likely culprit due to the larger beam spot size on that optic (w = 2.5 mm).  


Rough estimate of the impact of ZM2:

Based on Lee's analysis of the Zygo data for the ZM2, ZM4, and ZM5 PSAMS, it appears that 10-20 mD of astigmatism is typical near the center of a PSAM optic.

For 10-20 mD of astigmatism from ZM2 with w =2.5 mm, the mode overlap between X and Y would lie between:

|k00|4 = 0.9916 to 0.9671  

I dont think that this naive calculation where I square the result for a double-passed optic is correct in general for a retroreflected path, but my intuition is that this should be roughly right in our case because ZM2 actuates mostly on the beam defocus at FC1.  I'm not that confident in my intuition, so I plan to confirm this with some finesse modeling.  

This might account for the astigmatism measured on SQZT7.  Further measurements before/after ZM2 would allow us to confirm this theory.  


sheila.dwyer@LIGO.ORG - 14:32, Wednesday 29 July 2026 (91307)

Camilla and Eric realized that the AOIs listed in the ligo-commissoning-modeling repo for the ZM2 were a factor of 2 too large, ie they were the angles between entering and exiting beams.  I've corrected this in the repo, and re-ran the fitting to the ROCs, (and cleaned up the code and plots a little). 

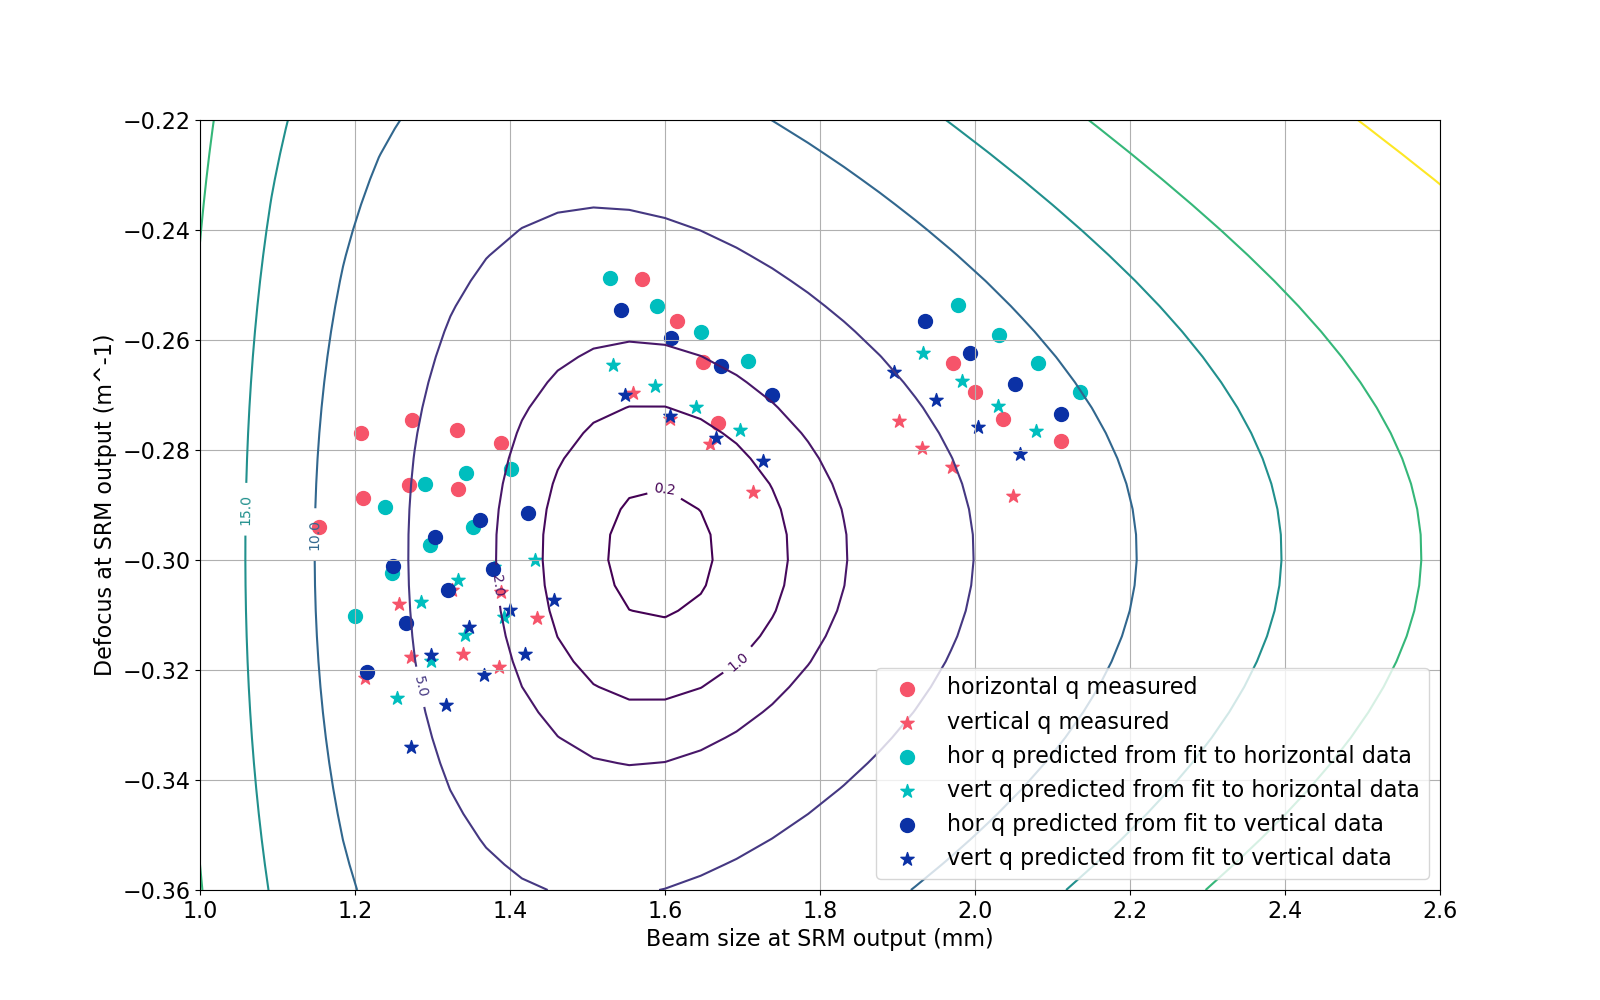
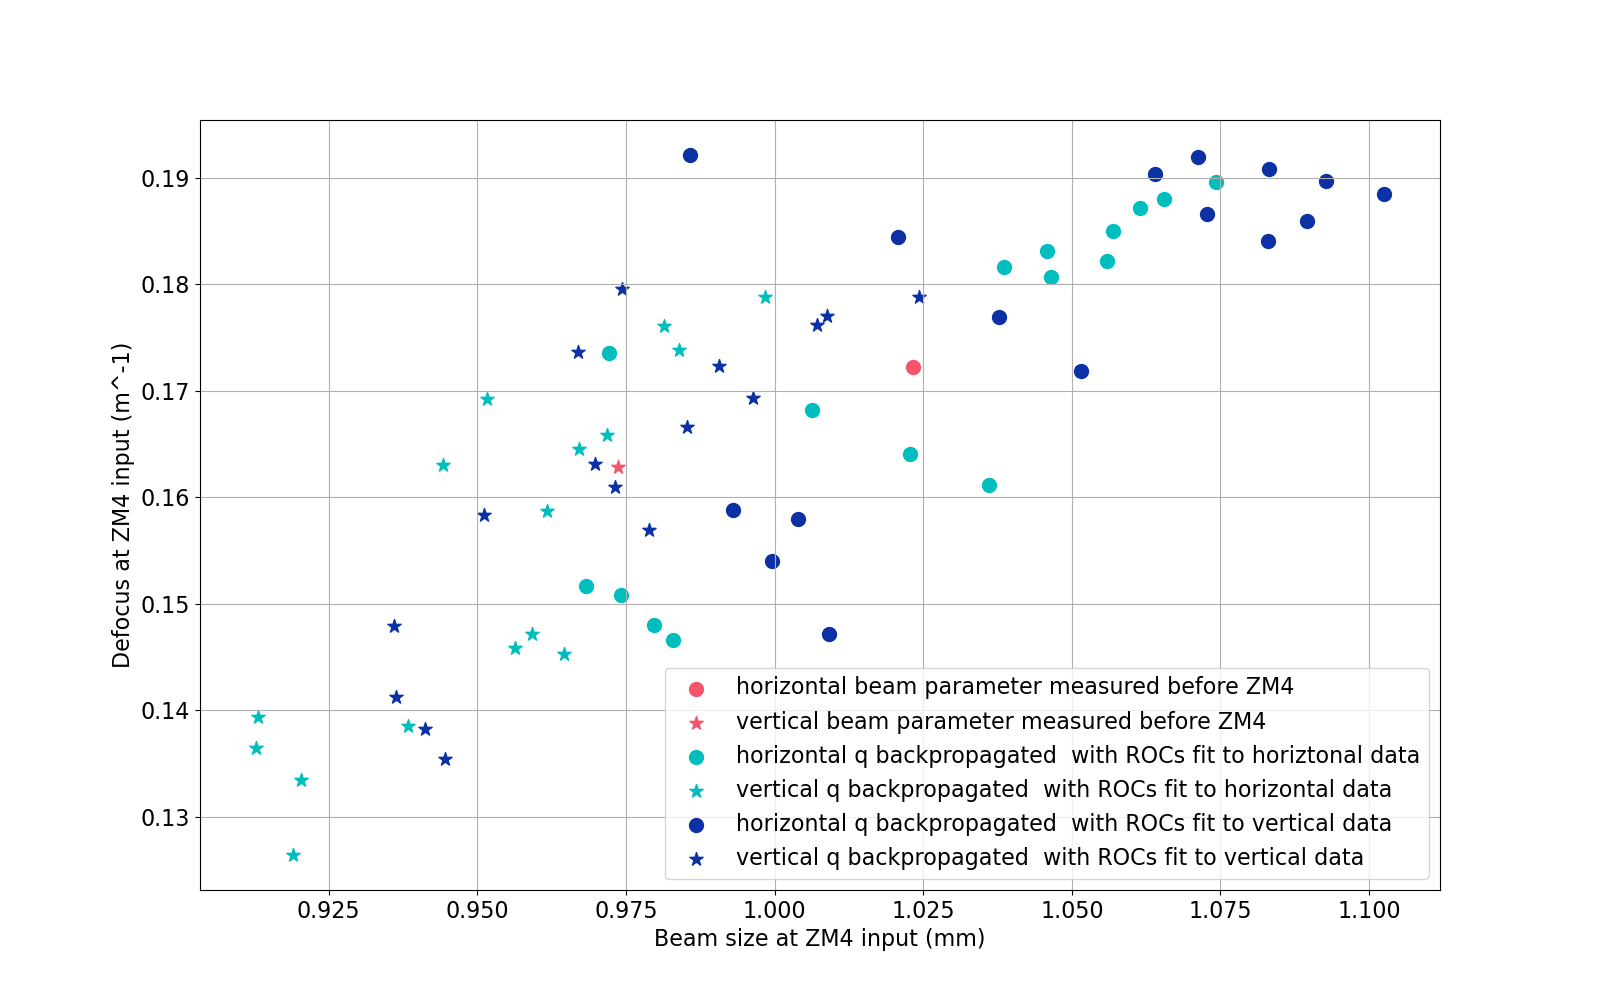
In the plots, all the stars are for vertical qs, all the circles are for horizontal qs.  The first plot shows the measured q before ZM4 compared to the qs measured after ZM5 propagated back to before ZM4.  If the measurements and fitting were perfect these would all line up at the horiozontal and vertical measured qs.  

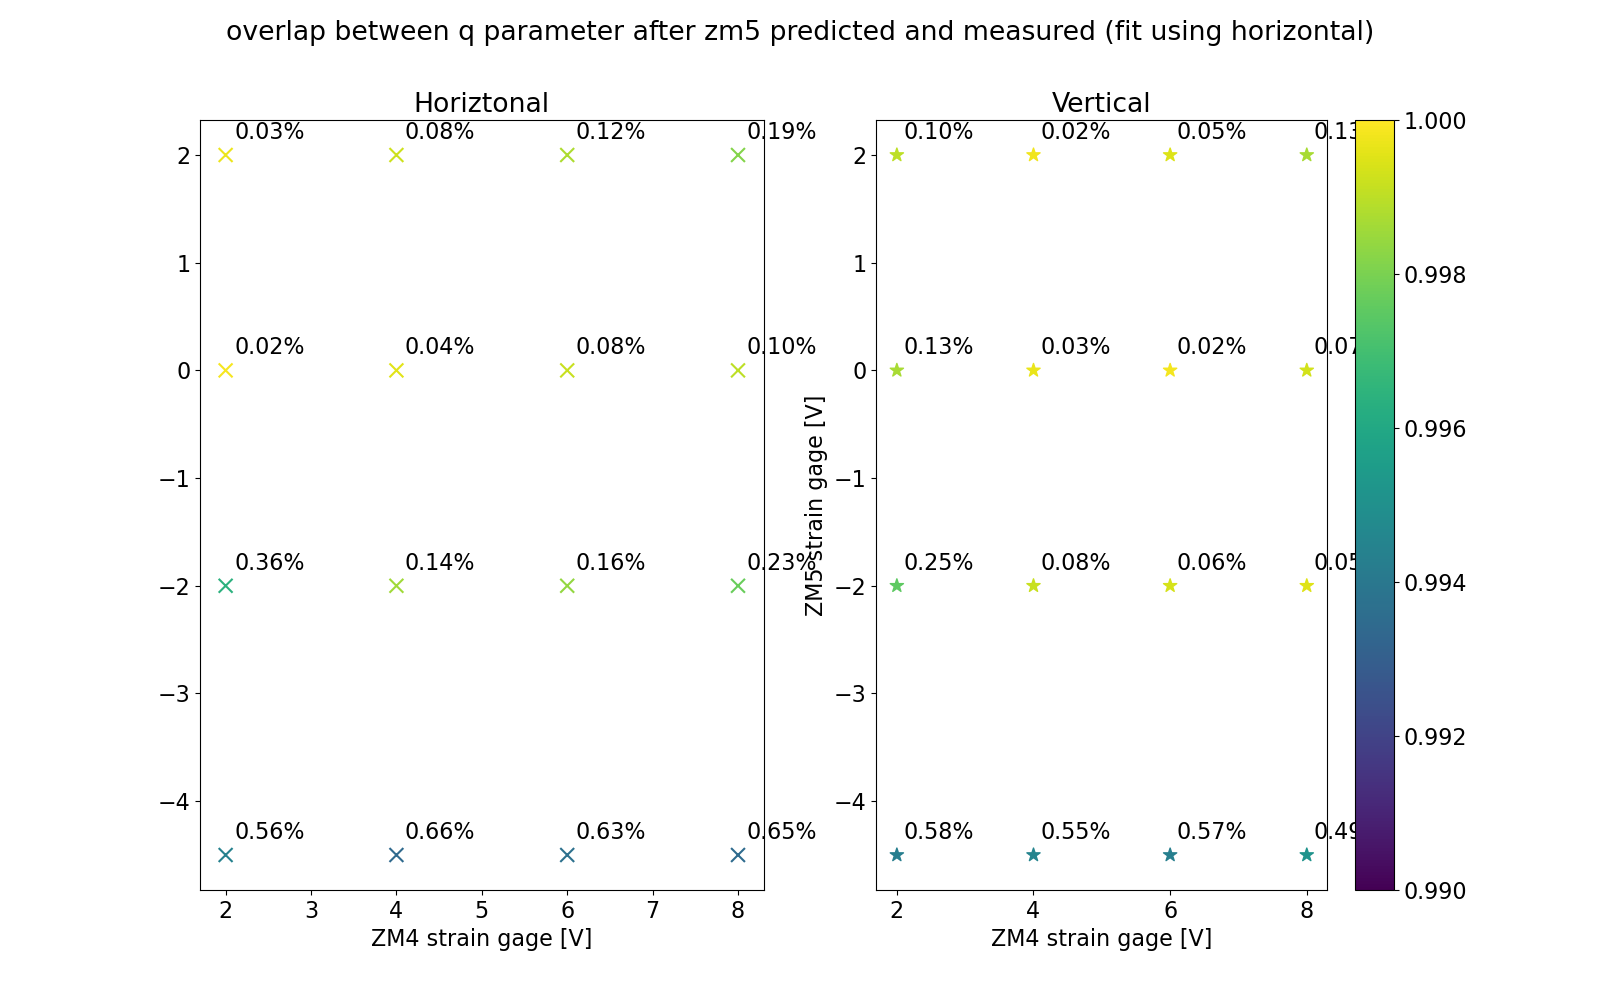
The next plot shows the qs measured after ZM5, but propagated to SRM, the salmon points are the measured qs.  The dark blue symbols are predictions based on the ROCs that I fit using only vertical q measurements and the measured vertical q before ZM4, the teal symbols are based on fits made using only horizontal qs.  You can see that in the middle of the ZM5 range, the fits do a pretty good job of predicting the measured qs, but at the edges of the range the predictions are not as good.  If you look at the vertical fits, they don't do much of a worse job predicting the horiztonal data than the vertical data, so I think this means that whatever is preventing good fitting there is a larger impact than the astigmatism.  The third plots shows similar information, as a grid of overlaps between the predicted and measured qs: the horizontal fits don't do much worse at explaining the vertical data than the horizontal, and vice versa.  So, I don't have a lot of confidence in this technique as a way of measuring astigmatism,as the fitting is limited by something else. It does re-affirm that our measurement technique should be good enough to get lower than 1% mode mismatch. 

Recreating Eric's tables from above, with the corrected AOIs.  For ZM4, the astigmatism expected based on AOI alone is about 5mD.

ZM4 strain guage (V) 2 4 6 8
ZM4 ROC horizontal fit [m] -7.84 -7.08 -6.49 -5.96
ZM4 ROC vertical fit [m] -8.93 -7.92 -7.12 -6.46
physical astigmatism (Dh-Dv) [mD] -31 -30 -27 -26
total astigmatism Dh/cos(AOI) - Dv*cos(AOI) -36 -35 -33 -32

For ZM5, the astigmatism expected from the AOI alone is about 10mD, we do not seem to need much astigmatism from the optic quality to explain the data.  

ZM5 strain guage (V) -4.5 -2 0 2
ZM5 ROC horizontal fit [m] 3.55 3.86 4.2 4.28
ZM5 ROC vertical fit [m] 3.61 3.90 4.28 4.36
physical astigmatism (Dh-Dv) [mD] 9 5 8 8
total astigmatism Dh/cos(AOI) - Dv*cos(AOI) 10 6 9 9

Utilmately these number's aren't very different from what they are in Eric's tables above after the AOI fix, the main difference is the total astigmatism from ZM5 which was inflated above because of the too large AOI. 

Images attached to this comment
H1 TCS
camilla.compton@LIGO.ORG - posted 10:31, Monday 01 June 2026 - last comment - 00:48, Thursday 02 July 2026(90411)
Started to assemble D1700340-type02 for CHETA VPs

Gerardo, Jordan, Camilla. 

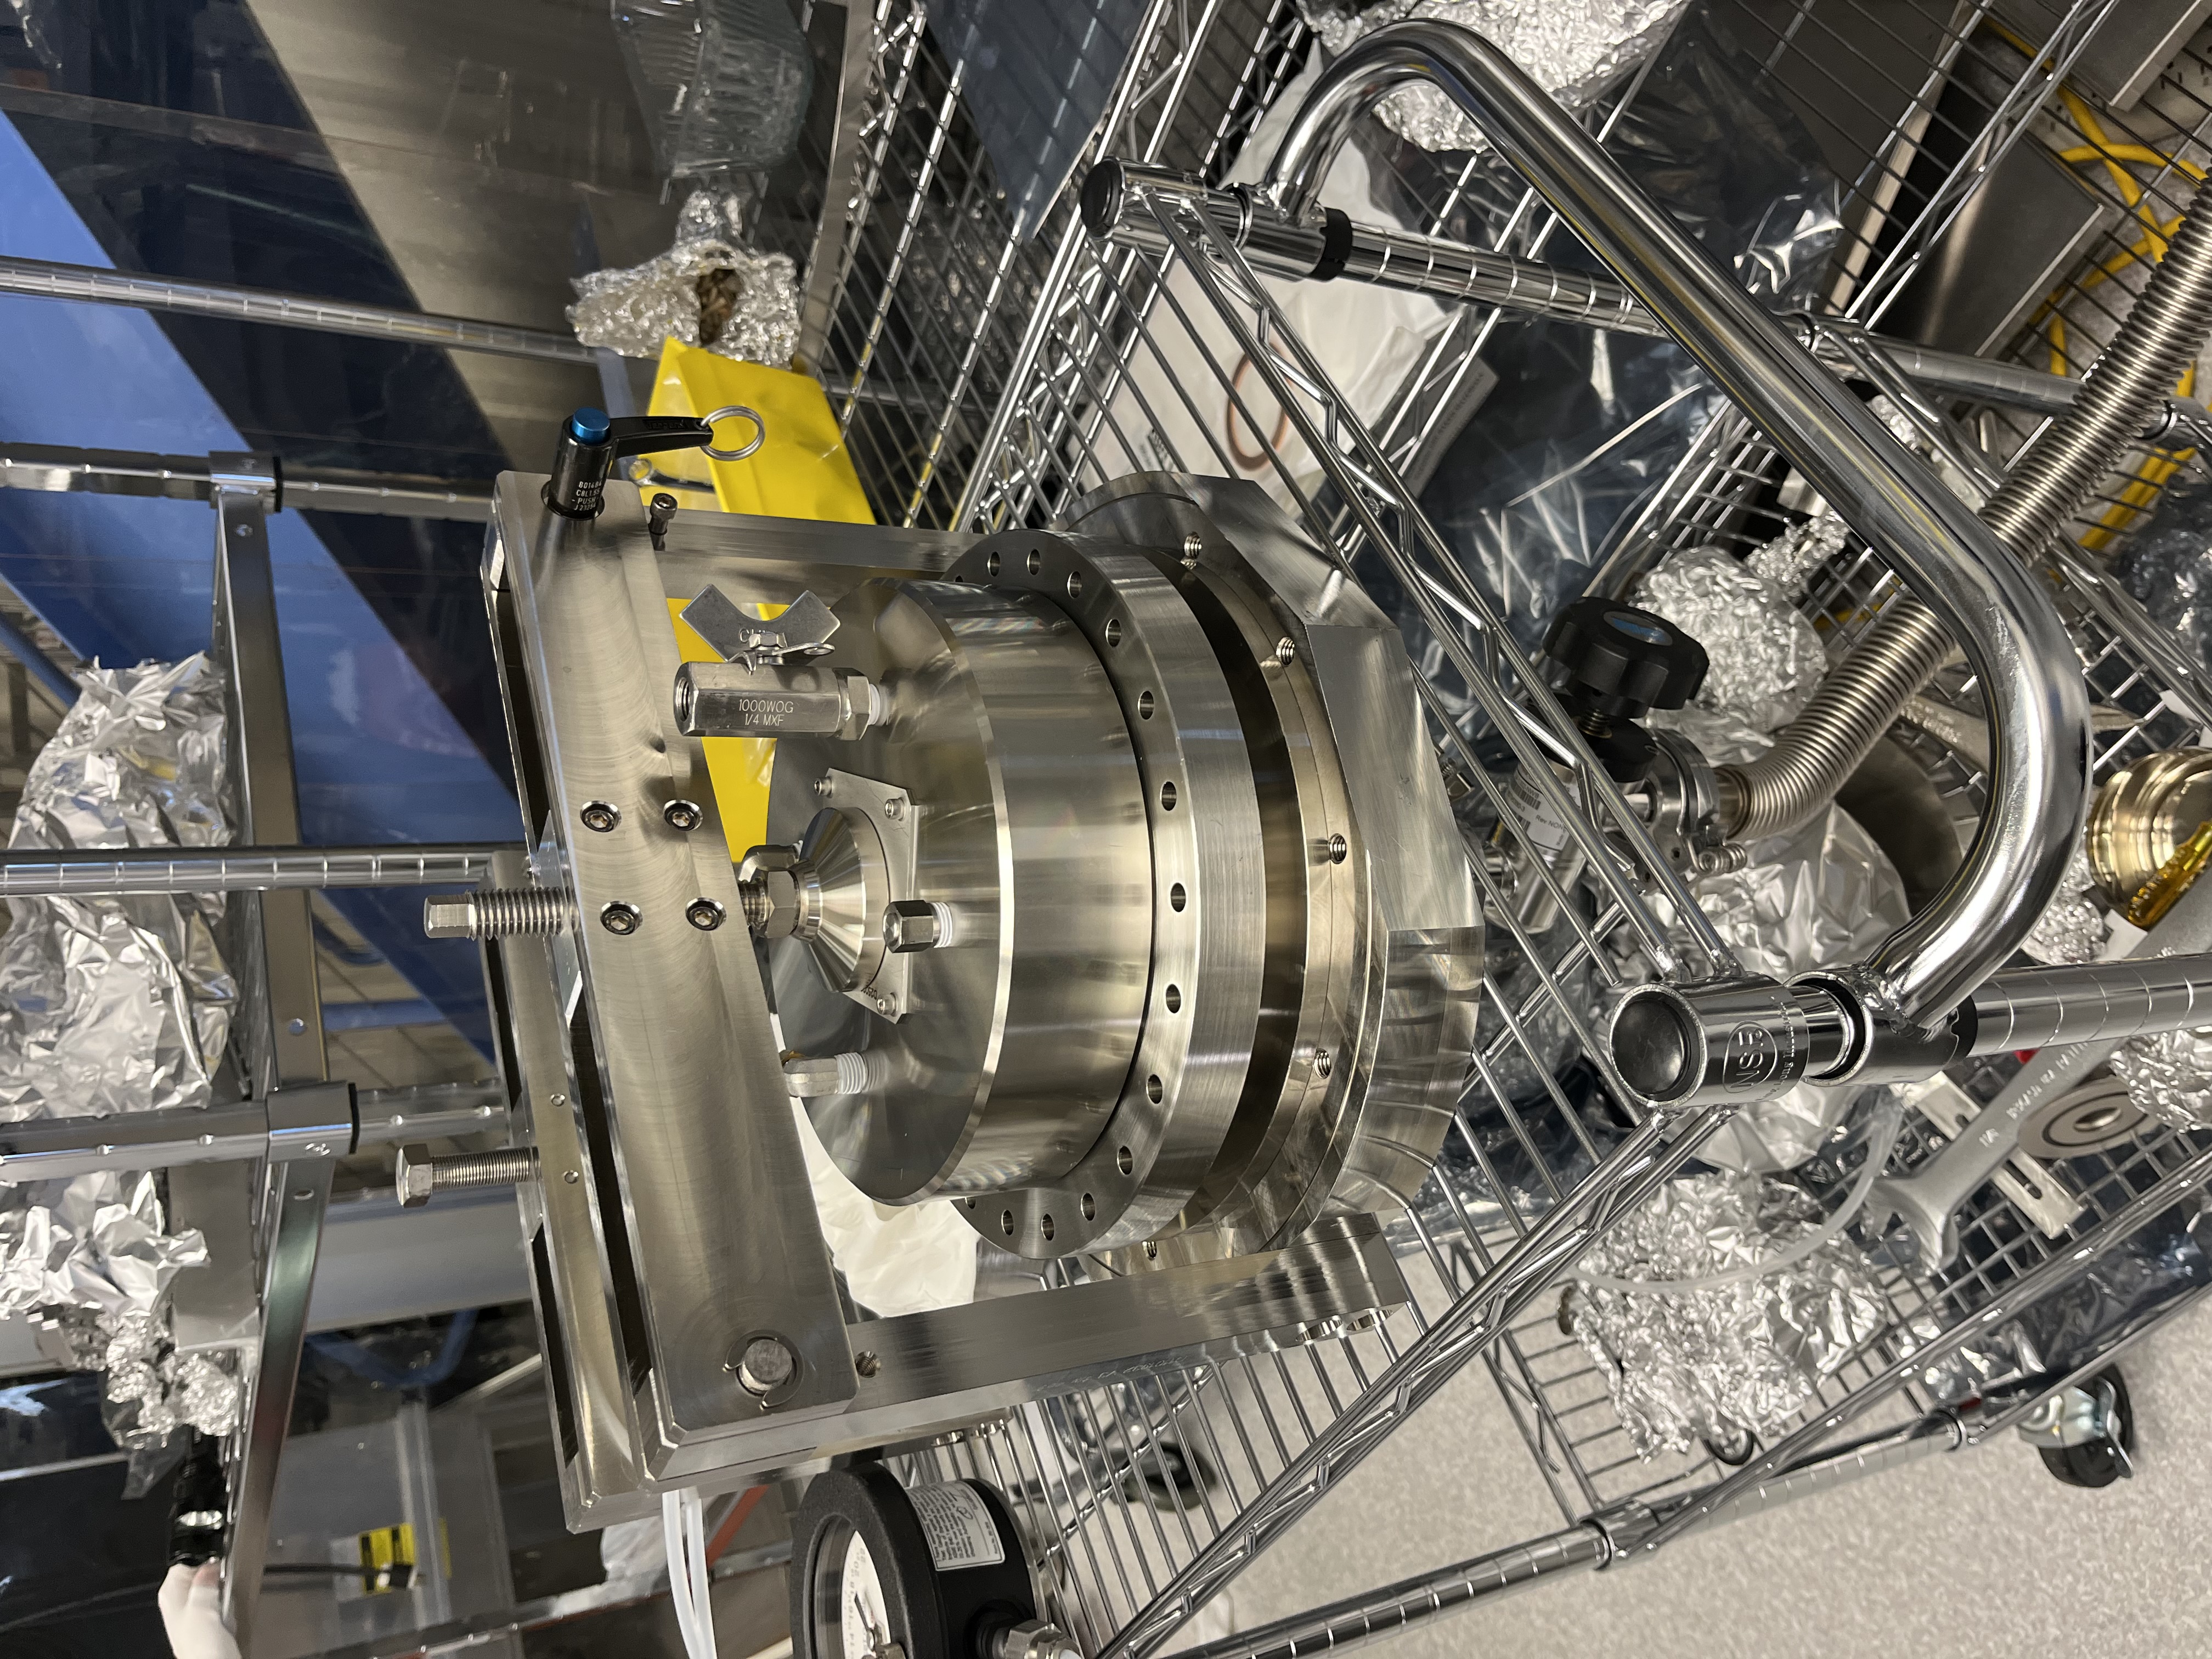
On Thursday we assembled VAC sealing part of the CHETA VPs, D1700340-type02. The thinnest part of the optics are at 12o'clock if the VP is oriented with the P/N of D1700338 writing also ~12o'clock. 

D1700338-v2-001 with D1700339-v2-001 and D1700338-v2-003 with D1700339-v2-003. Both have optics D1100439-type02, which are DAR coated for 1064nm and 10.6um. 

Next steps is VAC testing, then first contact the window surfaces and add secondary window.


Images attached to this report
Comments related to this report
gerardo.moreno@LIGO.ORG - 00:48, Thursday 02 July 2026 (90867)VE

(Jordan, Jake, Owen, Gerardo)

Today we pressure and leak tested the viewports for CHETA.  Both of the assemblies passed their tests, no issues to report.
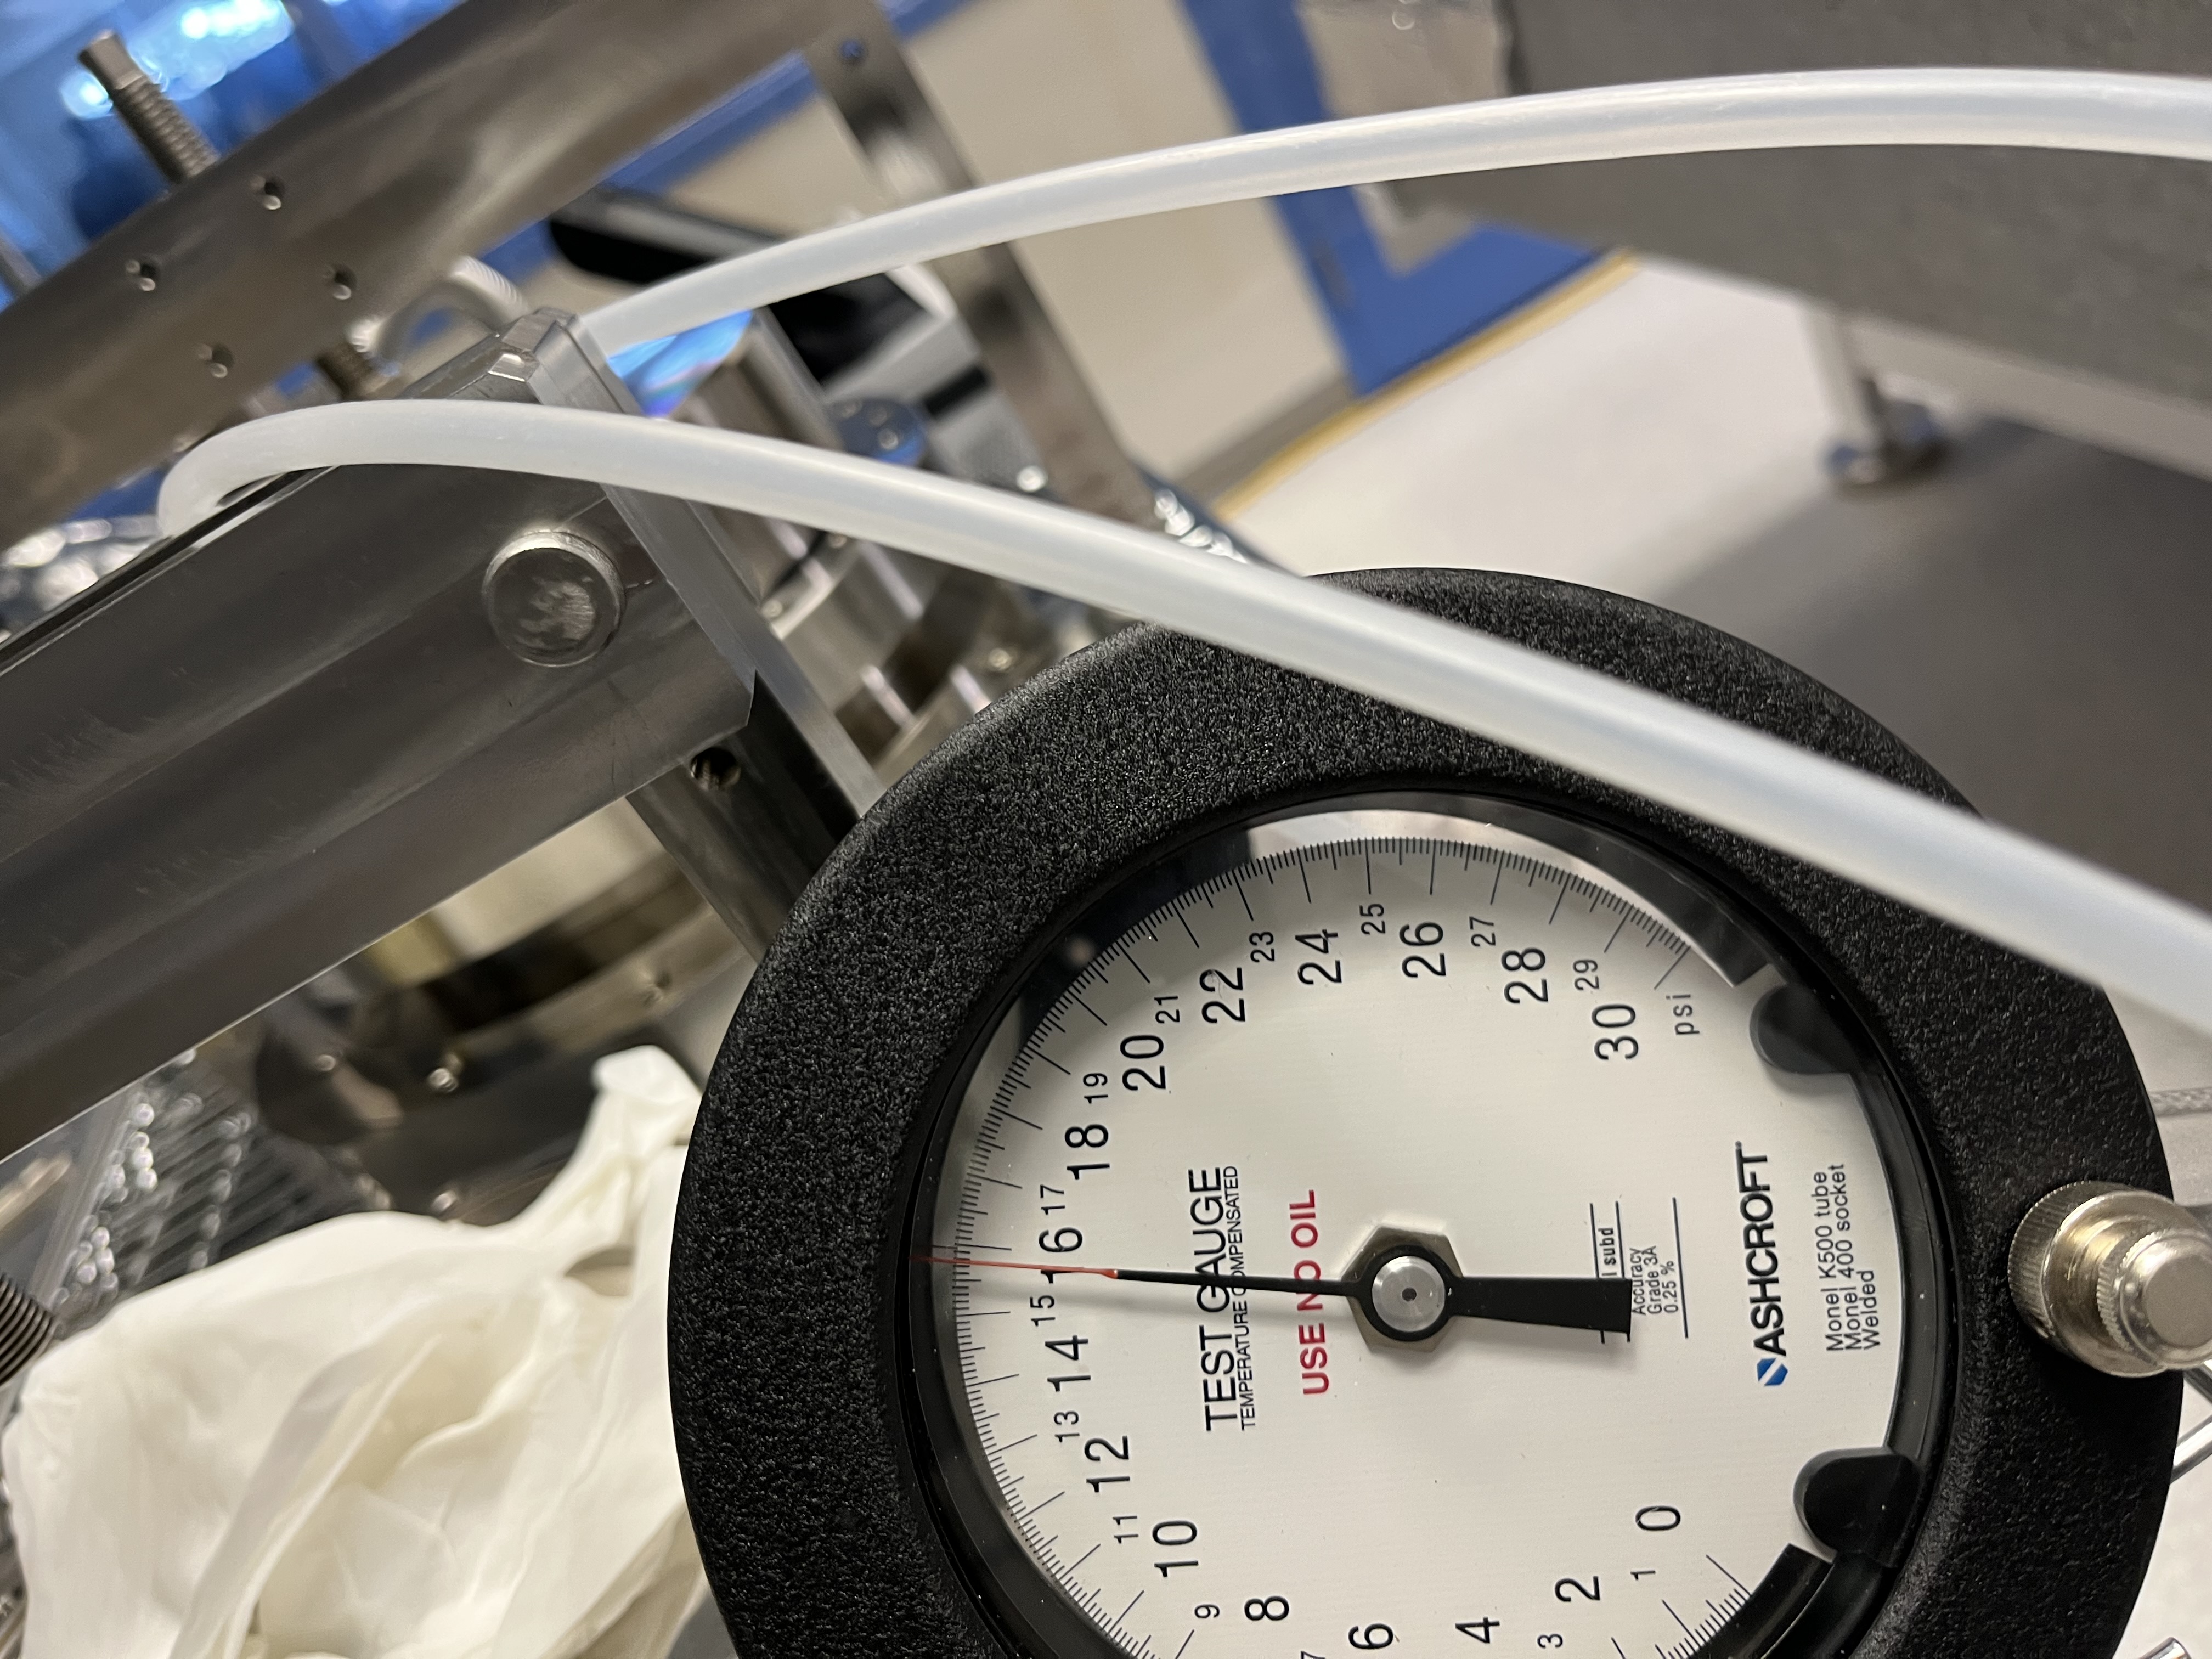
Both viewport assemblies were pressure tested by applying vacuum pressure on the vacuum side of the assembly <1X10-03 Torr with a leak detector, and positive pressure on the air side, 15.5 psig using nitrogen gas.  The new test cap worked great.
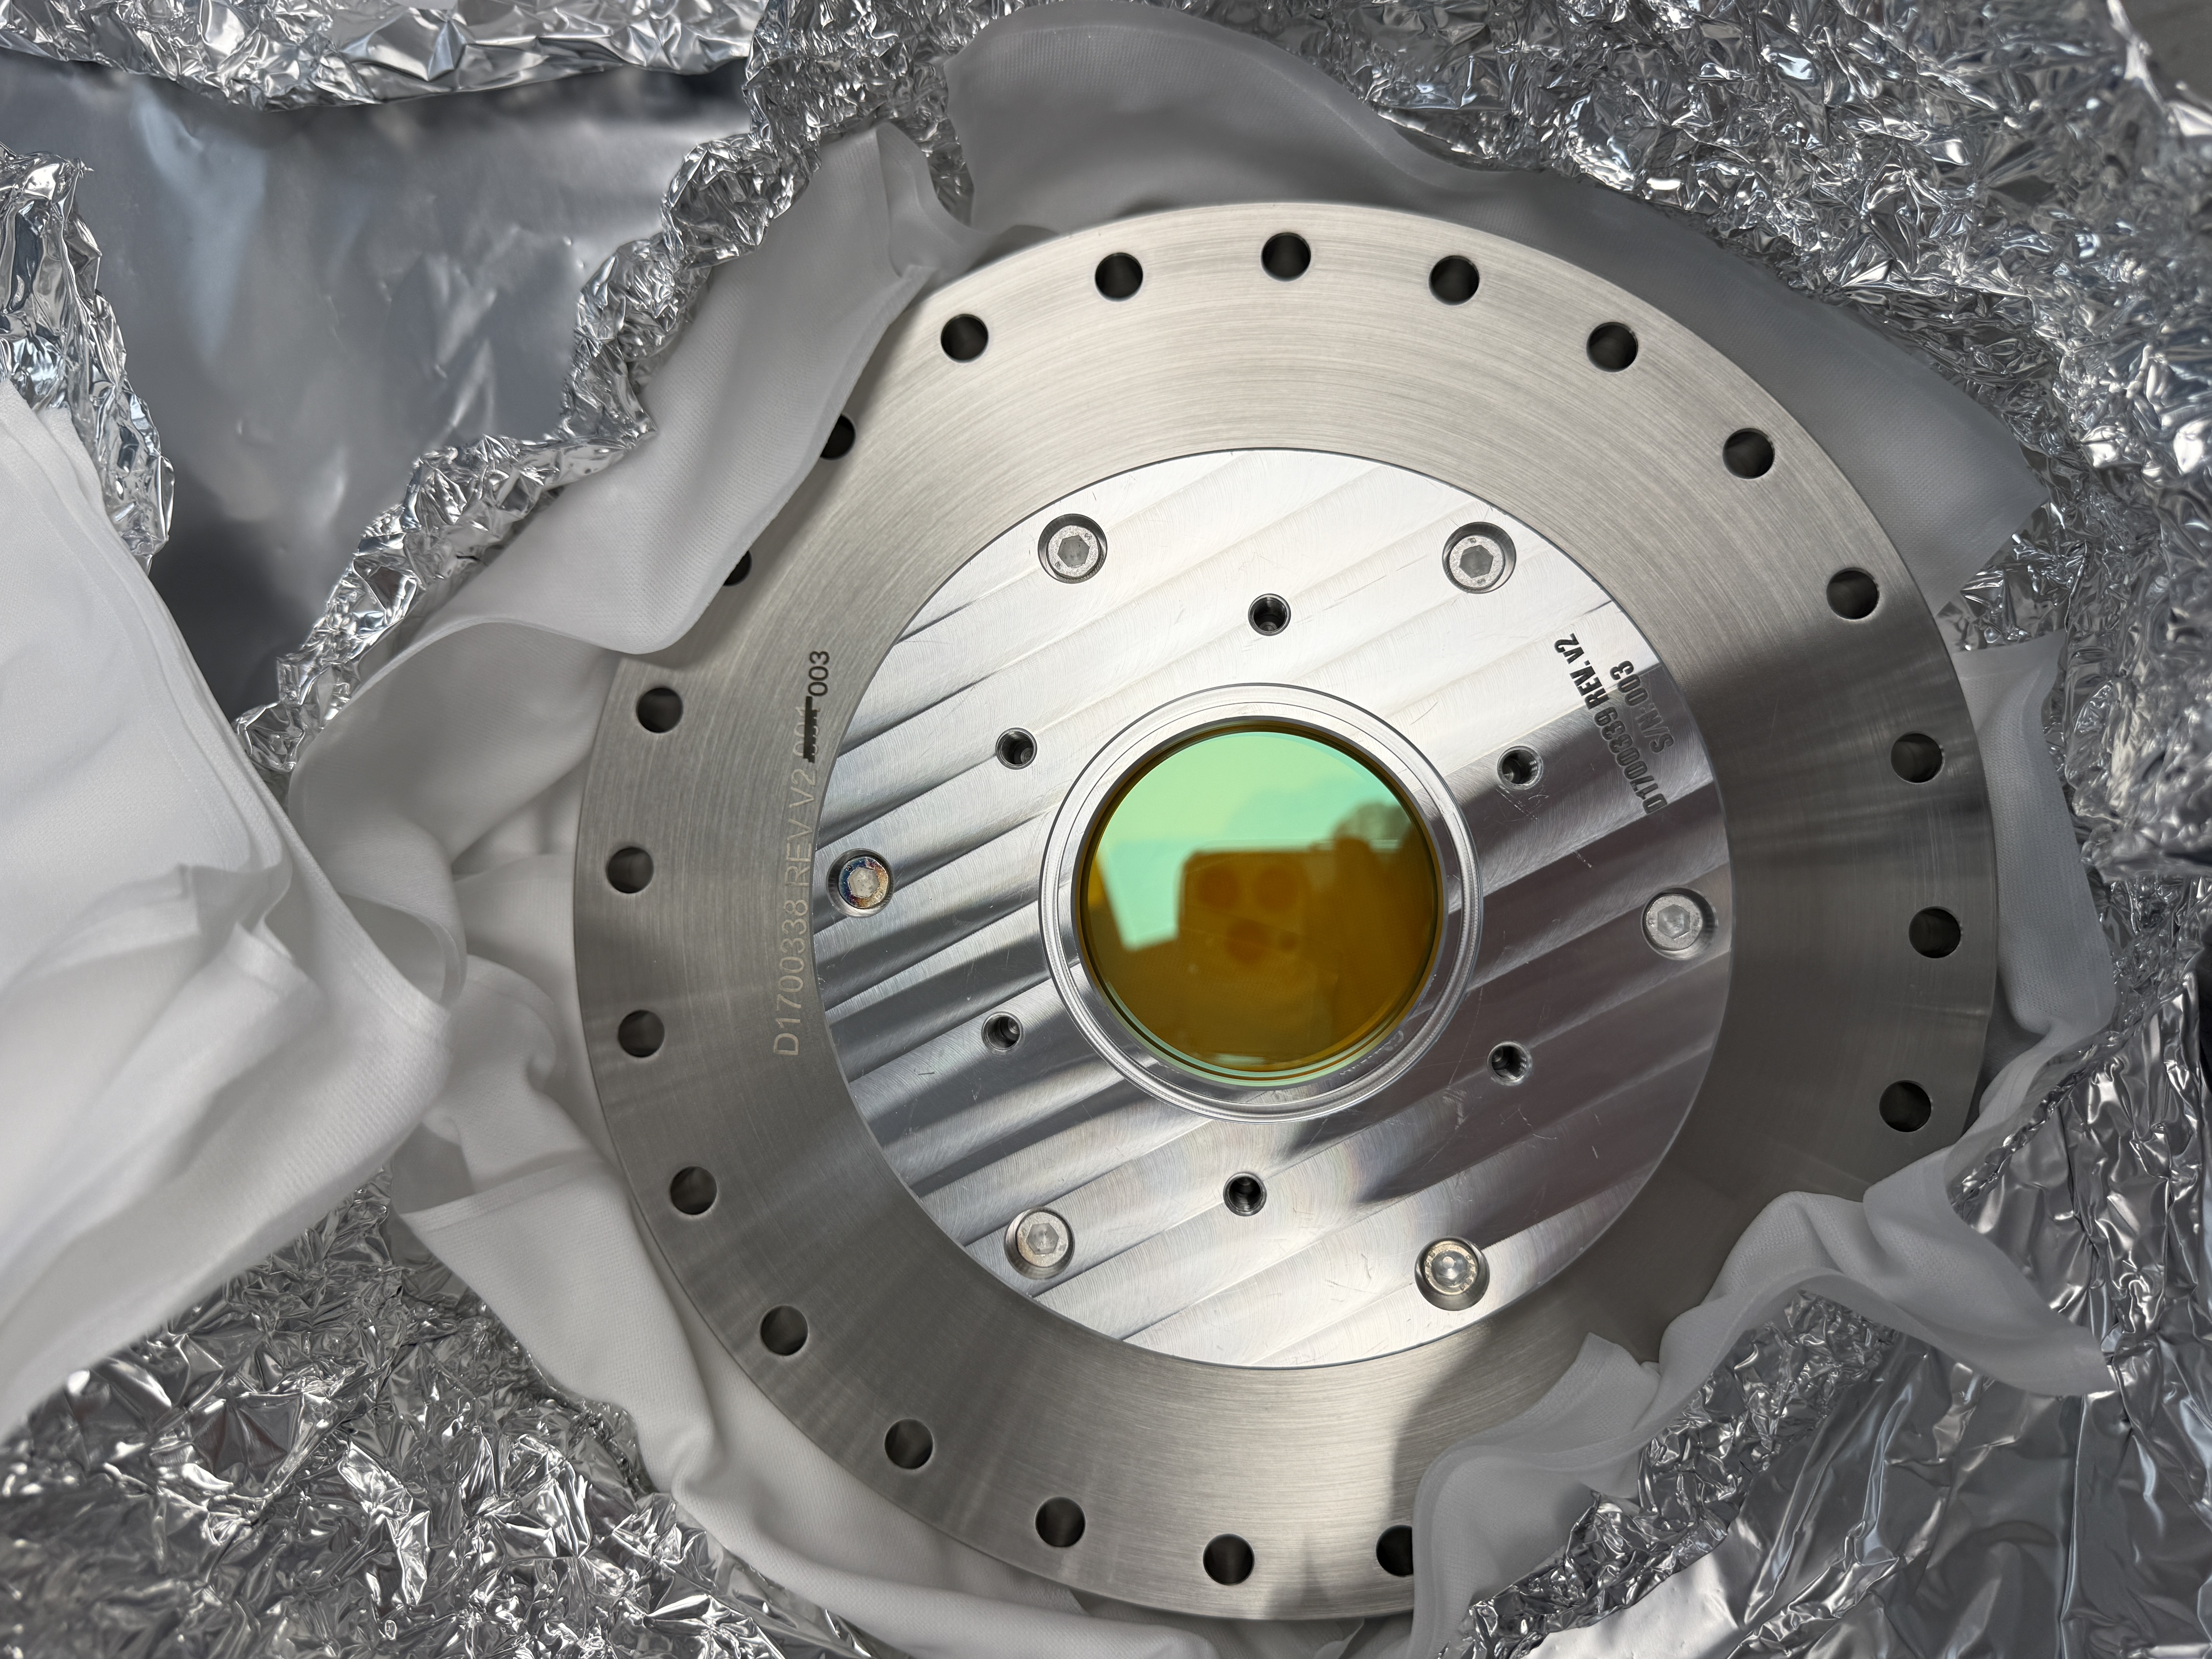
Next step is to finish the assemblies and install them.

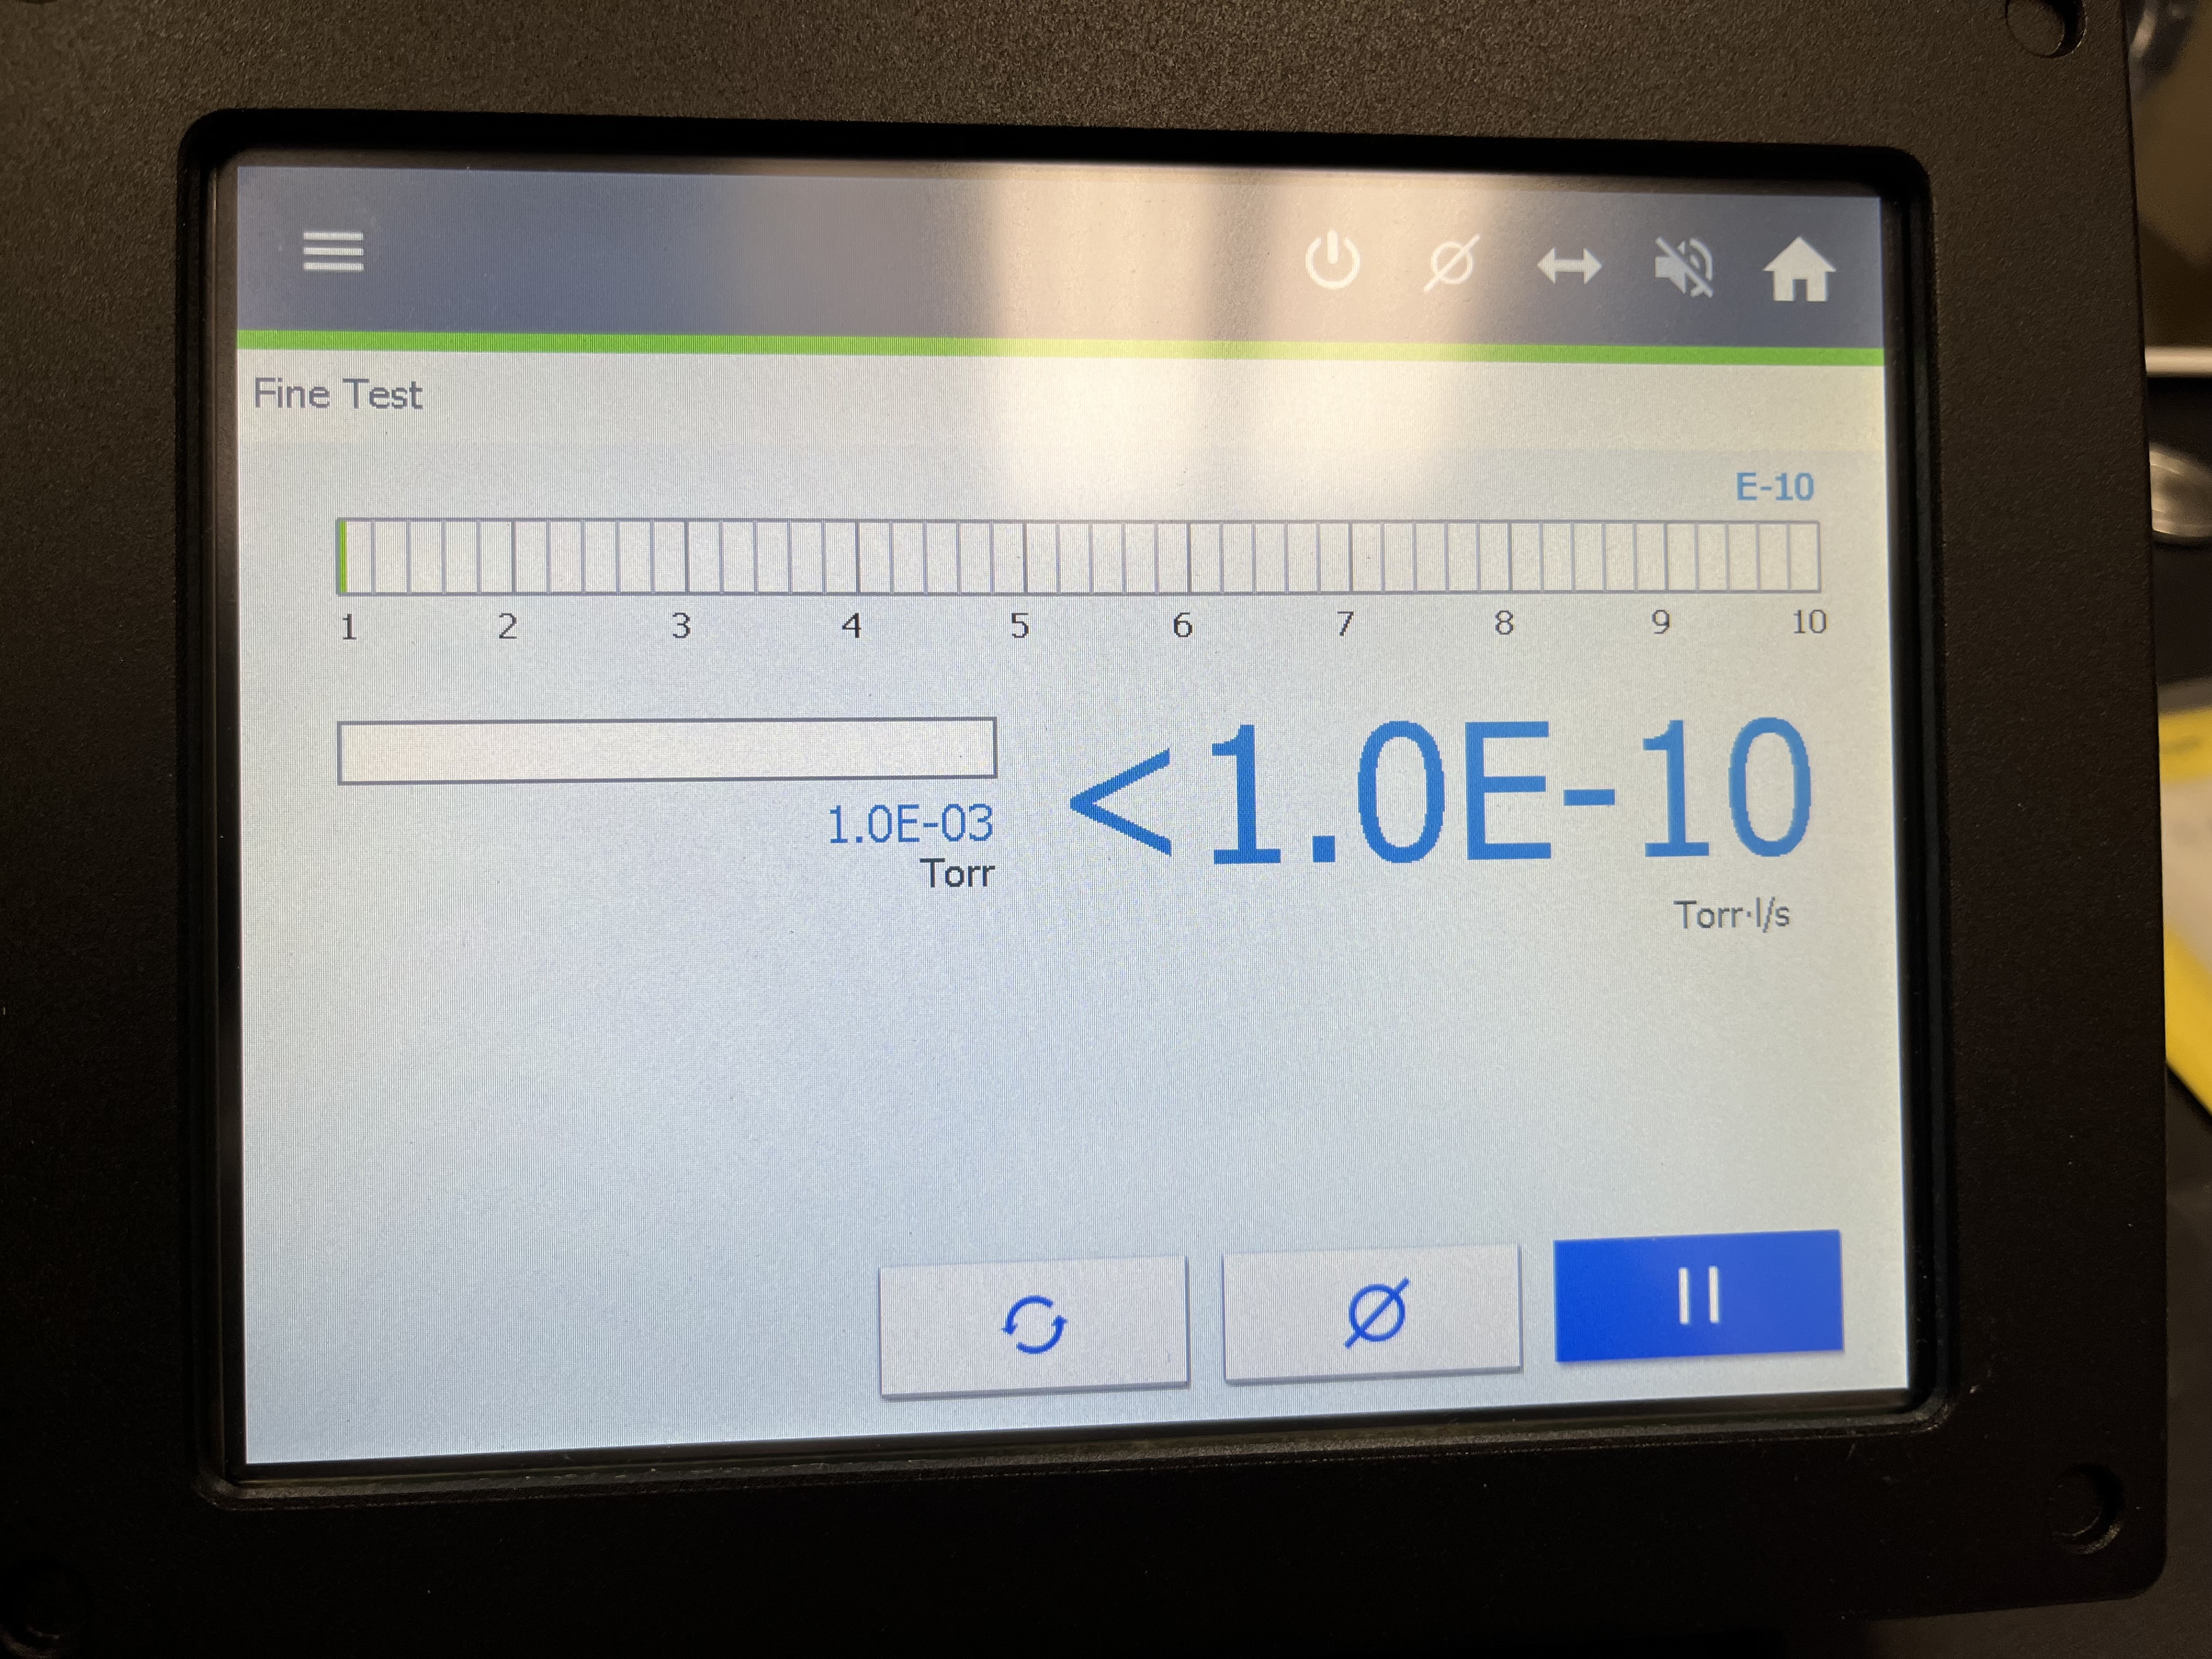
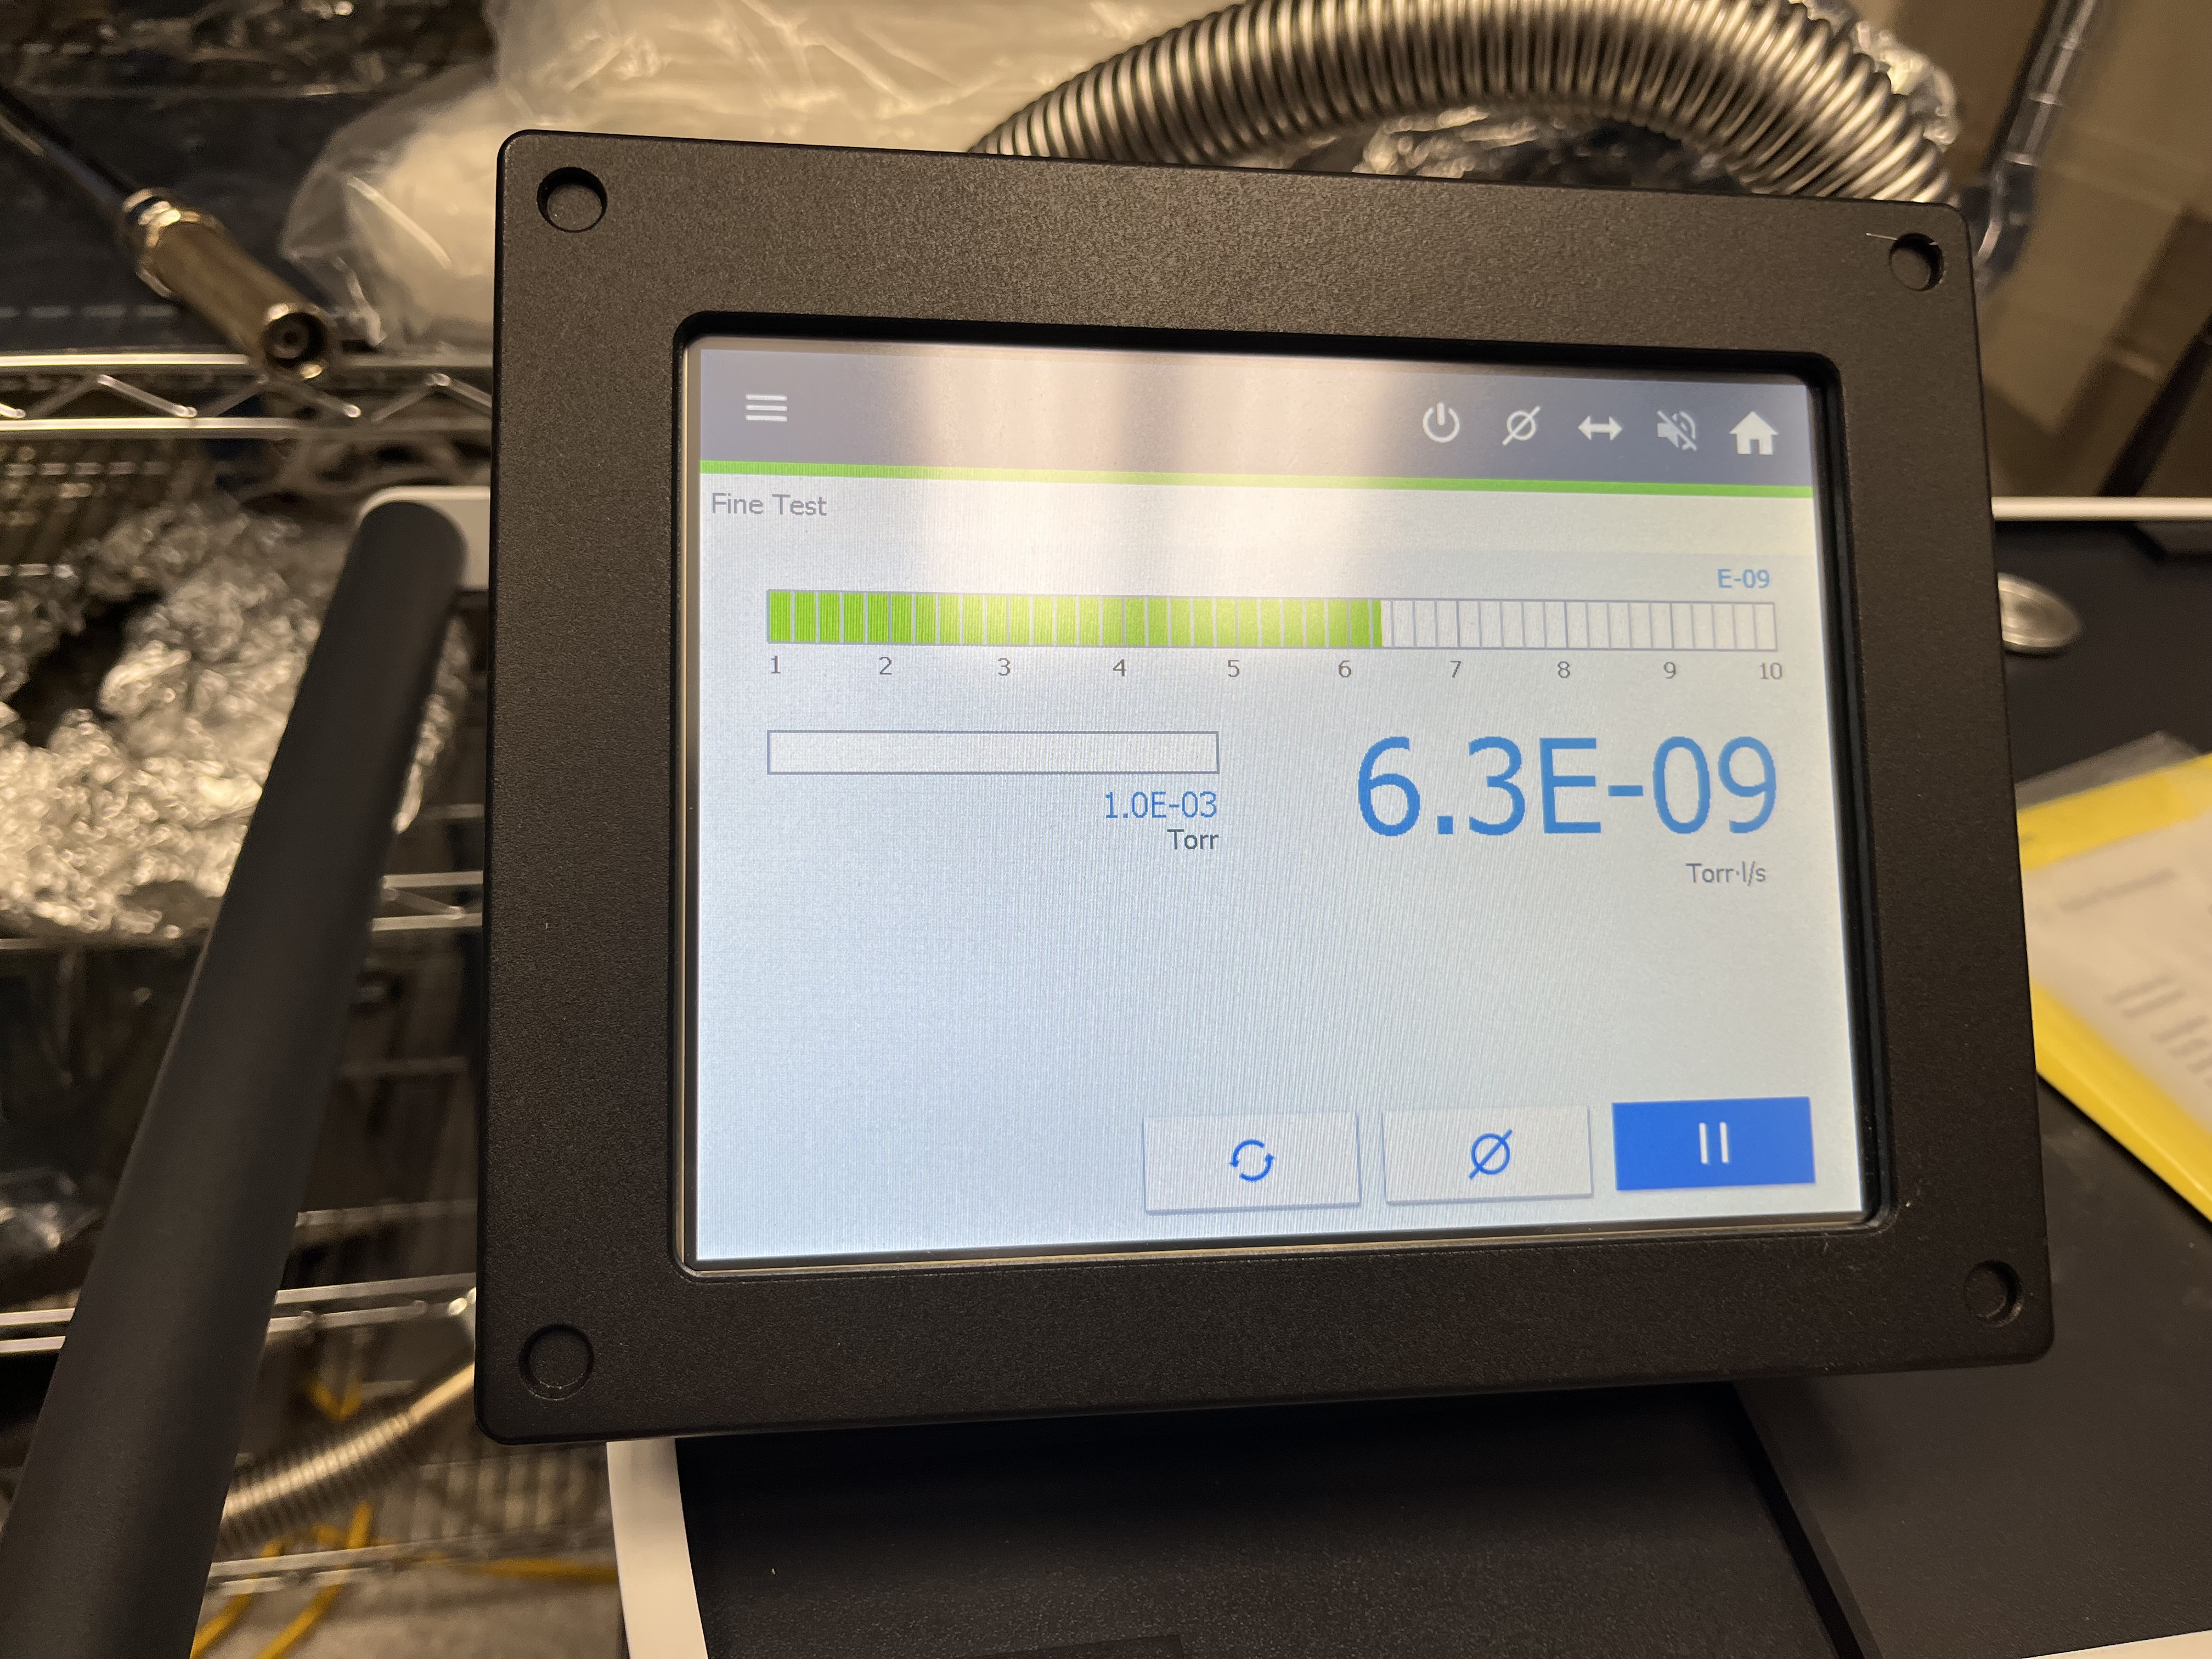
Since the assemblies do not have an assembly number I'll list them as 003 and 001 due to their components SNs.  The background reported by the LD at startup was at <1X10⁻¹⁰ Torr*L/Sec.  These are LIGO viewports and they have a viton O-ring, thus He will permeate thru the O-ring, also the testing jig has two more O-rings.  The signal did not shot up to the recorded number, it slowly got there.

  • Assembly 003, after spraying it with He for about 5 seconds on two places the LD reported a leak rate of 3.3X10-09 Torr*L/Sec.
  • Assembly 001, same process as above, the LD reported a leak rate of 6.3X10-09 Torr*L/Sec.


Images attached to this comment
H1 SUS (SQZ, SUS)
rahul.kumar@LIGO.ORG - posted 13:40, Friday 02 February 2024 - last comment - 15:11, Wednesday 01 July 2026(75709)
ZM5 suspension's optic in HAM7 chamber offloaded to 47 in lbs.

Camille (CIT), Rahul

Just like ZM4 (see LHO alog 75677) we have offloaded ZM5 (P-SAMs) in HAM7 chamber to 47 in lbs. as per E2300463_V1. We followed the same procedure as described in alog 75677. Camille will post all the relevant pictures.

Post work transfer function measurements showed that the suspension is healthy.

Next we will work with Sheila et al on beam alignment in HAM7 chamber and mechanically offload the alignment sliders for both the suspension.

Comments related to this report
camille.makarem@LIGO.ORG - 14:04, Friday 02 February 2024 (75711)
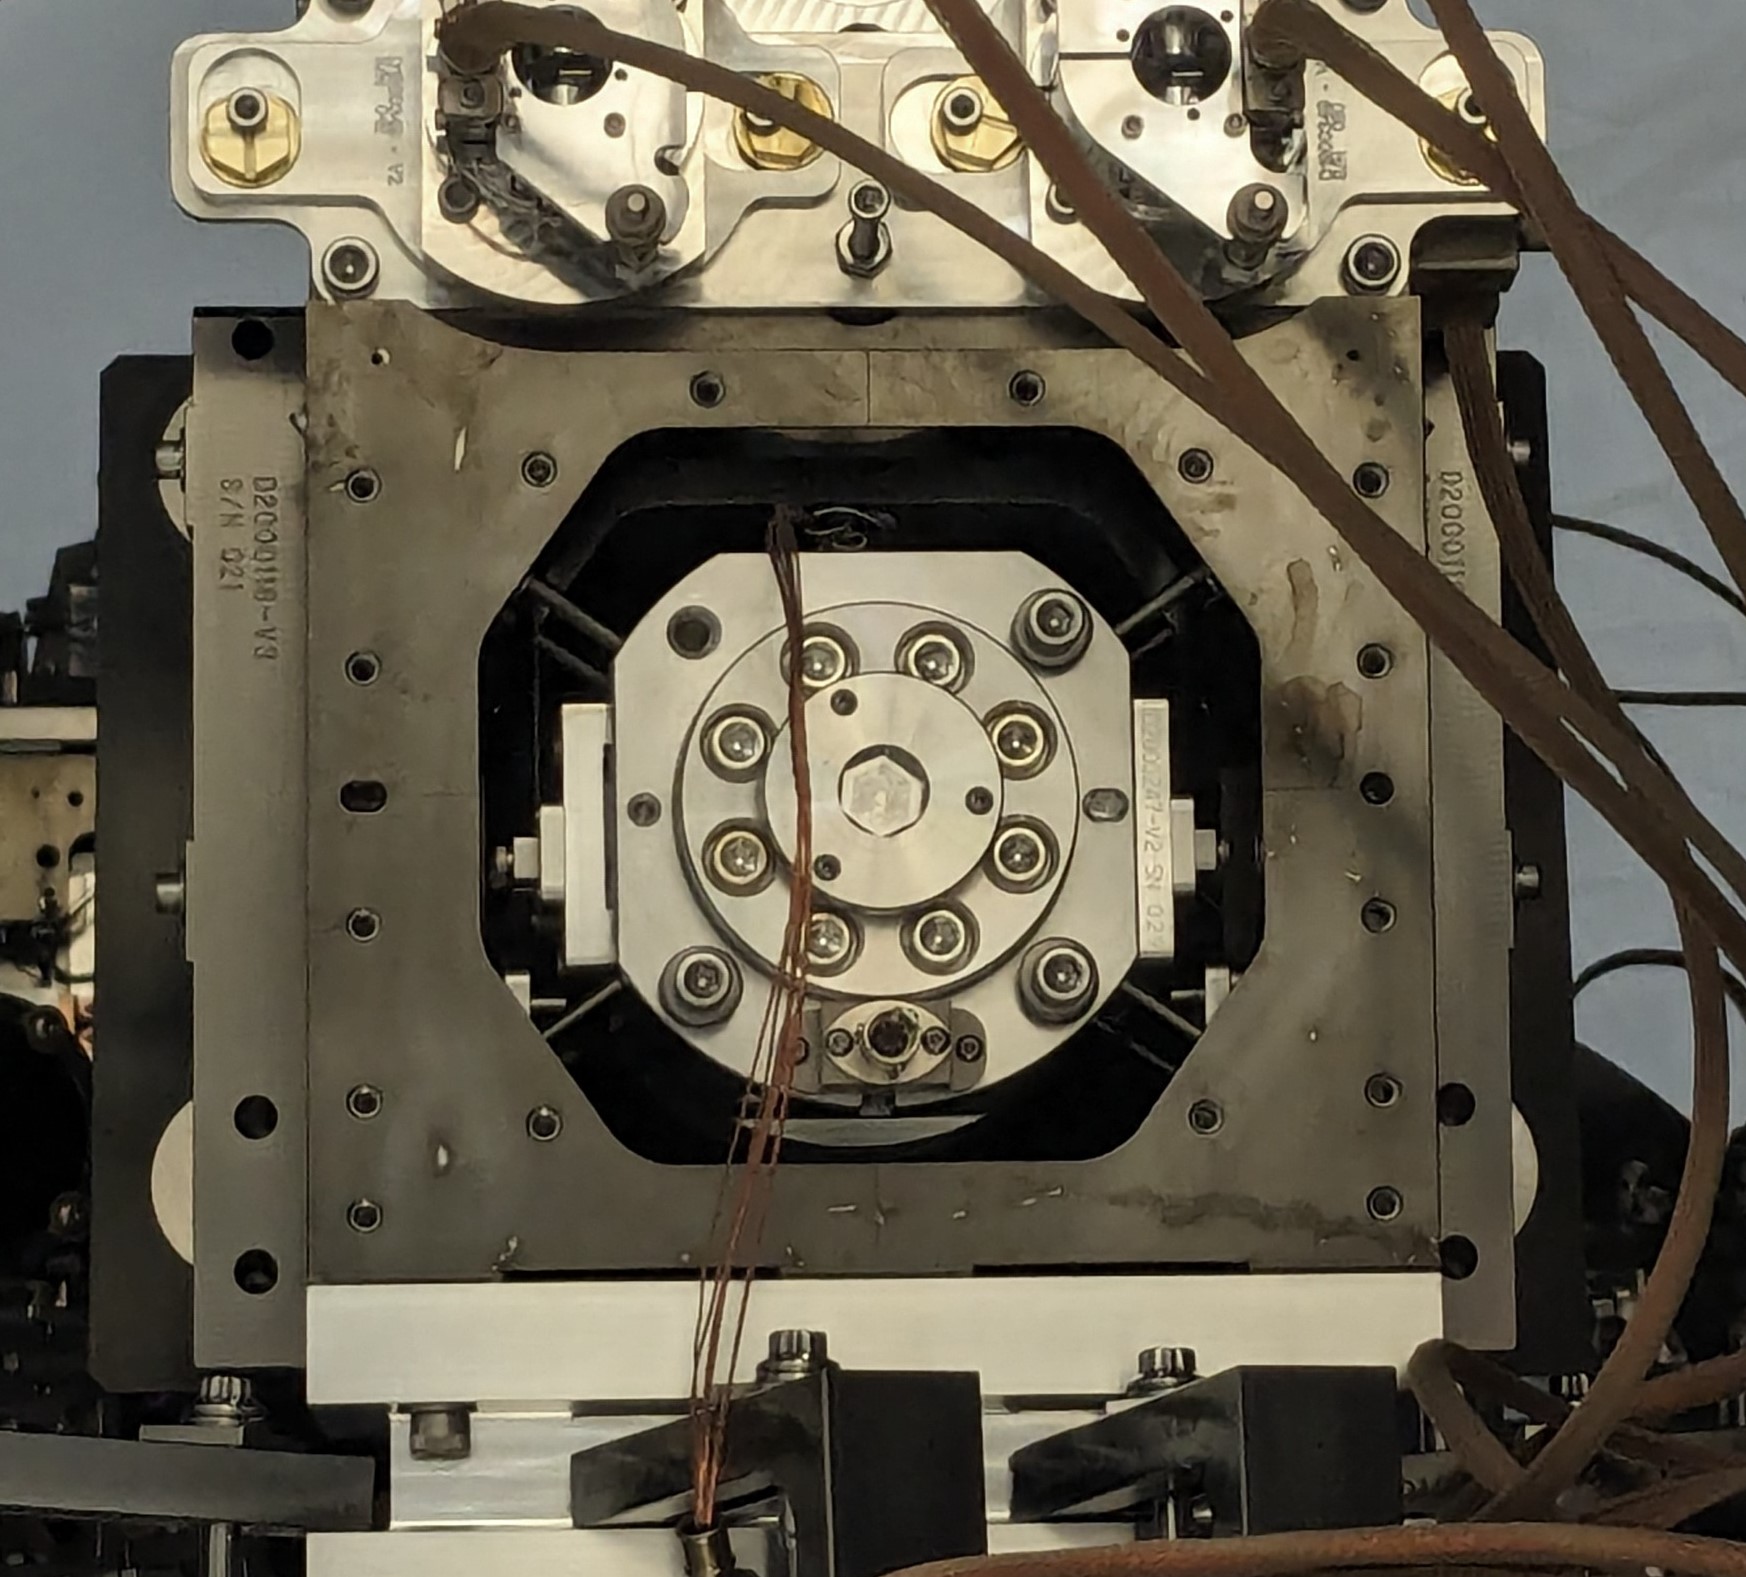
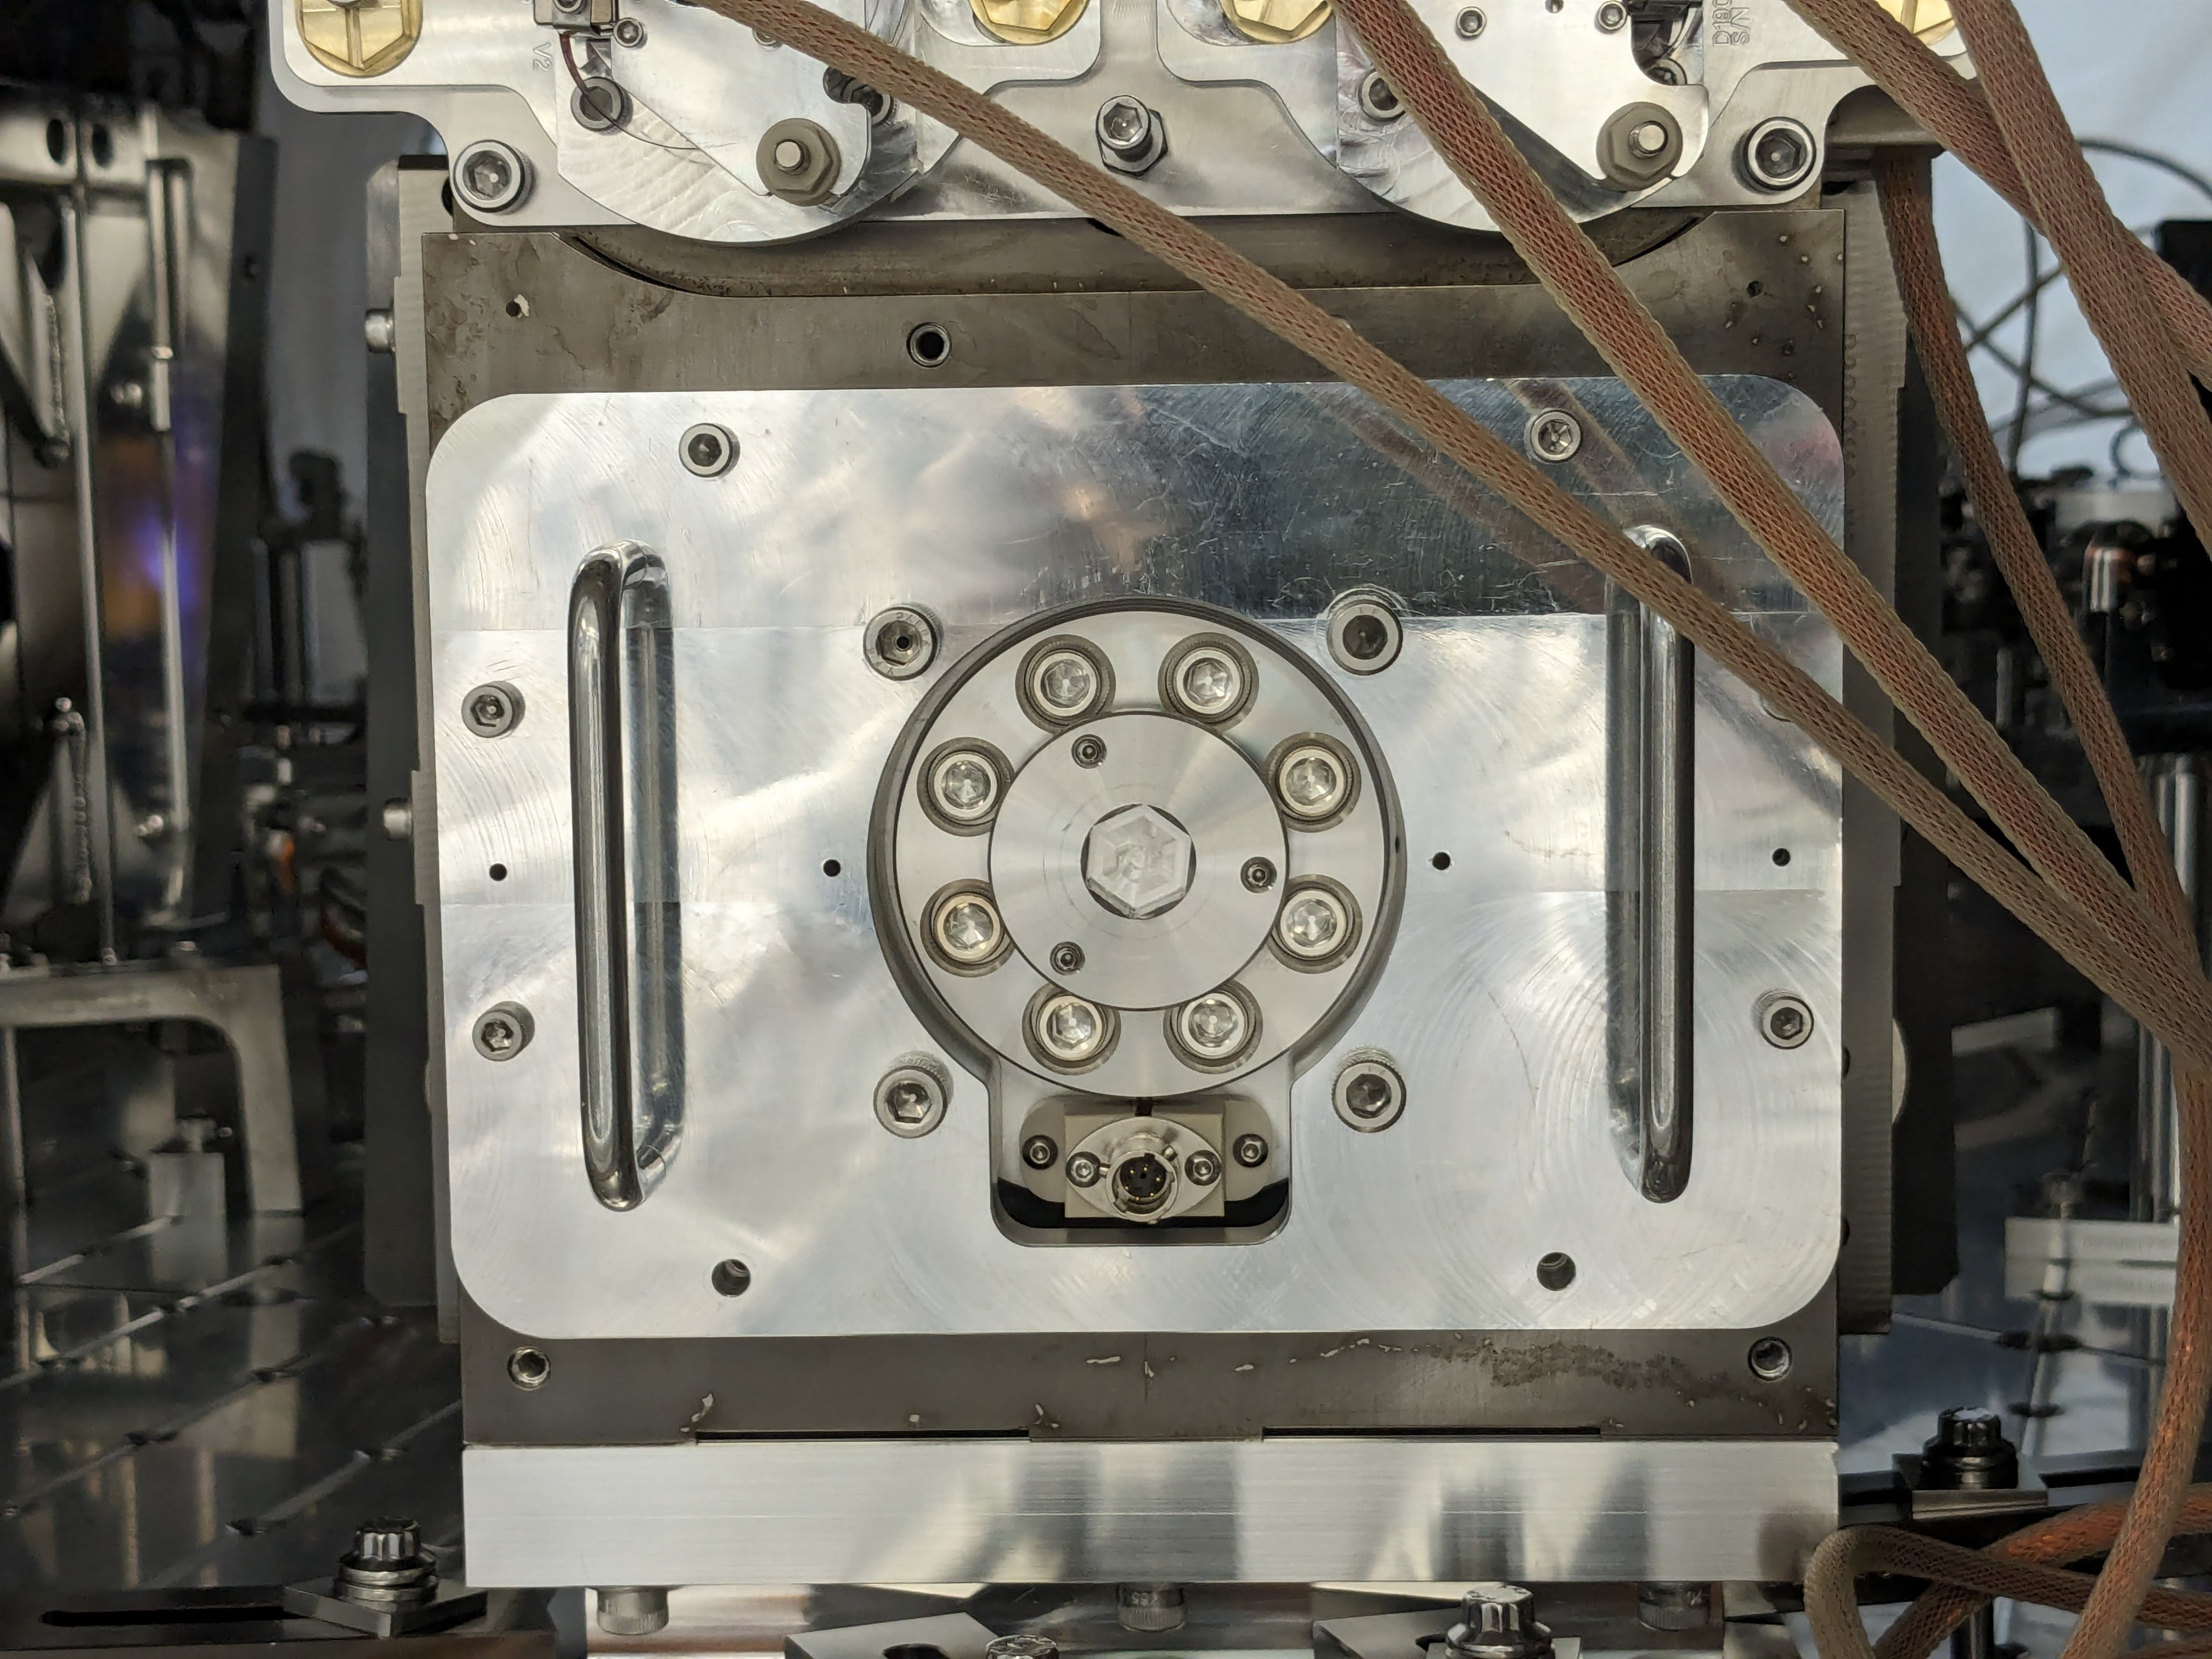
1st image: PSAMS secured to Fixture Plate
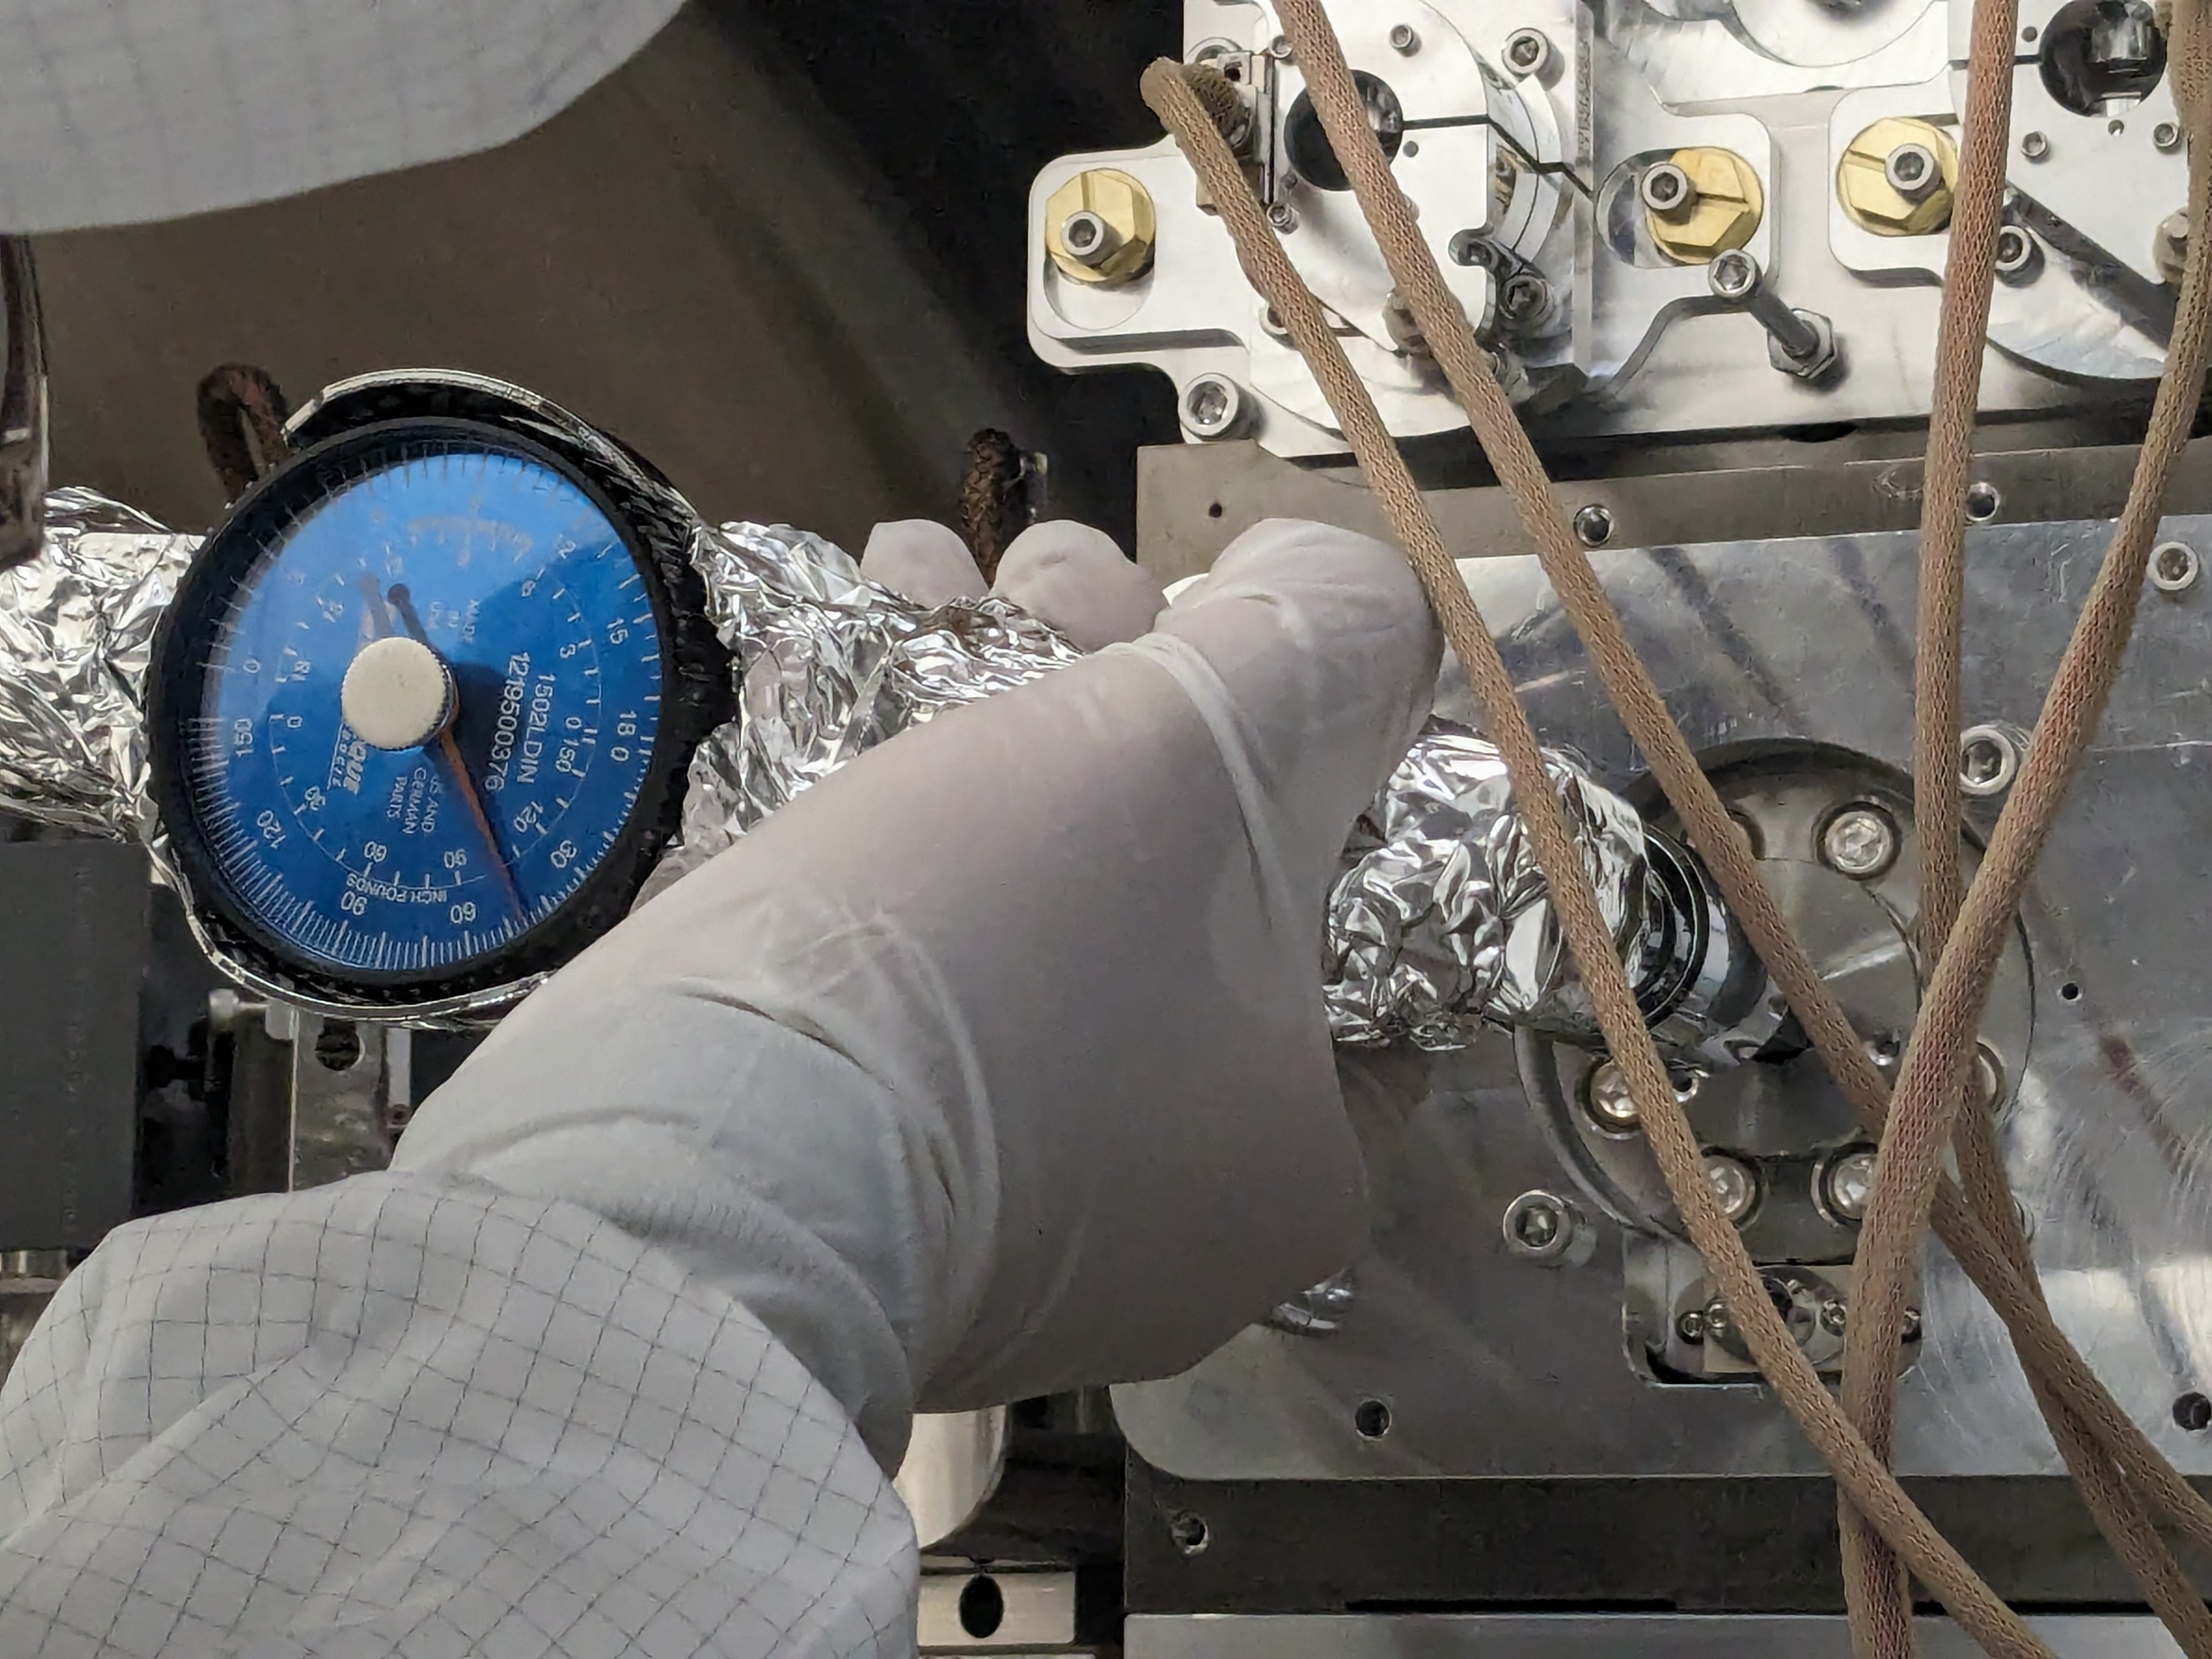
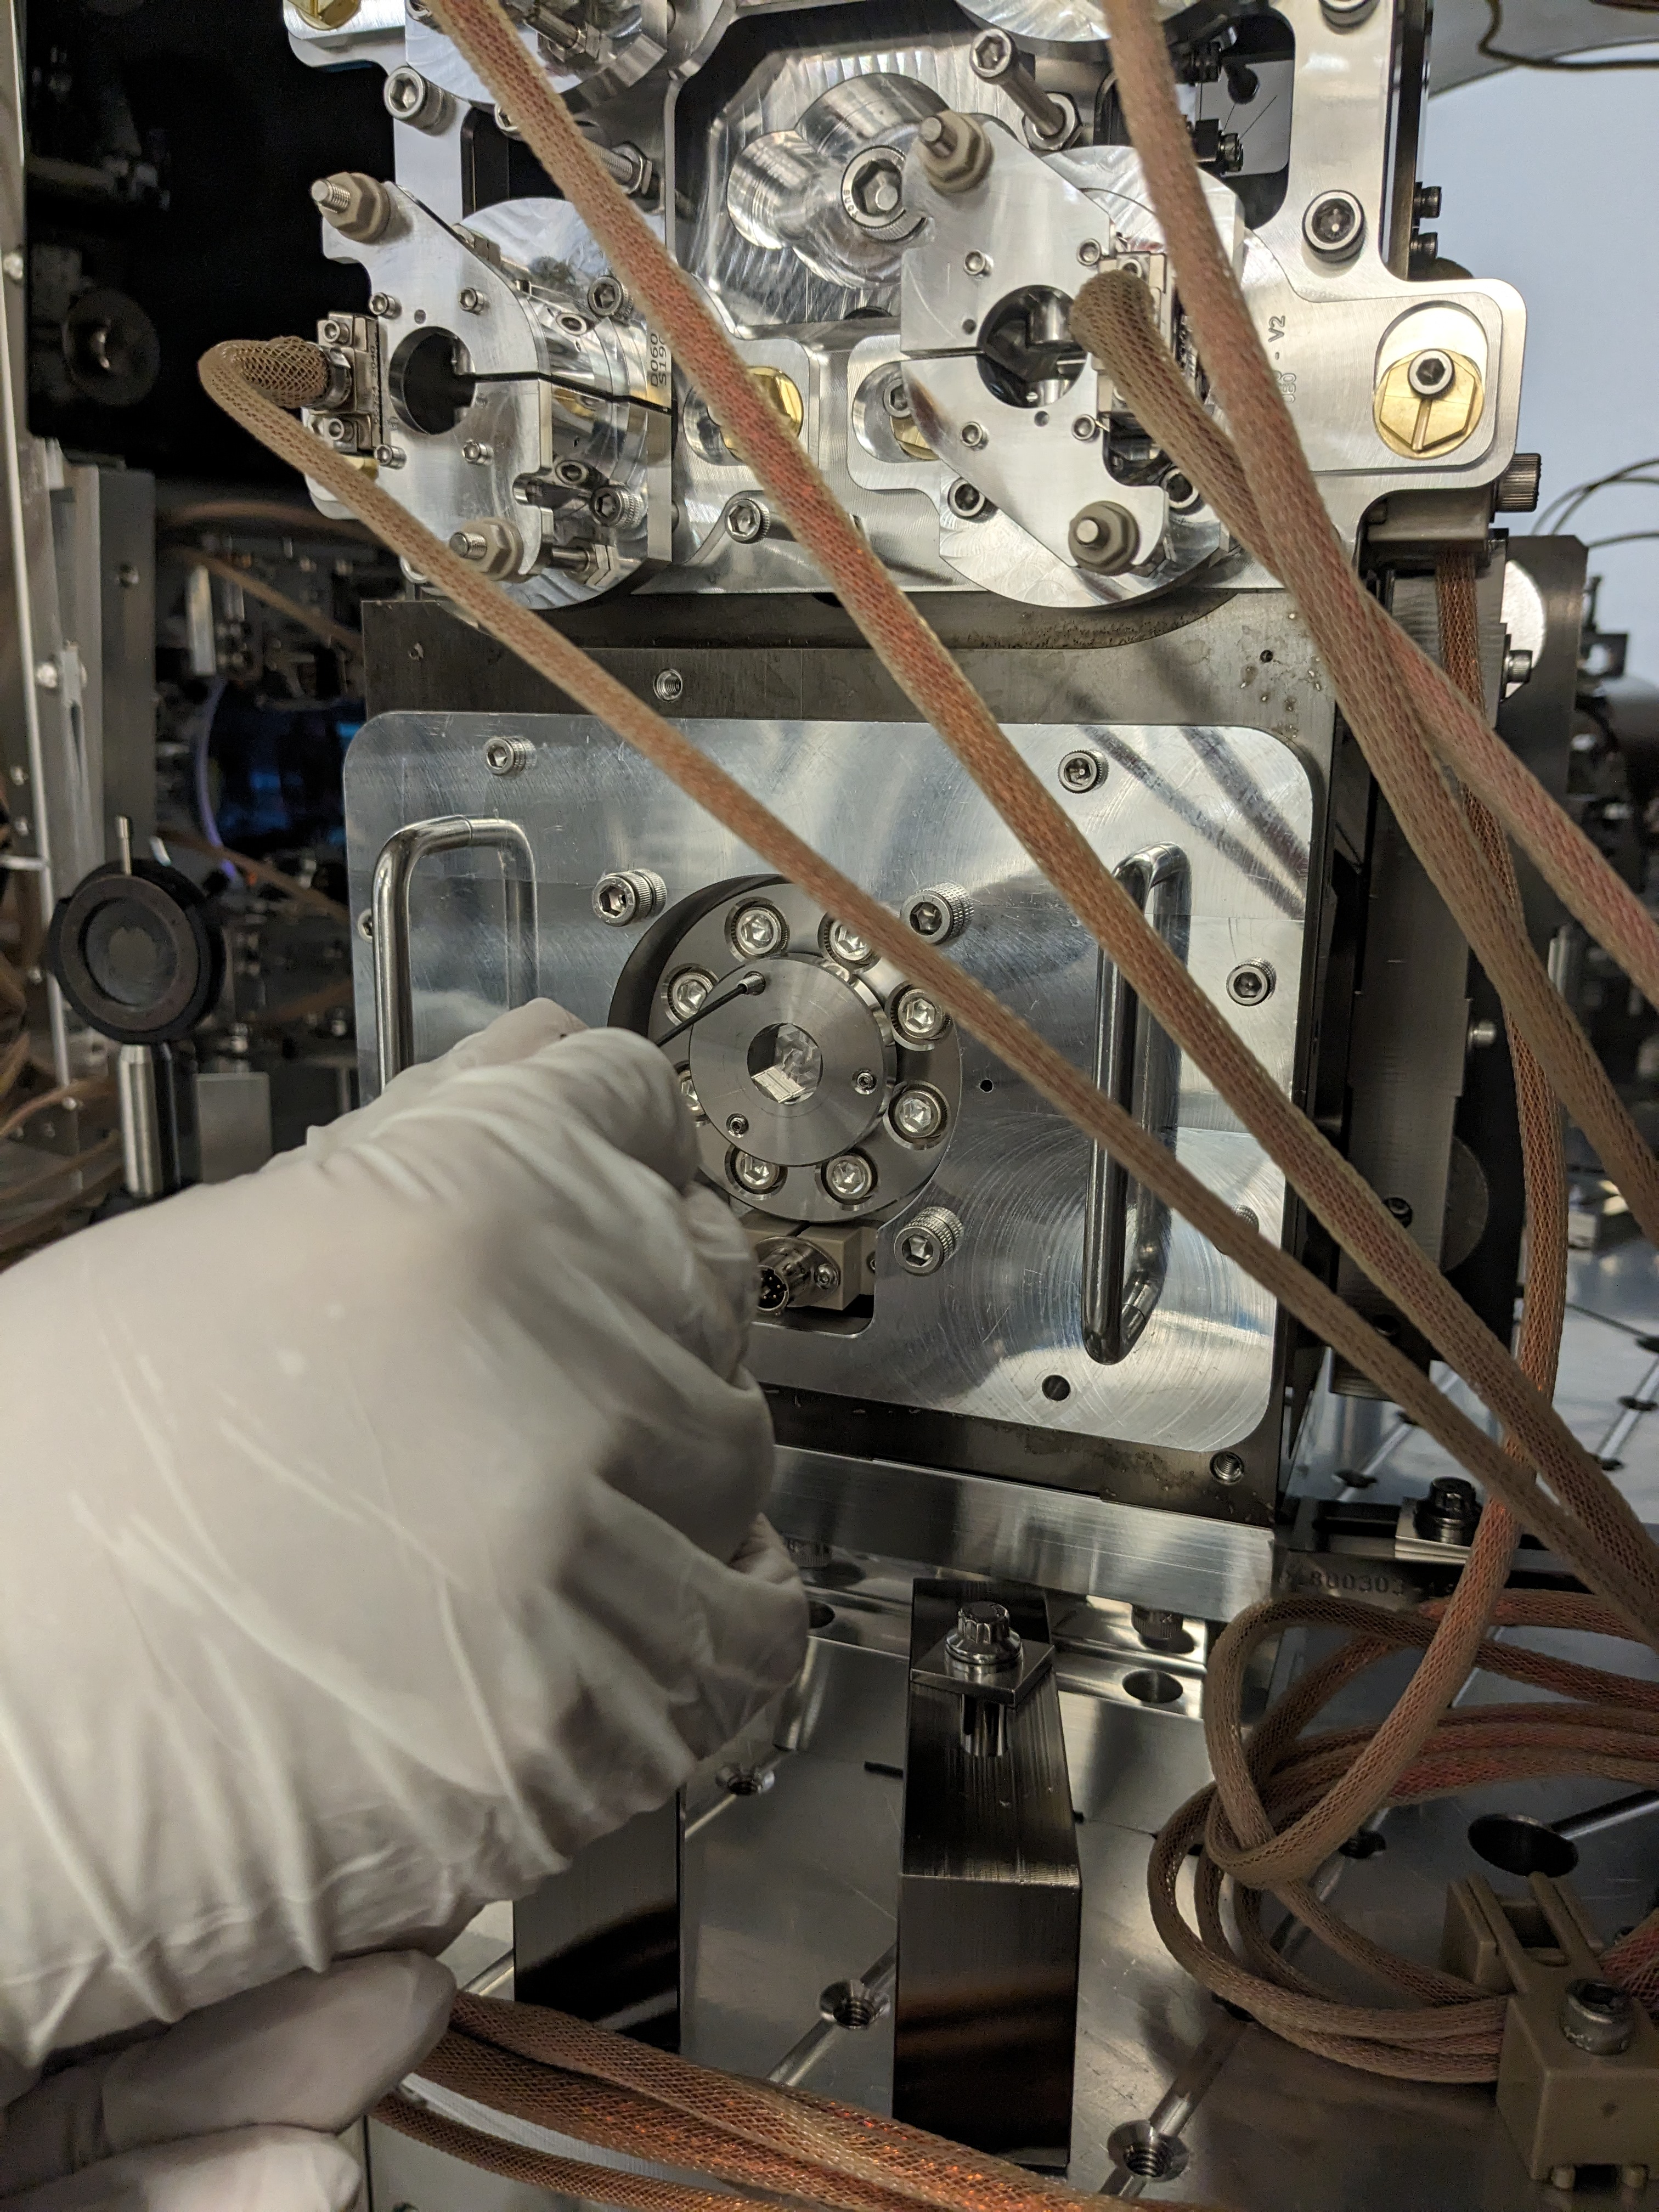
2nd image: PSAMS preloader being adjusted with torque wrench
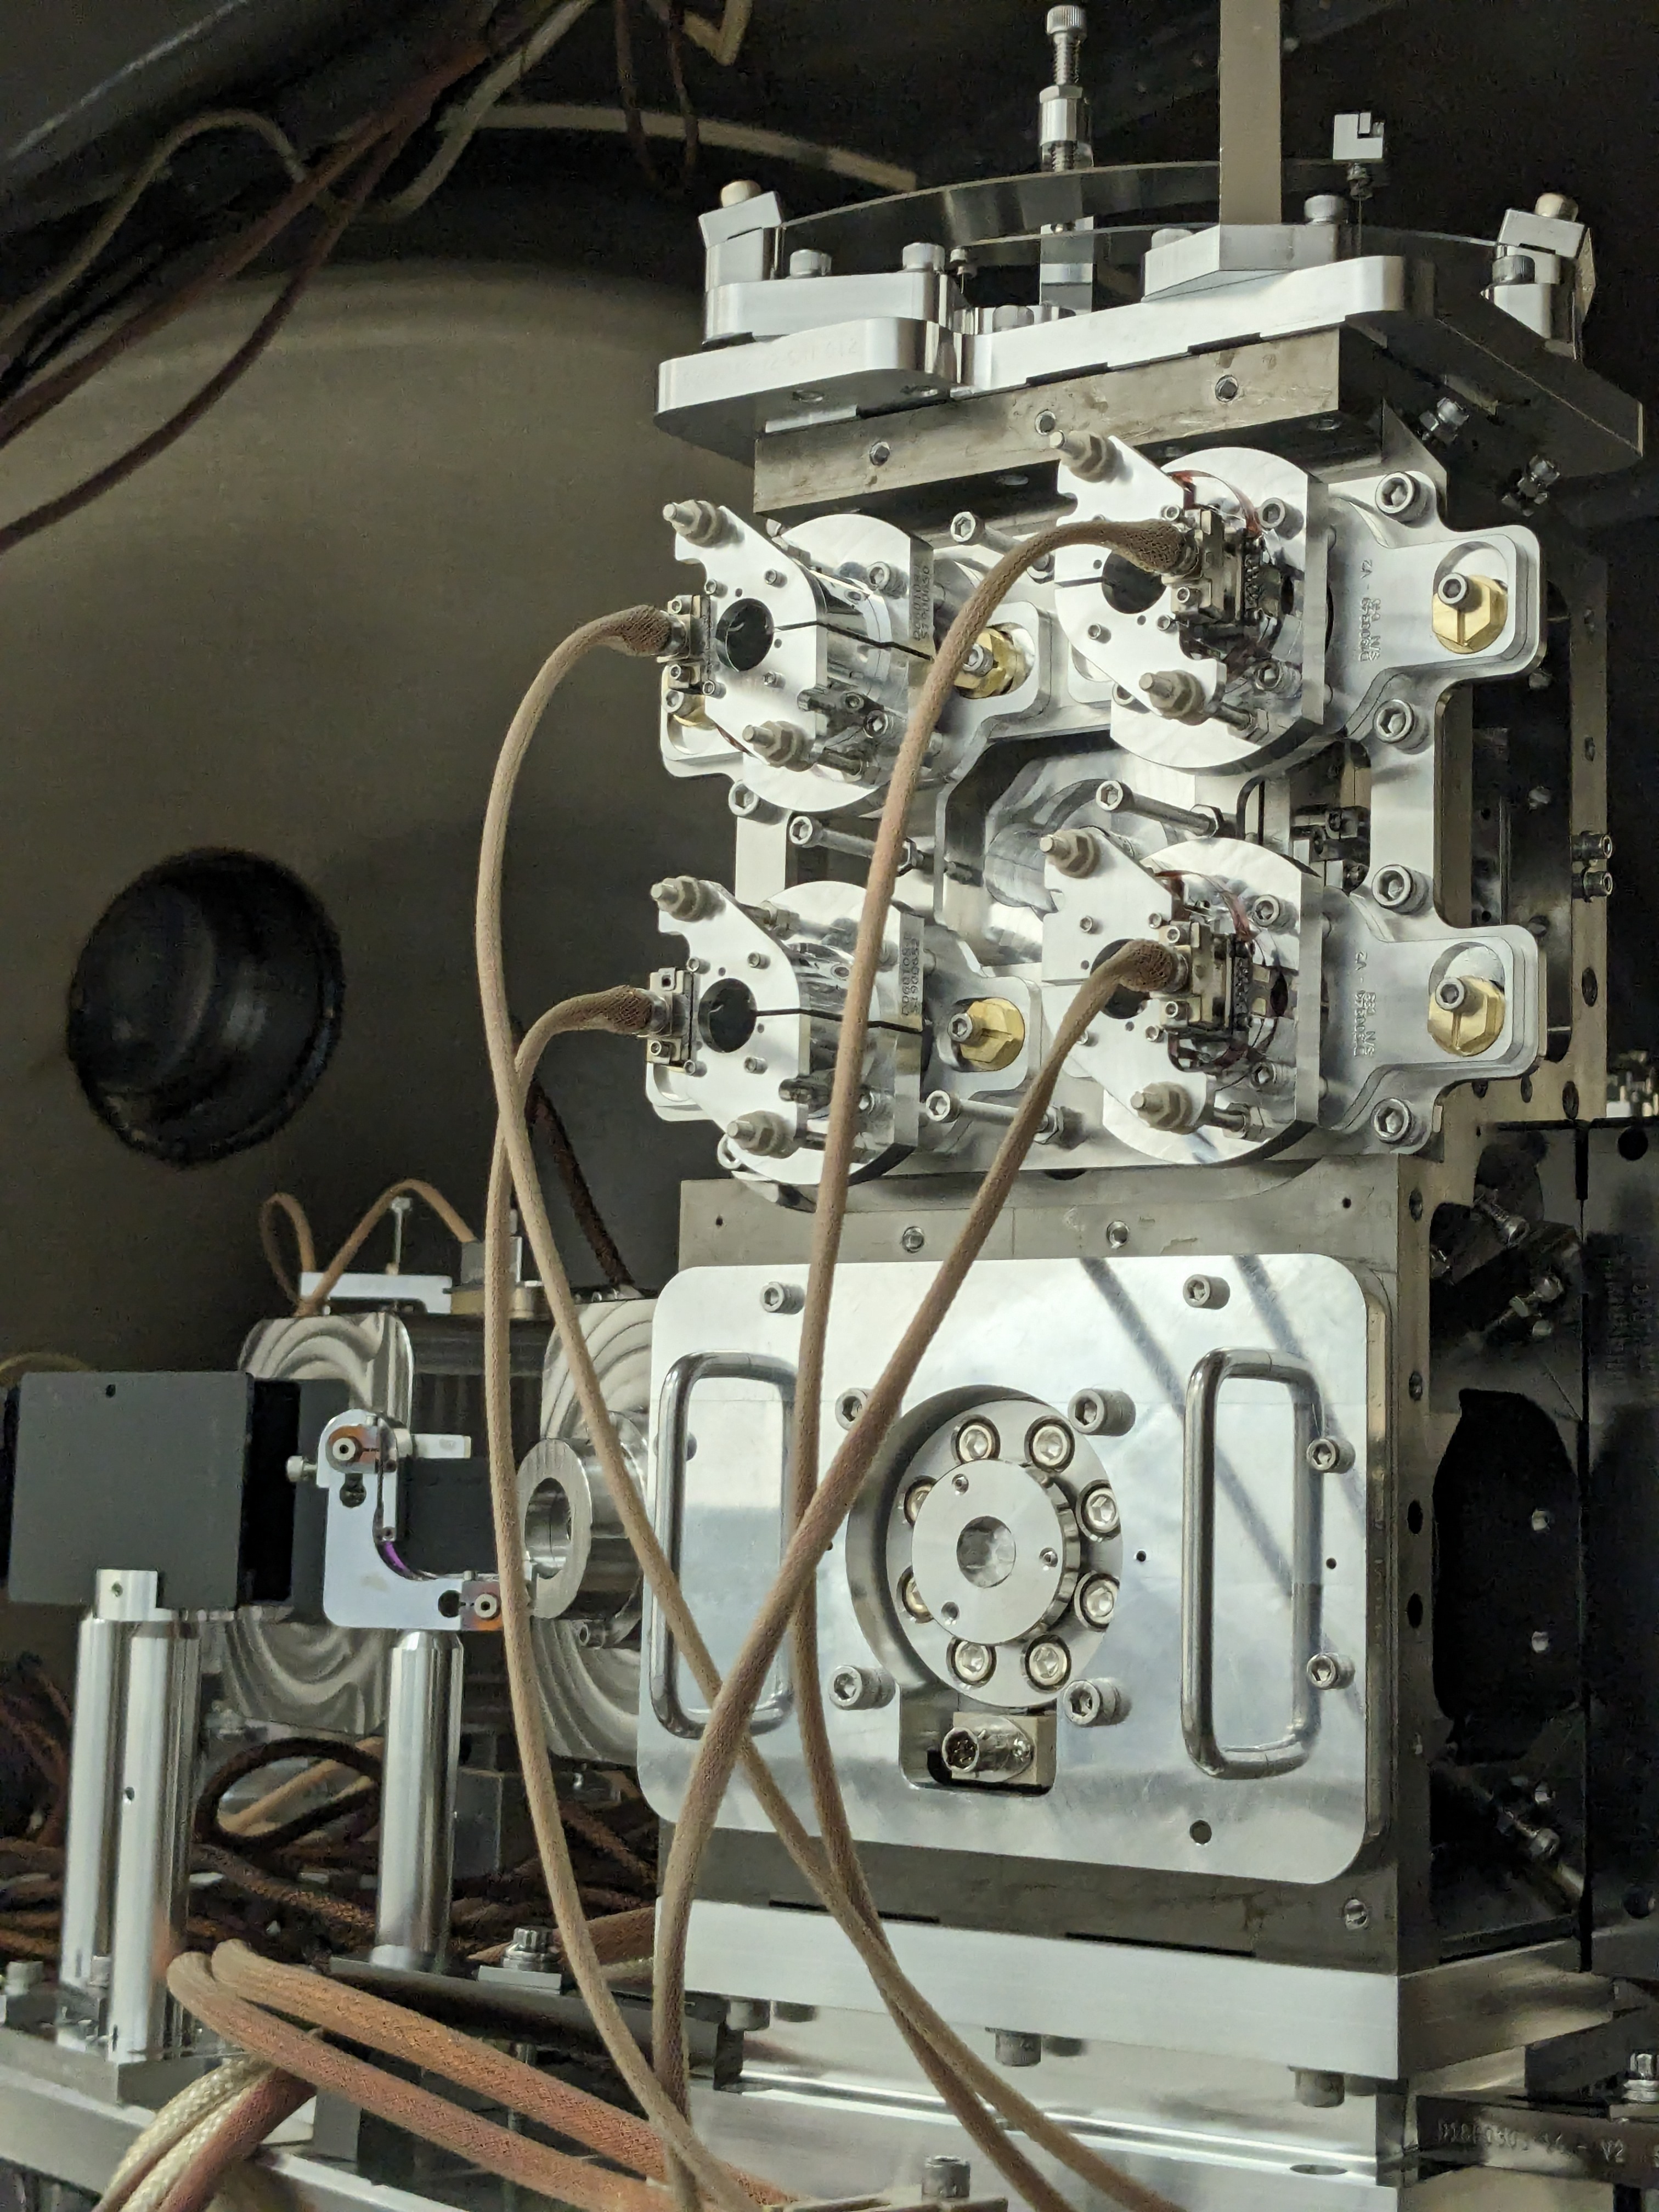
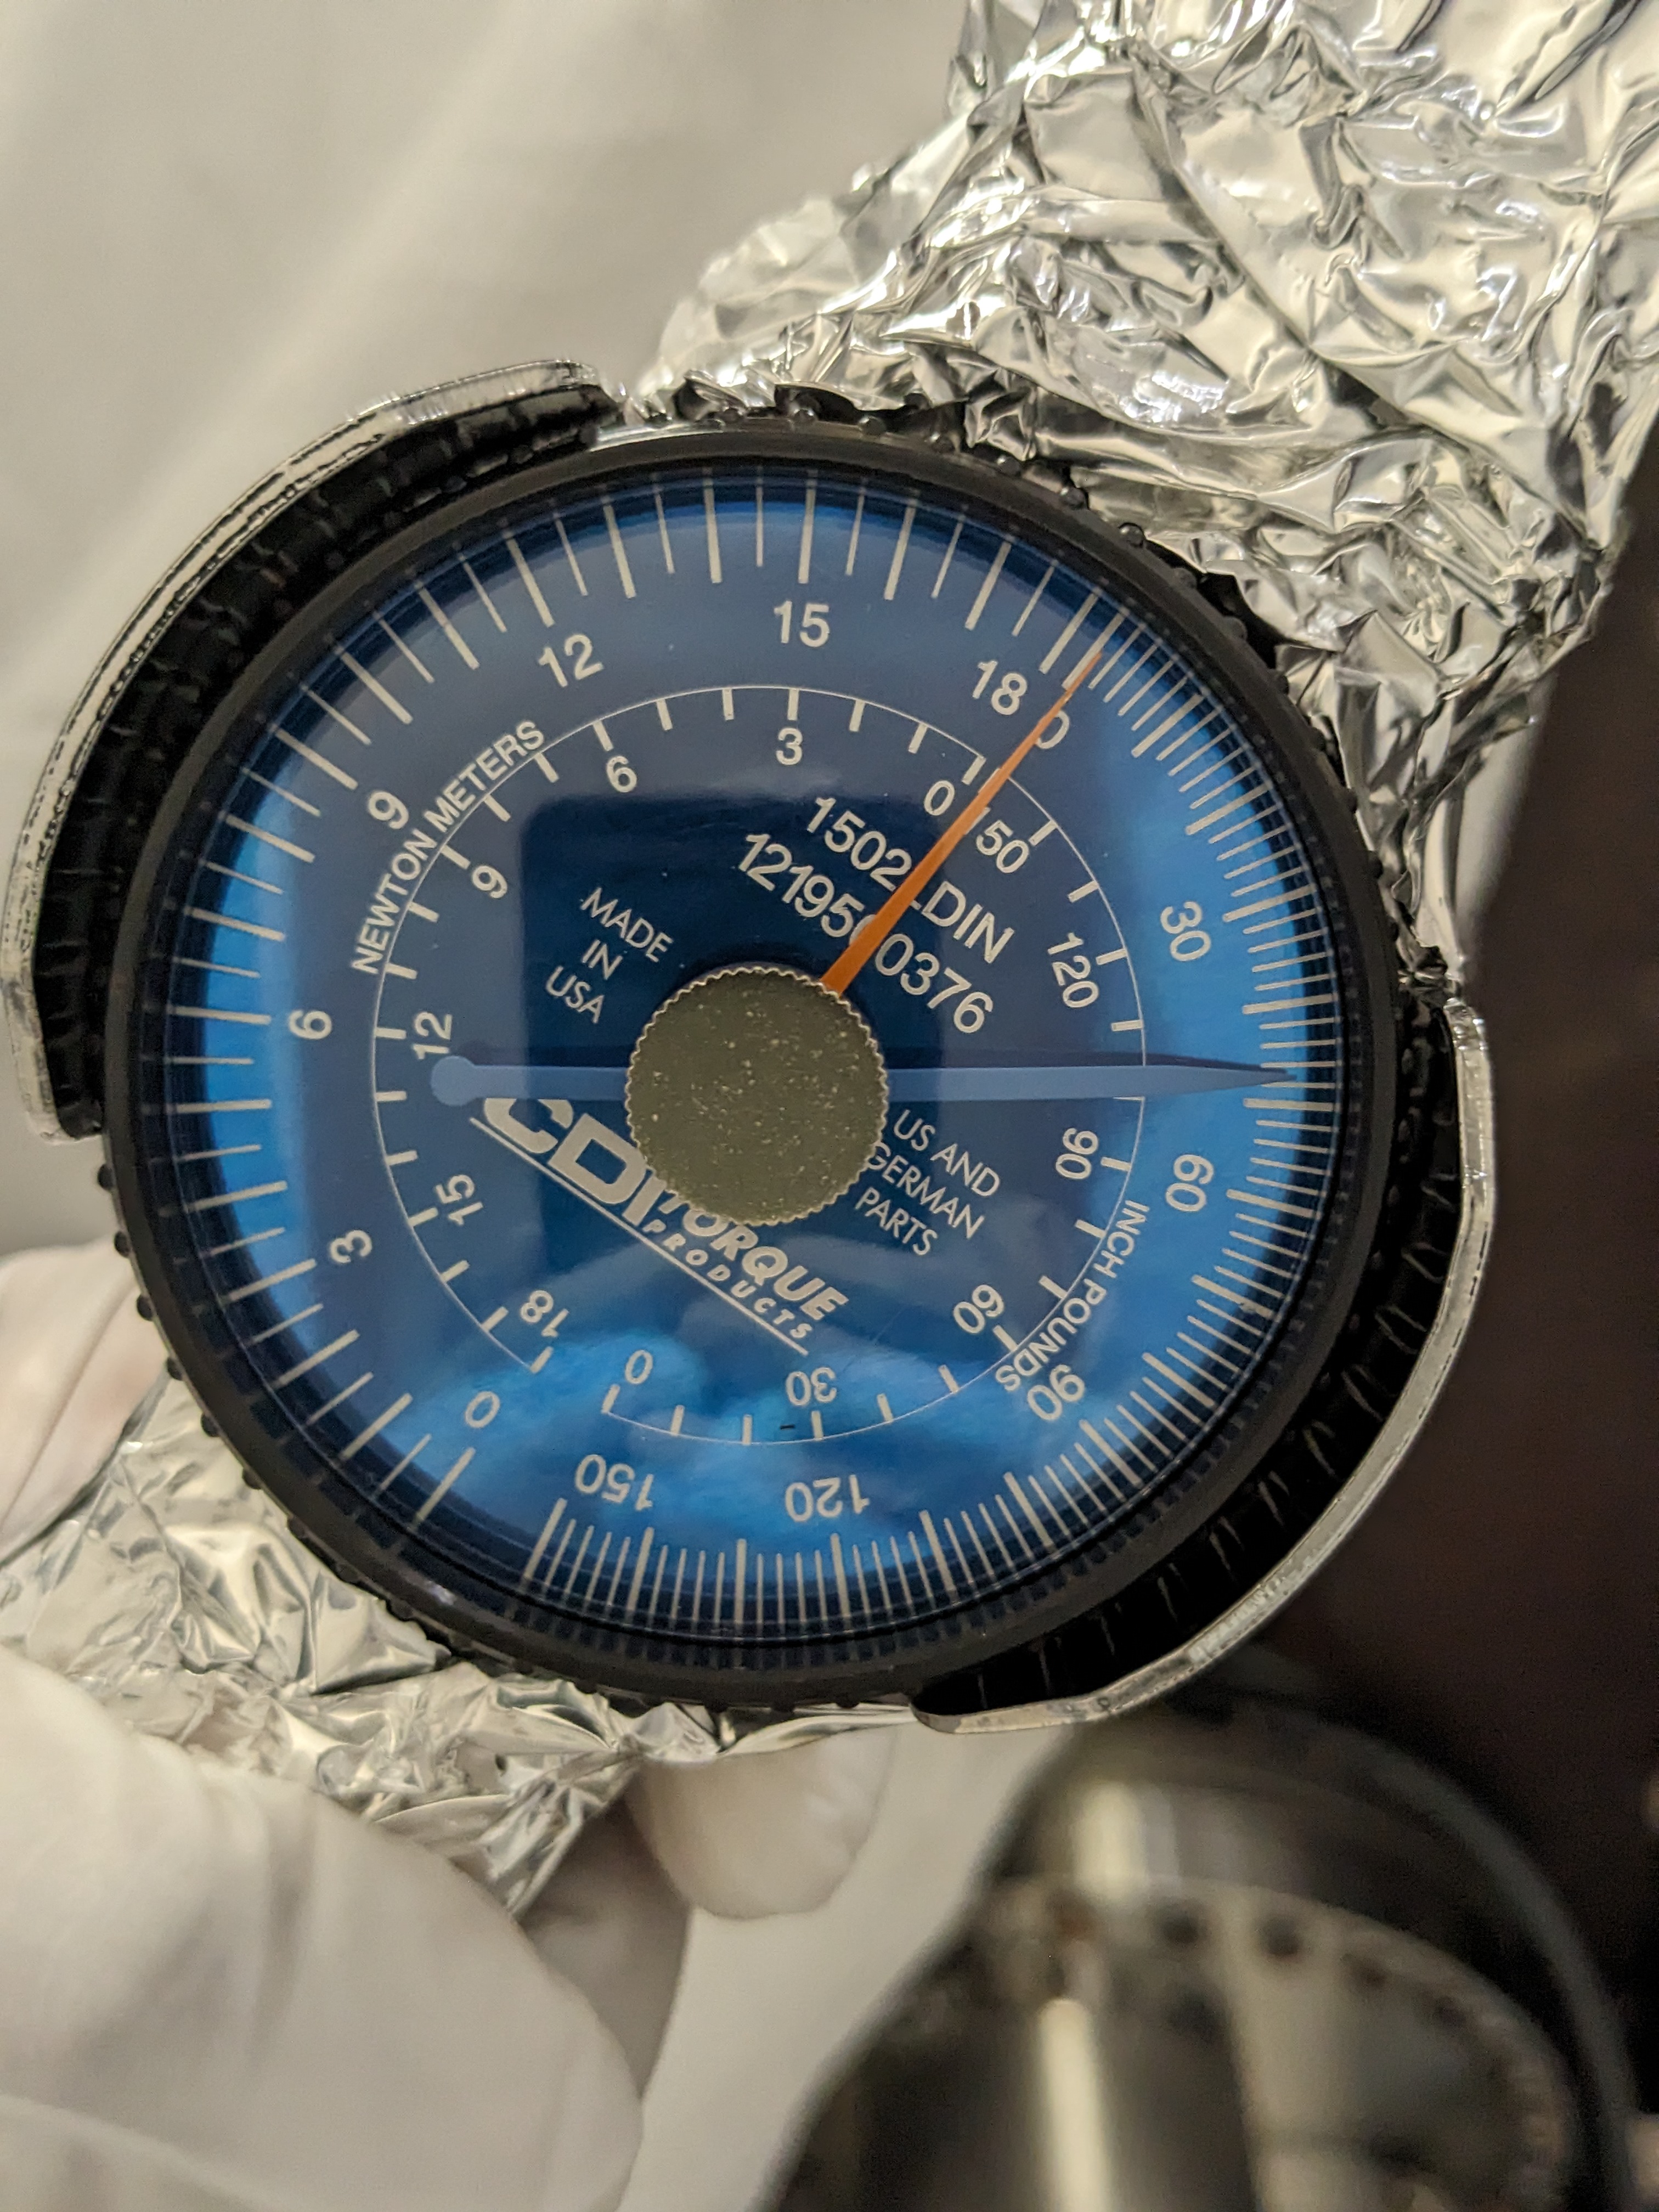
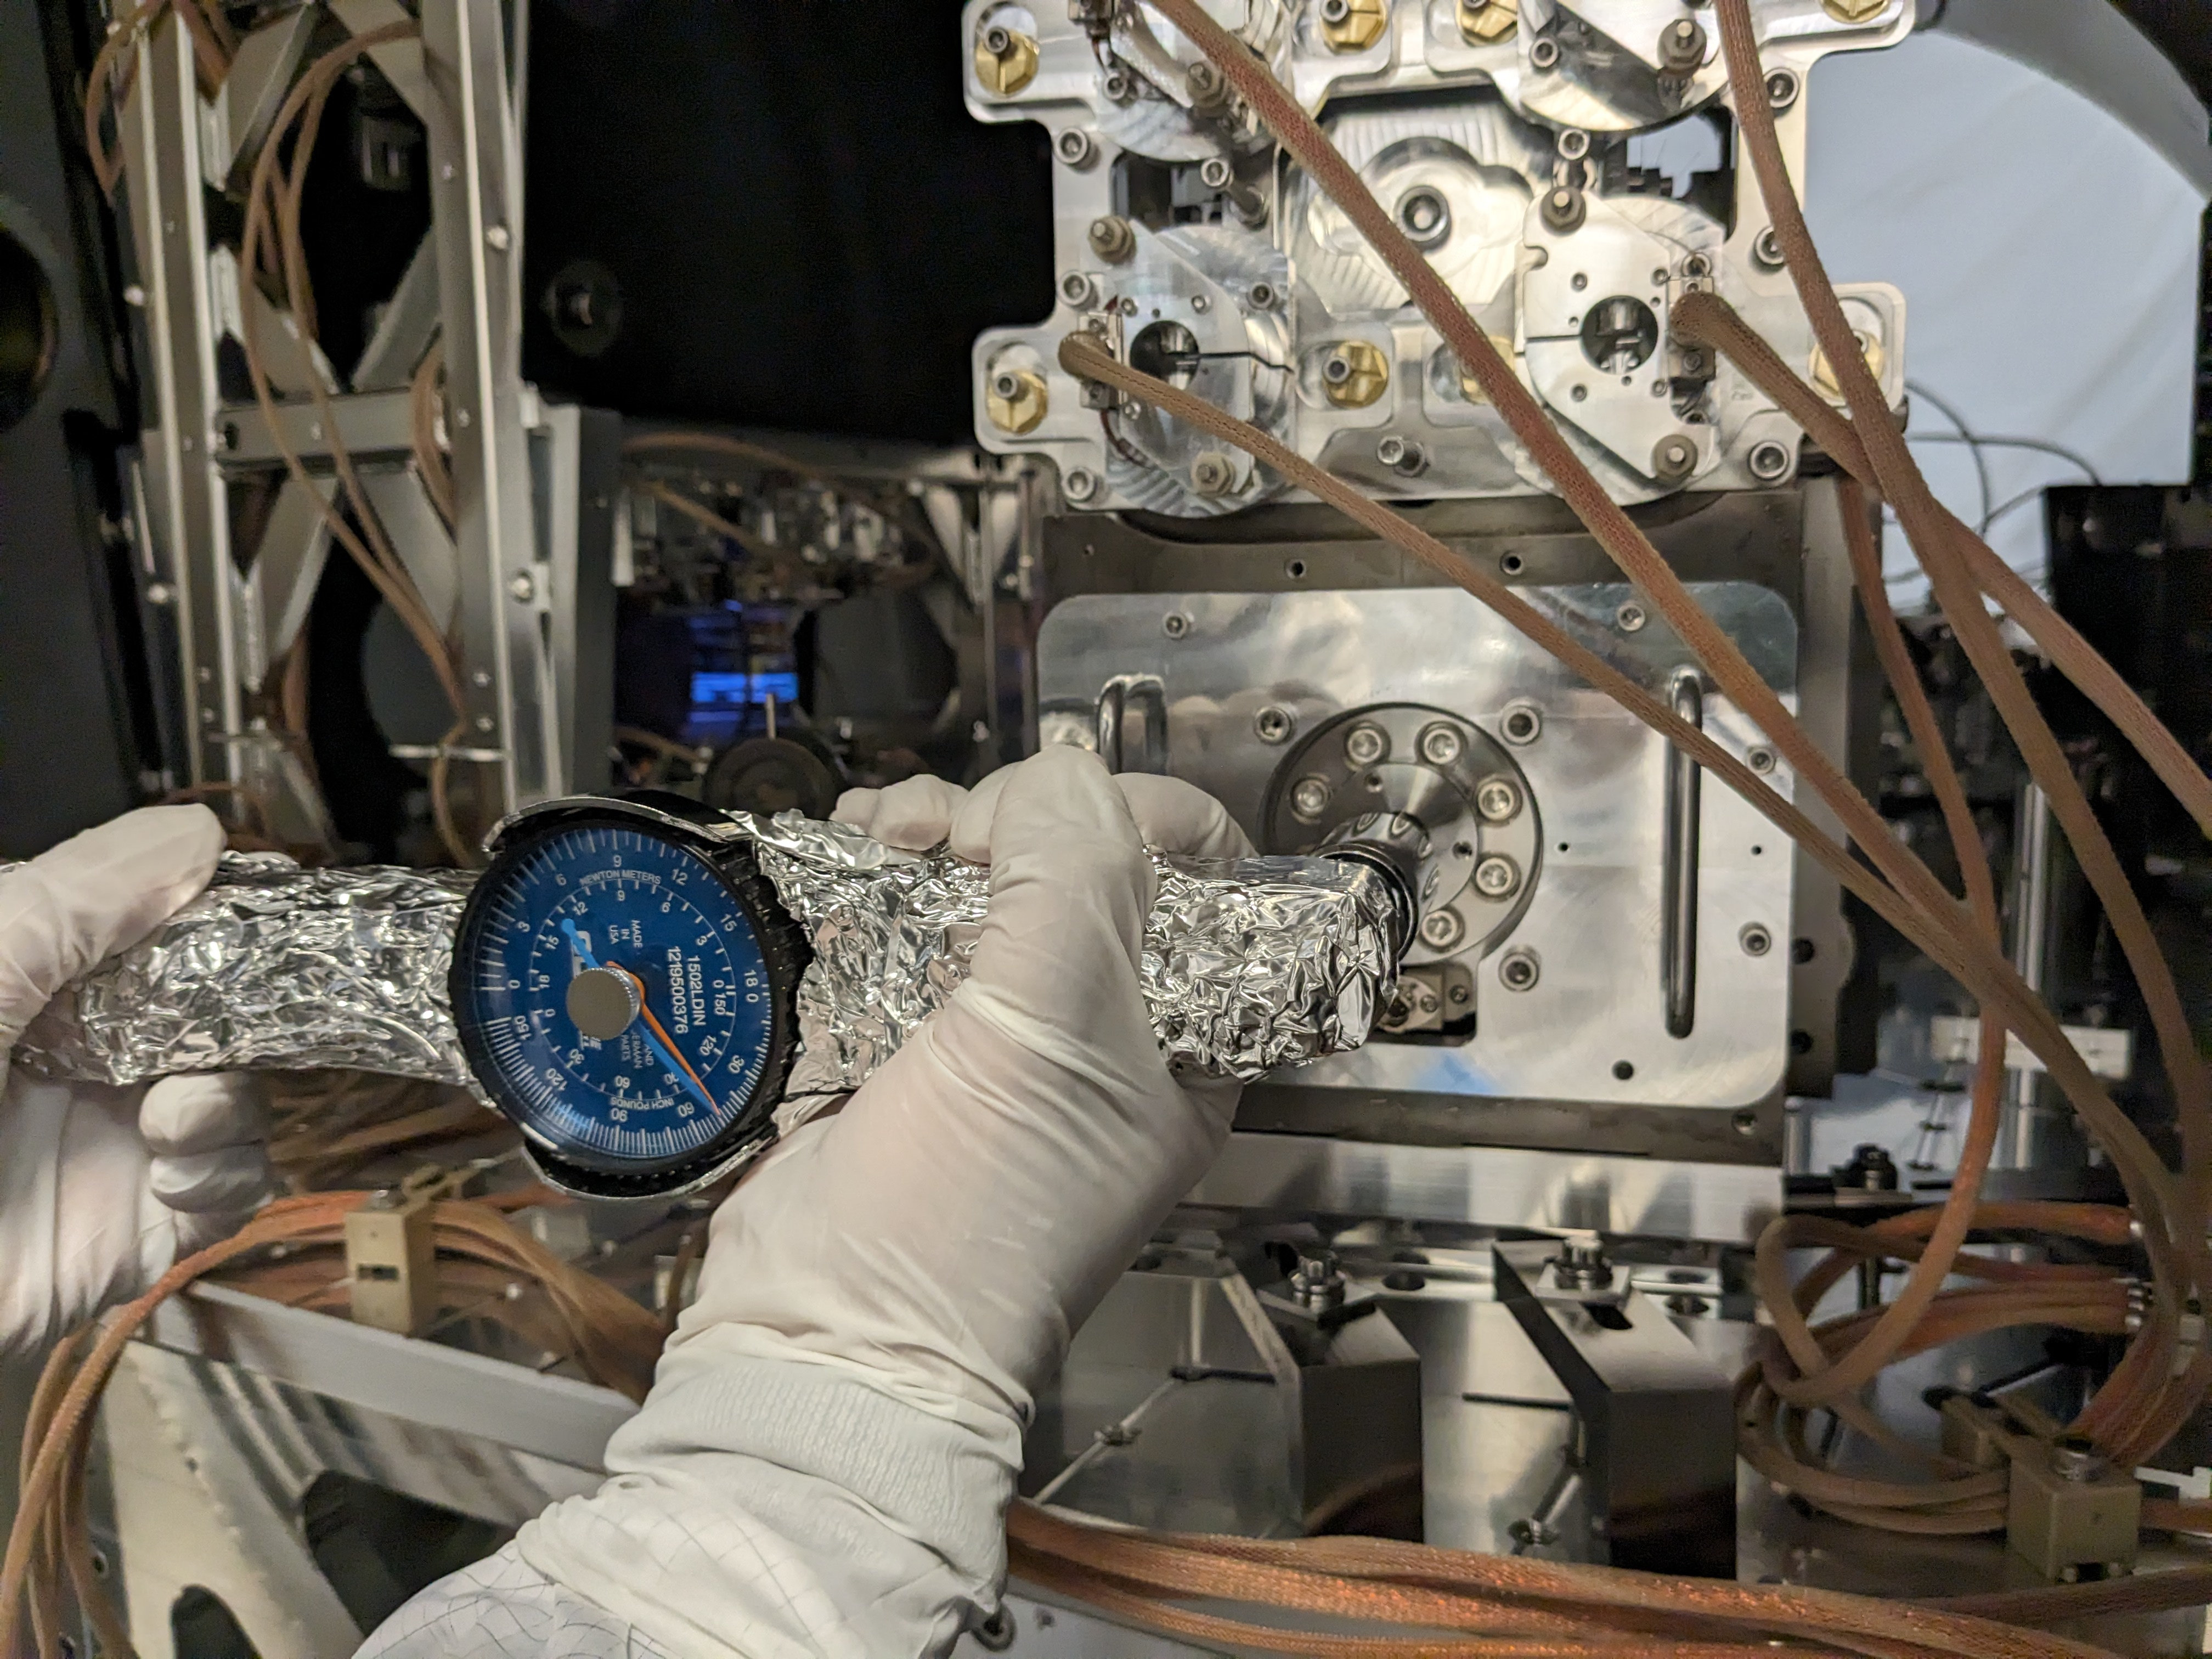
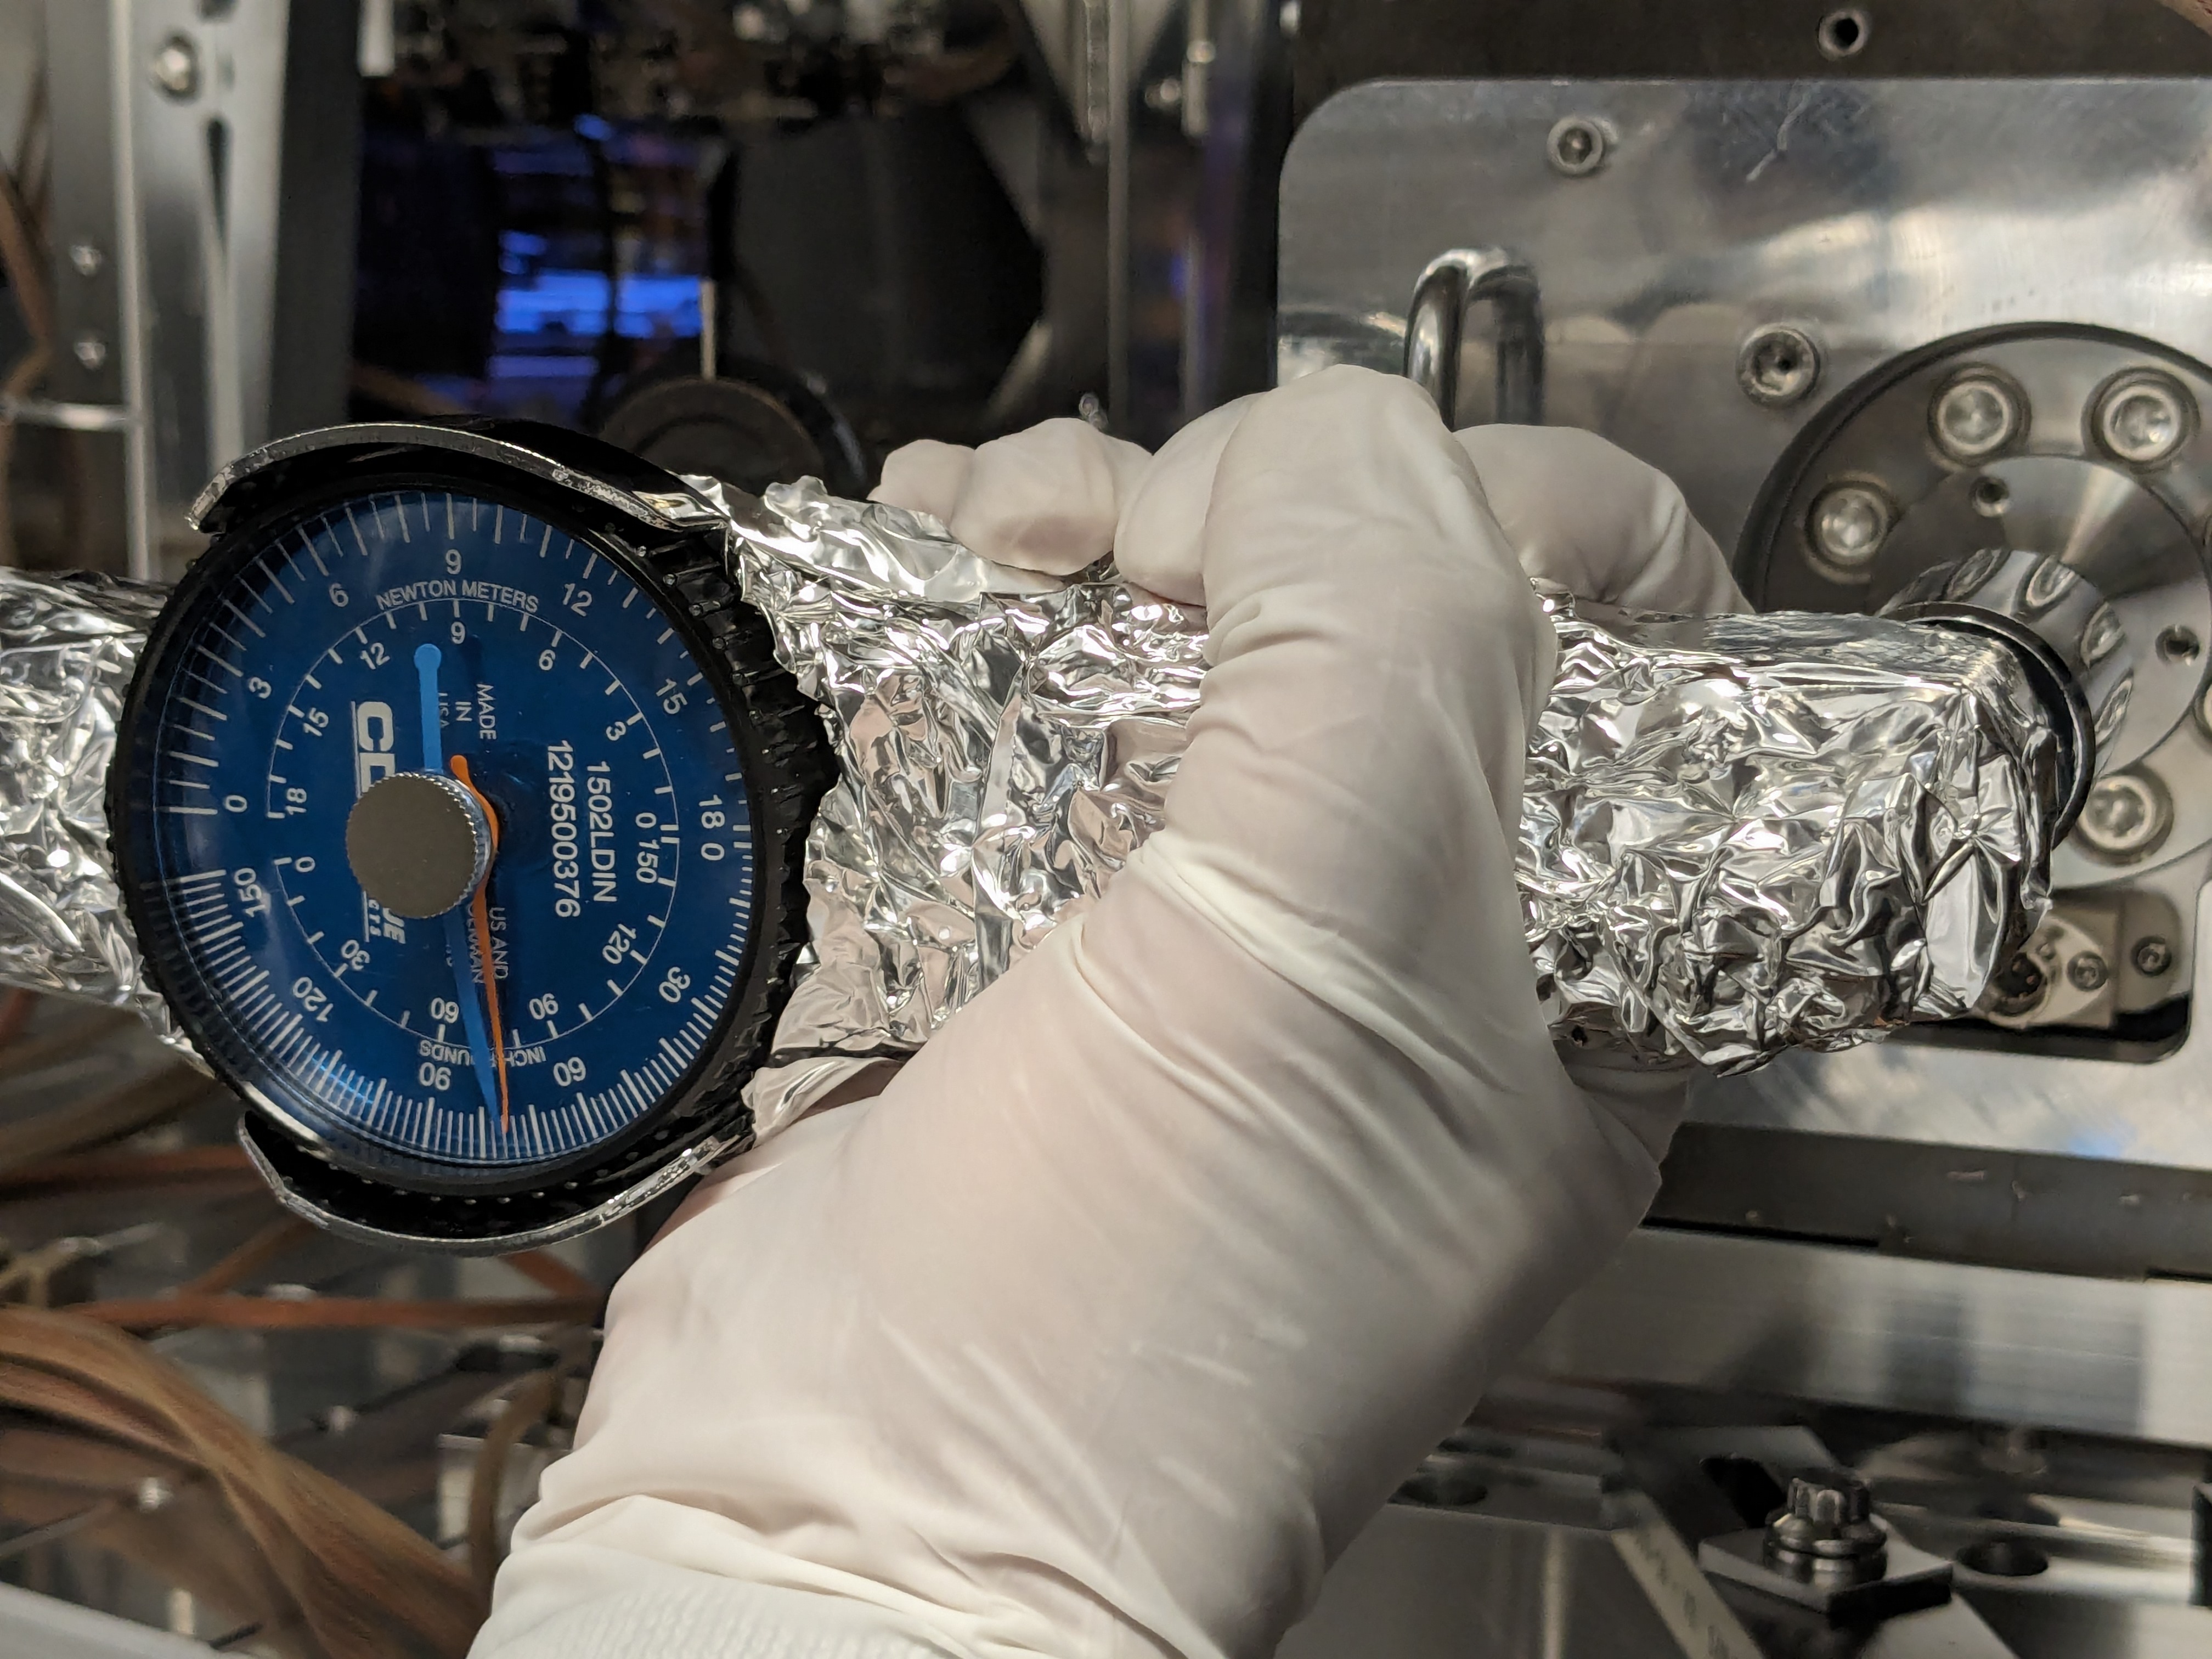
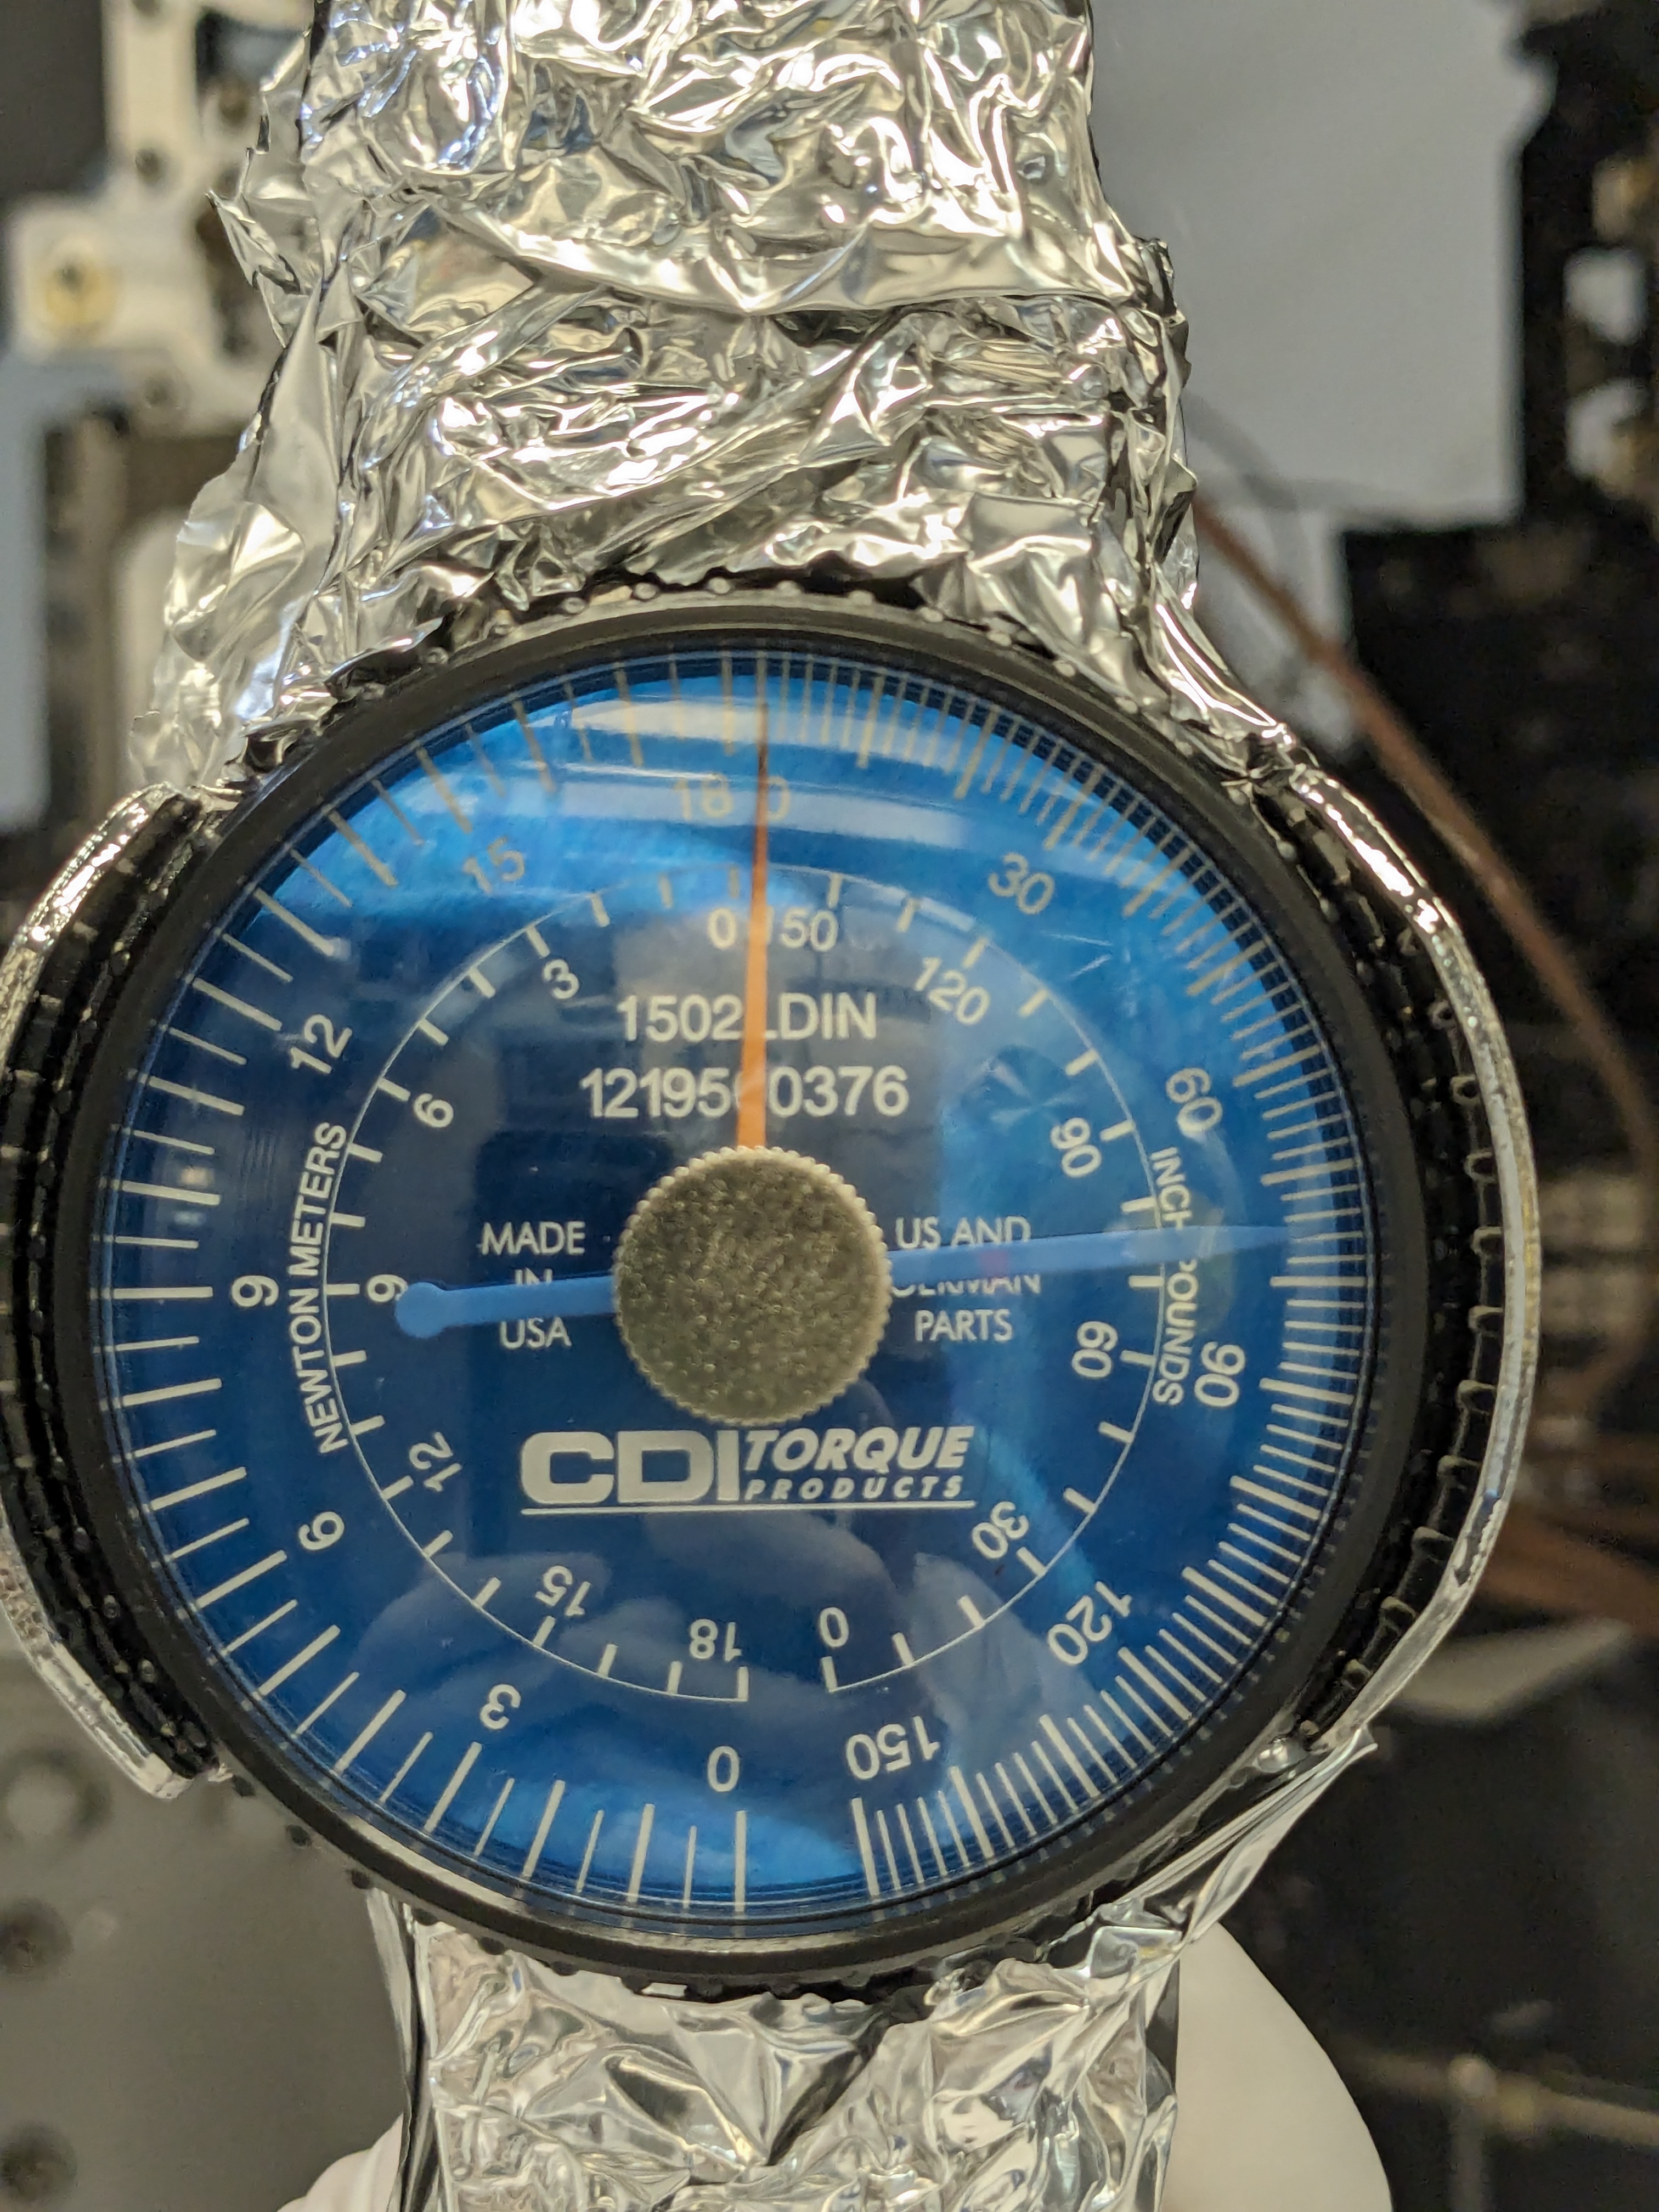
3rd image: Dial indicator on torque wrench showing torque that was applied to preloader (47 in lbs)
Images attached to this comment
camilla.compton@LIGO.ORG - 15:11, Wednesday 01 July 2026 (90861)

In 90859 we've used measurements to find the new ROC. 

H1 SUS (SUS)
rahul.kumar@LIGO.ORG - posted 14:01, Thursday 01 February 2024 - last comment - 15:11, Wednesday 01 July 2026(75677)
ZM4 (P-SAMS in HAM7) preload adjusted to change the radius of curvature of the mirror

Camille (CIT), Austin , Rahul

This morning we went to HAM7 chamber and changed the preload on ZM4 (P-SAMS) suspension as per the document E2300463_V1. This changed the RoC of ZM4 mirror without the PZT actuation. Given below are the details of our work - Camille will add pictures later on.

- After setting ZM4 into SAFE state we locked all three stages of the suspension. We had already taken healthy TF measurements before starting our work.

- The bottom mass cable was disconnected and carefully re-routed so that it stays away from the fixture plate.

- four add-on masses (basically 1/4-20 screws with washers) attached to the bottom mass was then removed.

- bottom mass Fixture plate (D2100121) was attached to the structure using six 8-32 screws.

- The bottom mass (already locked using EQ stops) was then further clamped using four 1/4-20 screws through the fixture plate. We had to adjust the height of the bottom mass to the align the threads with the holes on the fixture plate.

- Once the bottom mass was securely clamped, we removed the three set screws on the preloader.

- Using a torque wrench we increased the preload on the bottom mass by ~29 in.lb. (Total preload from torque after increase was 75 in.lb).

- We then followed all the above steps backwards (i.e set screws, add on mass put back, fixture plate removed, cable re-connected and the suspension set free).

- Once all done, we started damping the suspension and checked for any BOSEM flag changes - looked all fine.

- We took the transfer function measurements and ZM4 looked healthy.

Hence we took all the tools out and put the curtains back on HAM7 chamber.

Next, we will go into laser hazard with SQZ team and check for any changes in beam alignment and make adjustments as required.

Comments related to this report
camille.makarem@LIGO.ORG - 14:42, Thursday 01 February 2024 (75679)AWC
1st image: PSAMS locked in place with EQ stops.
2nd image: PSAMS locked with bottom mass fixture plate.
3rd image: Removal of set screws.
4th image: Preload adjustment with torque wrench.
5th image: Preload adjustment with torque wrench.
6th image: Torque wrench dial with the blue needle showing the total torque on the preloader (75 in lbs.)
Images attached to this comment
michael.zucker@LIGO.ORG - 08:21, Friday 02 February 2024 (75692)

Excellent! 

rahul.kumar@LIGO.ORG - 13:41, Friday 02 February 2024 (75710)SQZ, SUS

ZM5 offloaded as well, see LHO alog 75709.

sheila.dwyer@LIGO.ORG - 17:20, Friday 01 May 2026 (90092)

This is ZM4 SN1, so it's original charachterization data (before this preloading) is in E2100289, where with 0 V applied to the PZT the optical power is -106mD (or ROC is -18.877m).  

According to T2300426, changing the preloading changes the optical power by 2.4mD/in.lb.  So, after this preloading the optical power with 0V on the PZT should have been -36mD, or the ROC should be -55.5meters.  

sheila.dwyer@LIGO.ORG - 14:55, Tuesday 12 May 2026 (90213)

Evan and Camille noticed that I flipped a sign here:

The preloading should make the magnitude of the optical power larger, so it should be increased to -106mD - 2.4mD/in lb * 29 in lbs = -175.6 mD with 0 V on the PZT.  ROC = 1/-175.6e-3 = -11.4 meters

camilla.compton@LIGO.ORG - 15:11, Wednesday 01 July 2026 (90860)

In 90859 we've used measurements to find the new ROC. 

Displaying reports 821-840 of 89075.Go to page Start 38 39 40 41 42 43 44 45 46 End