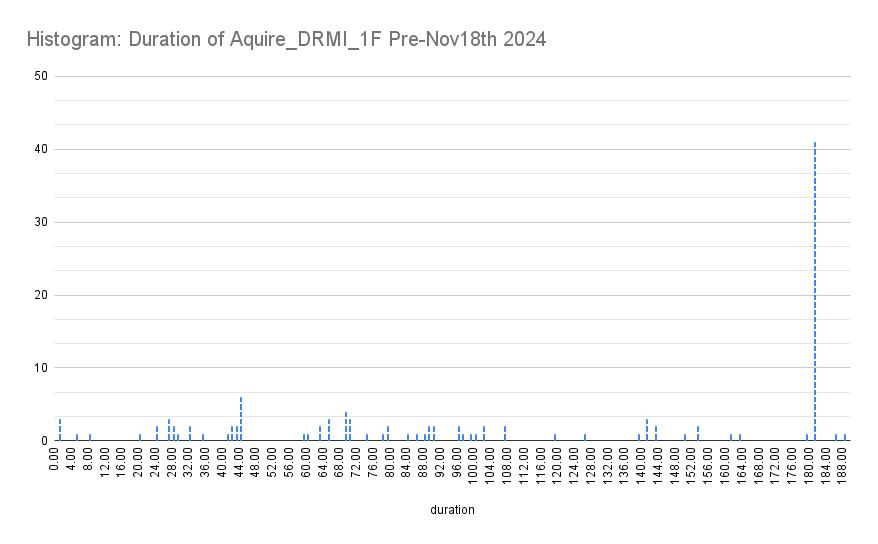
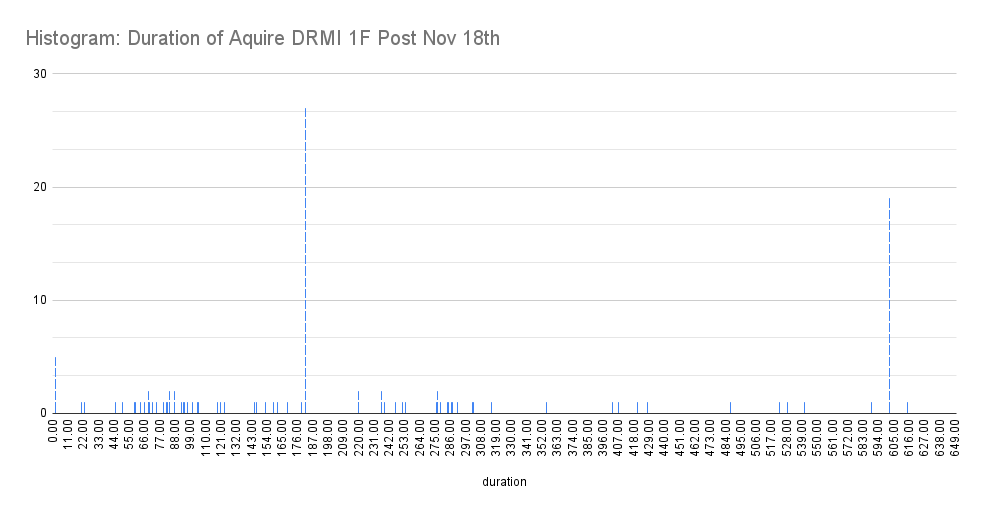
We've been seeing the FSS RefCav TPD signal dropping over recent weeks (not surprising for this time of year), so I went into the PSL enclosure this morning to tune up the FSS path alignment in advance of the holiday break.
To start, I attempted to touch up alignment into the PMC remotely using the picomotors right before it with the ISS off, but I wasn't able to get much of any improvement, so I turned the ISS back on and made my way out to the enclosure. Once there, I started with a power budget of the FSS path using the 3W-capable Ophir stick head:
- FSS In: 280.4 mW
- AOM In: 274.0 mW
- AOM Out (single-pass): 180.3 mW
- SP Diffraction Efficiency: 65.8%
- AOM Out (double-pass): 130.2 mW
- DP Diffraction Efficiency: 72.2%
- EOM Out: 129.2 mW
The largest (and least surprising) area of power loss I noticed was in the AOM diffraction efficiencies, so I started there. I adjusted the AOM stage itself, mostly in pitch, to improve the single-pass, and M21 to improve the double-pass. I also checked that the beam was passing nicely through the FSS EOM (it was, no adjustment needed here). The final power budget:
- FSS In: 280.4 mW
- AOM In: 274.0 mW
- AOM Out (single-pass): 195.9 mW
- SP Diffraction Efficiency: 71.4%
- AOM Out (double-pass): 139.5 mW
- DP Diffraction Efficiency: 71.2%
- EOM Out: 138.6 mW
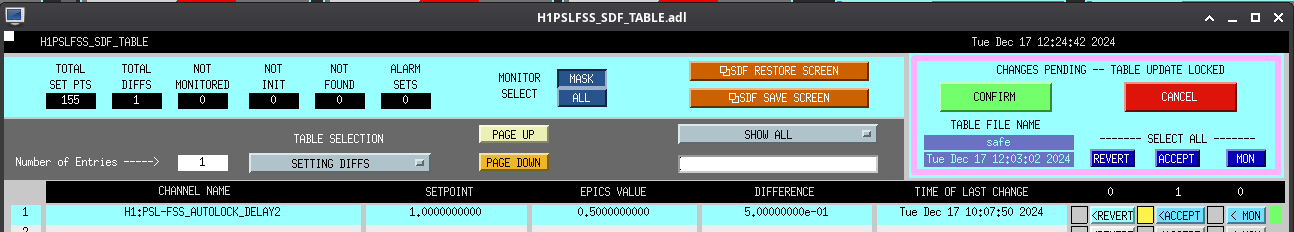
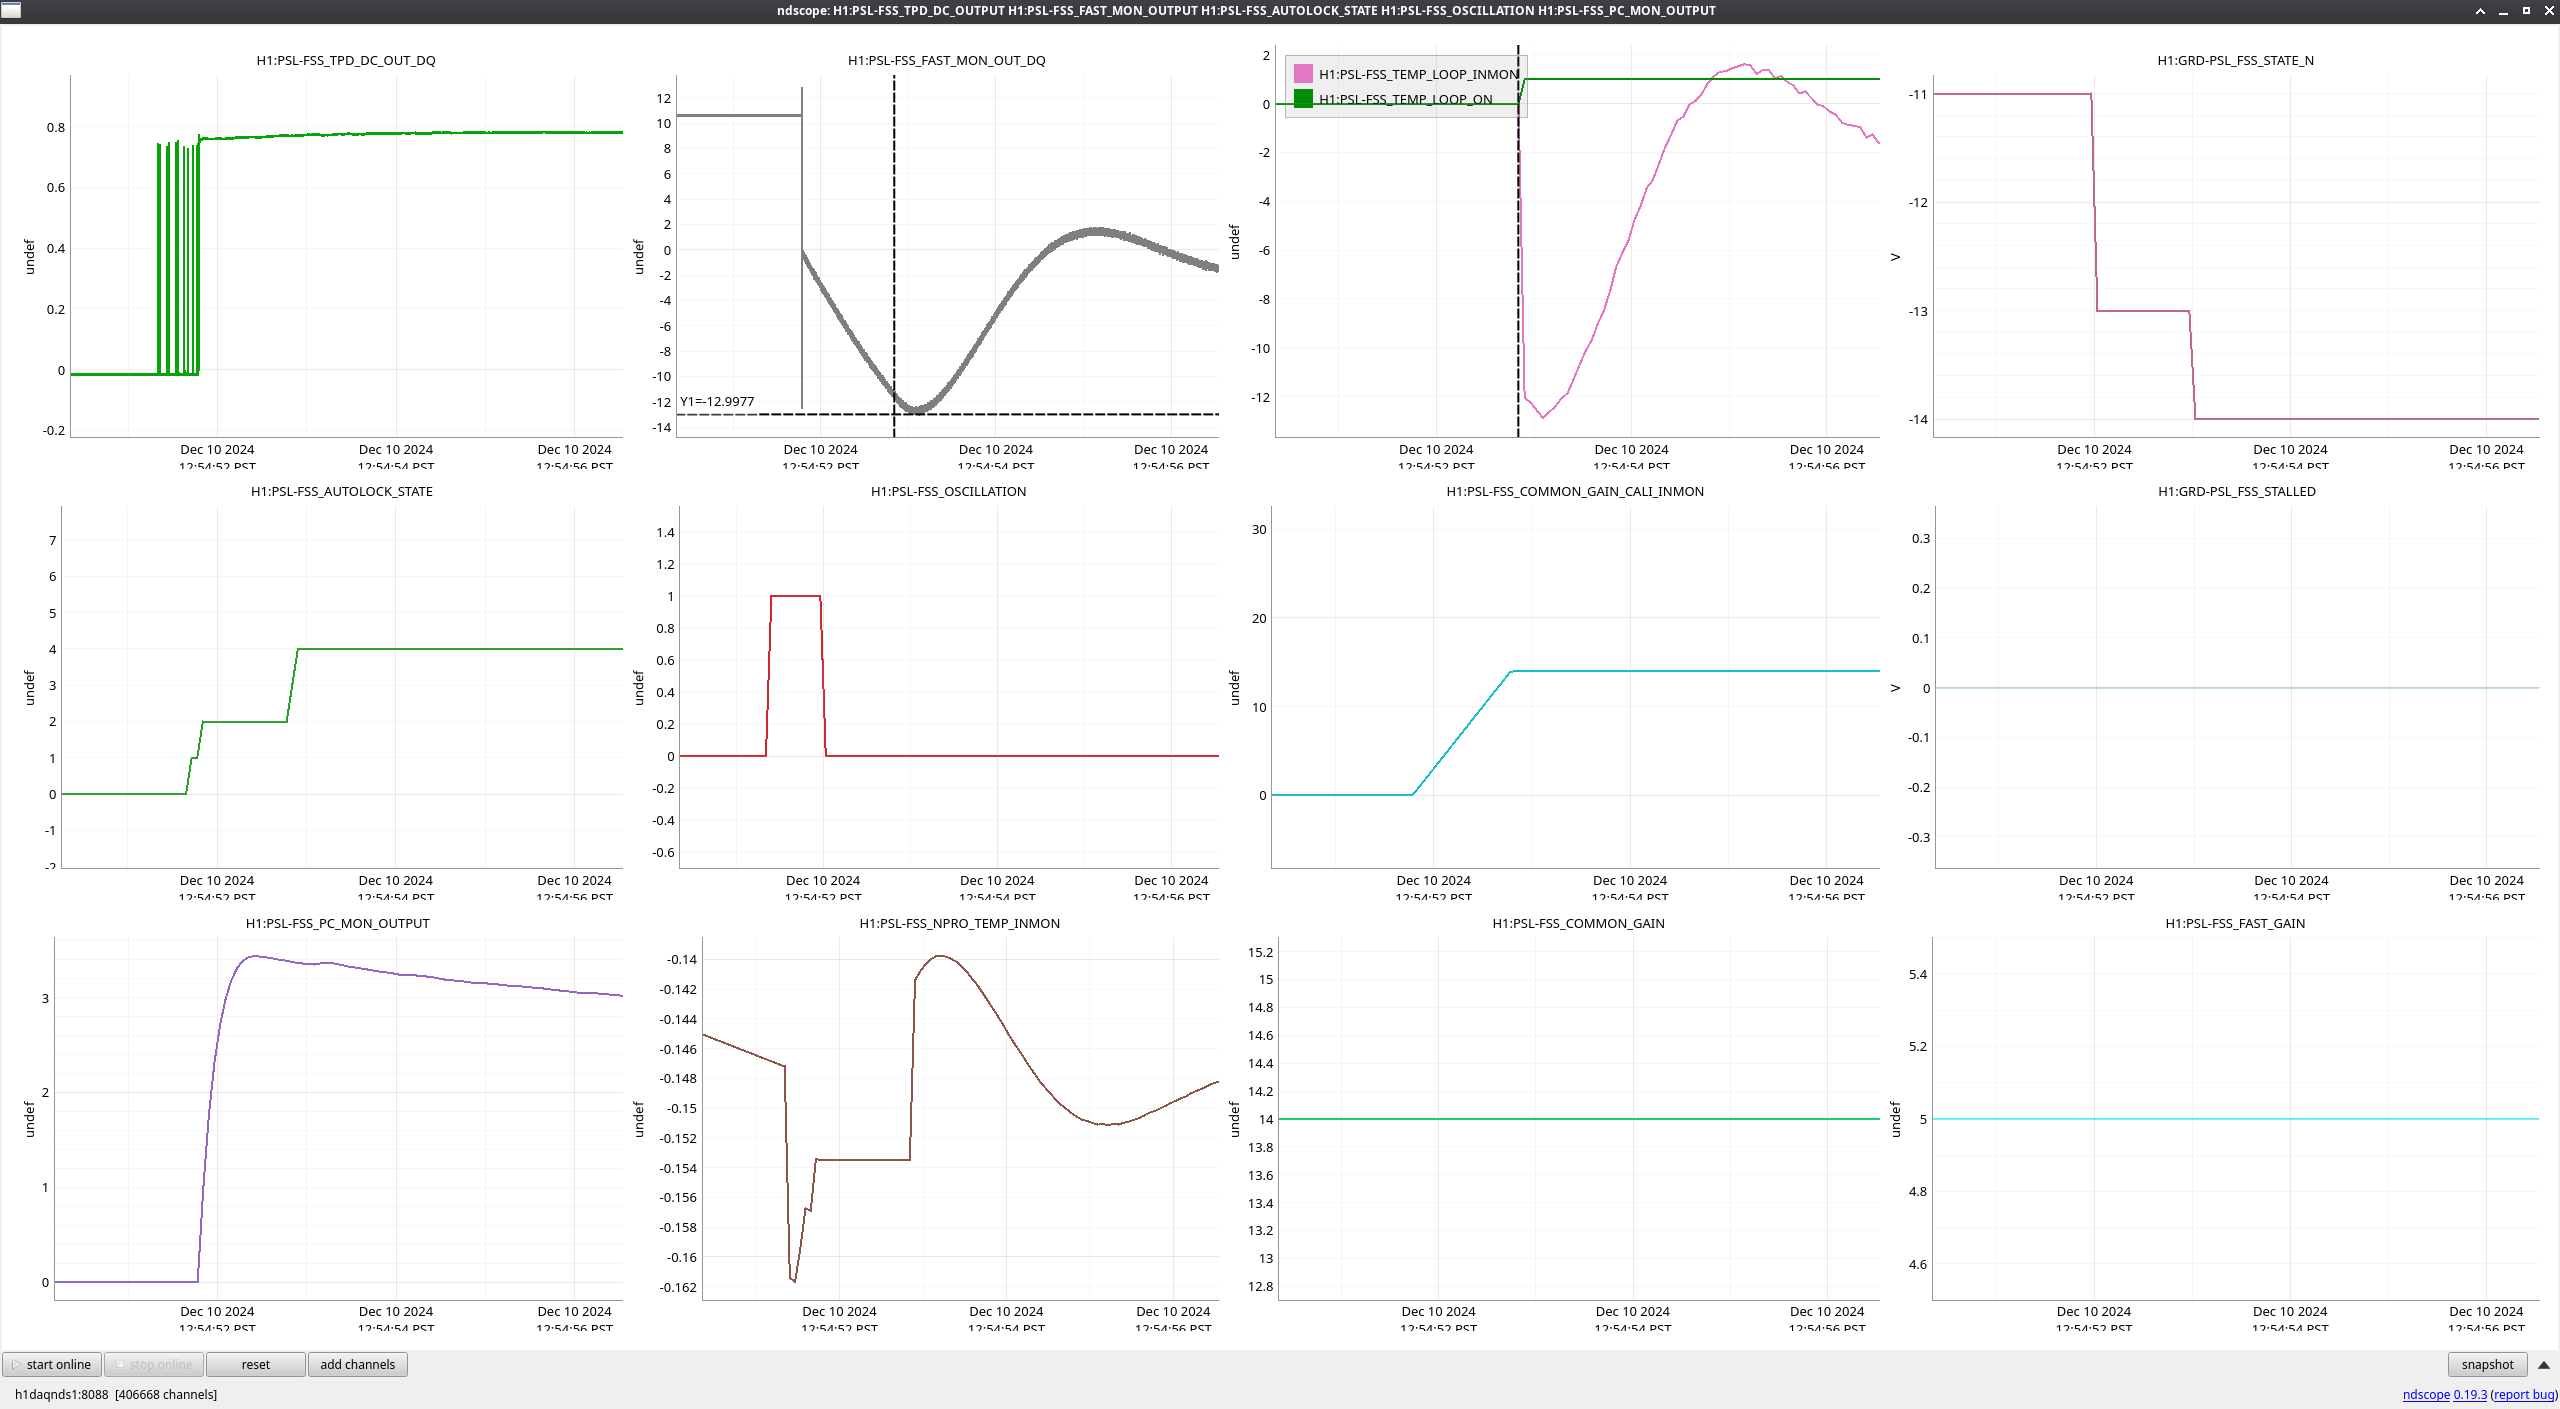
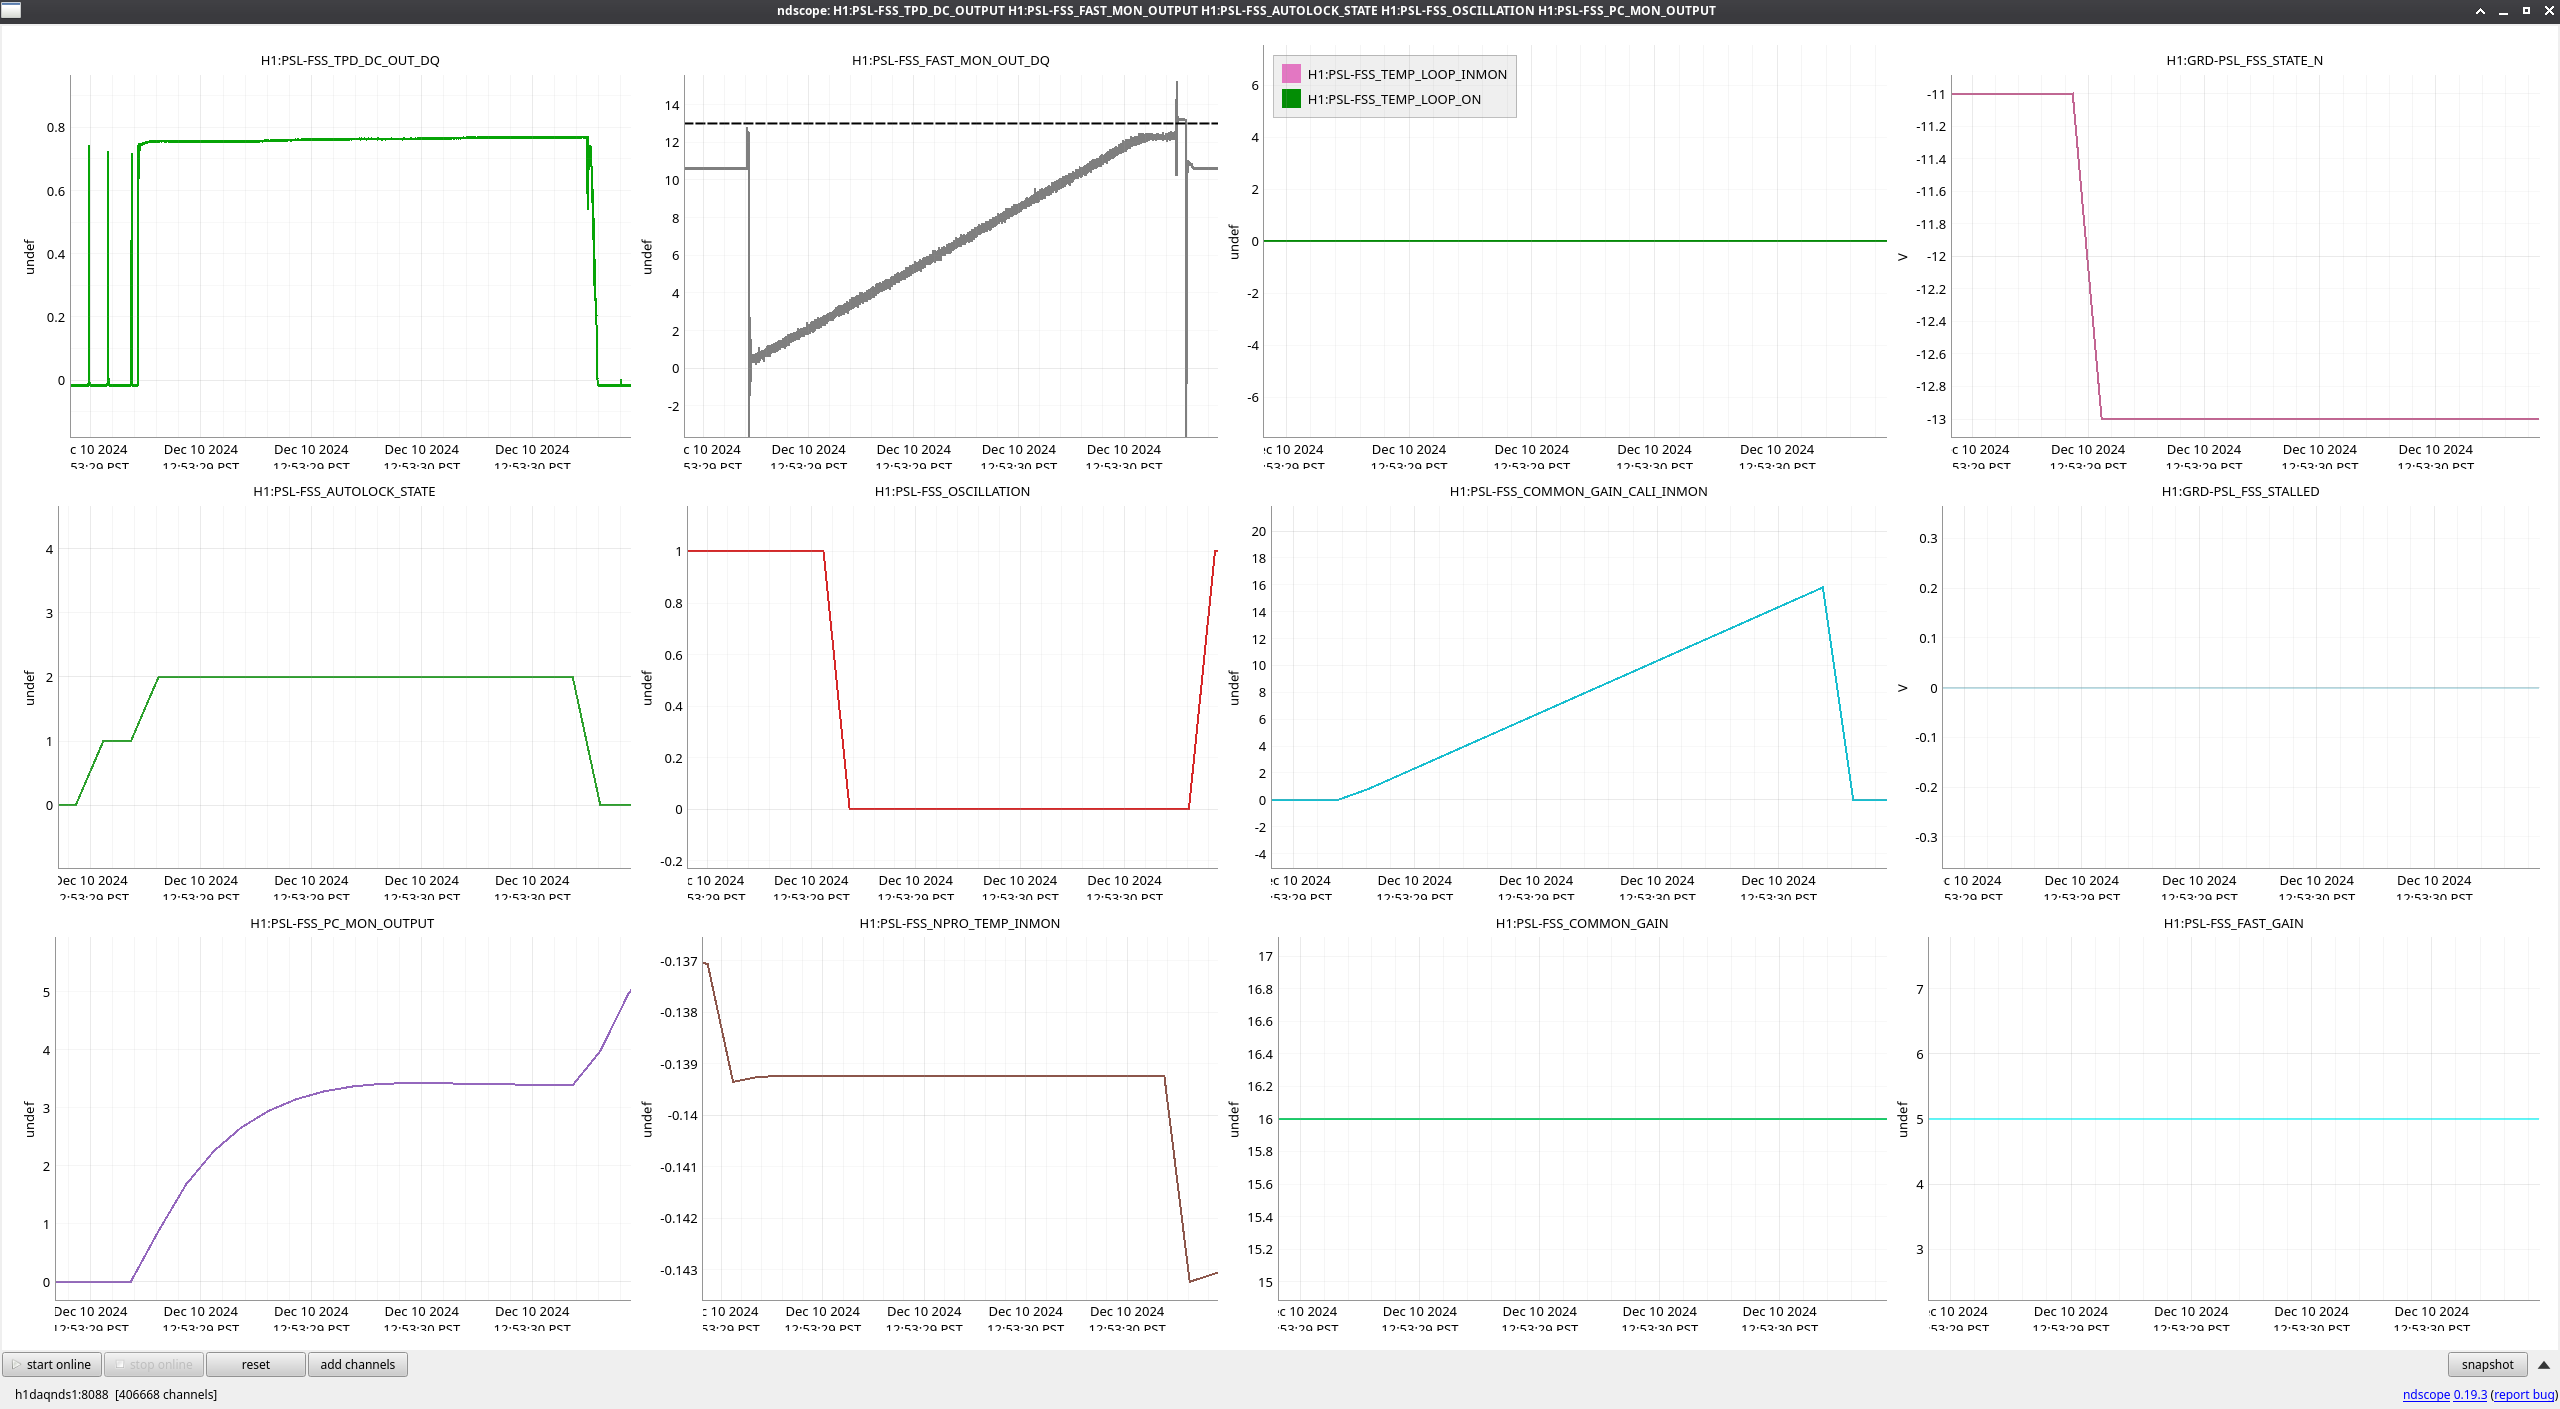
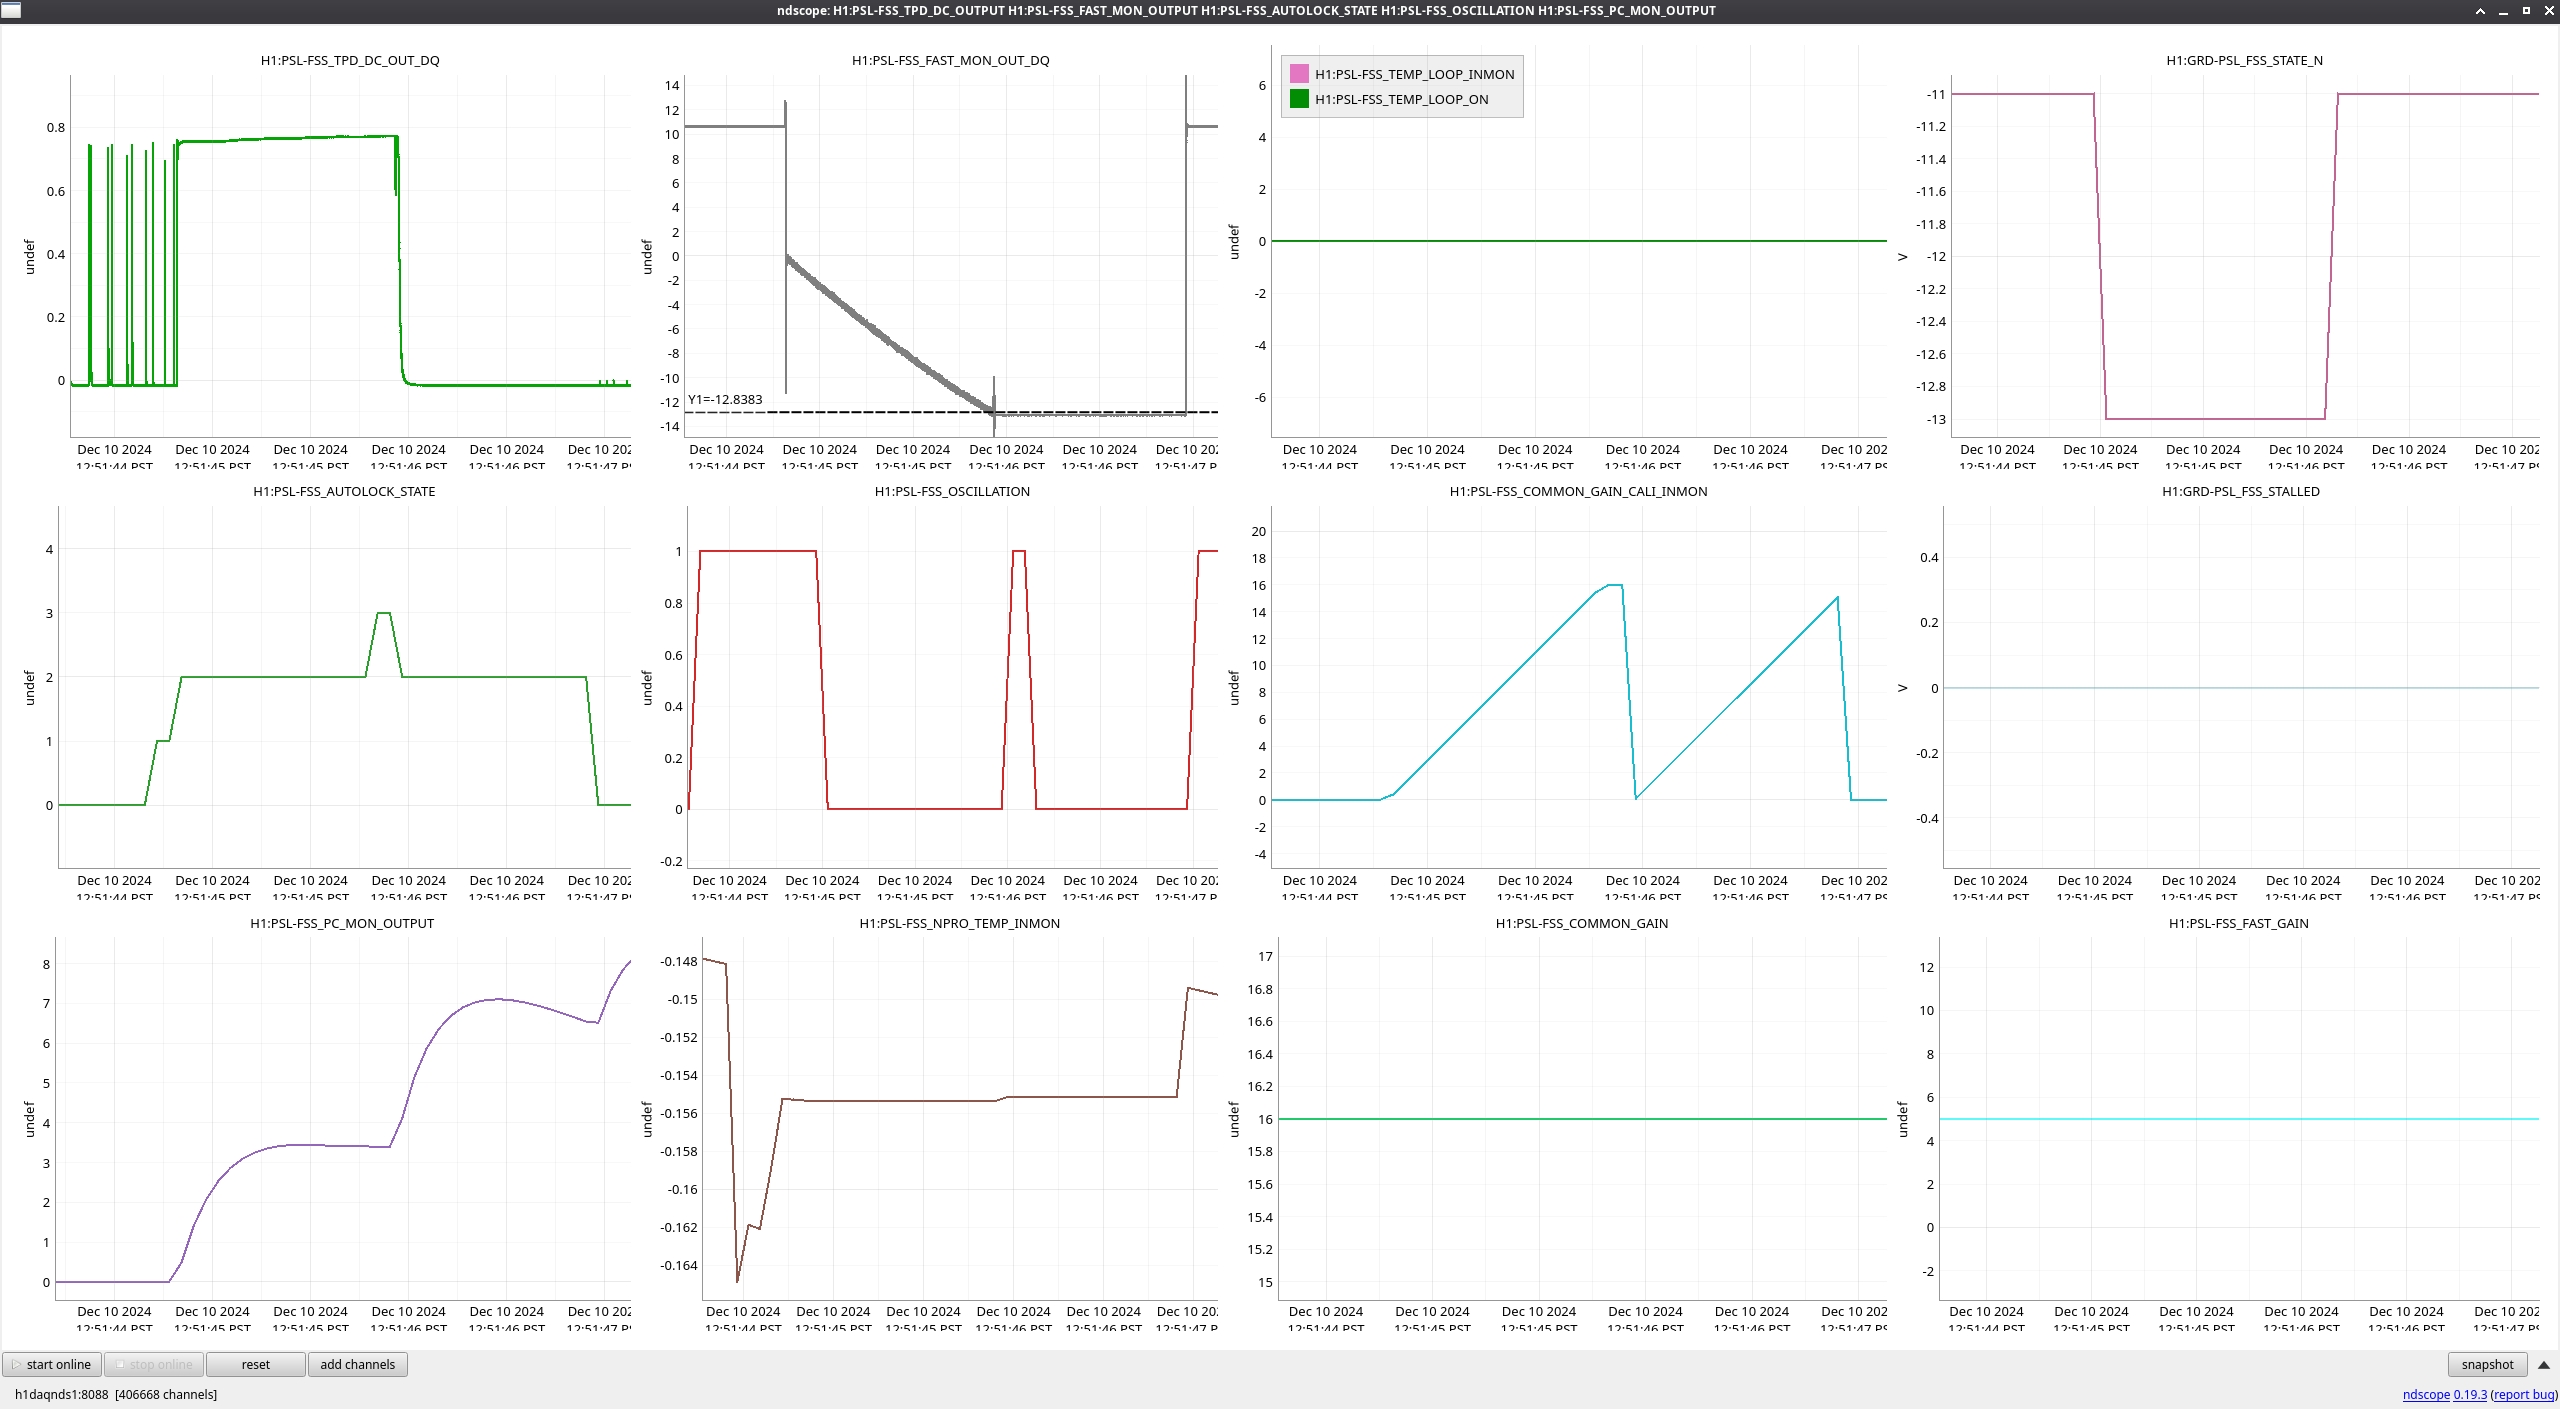
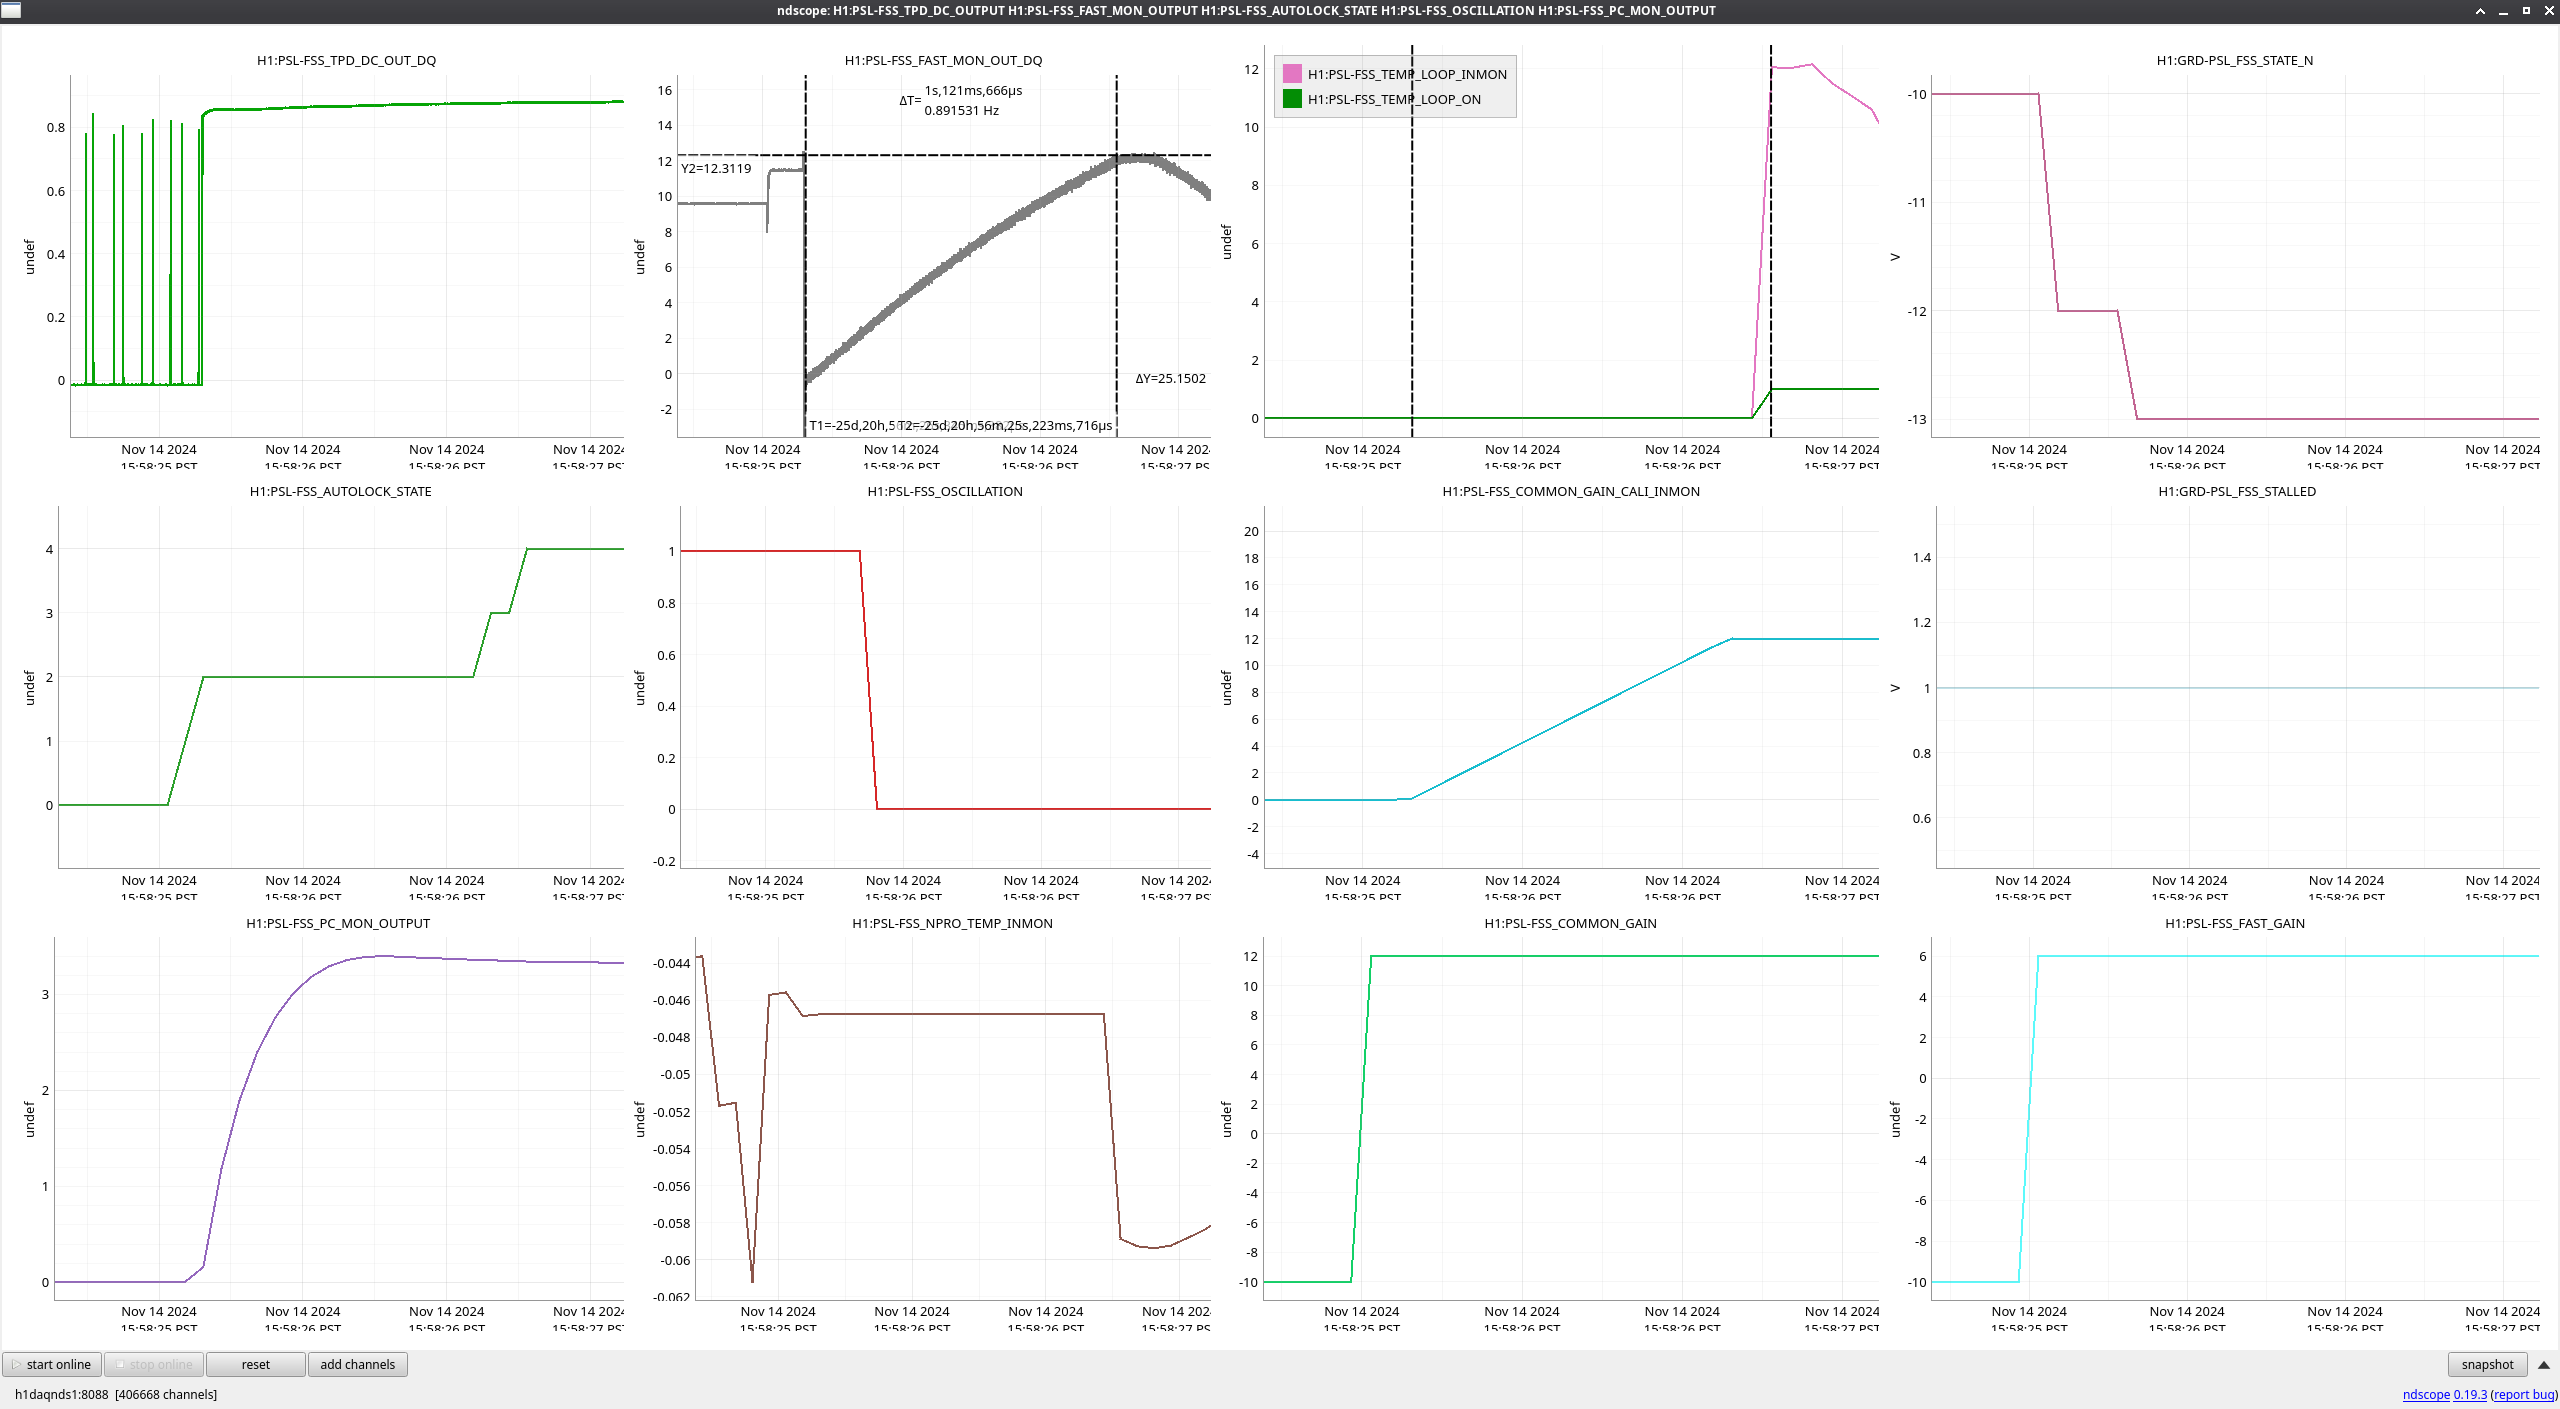
Having made good improvements, I proceeded to adjust M23 and M47, the picomotor-controlled mirrors before the RefCav, to align the beam back onto the alignment iris at the input of the RefCav. That done, I then instructed the FSS autolocker to lock the RefCav. As seen before and noted most explicitly in alog81780, the autolocker could briefly grab the TEM00 mode but then lose it. I lowered the autolocker's State 2 delay (which determines how long to wait before turning on the temperature control loop after finding resonance) from 1.0 seconds to 0.5, and the autolocker was immediately successful. I've accepted this shorter delay time in SDF; screenshot attached. The TPD was reporting a signal of 0.515 V with the RefCav locked, so I used the pictomotors to improve alignment, finishing with a TPD signal of 0.830 V.
Seeing the beam spot on the RefCav REFL camera was now more than half out of view, I rotated the camera in its mount slightly to center the image. I then unlocked the FSS and used M25 to tweak up the alignment onto the RFPD, improving the voltage when using a multimeter from 0.370 V to 1.139 V, then locked the FSS again to get an RFPD voltage of 0.213 V. This gives a visibility of the RefCav of 81.3%. I wrapped up in the enclosure, turned the environmental controls back to science mode, and returned to the control room. After about an hour while maintenance activities were finishing, I turned the ISS back on; currently diffracting around 3.3%.
This closes WP 12250.


