Displaying reports 8421-8440 of 87917.Go to page Start 418 419 420 421 422 423 424 425 426 End
Reports until 10:29, Tuesday 17 December 2024
H1 TCS
camilla.compton@LIGO.ORG - posted 10:29, Tuesday 17 December 2024 - last comment - 10:52, Wednesday 08 January 2025(81863)
CO2 Lasers Spectrum Locked vs Unlocked

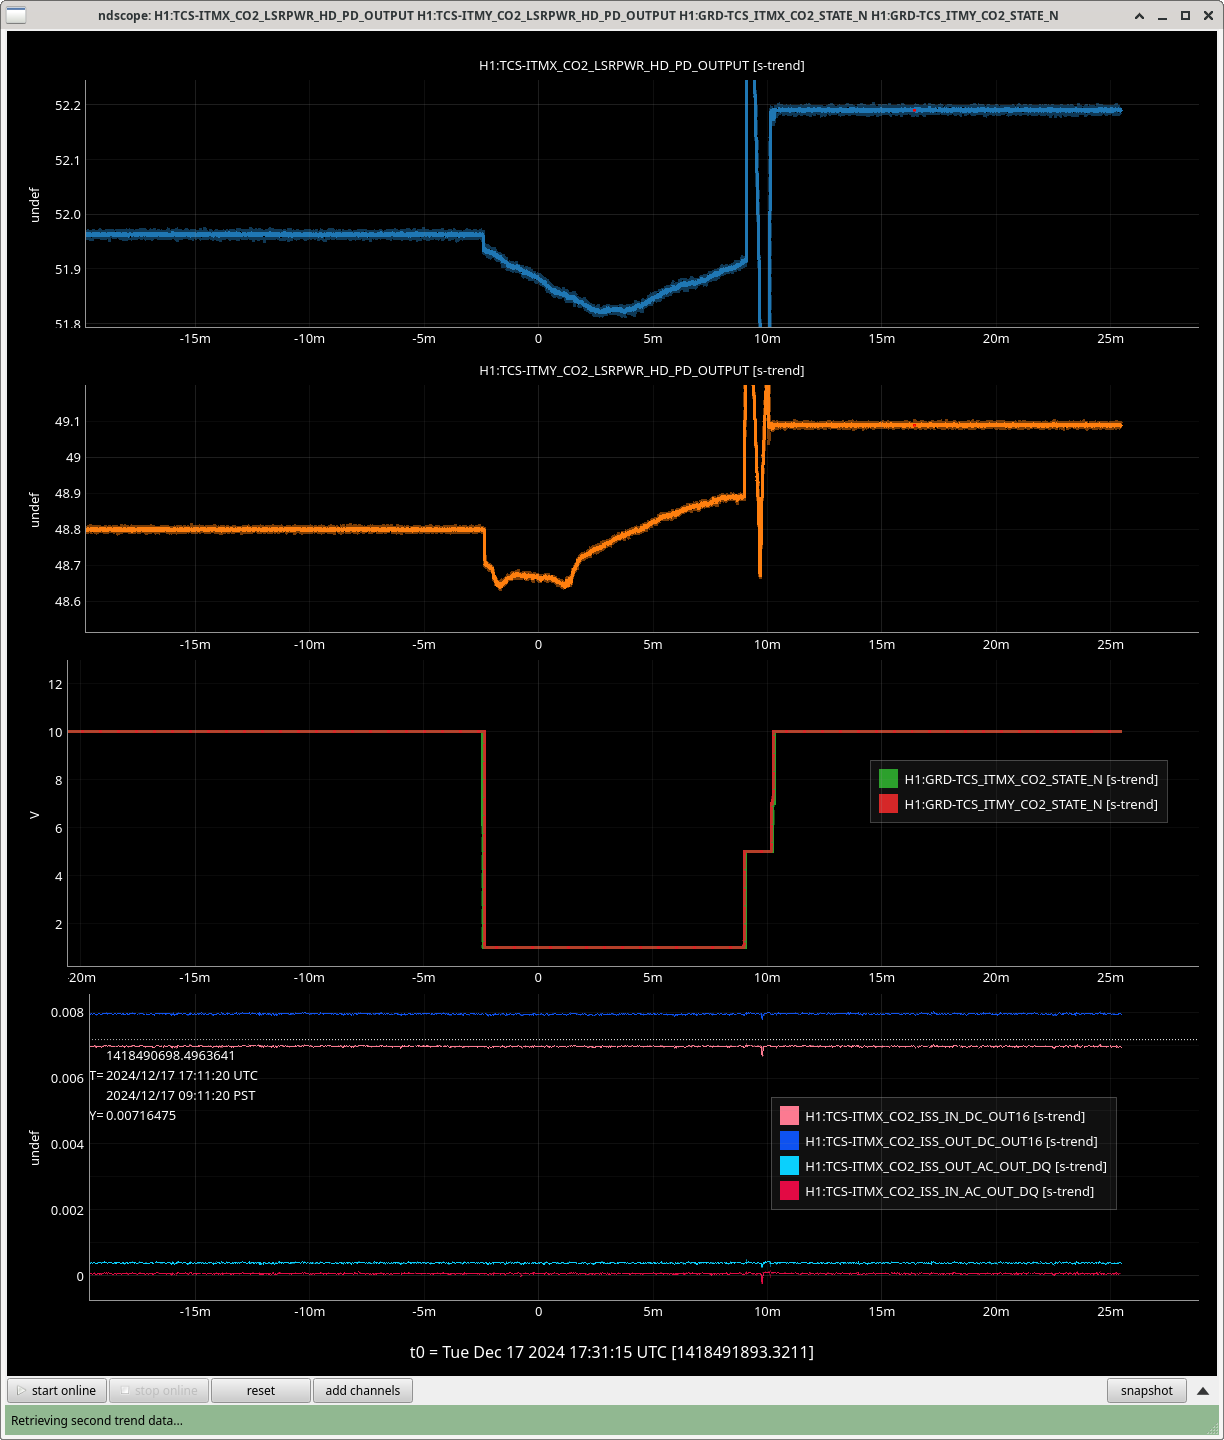
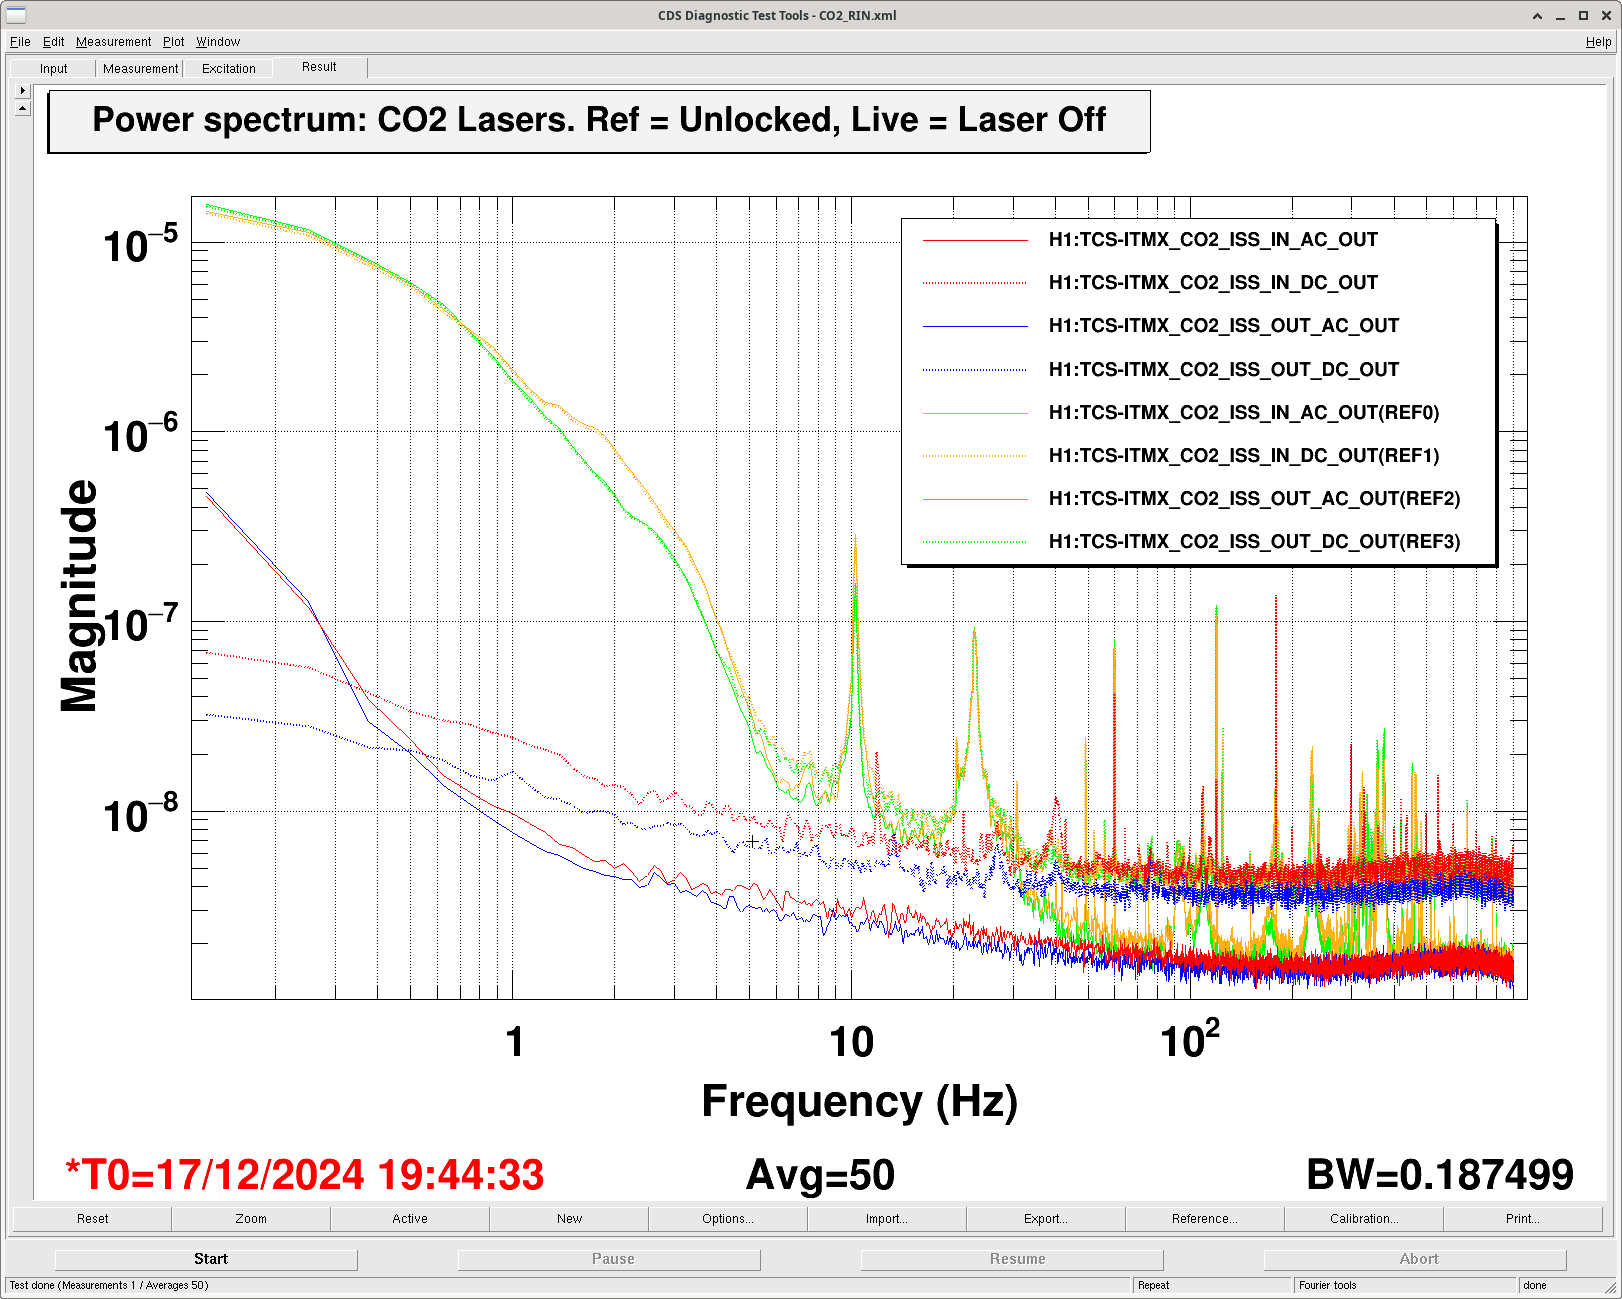
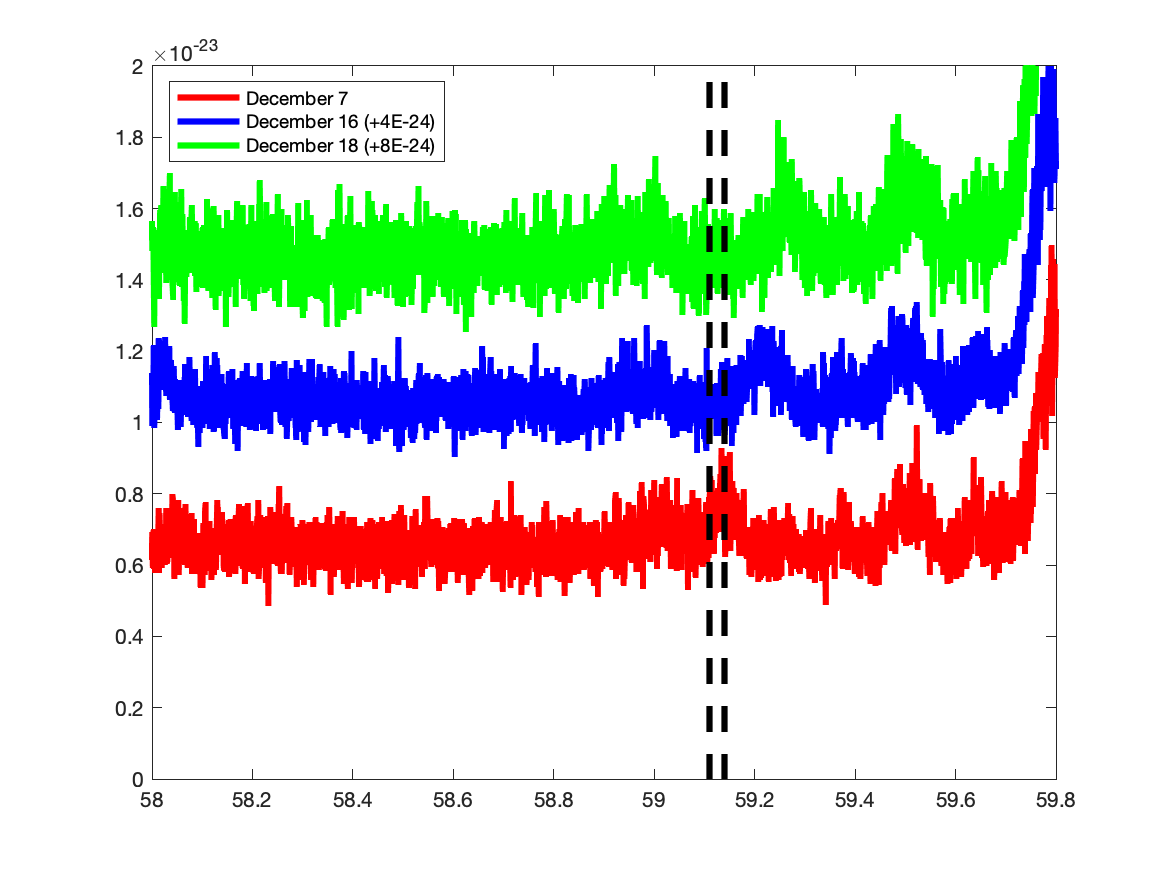
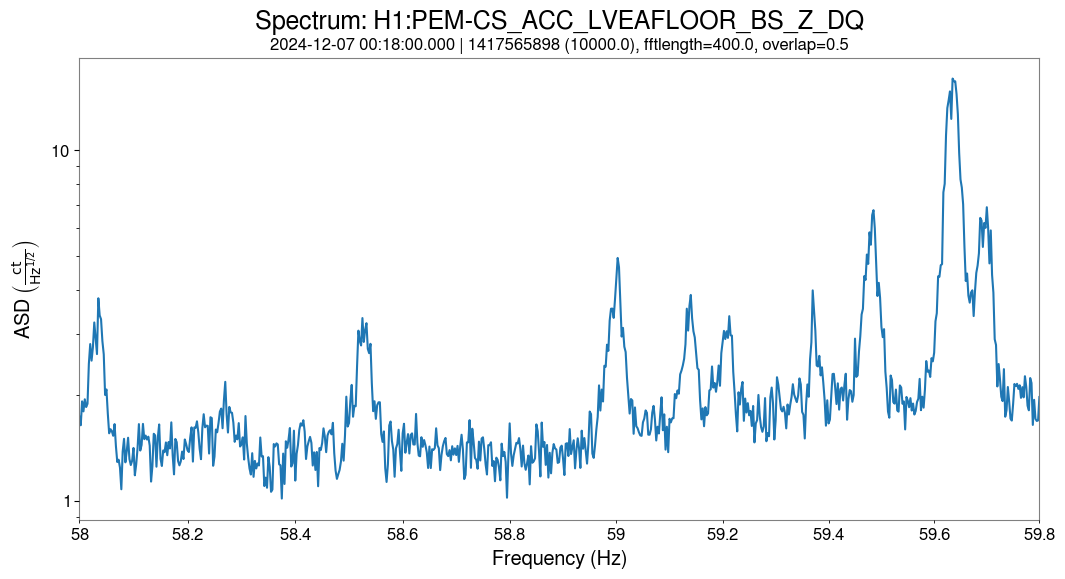
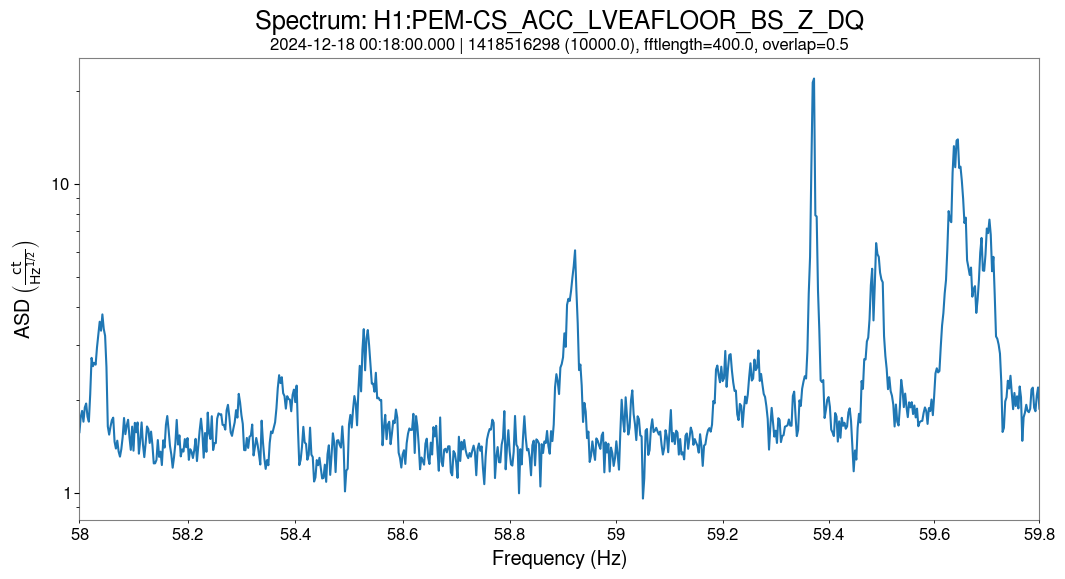
Looked at the spectum of th 50W CO2 lasers on the fast VIGO PVM 10.6 ISS detectors when the CO2 is locked (using the laser's PZT) and unlocked/ free running: time series attached. Small differences <6Hz, see spectrum attached. 

The filter banks suggest that the _OUT signals used have been converted from counts to volts and de-whitened. Looking at the spectrum 50Hz -1kHz and using the DC level of 7e-3, we get  a RIN of 4.5e-9 / 7e-3 = 6 x 10⁻⁷.
This is better than the L5L free running RIN of 10-5 at 100Hz and 10-6 at 1kHz measured in CIT#389
Images attached to this report
Comments related to this report
camilla.compton@LIGO.ORG - 12:20, Wednesday 18 December 2024 (81868)

Gabriele, Camilla.

We are not sure if this measurement makes sense. 

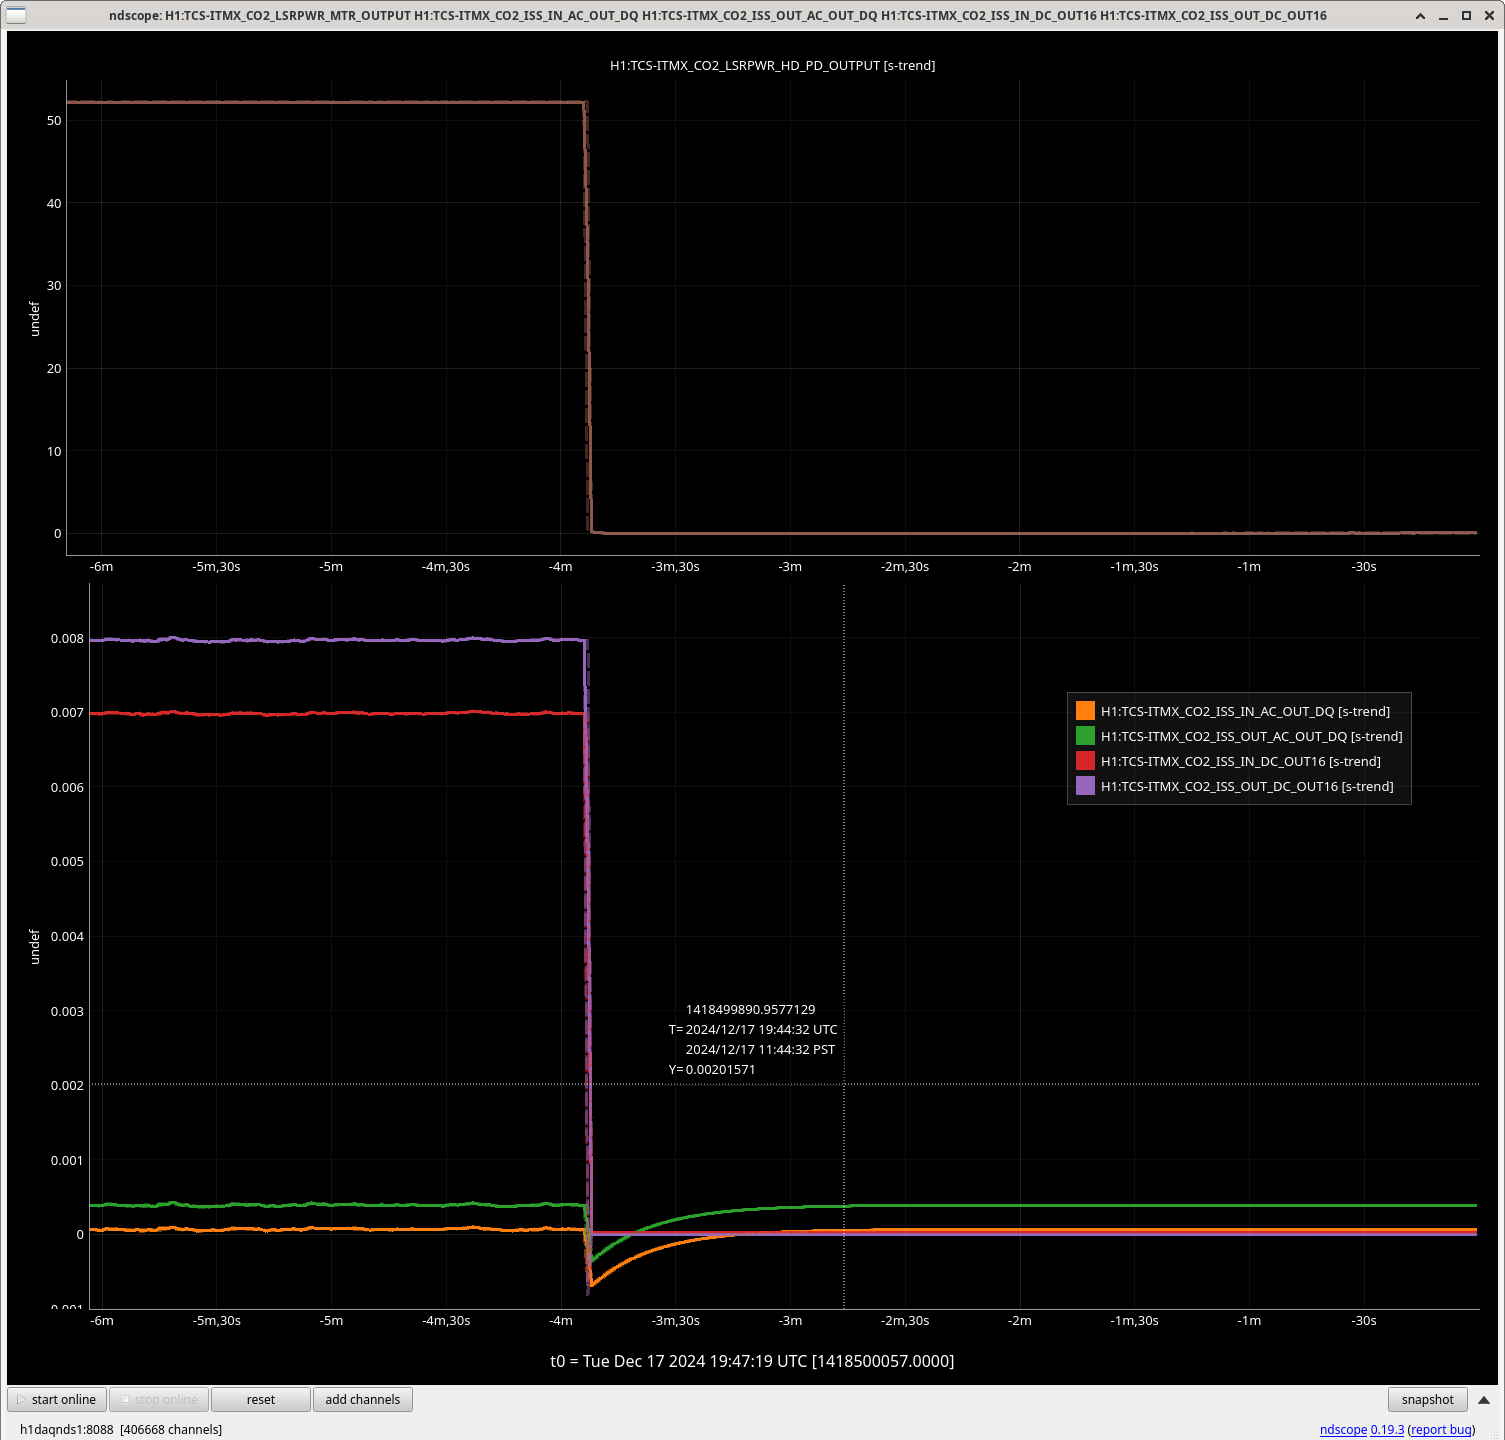
Attached is the same spectrum with the CO2X laser turned off to see the dark noise. It appears that measurement is limited to dark noise of the diode above 40Hz. The ITMX_CO2_ISS_IN_AC channel dark noise is actually above the level when the laser is on, this doesn't make sense to me. 

  • Is there anything strange happening in models or chassis? No.
    • The filters in the DC _OUT channels include a CountstoVolts gain(0.000610352) and UndoGain gain(0.00196078) which is 1/510 from the PD electronics D1201111 as expected
    • The AC _OUT channel includes a CountstoVolts gain(0.000610352) and de-whiten zpk([20], [0.01], 0.011322, "n").
    • There is nothing else in the h1hsccs model.
    • Looking at the TCS block diagram E1100892, the ISS PD outputs go though the TCS ISS and Interface Chassis D1300649 (D1300015 shows there nothing happening to the signals inside this chassis), before going to the ADC. So the model should see the signals as if they were coming straight from the PD DB9 output + counts to volts gain. 
  • Does DC value of 7e-3 V make sense? Yes.
    • In CIT#389 saw saw -1V (DCMON so gain of 255) for 60mW of laser power (can jump ~by a factor of 2 dependent on wavelength/polarization/how the laser is feeling). From this, expect 1mV from diode (before electronics gain) is 15mW of laser power. So that the DC value measured of 7e-3 V would be around 100mW of power on the PD (within a factor of 2 is 50mW to 200mW). This makes sense as we would expect around 250mW on the ISS PD (50W out of laser x 99/1 BS x 50/50 BS).
  • Does Dark noise value make sense: Unsure.
    • In CIT#541, Gabriele shows DC dark noise values of 4e-7 /rHz, this is straight out of the diode (DCMON so x gain of 255) so the comparable value to our _OUT channels would be 1.5e-9 /rHz. This is a factor of 3 different from the 5e-9/rHz dark value we measure at LHO on the DC OUT.
    • Debatable math: The power noise of the diode is 1e-8 W/rHz (from Keita's computations attached to CIT#549). So the RIN should be noise-limited to 1e-8 W/rHz / 0.250W = 4e-8 /rHz. We are measuring down to 5e-9/rHz on the DC channel which is a factor of 10 lower than expected possible
Images attached to this comment
camilla.compton@LIGO.ORG - 10:52, Wednesday 08 January 2025 (82181)

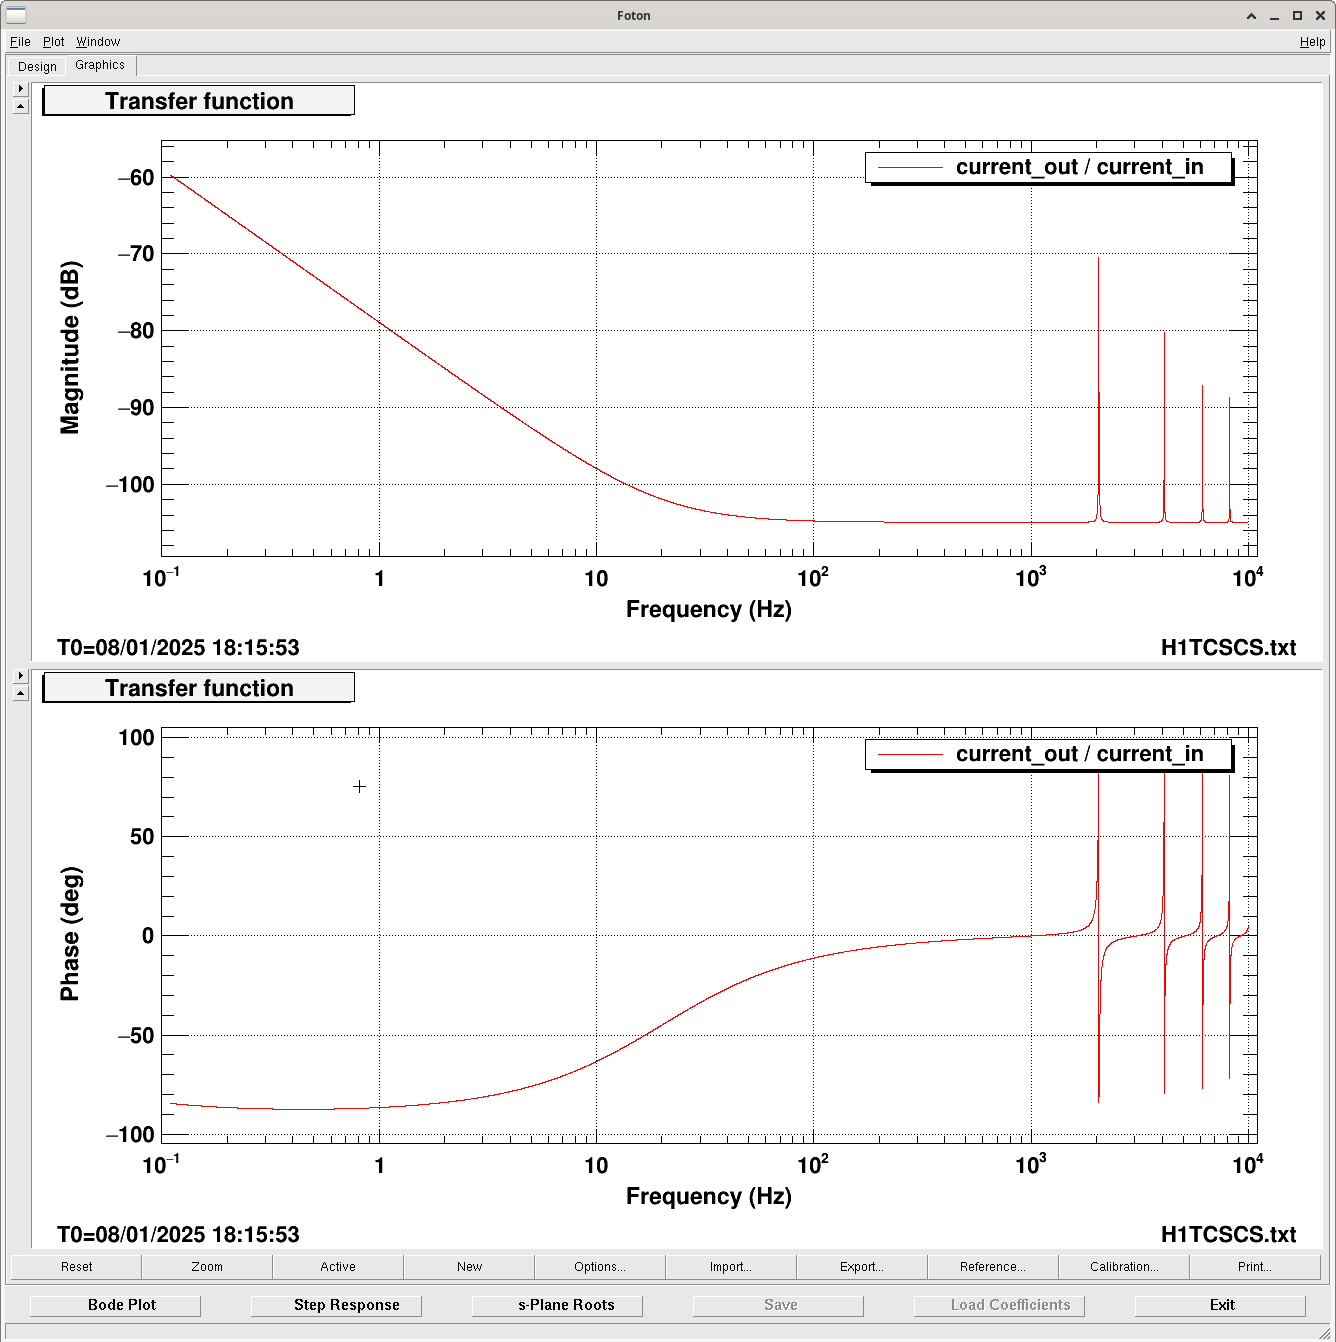
Gabriele and I checked that the H1:TCS-ITM{X,Y}_CO2_ISS_{IN/OUT}_AC filter: de-whiten zpk([20], [0.01], 0.011322, "n"), is as expected from the PD electronics D1201111, undoing the gain of 105dB with the turning point around 20Hz, foton bode plot attached.

This means that both the AC and DC outputs should be the voltage out of the photodetector before the electronics, where the PD shunt resistance was measured to be 66 Ohms.

Images attached to this comment
LHO VE
david.barker@LIGO.ORG - posted 10:08, Tuesday 17 December 2024 (81864)
Tue CP1 Fill

Tue Dec 17 10:02:58 2024 INFO: Fill completed in 2min 56secs

Quick fill, coincident with dewar filling.

Images attached to this report
H1 General (Lockloss)
camilla.compton@LIGO.ORG - posted 08:45, Tuesday 17 December 2024 (81862)
Range drop before lockloss at 11:34UTC could have been due to unknown glitches

Ryan S noticed that the range drop before the lockloss at 11:34UTC could be related to the glitches we've been seeing as Omicron sees similar glitches screenshot. DARM looks worse 30-100Hz plot.

Besfreo the lockloss we see a 26-28Hz wobble in DARM (not in the other LSC loops) plot.

Images attached to this report
H1 General
camilla.compton@LIGO.ORG - posted 07:37, Tuesday 17 December 2024 (81861)
OPS TUES Day Shift Start

TITLE: 12/17 Day Shift: 1530-0030 UTC (0730-1630 PST), all times posted in UTC
STATE of H1: Preventive Maintenance
OUTGOING OPERATOR: Oli
CURRENT ENVIRONMENT:
    SEI_ENV state: CALM
    Wind: 3mph Gusts, 2mph 3min avg
    Primary useism: 0.03 μm/s
    Secondary useism: 0.39 μm/s
QUICK SUMMARY:

IFO re-locked itself twice overnight and is currently running magnetic injections before we start maintenance activities.

Slight strangeness that the IFO mode was in "relocking" H1:ODC-OBSERVATORY_MODE = 21 when I arrived.

LHO General
ibrahim.abouelfettouh@LIGO.ORG - posted 22:00, Monday 16 December 2024 (81860)
OPS Eve Shift Summary

TITLE: 12/17 Eve Shift: 0030-0600 UTC (1630-2200 PST), all times posted in UTC
STATE of H1: Earthquake
INCOMING OPERATOR: Oli
SHIFT SUMMARY:
LOG:

IFO is in INITIAL_ALIGNMENT and ENVIRONMENT

Still recovering from the 7.4 EQ today in Vanuatu. After this, there were many 5+ Mag aftershocks and our primary microseism is still above the 0.1 line. We briefly left EQ mode for 5 or so minutes before another earthquake (Atlantic Ocean this time) caused us to reactivate.

I began locking at 05:22 UTC and managed to get to PRMI but had no flashes. A few minutes later, another EQ hit and we lost lock. At this point, I started initial alignment. I believe IFO will be able to lock very soon since seismic conditions are coming down quickly.

Lockloss Alog 81859

Other:

As the pacific plate shook, Robert took the time to conclude his viewport work, meaning we are capable of transitioning to LASER SAFE once again. I have informed the morning operator independently too.

H1 PEM (Lockloss)
ibrahim.abouelfettouh@LIGO.ORG - posted 18:07, Monday 16 December 2024 (81859)
Lockloss 01:58 UTC

Interesting LL that happened between the detection of a 7.4 mag EQ but before any picket fence or STS detection. So I don't think it's EQ caused but seems suspicious. Either way, we're riding out a huge EQ right now and will attempt locking afterwards.

LHO General
corey.gray@LIGO.ORG - posted 16:32, Monday 16 December 2024 (81841)
Mon DAY Ops Summary

TITLE: 12/16 Day Shift: 1530-0030 UTC (0730-1630 PST), all times posted in UTC
STATE of H1: Observing at 157Mpc
INCOMING OPERATOR: Ibrahim
SHIFT SUMMARY:

Today H1 has been locked the entire shift (over 18hrs!) with the main activity being H1 out of Observing for the Monday Commissioning work (which went 30min over for the period of 1630-2006utc).

Microseism has mostly been flat just under the 95th percentile.
LOG:

Vacuum Prep's Dust Monitor (H1:PEM-CS_DUST_LAB2) continues to alarm on the Alarm Handler (white/invalid alarm) & comes up as NOT OK/Error on the Dust_Monitor script check.

H1 SEI
oli.patane@LIGO.ORG - posted 16:18, Monday 16 December 2024 (81857)
ISI CPS Noise Spectra Check Weekly FAMIS

Closes FAMIS#26020, last checked 81715

Things to note:

Non-image files attached to this report
LHO General
ibrahim.abouelfettouh@LIGO.ORG - posted 15:59, Monday 16 December 2024 (81856)
OPS Eve Shift Start

TITLE: 12/16 Eve Shift: 0030-0600 UTC (1630-2200 PST), all times posted in UTC
STATE of H1: Observing at 158Mpc
OUTGOING OPERATOR: Corey
CURRENT ENVIRONMENT:
    SEI_ENV state: CALM
    Wind: 4mph Gusts, 2mph 3min avg
    Primary useism: 0.02 μm/s
    Secondary useism: 0.36 μm/s
QUICK SUMMARY:

IFO is in NLN and OBSERVING as of 6:34 UTC (17hr 30 min lock!)

Environment looks good.


H1 SUS
oli.patane@LIGO.ORG - posted 13:09, Monday 16 December 2024 (81853)
Checking last large earthquake to confirm no acquired charges on test masses

Back on December 05th 2024 we had a really large earthquake come through from northern California. This large nearby earthquake reminded Sheila of an old script that checked to see if the test masses had acquired any charge from hitting an earthquake stop during an earthquake. This script had been used to discover hysteresis after particularly large earthquakes in 2017 (37799) and in 2020 (55880). We decided it would be a good idea to check for this earthquake, so we wrote a quick python script move_all_quads_pitch.py that changed the OPTICALIGN pitch for 110 seconds before moving everything back. I then took the matlab script from 2020, check_hysteresis_2020.m and edited the times and channels so that it would grab minute trends for the DAMP_IN and COILOUTF_OUT channels for the week leading up to the earthquake, and then grabbed raw trends for those same channels after the earthquake and during the period of time where we had moved the OPTICALIGN pitch. I plotted the OSEM readings (DAMP_IN) versus the applied force (COILOUTF_OUT) for both times against each other for each test mass and got this plot. Looking at this in addition to the pitch drift plots from the summary pages(ITMX, ITMY, ETMX, ETMY), it doesn't look like any of the test masses encountered any hysteresis as a result of any earthquake stop hits.

All these scripts and results can be found in userapps/sus/h1/scripts/check_hysteresis_after_EQ and have been committed to svn.

Images attached to this report
H1 TCS
camilla.compton@LIGO.ORG - posted 12:03, Monday 16 December 2024 (81851)
Some ETMX HWS signal after replacing fiber collimator last week

After TJ and I replaced the fiber collimator for the ETMX HWS signal last week, we can see some believable ETMX HWS signals. Ther is still something strange happening as we power up (maybe retroflections off ITM before we move spots), but once we reach 60W we can see the test mass change curvature as expected. See attached ETMX signals at 3 minutes, 5 minutes, 20 minutes and trends. We don't expect this HWS signal to be accurate as have done no calculating of the mode matching after we removed a lens in 81734 but we took the data to do so.

There's a dead pixel we should remove but the code has an error "Plotting error: Object Array cannot be loaded when allow_pickle= False" that's not letting me see the Original image.

Images attached to this report
H1 ISC
sheila.dwyer@LIGO.ORG - posted 12:02, Monday 16 December 2024 - last comment - 15:18, Monday 16 December 2024(81849)
pico'd on POP QPDs

Camilla, Sheila

We pico'd to center on the POP QPDs, which we were falling off.  POP A QPD is used during DRMI ASC, we had been using a large offset.  Now in full lock POPA is centered, and in the sdf safe and observe files I've accepted turning off the offset and setting it to 0.

We also noticed a bug with the picomotor code, which is that if someone changes the current motor while the H1:SYS-MOTION_C_PICO_A_INUSE (yellow box on medm) is showing, the current motor channel changes and the medm makes it look like the current motor has changed, but clicking will move the wrong motor.  The second screenshot shows this happening, at the time of thei first time cursor, the current motor was 6 but motor 5 was moving.

Images attached to this report
Comments related to this report
david.barker@LIGO.ORG - 15:18, Monday 16 December 2024 (81854)
H1 CDS
david.barker@LIGO.ORG - posted 11:55, Monday 16 December 2024 - last comment - 15:19, Monday 16 December 2024(81850)
NDS0 restarted as part of TW0 raw minute trend offload

WP12249

In preparation for the TW0 raw minute trend offload of data accumulated since 18th June 2024 (6 months) TW0 was configured to freeze the old data and write to a new location and NDS0 was configured to serve the past 6 months a trends from their temporary location.

NDS0 DAQD was restarted at 11:41 PDT. This is not the default NDS, so it should have had no impact on control room or FOM.

Comments related to this report
david.barker@LIGO.ORG - 15:19, Monday 16 December 2024 (81855)

At time of writing copy is 32/256 dirs copied, which gives an ETA around 13:00 tomorrow, Tue 17th Dec.

H1 ISC
camilla.compton@LIGO.ORG - posted 10:56, Monday 16 December 2024 (81848)
Tried SRCL ASC and LSC offsets again, decided not worth continuing

Shiela and I put back in the SRCL ASC and LSC offsets we found in 81792 to maximize thew coupled cavity poll. Again, the range didn't increased, the FCC increased ~3HZ but hkappa_C decreased ~0.5%. We planned to improved OMC alignment to bring back up the range and kappa_C. Plot attached.

We started repeating the OMC ASC injections form 78616, but this saturated the OMC SUS so we aborted and decided that any gains made would be very small and not worth the time. Reverted SRCL ASC and LSC offsets.

Images attached to this report
LHO VE
david.barker@LIGO.ORG - posted 10:20, Monday 16 December 2024 (81847)
Mon CP1 Fill

Mon Dec 16 10:15:30 2024 INFO: Fill completed in 15min 27secs

Gerardo confirmed a good fill curbside.

Images attached to this report
H1 SQZ
camilla.compton@LIGO.ORG - posted 10:17, Monday 16 December 2024 - last comment - 09:04, Friday 20 December 2024(81843)
SQZ vs No SQZ, FC Beam spot control Enabled

Sheila, Camilla

In 81760 we saw that SQZ was adding noise 20-40Hz. I repeated today FDS and no sqz and don't see the same added noise, only a very small amount around 20Hz. See attached (4 minute 0.1Hz average). We're not sure what would be changing. It's possible that the range correlates with FC beamspot, see attached plot. This morning Sheila showed that the ~5MPc drift in the range during the last locks is mainly around 20-40Hz dtt.

I re-enabled FC beamspot control plot as in 80970, edited sqzparams, reloaded  SQZ_FC and accepting sdfs. We have not checked the offsets.

Images attached to this report
Comments related to this report
camilla.compton@LIGO.ORG - 12:15, Monday 16 December 2024 (81852)

While other work was going on, I tried the sqz/h1/scripts/SCAN_PSAMS.py script from 81516, this time with the SQZ ASC turned back on each time. I turned up the ASC gain to 1.5 and shuffled the wait times so that the ASC converges before the data is taken. We should test it again on a subset of PSAMS settings before starting a long scan. Each setting takes 4-5 minutes. Eg. 3 ZM4 settings and 3 ZM5 settings in 'PSAMS_ZM4/5_LIST' would take ~ 9 total settings x 5 minutes each = around 45 minutes. Each setting still scans the sqz angle, but the best angle didn't change much ~187 to 192deg with ZM4/5 changing 0.4V so we could try to leave SQZ_ANG_ADJUST running and remove the scan sqz ang step.

H1 SUS
oli.patane@LIGO.ORG - posted 14:15, Tuesday 10 December 2024 - last comment - 16:44, Monday 16 December 2024(81736)
In-Lock SUS Charge Measurements for December 10th FAMIS

Closes FAMIS#28383, last checked 81688

Once again, the coherence for ITMX bias drive bias off is below the coherence threshold - this time the coherence is 0.01, much lower than the threshold of 0.1, so there are once again no new analyzed measurements for ITMX.

ETMX, ETMY, ITMX, ITMY

Images attached to this report
Comments related to this report
camilla.compton@LIGO.ORG - 16:44, Monday 16 December 2024 (81858)

Checked that the measurements for ITMX bias are running and the same magnitude for bias in and bias off. They are at a lower magnitude than the quadrant injection on the ESDAMON/LVEASDAMON  so we could think about increasing the magnitude if we are not happy with the 81688 no charge build-up on the test mass conclusion. We also still have a pending "to do" from Vlad in 79597: explicitly cast DARM data to np.float64

Images attached to this comment
H1 PEM (DetChar, PEM, TCS)
robert.schofield@LIGO.ORG - posted 18:06, Thursday 14 November 2024 - last comment - 10:19, Thursday 19 December 2024(81246)
TCS-Y chiller is likely hurting Crab sensitivity

Ansel reported that a peak in DARM that interfered with the sensitivity of the Crab pulsar followed a similar time frequency path as a peak in the beam splitter microphone signal. I found that this was also the case on a shorter time scale and took advantage of the long down times last weekend to use  a movable microphone to find the source of the peak. Microphone signals don’t usually show coherence with DARM even when they are causing noise, probably because the coherence length of the sound is smaller than the spacing between the coupling sites and the microphones, hence the importance of precise time-frequency paths.

Figure 1 shows DARM and the problematic peak in microphone signals. The second page of Figure 1 shows the portable microphone signal at a location by the staging building and a location near the TCS chillers. I used accelerometers to confirm the microphone identification of the TCS chillers, and to distinguish between the two chillers (Figure 2).

I was surprised that the acoustic signal was so strong that I could see it at the staging building - when I found the signal outside, I assumed it was coming from some external HVAC component and spent quite a bit of time searching outside. I think that this may be because the suspended mezzanine (see photos on second page of Figure 2) acts as a sort of soundboard, helping couple the chiller vibrations to the air. 

Any direct vibrational coupling can be solved by vibrationally isolating the chillers. This may even help with acoustic coupling if the soundboard theory is correct. We might try this first. However, the safest solution is to either try to change the load to move the peaks to a different frequency, or put the chillers on vibration isolation in the hallway of the cinder-block HVAC housing so that the stiff room blocks the low-frequency sound. 

Reducing the coupling is another mitigation route. Vibrational coupling has apparently increased, so I think we should check jitter coupling at the DCPDs in case recent damage has made them more sensitive to beam spot position.

For next generation detectors, it might be a good idea to make the mechanical room of cinder blocks or equivalent to reduce acoustic coupling of the low frequency sources.

Non-image files attached to this report
Comments related to this report
camilla.compton@LIGO.ORG - 14:12, Monday 25 November 2024 (81472)DetChar, TCS

This afternoon TJ and I placed pieces of damping and elastic foam under the wheels of both CO2X and CO2Y TCS chillers. We placed thicker foam under CO2Y but this did make the chiller wobbly so we placed thinner foam under CO2X.

Images attached to this comment
keith.riles@LIGO.ORG - 08:10, Thursday 28 November 2024 (81525)DetChar
Unfortunately, I'm not seeing any improvement of the Crab contamination in the strain spectra this week, following the foam insertion.

Attached are ASD zoom-ins (daily and cumulative) from Nov 24, 25, 26 and 27.
Images attached to this comment
camilla.compton@LIGO.ORG - 15:02, Tuesday 03 December 2024 (81598)DetChar, TCS

This morning at 17:00UTC we turned the CO2X and CO2Y TCS chiller off and then on again, hoping this might change the frequency they are injecting into DARM. We do not expect it to effect it much we had the chillers off for a ling period 25th October 80882 when we flushed the chiller line and the issue was seen before this date.

Opened FRS 32812.

There were no expilcit changes to the TCS chillers bettween O4a and O4b although we swapped a chiller for a spare chiller in October 2023 73704

camilla.compton@LIGO.ORG - 11:27, Thursday 05 December 2024 (81634)TCS

Between 19:11 and 19:21 UTC, Robert and I swapped the foam from under CO2Y chiller (it was flattened and not providing any damping now) to new, thicker foam and 4 layers of rubber. Photo's attached. 

Images attached to this comment
keith.riles@LIGO.ORG - 06:04, Saturday 07 December 2024 (81663)
Thanks for the interventions, but I'm still not seeing improvement in the Crab region. Attached are daily snapshots from UTC Monday to Friday (Dec 2-6).
Images attached to this comment
thomas.shaffer@LIGO.ORG - 15:53, Tuesday 10 December 2024 (81745)TCS

I changed the flow of the TCSY chiller from 4.0gpm to 3.7gpm.

These Thermoflex1400 chillers have their flow rate adjusted by opening or closing a 3 way valve at the back of the chiller. for both X and Y chillers, these have been in the full open position, with the lever pointed straight up. The Y chiller has been running with 4.0gpm, so our only change was a lower flow rate. The X chiller has been at 3.7gpm already, and the manual states that these chillers shouldn't be ran below 3.8gpm. Though this was a small note in the manual and could be easily missed. Since the flow couldn't be increased via the 3 way valve on back, I didn't want to lower it further and left it as is.

Two questions came from this:

  1. Why are we running so close to the 3.8gpm minimum?
  2. Why is the flow rate for the X chiller so low?

The flow rate has been consistent for the last year+, so I don't suspect that the pumps are getting worn out. As far back as I can trend they have been around 4.0 and 3.7, with some brief periods above or below.

Images attached to this comment
keith.riles@LIGO.ORG - 07:52, Friday 13 December 2024 (81806)
Thanks for the latest intervention. It does appear to have shifted the frequency up just enough to clear the Crab band. Can it be nudged any farther, to reduce spectral leakage into the Crab? 

Attached are sample spectra from before the intervention (Dec 7 and 10) and afterward (Dec 11 and 12). Spectra from Dec 8-9 are too noisy to be helpful here.


Images attached to this comment
camilla.compton@LIGO.ORG - 11:34, Tuesday 17 December 2024 (81866)TCS

TJ touched the CO2 flow on Dec 12th around 19:45UTC 81791 so the flowrate further reduced to 3.55 GPM. Plot attached.

Images attached to this comment
thomas.shaffer@LIGO.ORG - 14:16, Tuesday 17 December 2024 (81875)

The flow of the TCSY chiller was further reduced to 3.3gpm. This should push the chiller peak lower in frequency and further away from the crab nebula.

keith.riles@LIGO.ORG - 10:19, Thursday 19 December 2024 (81902)
The further reduced flow rate seems to have given the Crab band more isolation from nearby peaks, although I'm not sure I understand the improvement in detail. Attached is a spectrum from yesterday's data in the usual form. Since the zoomed-in plots suggest (unexpectedly) that lowering flow rate moves an offending peak up in frequency, I tried broadening the band and looking at data from December 7 (before 1st flow reduction), December 16 (before most recent flow reduction) and December 18 (after most recent flow reduction). If I look at one of the accelerometer channels Robert highlighted, I do see a large peak indeed move to lower frequencies, as expected.

Attachments:
1) Usual daily h(t) spectral zoom near Crab band - December 18
2) Zoom-out for December 7, 16 and 18 overlain
3) Zoom-out for December 7, 16 and 18 overlain but with vertical offsets
4) Accelerometer spectrum for December 7 (sample starting at 18:00 UTC)
5) Accelerometer spectrum for December 16
6) Accelerometer spectrum for December 18 
Images attached to this comment
Displaying reports 8421-8440 of 87917.Go to page Start 418 419 420 421 422 423 424 425 426 End