david.barker@LIGO.ORG - posted 10:22, Friday 25 October 2024 (80879)
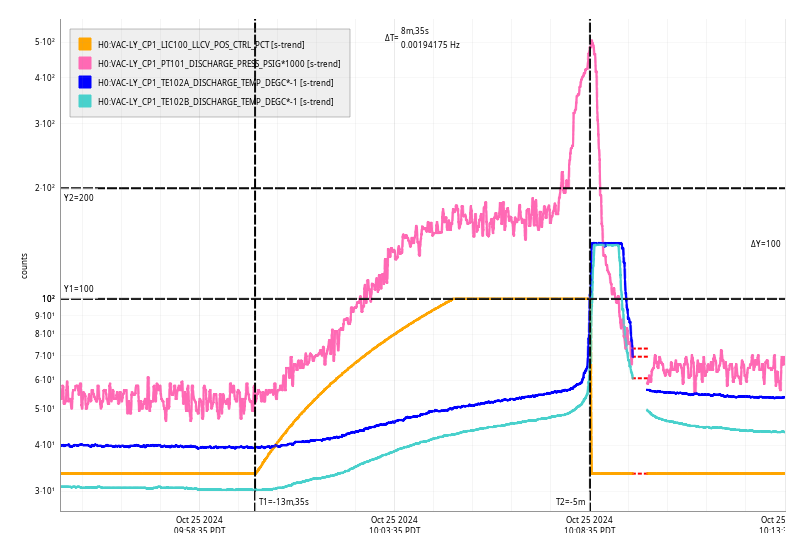
Fri CP1 Fill
Fri Oct 25 10:08:35 2024 INFO: Fill completed in 8min 32secs
Images attached to this report
Fri Oct 25 10:08:35 2024 INFO: Fill completed in 8min 32secs
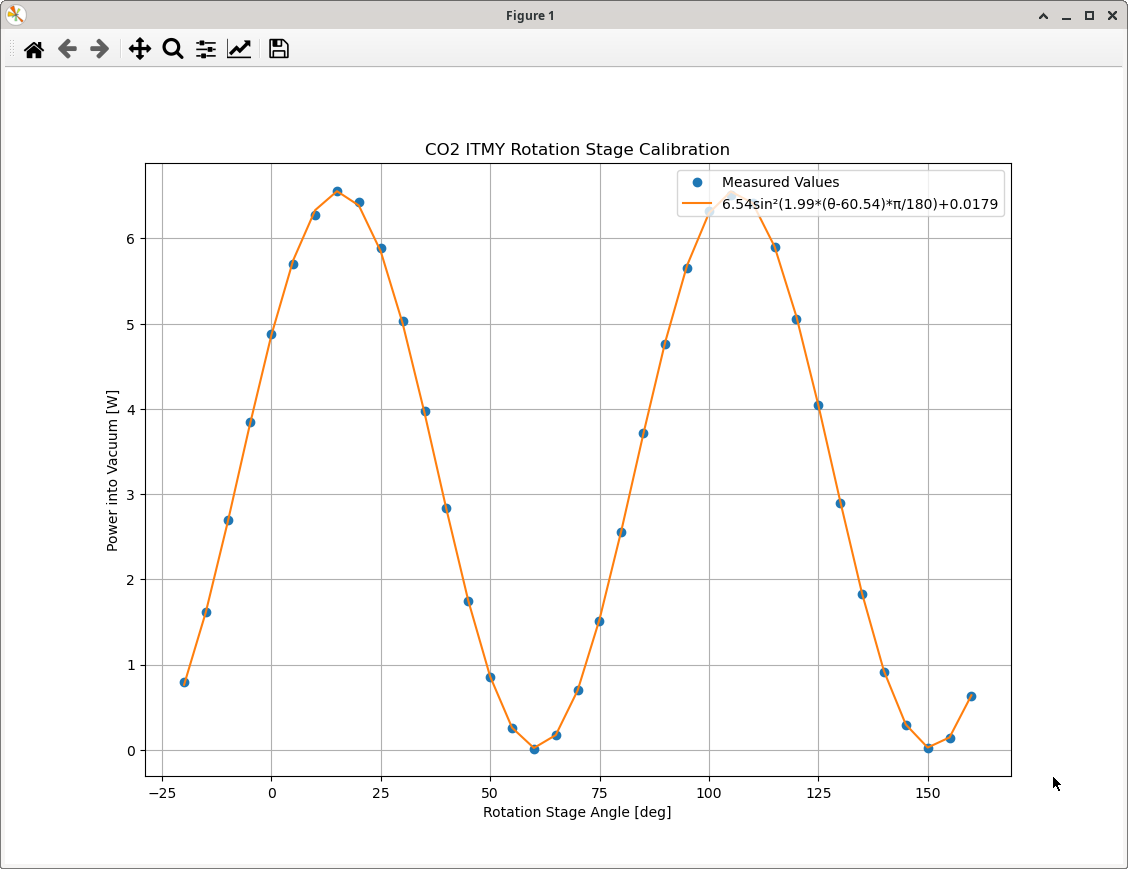
After we swapped CO2Y in 80812. We used Ryan's updated Rotation Stage calibration code, now saved as /opt/rtcds/userapps/release/tcs/h1/scripts/RS_calibration/CalibRotStage.py
to calibrate the CO2Y rotation stage. I added another argument so we can use the same code and specify --optic ITMX or ITMY. Updated instructions in the README.txt
Current fitting coefficients: 4.16, 1.99, 59.58, 0.0
New fitting coefficients: 6.5377, 1.9908, 60.5383, 0.0179
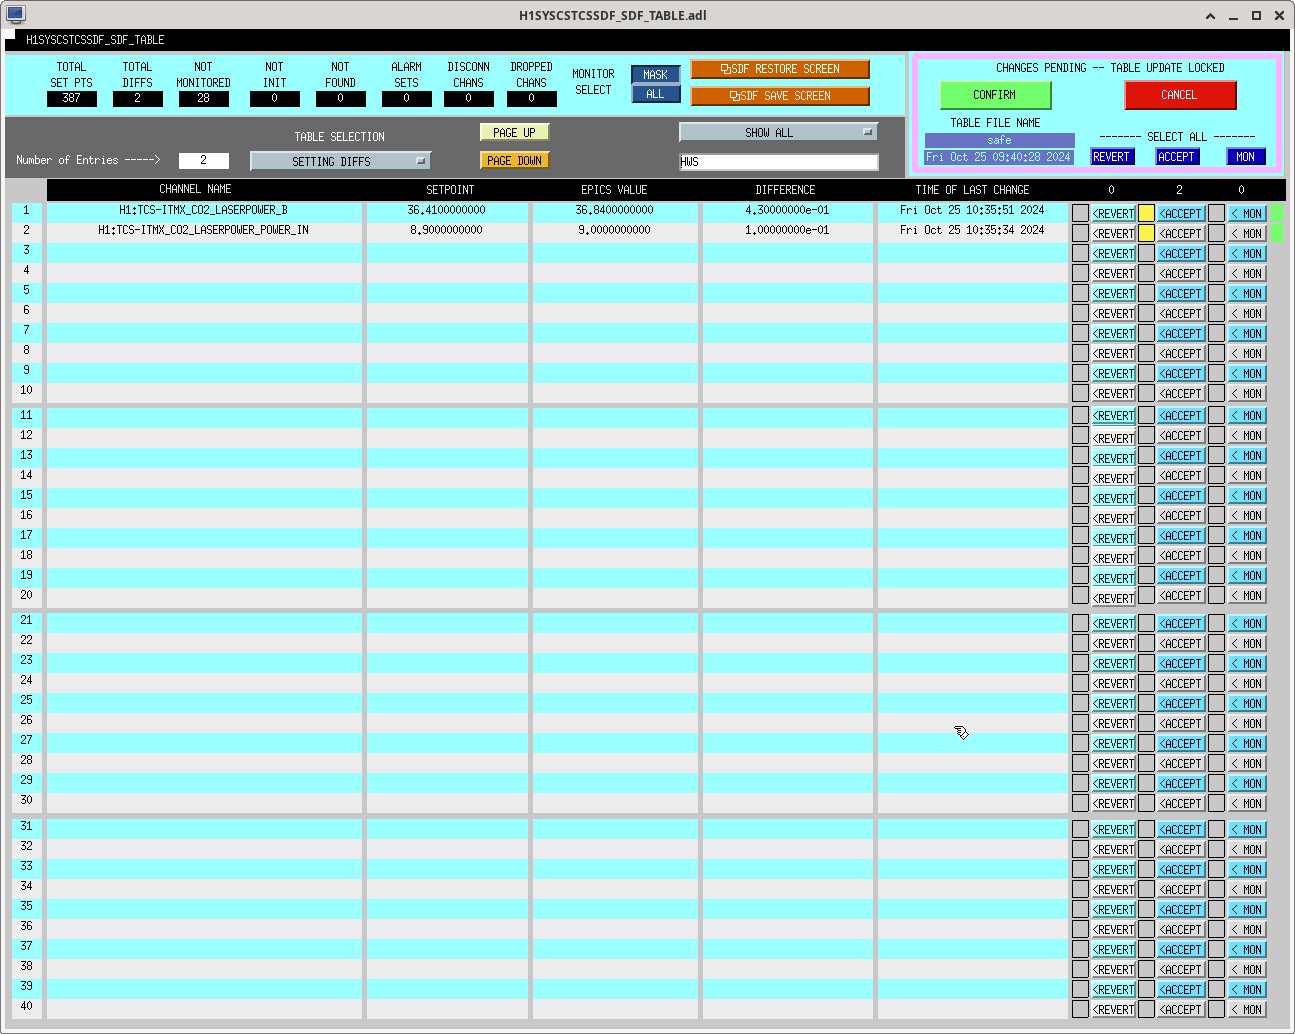
Accepted in sdf. Requested using power control for 1.7W, got 1.71W output. Then tested with TCS_ITMY_CO2_PWR guardian (includes bootstrapping) and got 1.71W too. Great.

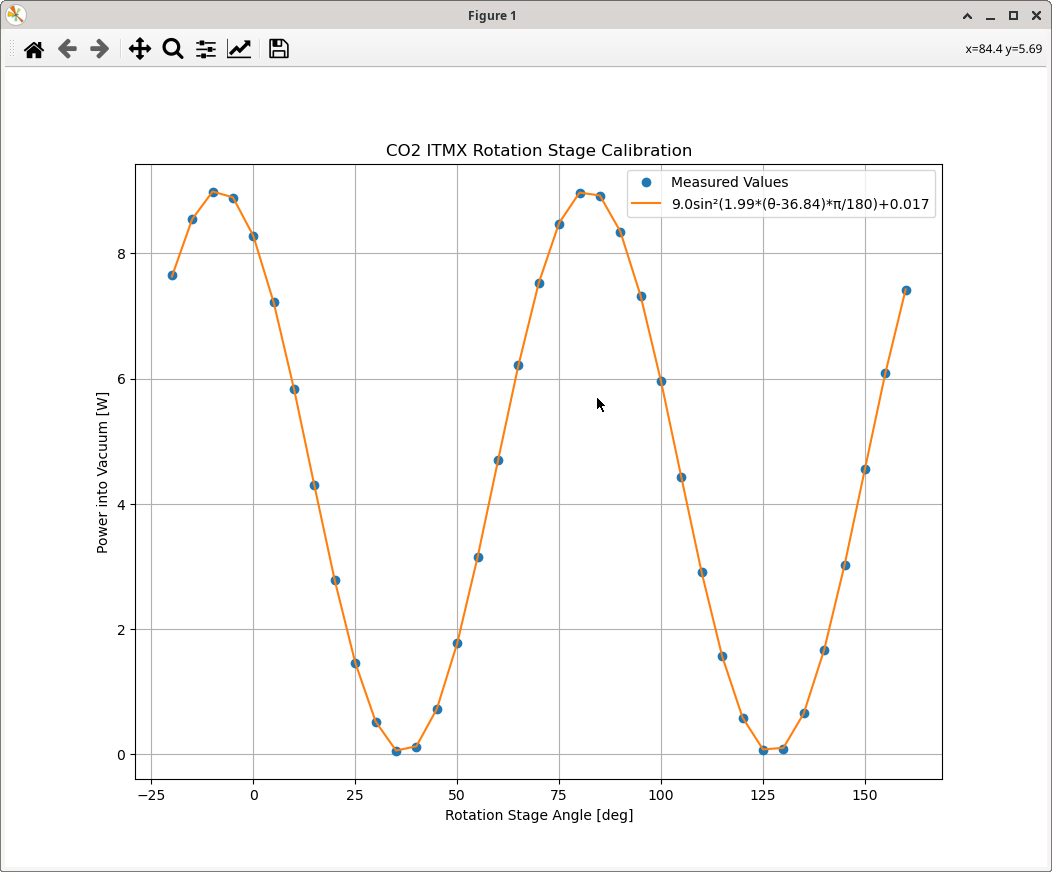
I checked CO2X by using power control request for 1.7W, got 1.65W output. CO2_PWR guardian bootstrapping has been fixing this to ~1.7W. Re-calibrated to make it more accurate:
Current fitting coefficients: 8.9 1.99 36.41 0.0
New fitting coefficients: 9.0022 1.9905 36.8446 0.017
Plots and accepted sdf's attached. Requested using power control for 1.7W, got 1.72W output. Then tested with CO2_PWR guardian (includes bootstrapping) and got 1.72W too.
TITLE: 10/25 Day Shift: 1430-2330 UTC (0730-1630 PST), all times posted in UTC
STATE of H1: Corrective Maintenance
OUTGOING OPERATOR: Ryan S
CURRENT ENVIRONMENT:
SEI_ENV state: SEISMON_ALERT
Wind: 11mph Gusts, 9mph 3min avg
Primary useism: 0.09 μm/s
Secondary useism: 0.25 μm/s
QUICK SUMMARY:
h1pslcam1 stopped giving an image sometime between 18:00 and 19:00 Tue 22oct2024. The camera cannot be pinged.
A reminder of this camera's image is attached.
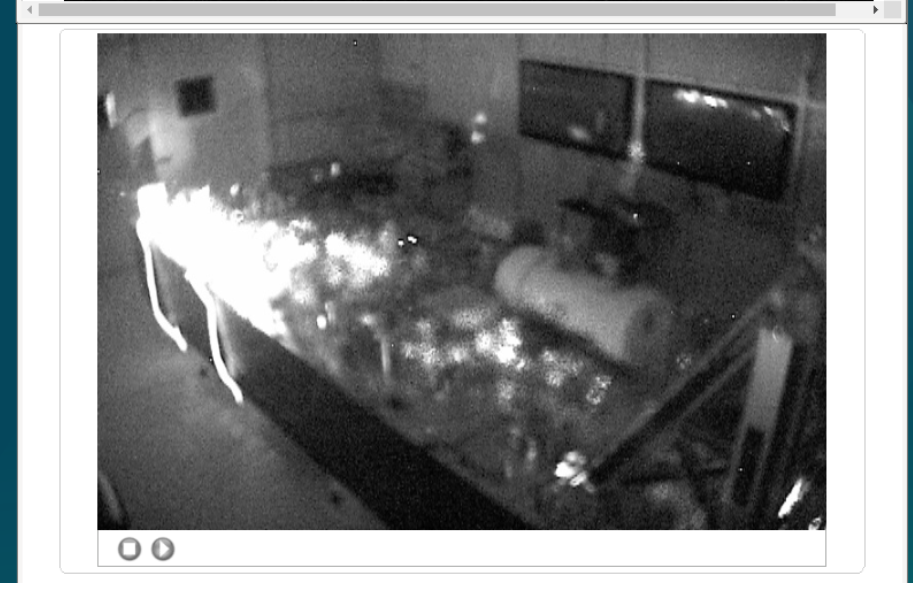
PSL Team have fixed the camera.
The camera looks dead again, PSL team said they didn't actually do anything when they checked out the camera earlier.
J. Oberling, R. Short, C. Compton, T. Guidry, J. Driggers
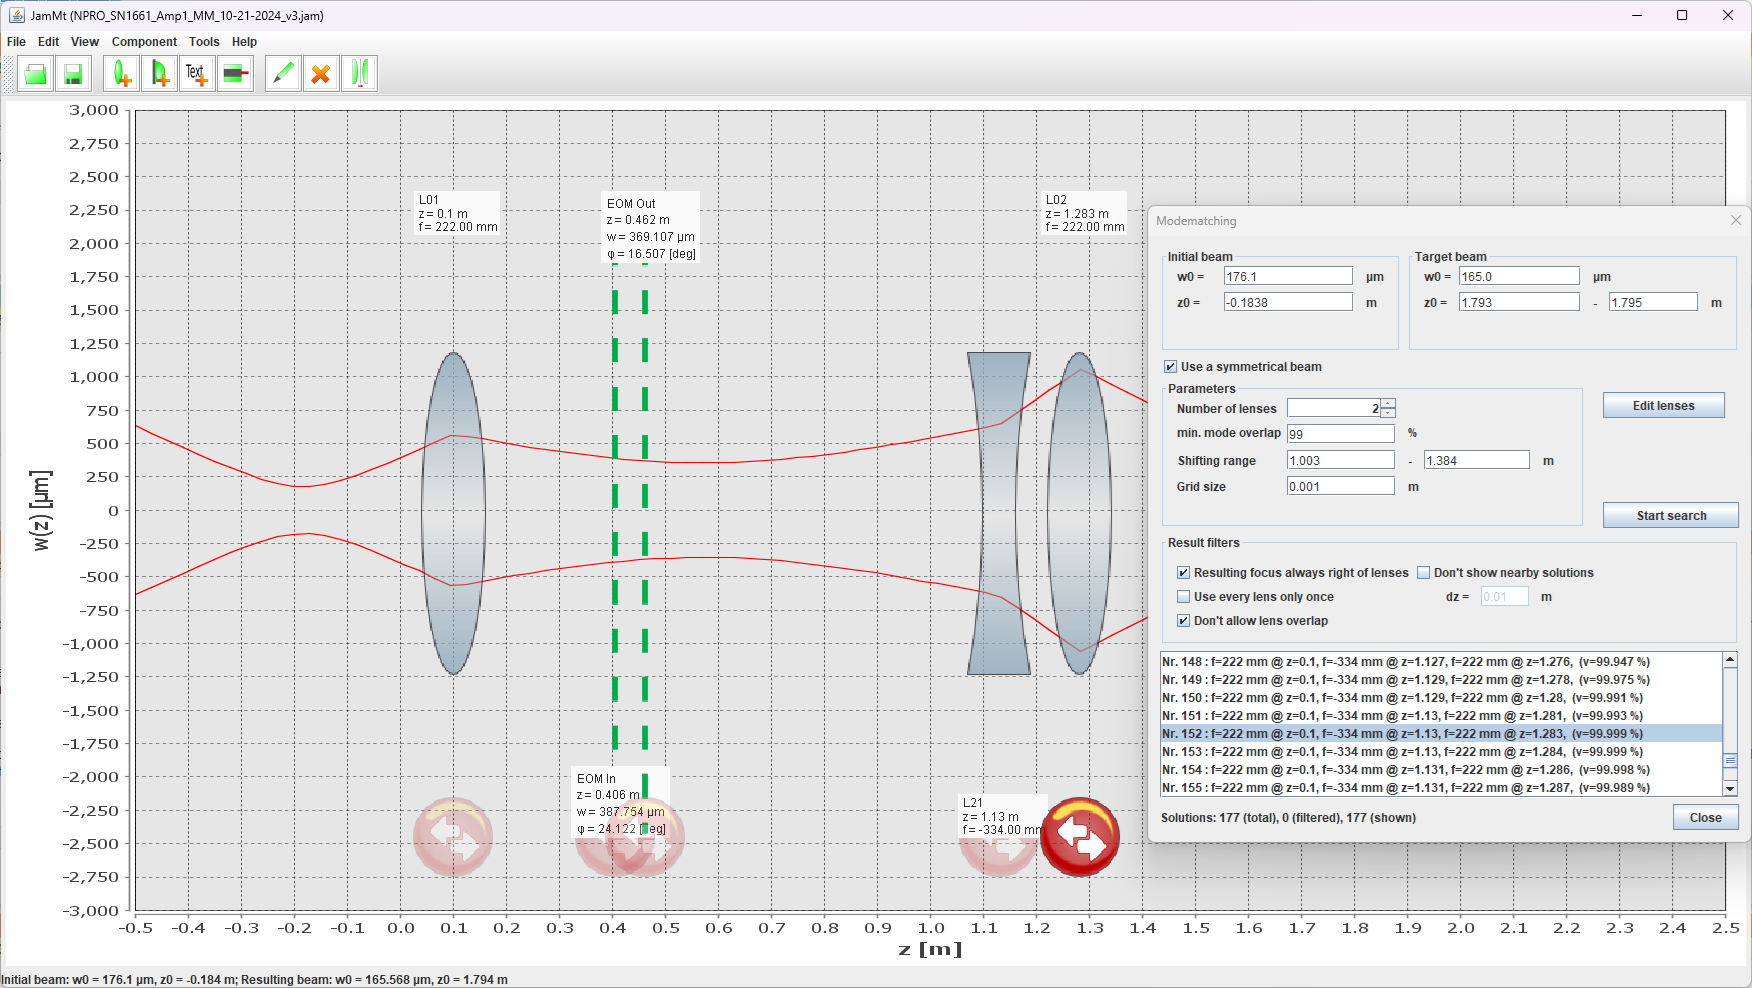
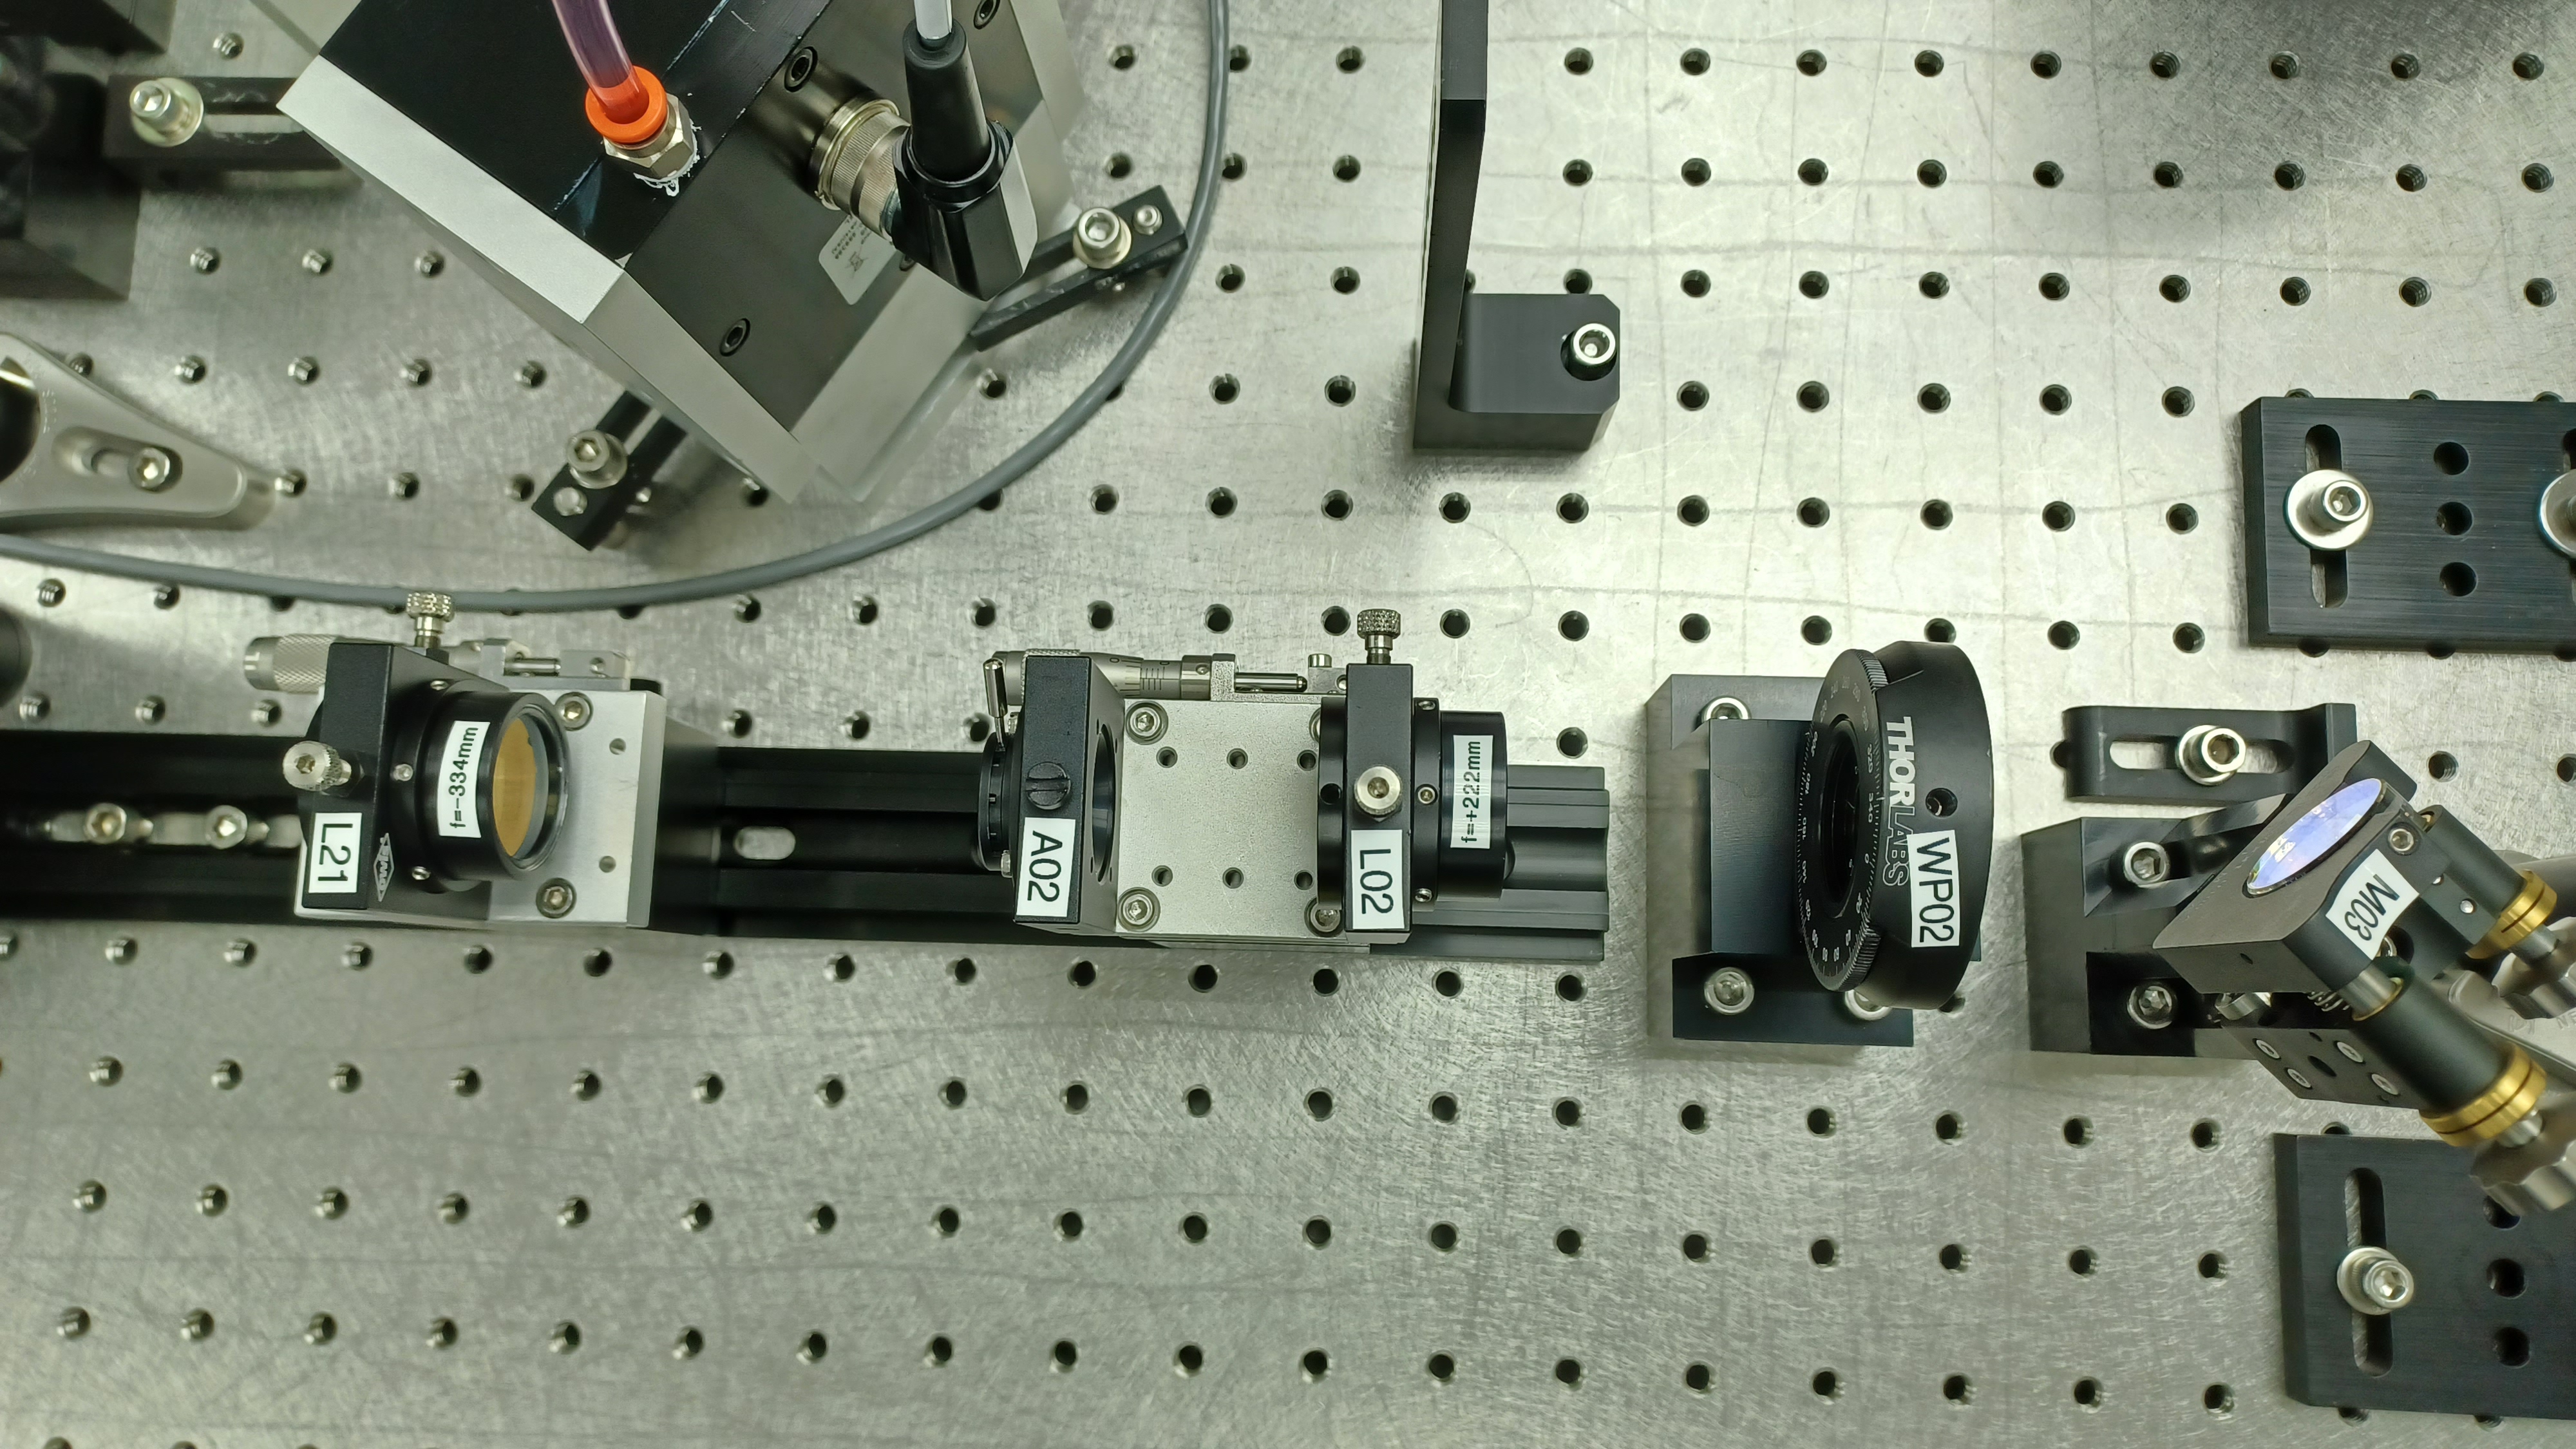
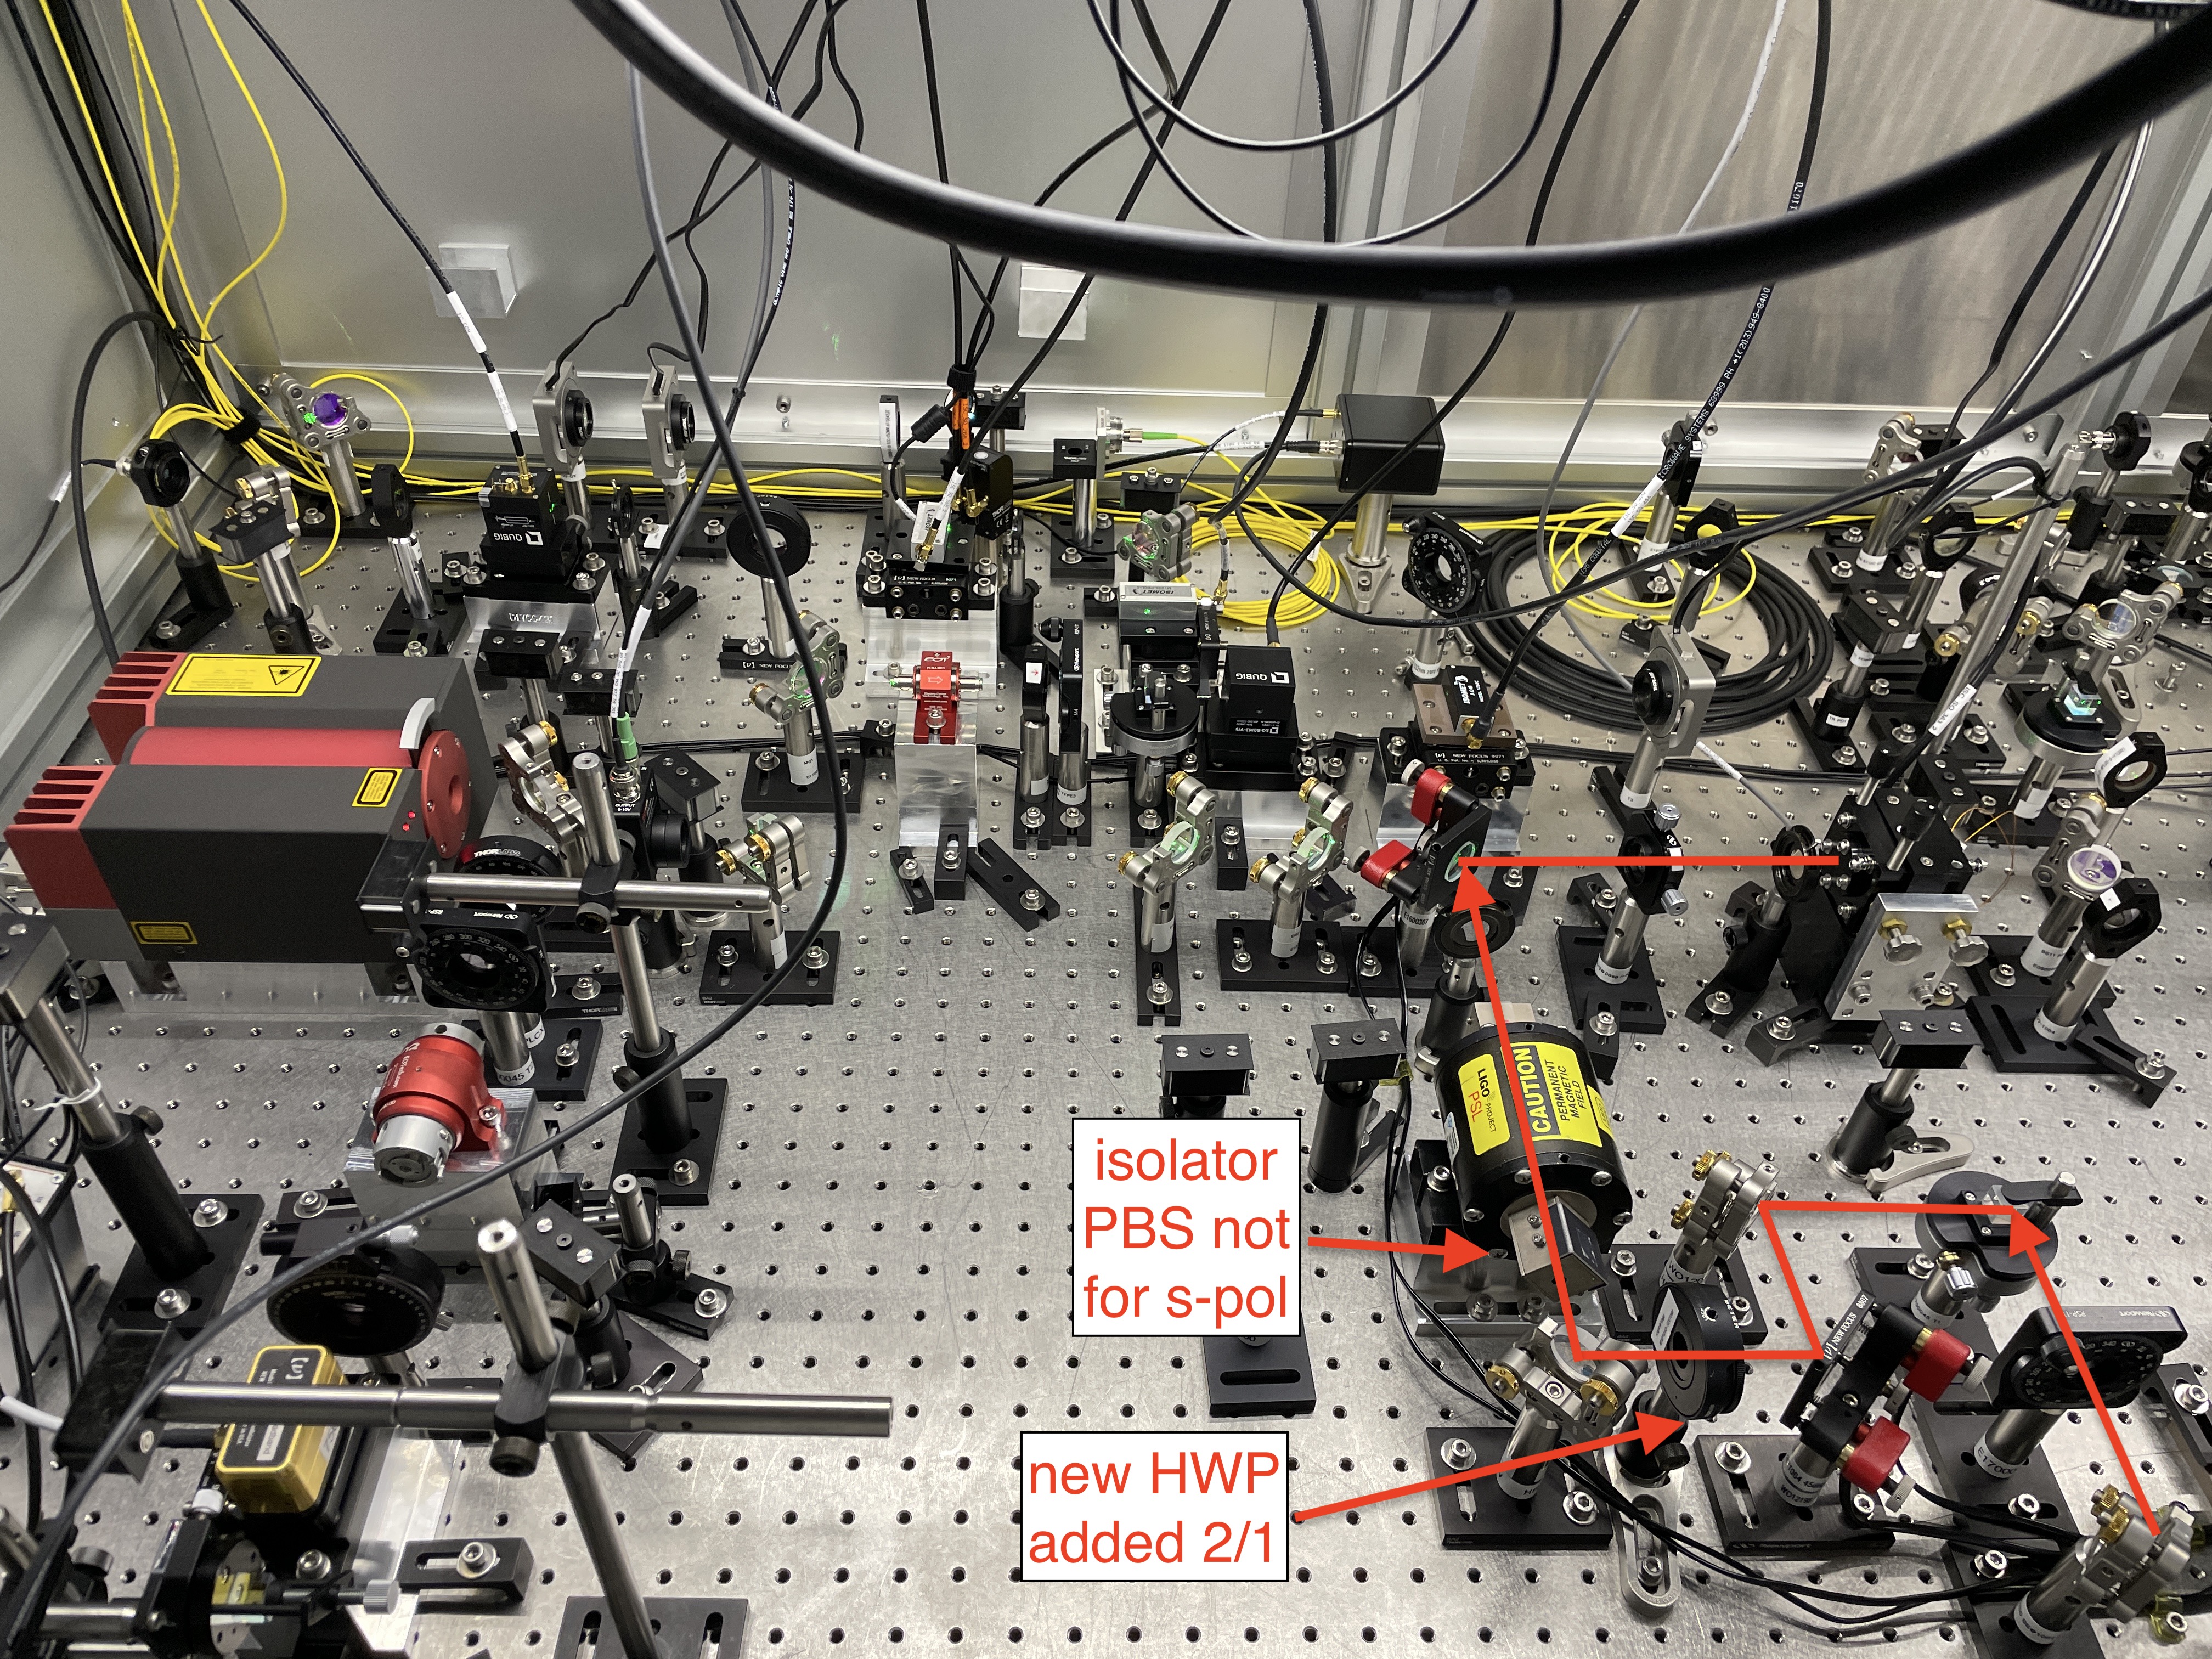
Continuing from yesterday, this morning Camilla and Ryan began First Contact cleaning the lenses for our chosen mode matching solution. I met with Tyler and he modded the spacer plates for us. Once that was done I went into the enclosure to begin building the new lens mount stack and place the rail for it. While in there also looked at exactly where on the table our new lens would be going. In checking this I found a discrepancy in the As Built layout; the NPRO was placed in the wrong position, 1/2" back from where it's actually sitting. Seeing this, I left the enclosure and re-ran the mode matching to account for this change in distance to Amp1's input beam waist location. The solution stayed the same but the lens locations changed slightly. I finished this as Ryan and Camilla were finishing up the lens cleaning, and it was almost lunch time so we broke for lunch.
After lunch, Ryan and I went into the enclosure to start installing the mode matching lenses. While in the enclosure Jenne (from the CR) and Ryan worked to find the script that Varun wrote back during the '21 laser upgrade to quickly do a Gaussian fit to beam propagation measurements, which will really speed up checking the results of our mode matching; they found the script and it lives in /ligo/gitcommon/labutils/beam_scans. We then installed L01, an f = +222mm lens, and recovered the beam alignment. With the new L01 in place we then re-installed the EOM and aligned it. Next was installing the new lens, an f = -334mm lens now known as L21. We roughly placed it, then used a scale to measure back from M03 to place it more accurately. It was at this point we discovered yet another discrepancy in the As Built layout; I had not put the beam path from mirrors M03 and M04 on the correct row of holes, which added 2" to our NPRO to Amp1 distance. So once again we left the enclosure to take yet another look at mode matching (we have now discussed talking with CDS about getting JamMT on one or both of the computers in the Laser Room; this requires an installation of the Java Runtime Environment); the lenses did not change but their positions did (as expected), see attached. This done, we went back into the enclosure to install the last 2 lenses in the proper locations for our mode matching solution.
We had to remove WP02, as L21 now sits where WP02 once did (not a big deal, the position of WP02 is not critical). This done we installed L21 and aligned it; during alignment we had to drive the lens to the furthest extent of the lens mount to align the beam, which should not be the case if our M02 to M03 alignment was good. Turns out we were checking the alignment at a bad point, beyond M03. M03 and M04 are used to align the beam into Amp1, so the beam won't be exactly on a row of holes there, but the alignment jig we use (one of the tall posts with pinholes in it at beam height that we stick a power meter behind, then adjust the optic being aligned until power is maxed) sit on a row of holes. By aligning L01, the EOM, and L21 to a point beyond M03 we were steering the beam off of our previous M02 to M03 alignment. So we moved the alignment post to in front of M03 and re-aligned L01, the EOM, and L21; things looked much better after that. Finally we installed and aligned the new L02, an f = +222mm lens. We stopped for the day at this point. The final attachment is the new layout between FI01 and M03.
On deck for tomorrow, in order (likely to bleed into the weekend/next week at this point):
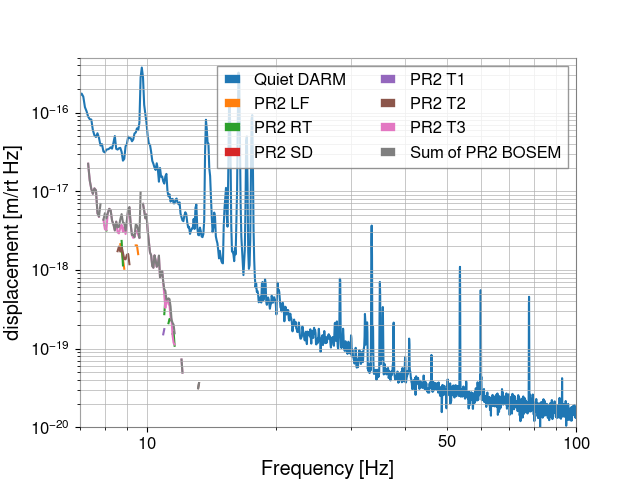
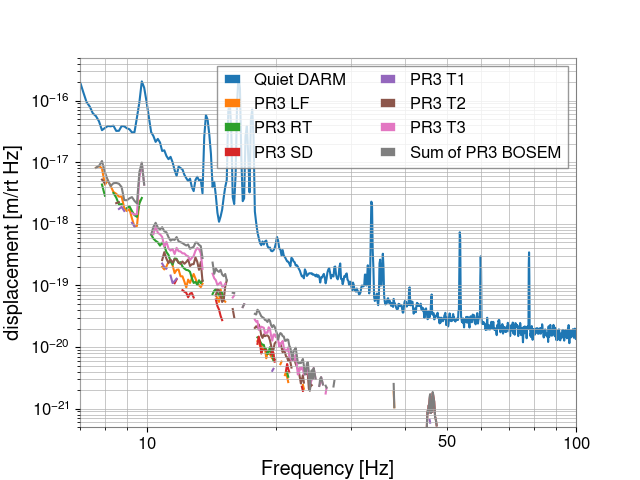
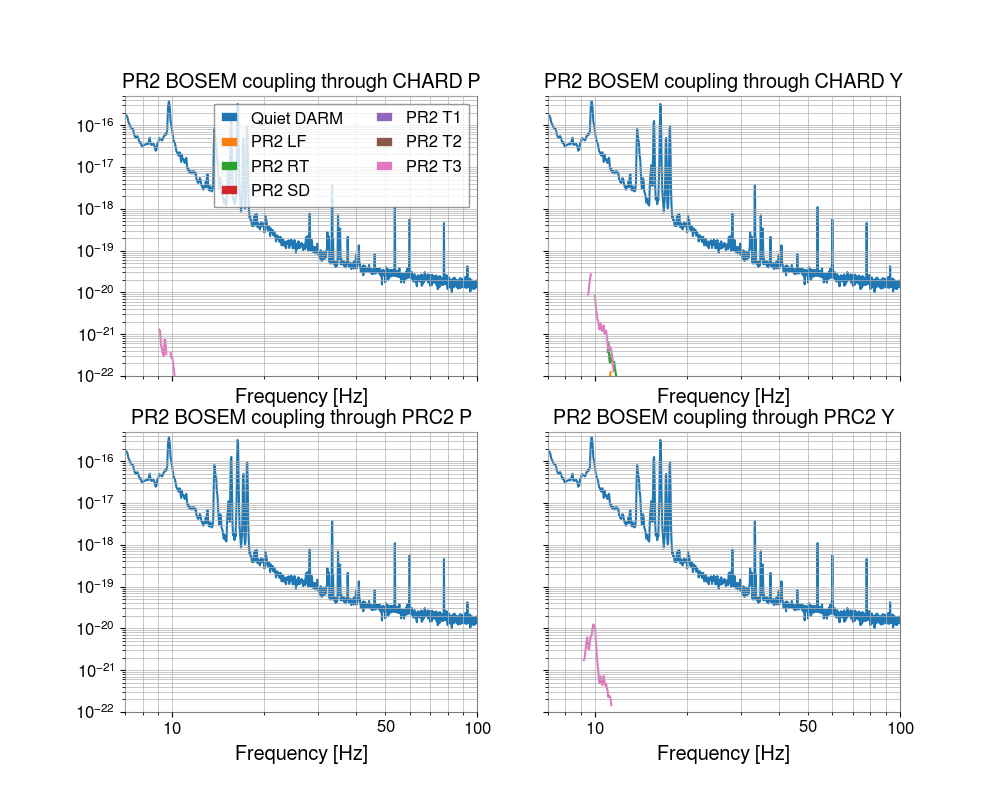
This alog builds off of the work done by Joshua to measure PR2 and PR3 BOSEM coupling in alogs 80732 and 80814. His injections showed that PR2 coupling to DARM occurs up to about 12 Hz, and PR3 coupling up to 25 Hz. To note: these injections were performed above 10 Hz, and the measurements were able to pick up some coupling between 7-10 Hz as well. However, I think the most significant coupling, and limitation of the BOSEMs likely occurs in the auxiliary controls below 5 Hz. There is some indication of that from these measurements.
I used his injections to investigate the pathways of this coupling. I modeled my scripts after the scripts that Sheila has written previously to measure couplings to DARM through multiple pathways, as in 80730.
I made two plots, one showing each PR2 bosem contribution to DARM and one showing each PR3 bosem contribution to DARM.
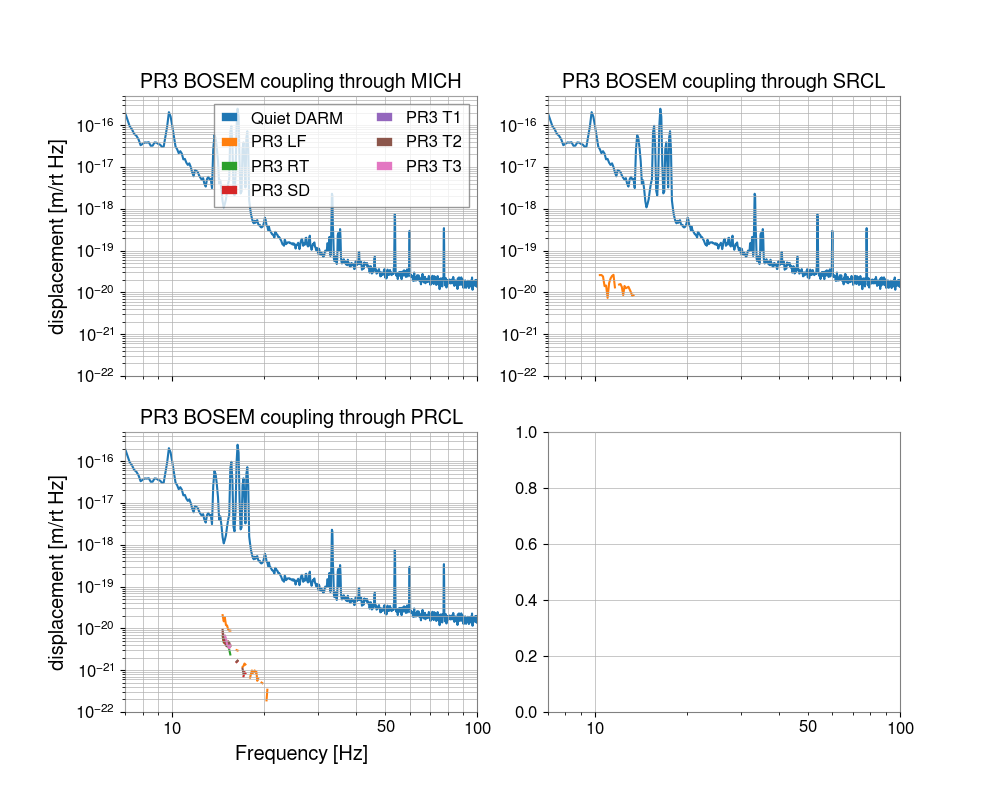
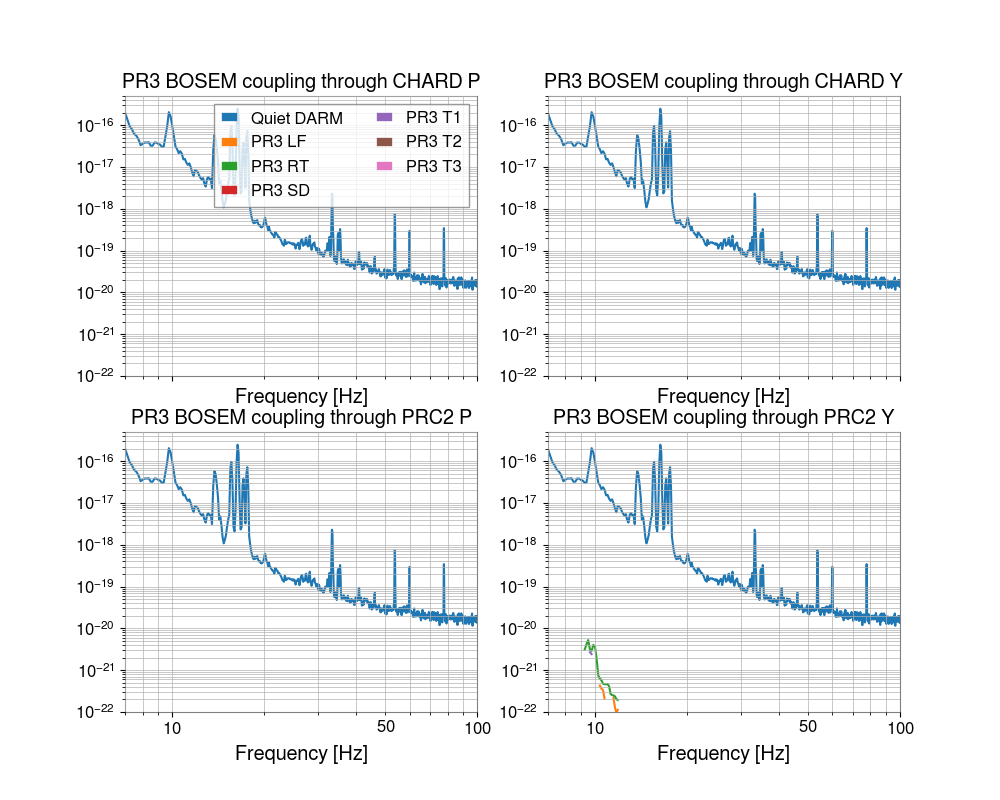
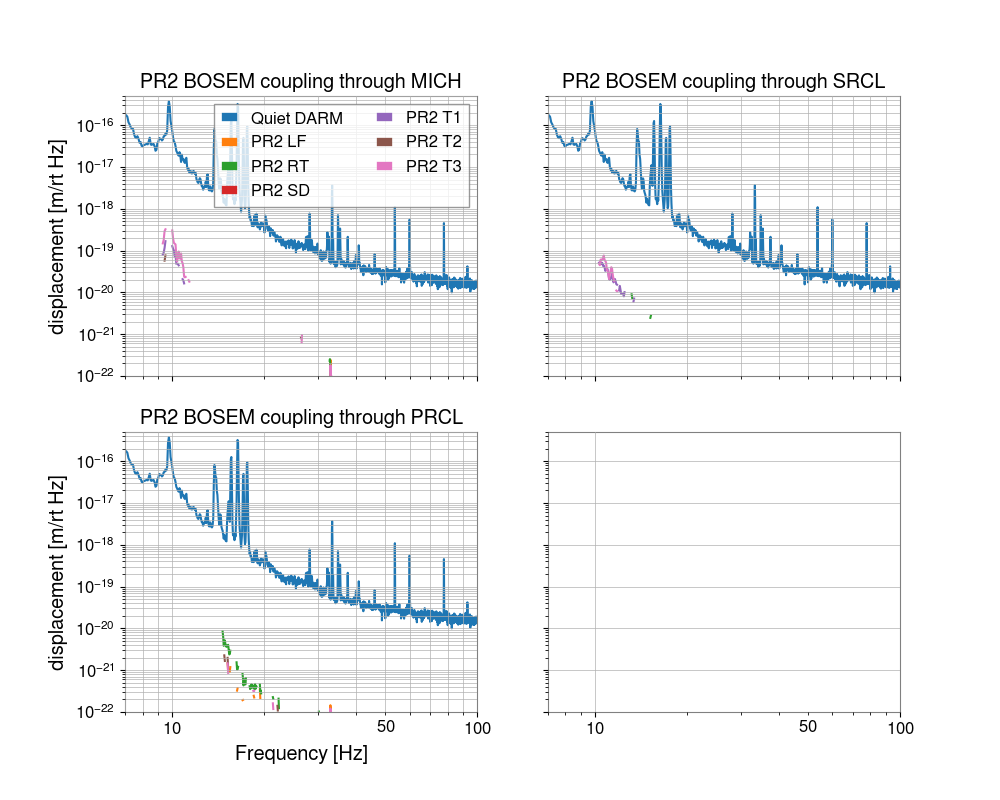
There is also a set of plots attached to this alog that show each PR2 and PR3 bosem coupling to DARM projected through MICH, PRCL, SRCL, CHARD P and Y and PRC2 P and Y (PR3 ASC, PR3 LSC, PR2 ASC, PR2 LSC).
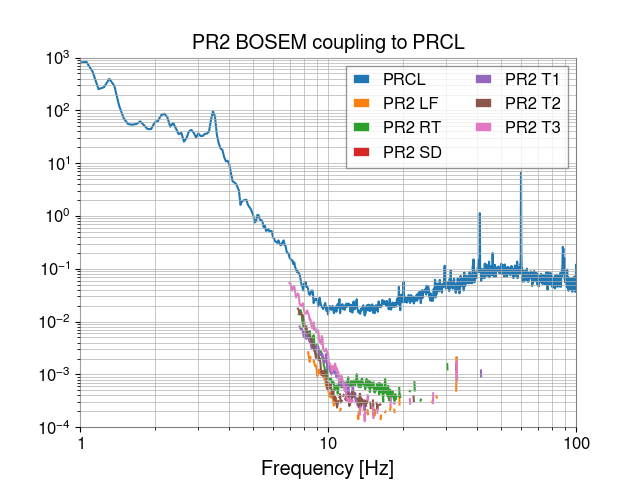
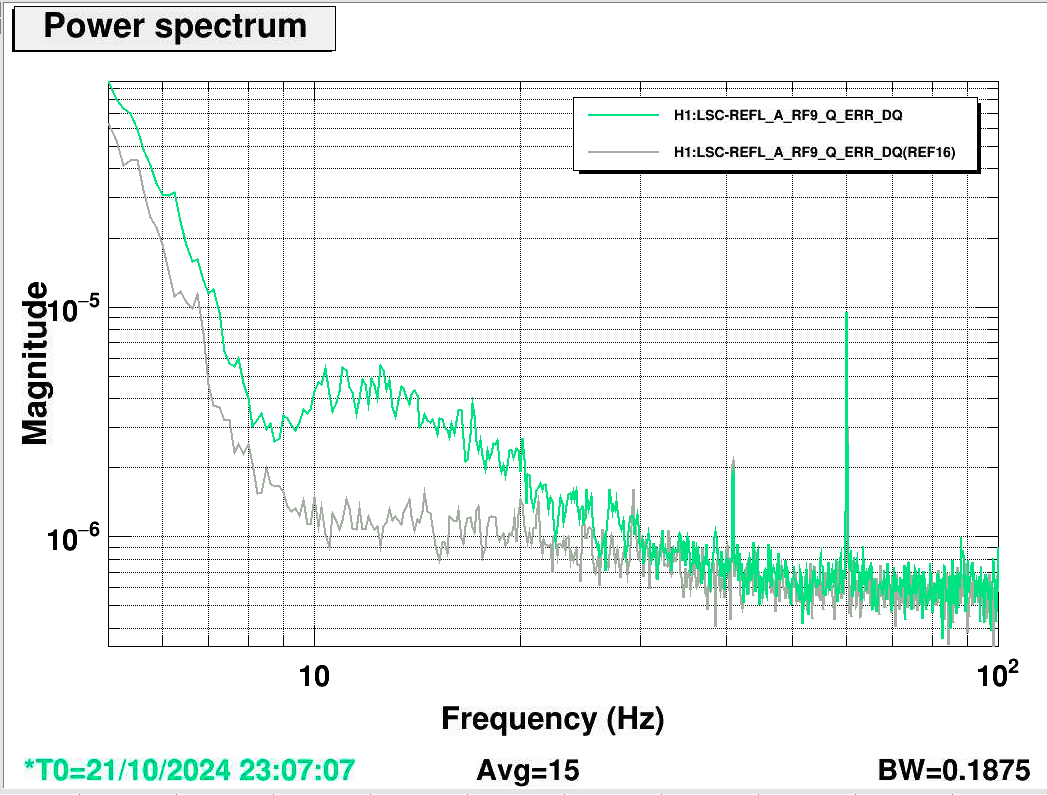
Overall, these results indicate that PR2 and PR3 coupling to DARM through ASC and LSC loops are fairly minimal. The PR2 and PR3 noise seems to show up most strongly in RF9, so there is strong coupling to PRCL and PRC2. I predict there is probably coupling to CARM, especially for PR3. As a quick test, I compared the LSC REFL RF9 Q error signals during the injection and saw coupling of the PR3 BOSEM noise up 30 Hz (dtt screenshot, where reference trace shows quiet time, live trace is during the PR3 T2 BOSEM injection).
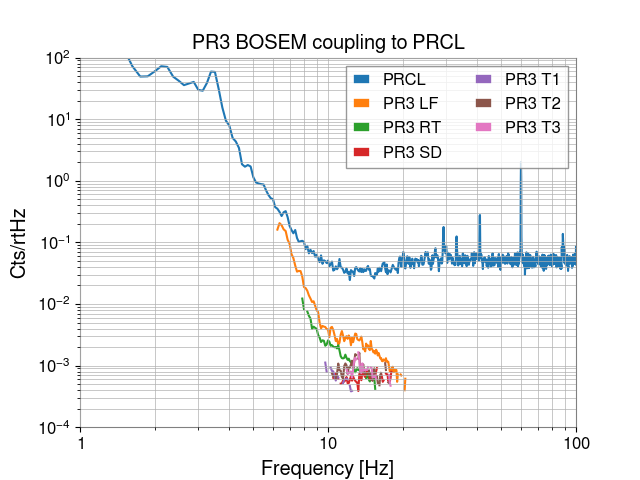
As an example, I projected the BOSEM noise to PRCL, PR2 projection and PR3 projection (the result is uncalibrated). I think if we injected at even lower frequencies, we would see that PRCL, is greatly limited by this noise.
If we would like to do further tests to investigate this coupling, we should: inject at lower frequencies, open the POP beam diverter to see the appearance of this noise on the POP WFS, and move to 1 CARM sensor to see the appearance of this noise on an out-of-loop CARM sensor. The POP WFS test would help us understand if, for example, this excess noise on PR3 is causing some sort of jitter that couples to DARM. This would help further understand why PR3 BOSEM seems to couple strongly to DARM up to almost 30 Hz, but only appears weakly in the auxiliary DOFs.
However, it is also important to finish investigating the contributions of all triple suspensions, so PRM, BS, and all the SRC mirrors.
I made all of these plots using the utils code from the aligoNB repository. All code, DTT templates and plots can be found in my home directory: /ligo/home/elenna.capote/BOSEM
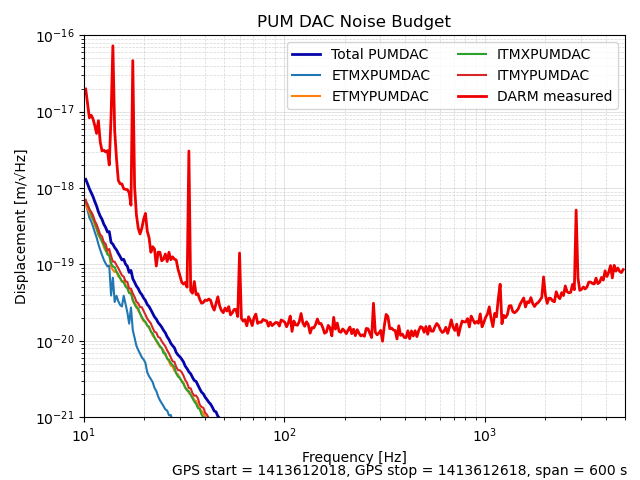
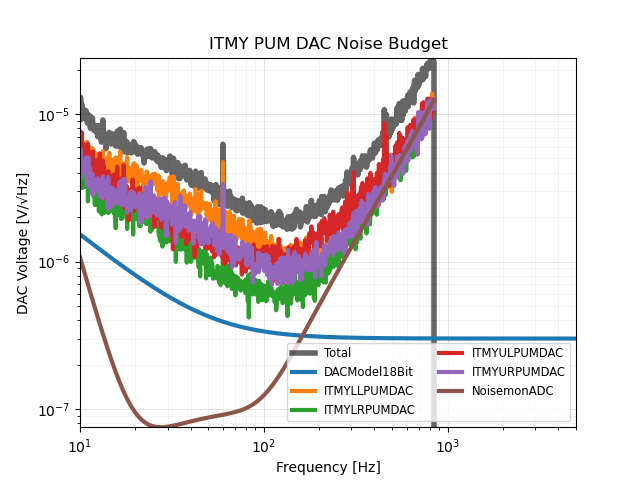
A new LIGO-designed DAC was installed recently on ETMX L2 (PUM) channels. To assess the noise of the new DAC, I re-ran the PUM DAC noise budget using data from 2024-10-21 23:00 PDT. This DAC noise projection is made by subtracting drive signals from the PUM noisemons.
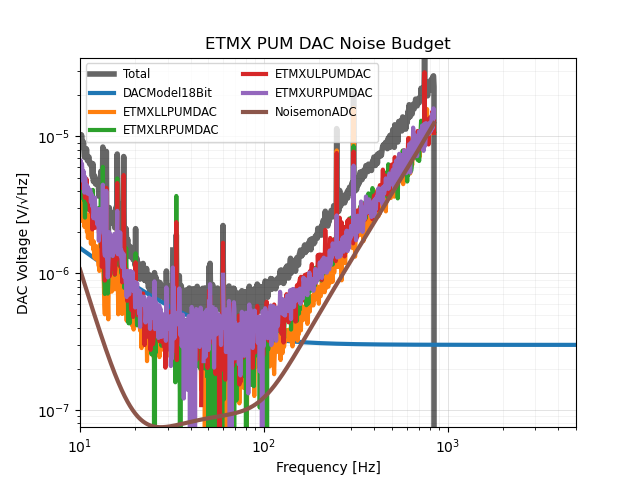
From the first attached plot, we can see that above 20 Hz, ETMX's new DACs are about 5x quieter than the others, which are General Standards 20-bit DACs without dither. The new DAC noise is similar above 20 Hz to what is seen in L1, using GS 20-bit DACs with dither applied.
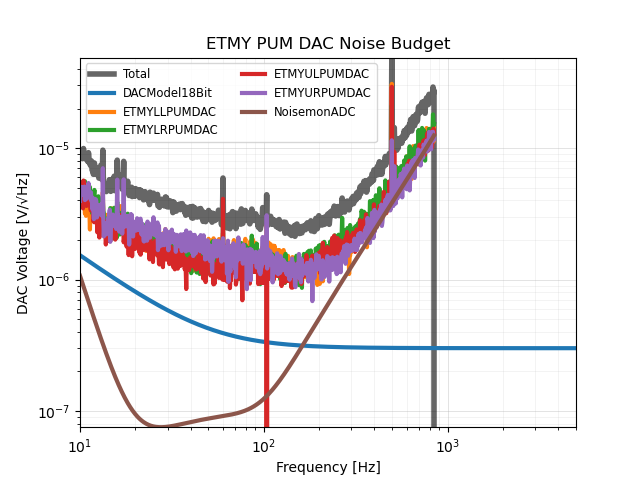
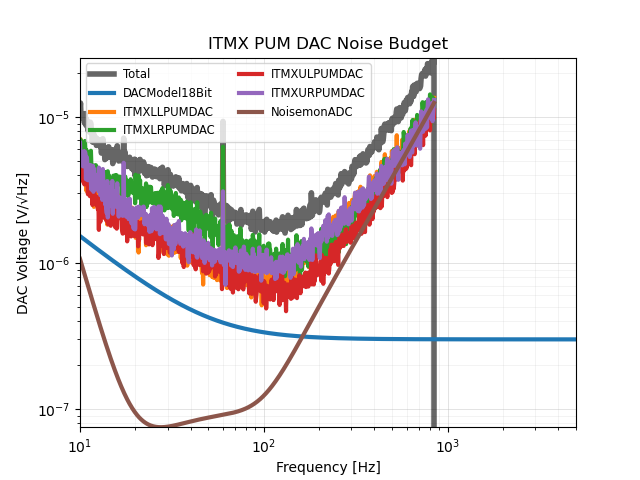
Sub-budget plots showing the performance of the individual channels are also attached.
TITLE: 10/24 Day Shift: 1430-2330 UTC (0730-1630 PST), all times posted in UTC
STATE of H1: Corrective Maintenance
SHIFT SUMMARY: NPRO work continues, other minor maintenance and opportunistic activities during the day as well.
LOG:
| Start Time | System | Name | Location | Lazer_Haz | Task | Time End |
|---|---|---|---|---|---|---|
| 14:33 | FAC | Karen | Opt Lab | n | Tech clean | 15:20 |
| 15:25 | Prop | Christina, Nichole | MY | n | Property searching | 17:23 |
| 15:25 | - | Camilla, Ryan S | LVEA | n | First contacting lenses | 16:14 |
| 15:45 | FAC | Tyler, Contractor | MY | n | Roof repair | 23:27 |
| 15:49 | FAC | Karen, Kim | LVEA | n | Tech clean | 18:04 |
| 16:10 | SEI | Jim | Desk/FCES | n | HAM8 TFs | 23:30 |
| 16:14 | PSL | Camilla | LVEA | n | Cleaning up TCSY equipment | 17:03 |
| 16:23 | SUS | Oli | CR/Ends | n | TMS TFs | 17:34 |
| 16:32 | TCS | Camilla, Ryan | LVEA | no | Cleaning Optics | 18:16 |
| 17:03 | PSL | Jason | PSL enclos. | local | NPRO swap | 18:27 |
| 18:05 | VAC | Gerardo | LVEA | n | Parts hunt | 18:13 |
| 18:37 | - | Camilla, Ryan S | LVEA | n | Optics cleaning continued | 18:49 |
| 20:26 | PSL | Jason, Ryan S | PSL enclos. | local | NPRO alignment | 00:26 |
| 21:22 | 21:23 | |||||
| 21:22 | HWS | TJ, Camilla | EX | yes | HWS table work | 22:45 |
| 21:47 | Safety | Danny | LVEA | N | Looking for Fall protection | 22:53 |
| 22:54 | PCAL | Tony | PCAL lab | local | PCAL meas | 23:10 |
| 23:07 | - | Camilla, Oli | LVEA | n | Moving N2 tank, cleanup | 23:27 |
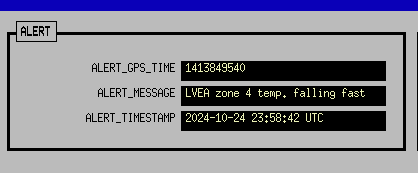
FMCSSTAT is currently RED on the CDS Overview due to a sharp increase in LVEA Zone4 temperature (around HAM6) at 08:59 PDT. TJ confirmed this was due to powering up a clean room.
A reminder that the FMCSSTAT button on the CDS Overview stays RED for up to 2 hours after the alert to give everyone time to see it.
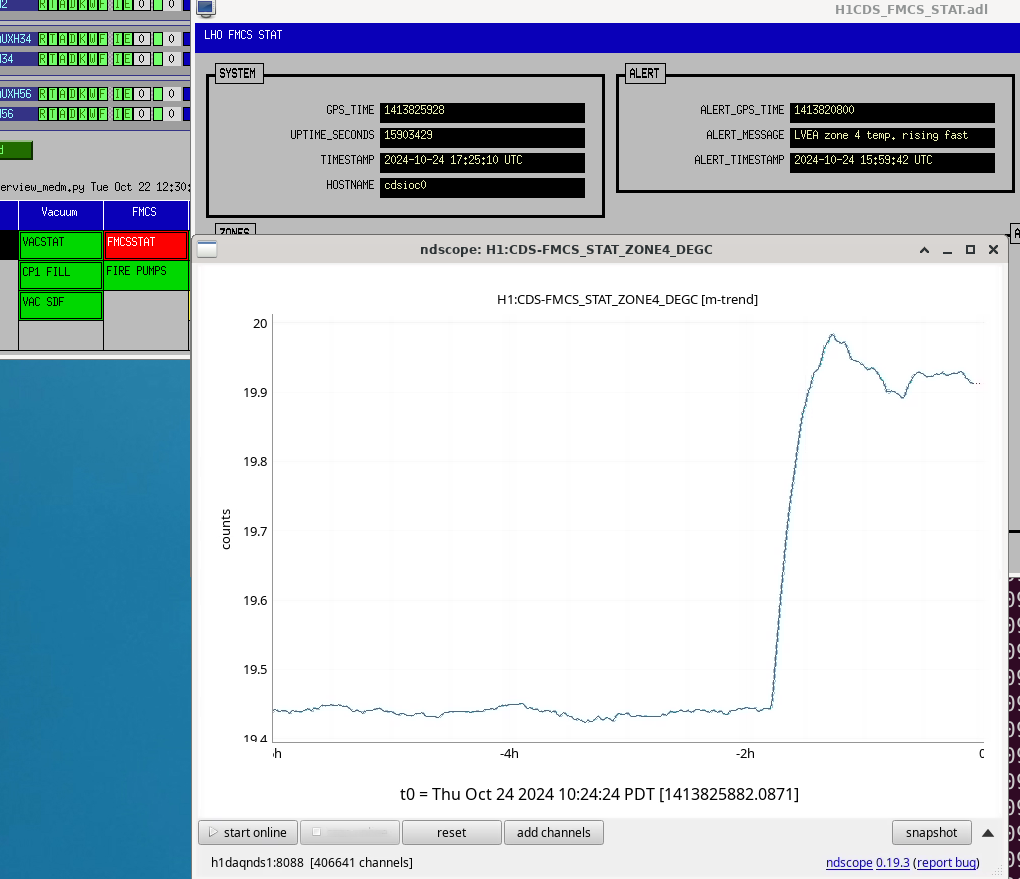
Megaclean room was turned off ~4:15pm.
FMCS STAT correctly reported the cool down of zone4
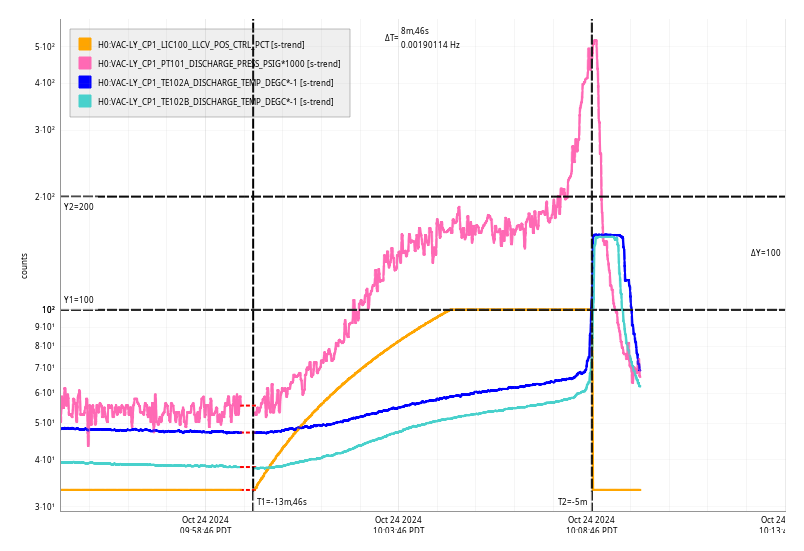
Thu Oct 24 10:08:46 2024 INFO: Fill completed in 8min 42secs
Gerardo confirmed a good fill curbside.
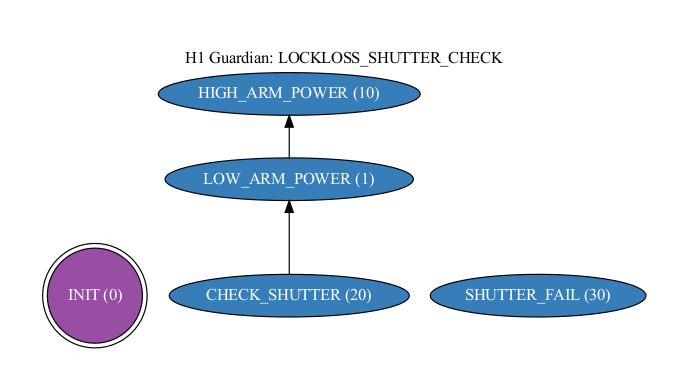
Last week (alog80749) the LOCKLOSS_SHUTTER_CHECK guardian node was stuck after not receiving the data it asked nds for. We've seen this happen in the past and I've written some wrapper functions to help with this - (userapps)/sys/h1/guardian/timeout_utils.py. While looking through the code with Sheila and Dave separately, it definitely seems like this node has been edited a bit and has been left in an odd state in need of cleanup. So I:
We also noticed that ISC_LOCK doesn't actually look directly at this node before powering up anymore. I looks like it was commented out in Dec 2018 for some SRY testing, then never put back in. The node was still watched by the top level IFO node, so it would still have stopped us from Observing, as it was the case last week. I moved that bit of code to the AS_SHUTTERS state where we already check the FAST_SHUTTER node (this node runs a test on the shutter before power up vs LOCKLOSS_SHUTTER_CHECK will check if it fired during the last high power lock loss). This way we won't power up if there was no GS13 kick on the last high power lock loss.
I tested the LOCKLOSS_SHUTTER_CHECK node by running it through the checks normally, and with the value of the GS13 kick incredibly low so it would flag a failure. This node is loaded and ready, and I reloaded ISC_LOCK with the new conditional in the AS_SHUTTERS state, though I have no yet ran this state since we have no IFO right now.
Sheila, Daniel, Vicky
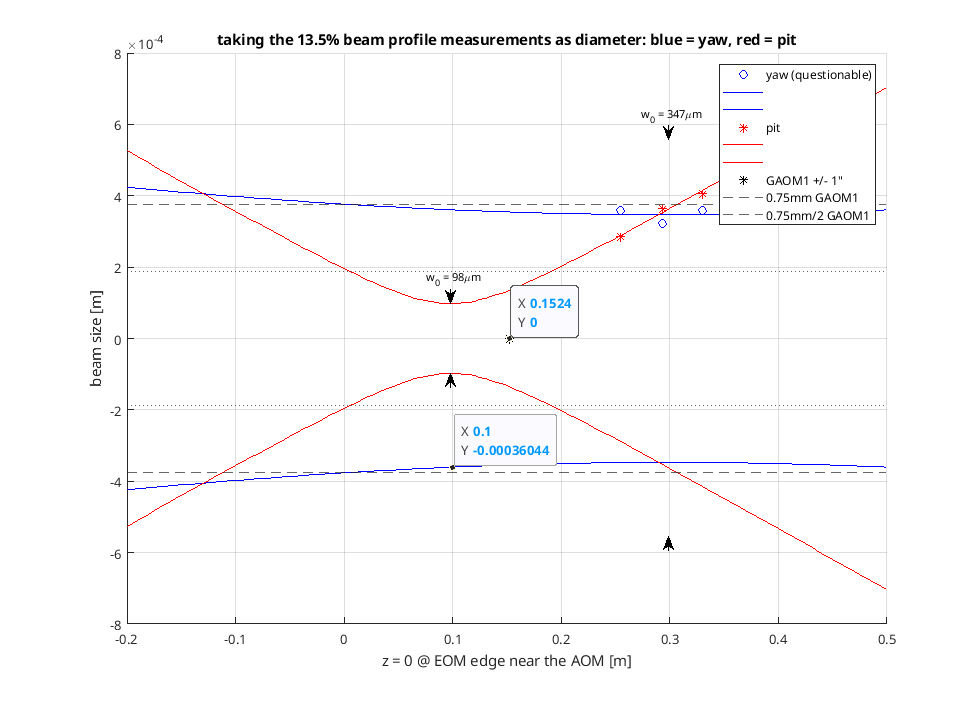
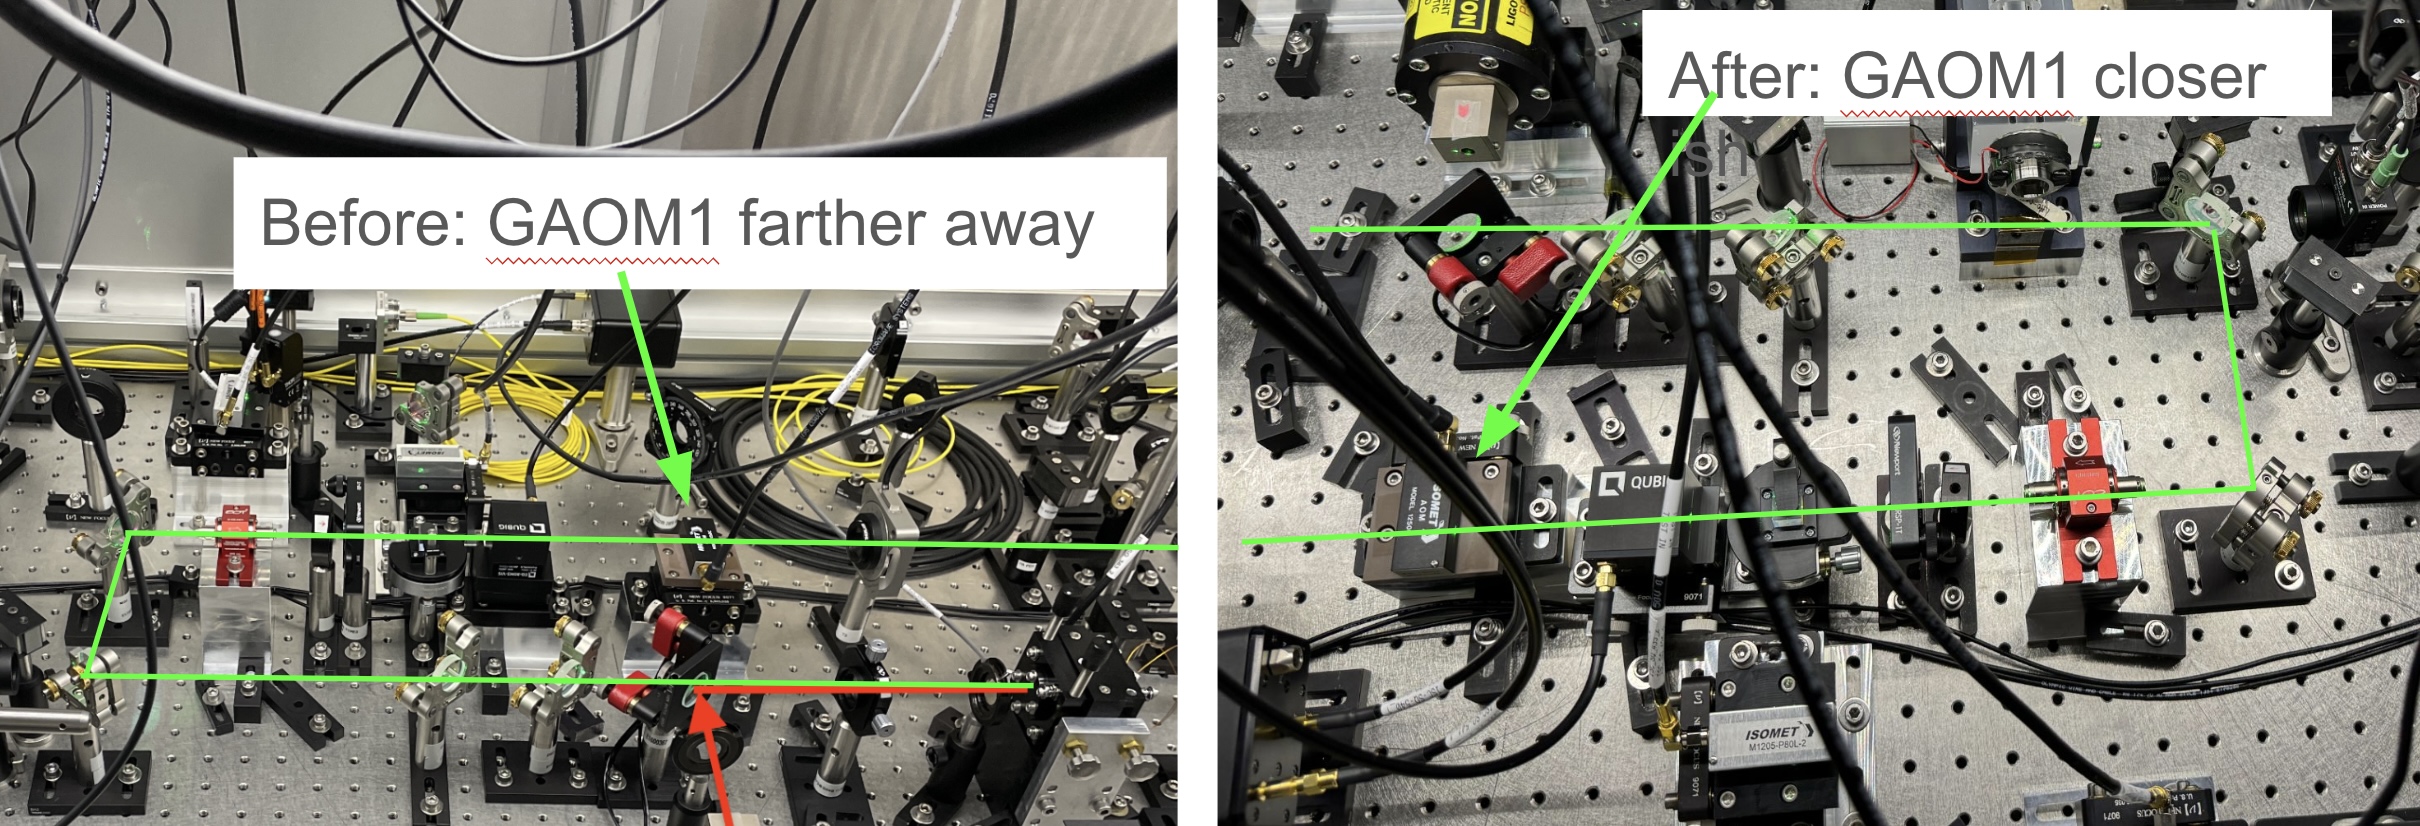
On Tuesday, Sheila and I took some beam profiles of the squeezer pump beam after the pump AOM used for ISS (GAOM1). This is trying to understand and fix the squeezer pump ISS issues that result from GAOM1 becoming misaligned on SQZT0.
Summary and proposed plan: the vertical beam profile we measured looks reasonable, the horizontal profile looks off (potentially related to measuring after the AOM). We could move GAOM1 closer to SHG by 1-2 holes to get closer to the beam waist of ~100um that is about 1.3m after SHG. While GAOM1 is out, we could re-measure the horizontal beam profile to make sure it is OK.
Here are plots of the pitch beam profiles we took before, and the very quick a la mode plot code that adapts Sheila's and Georgia's previous codes. I think the vertical beam profiles we took line up with Georgia's previous measurements and D1201210, which both say there should be a waist like 1.25m - 1.3m after SHG. In real life, we measured from z=0 at the EOM mount edge closest to GAOM1, to the face of the beam profiler (may need to take into account beam profile distance..).
So it seems possible that GAOM1 is like 0.02-0.05 meters (~2 inches?) downstream of the waist. From photos and SQZT0 layout D1201210, there is room to try moving GAOM1 closer to L15 (closer to SHG) by 1-2 holes.
Useful DCC references:
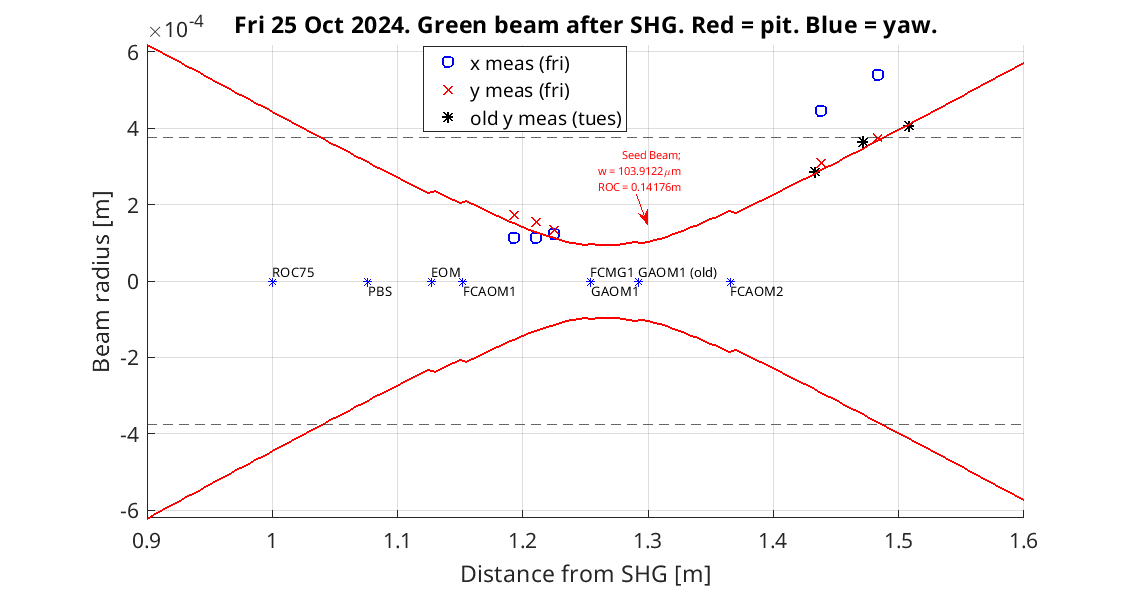
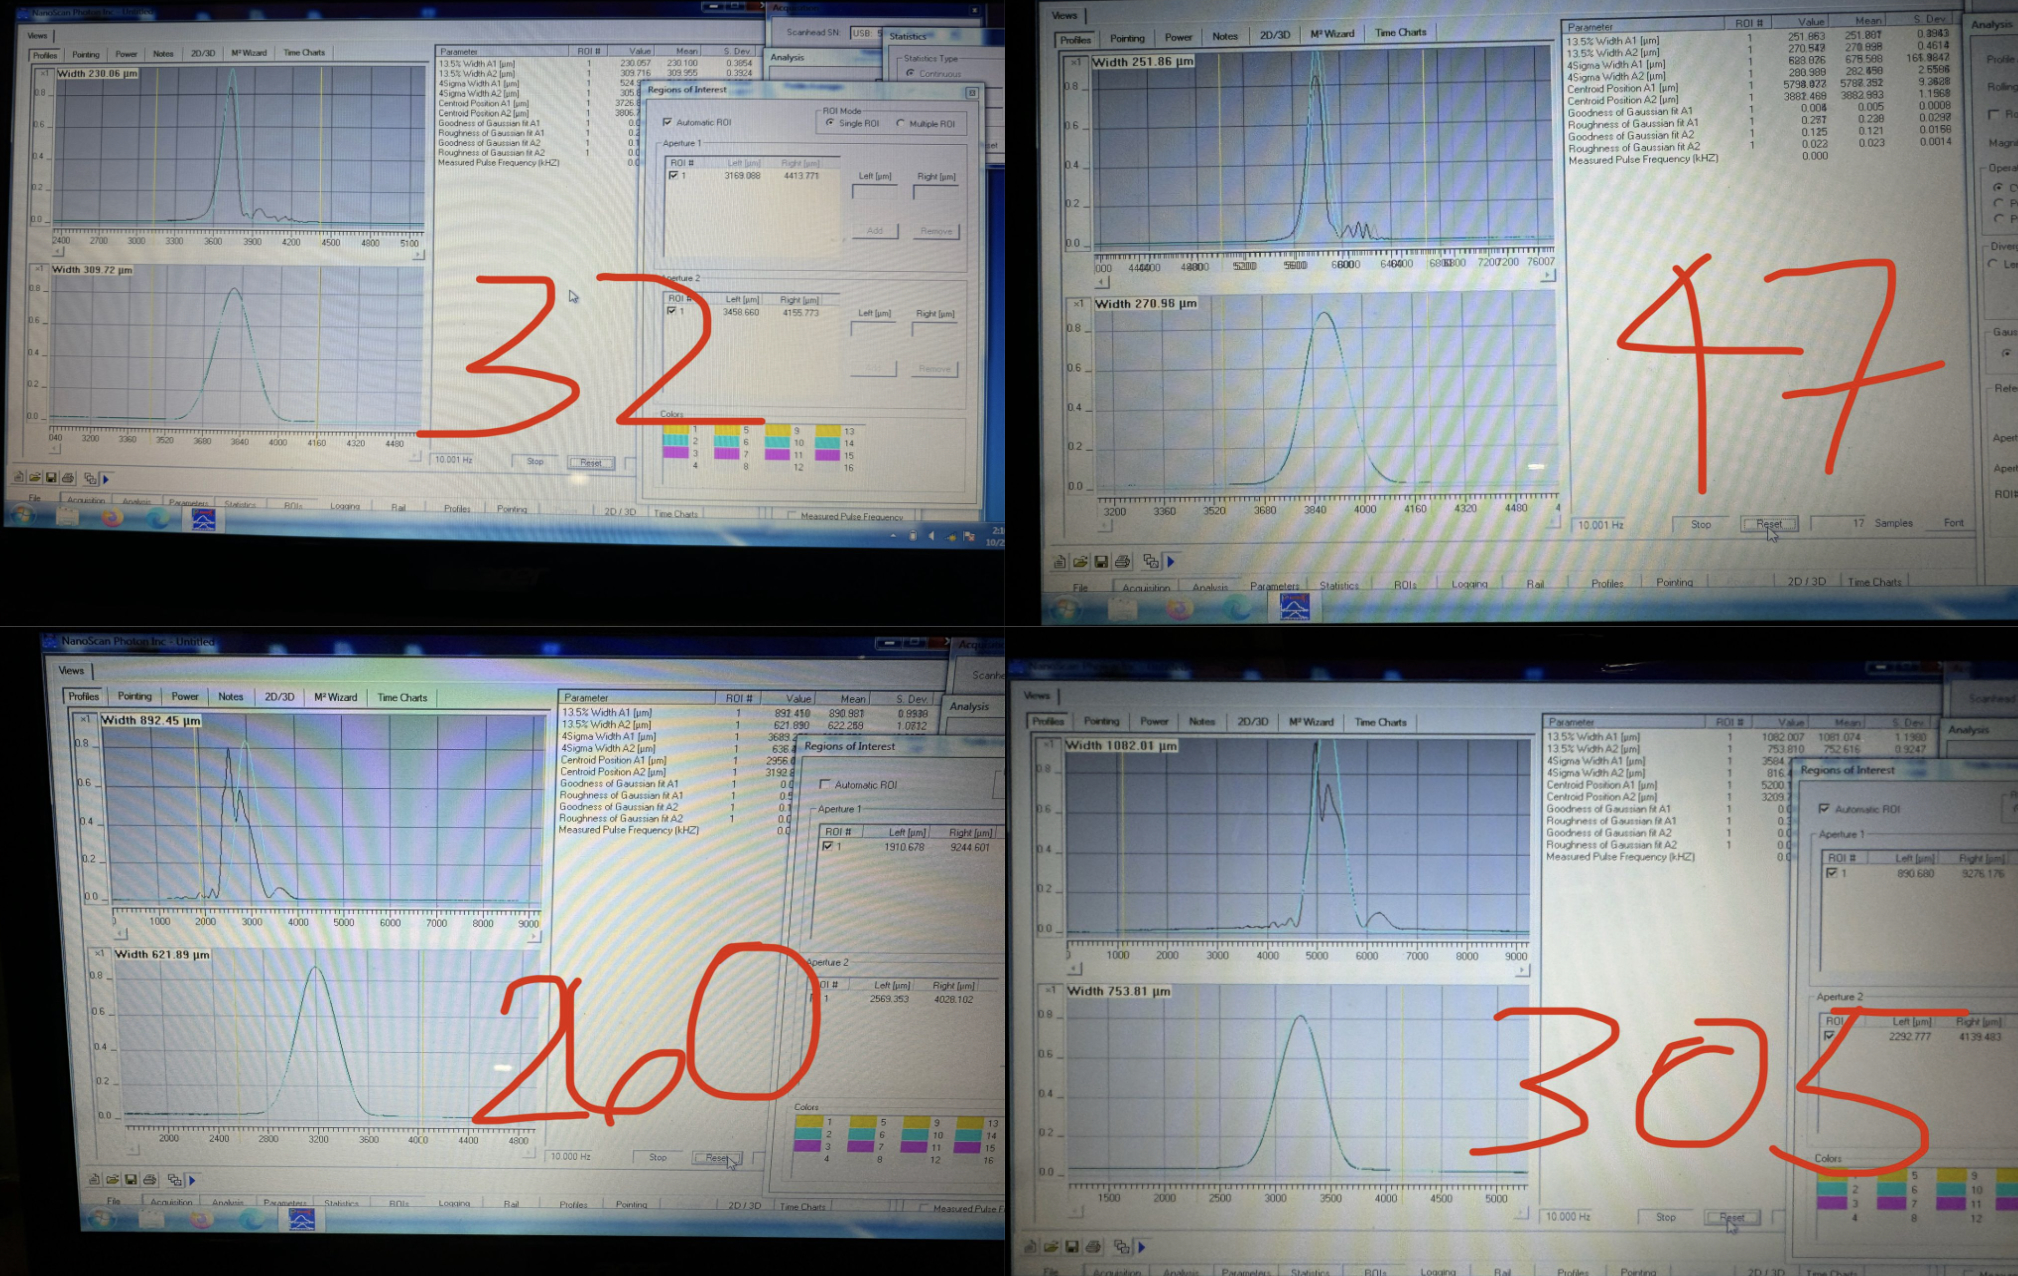
On Friday, Sheila and I measured some beam profiles of the SHG output path without the pump AOM and EOM, then moved GAOM1 ~1" closer to SHG than before (as we wanted to try: photo), and finally re-aligned through GAOM1 and the pump fiber. Overall, the squeezer pump ISS is working and ready.
With GAOM1 an inch closer to SHG, maybe GAOM1 alignment got smoother than before. We have an alignment that can optimize both 0-th order throughput and diffraction efficiency, which seemed problematic in recent realignments (eg 80266, 79993, 78519). With 43mW into GAOM1, we transmitted 40mW at 0V (so 40/43 = 93% throughput), while being able to diffract ~15mW at 5V (28.5 dBm), so ~35% diffraction efficiency. Seems ok-good compared to recent re-alignments.
On Friday, with 20 mW launched into the fiber, we had about 2 (BS50:50) * (2.2mW (opo_refl unlocked) + 1mW (opo_refl_rejected)) = 6.4mW through the fiber, so 6.4/20 ~ 32% throughput even with ~0.1mW mis-polarized light.
Given the questionable yaw beam quality when no parts are installed on the SHG output path, and the dependence of yaw beam profile on SHG temperature, it might require work on SHG to totally solve the beam quality issues. Unclear that further mode-matching adjustments will fix it.
Update from Monday: Camilla and I went to SQZT0 and touched up pump fiber coupling. Also touched the alignment on pump GAOM1 to check.
J. Kissel echoing E. Dohmen

Just a bit of useful info from E.J. that I think others might be interested in (and giving myself bread crumbs to find the info in the future):

- The PRODUCTION (H1 included) systems are only at 5.1.4 with no plans on upgrading soon.

- h1susetmx computer, however is at a prototype version of 5.3.0 in order to support LGIO DAC testing (see LHO:79735)

- One can find the running release notes for modern versions (since RCG 2.0) of the RCG at
https://git.ligo.org/cds/software/advligorts/-/blob/master/NEWS?ref_type=heads
This information is also shown on the CDS overview. Models with a purple mark are built using a non-production RCG version. Clicking on the purple mark opens the RCG MEDM for more details.
Please see alog-78920 for details.
FWIW - The Stanford test stands are running RCG 5.3 to allow development and testing of the SPI readout code.
There's also some release notes here:
Vicky, Sheila
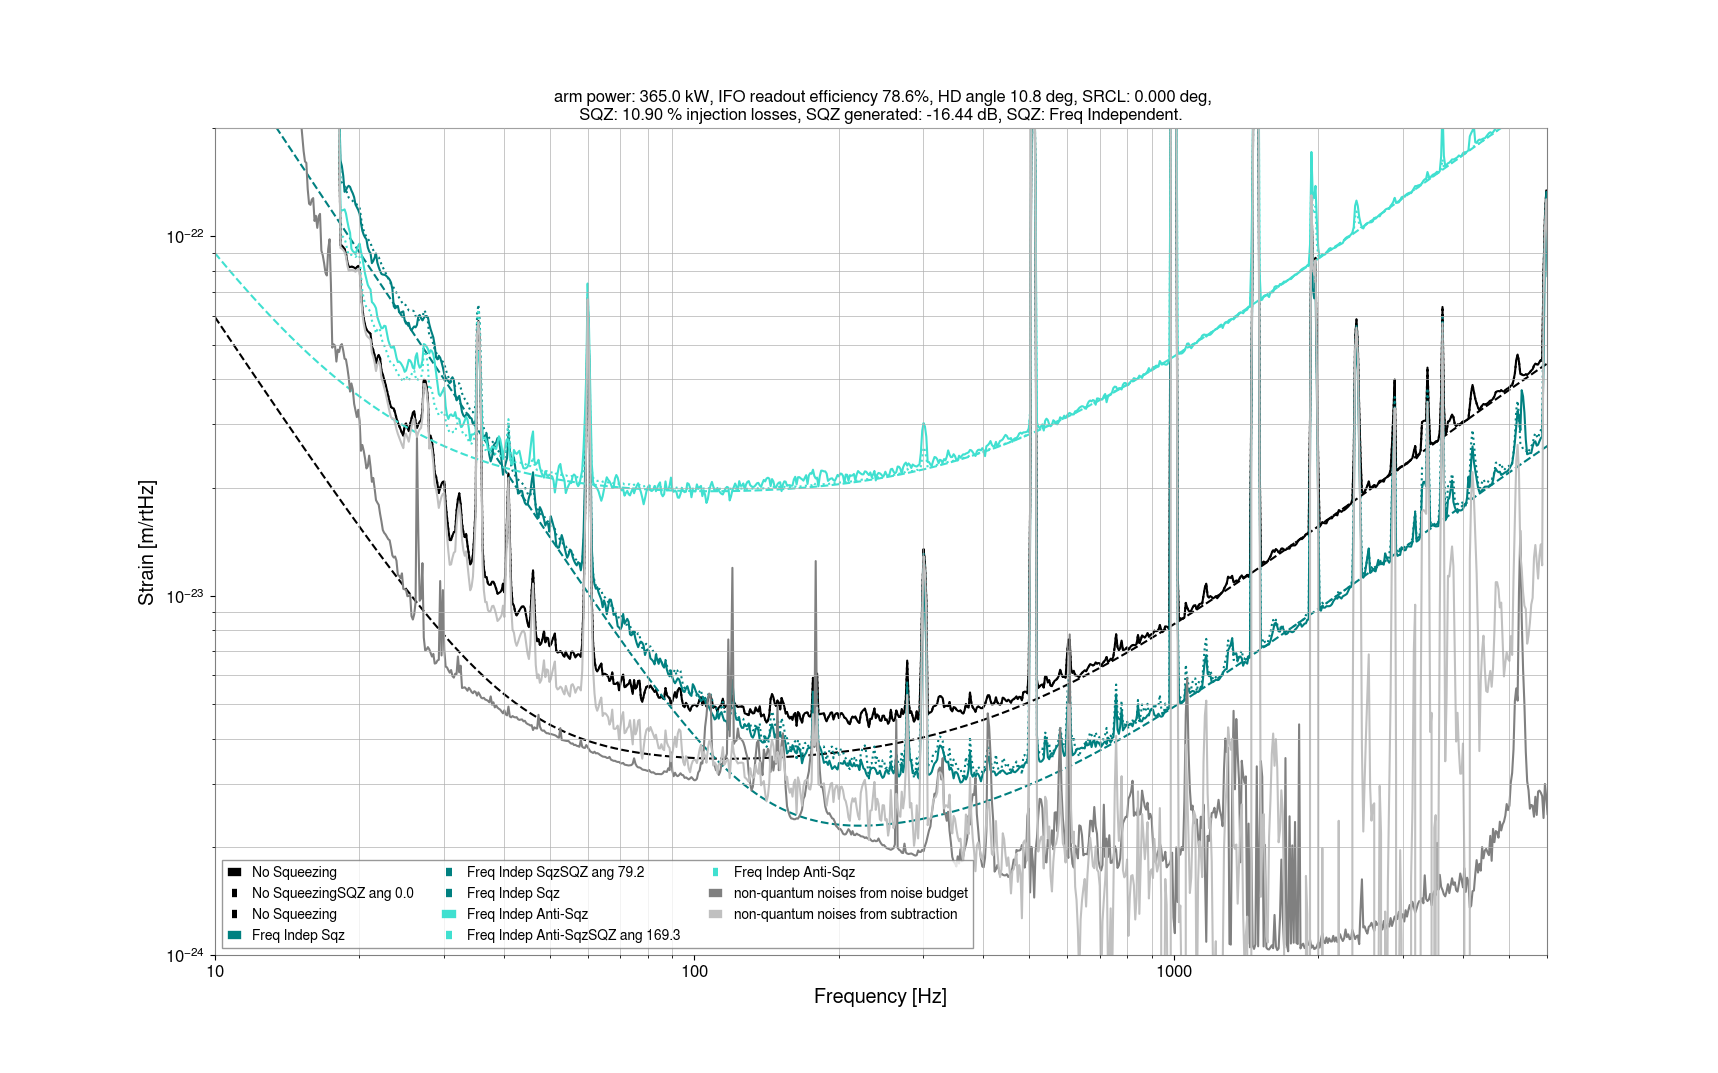
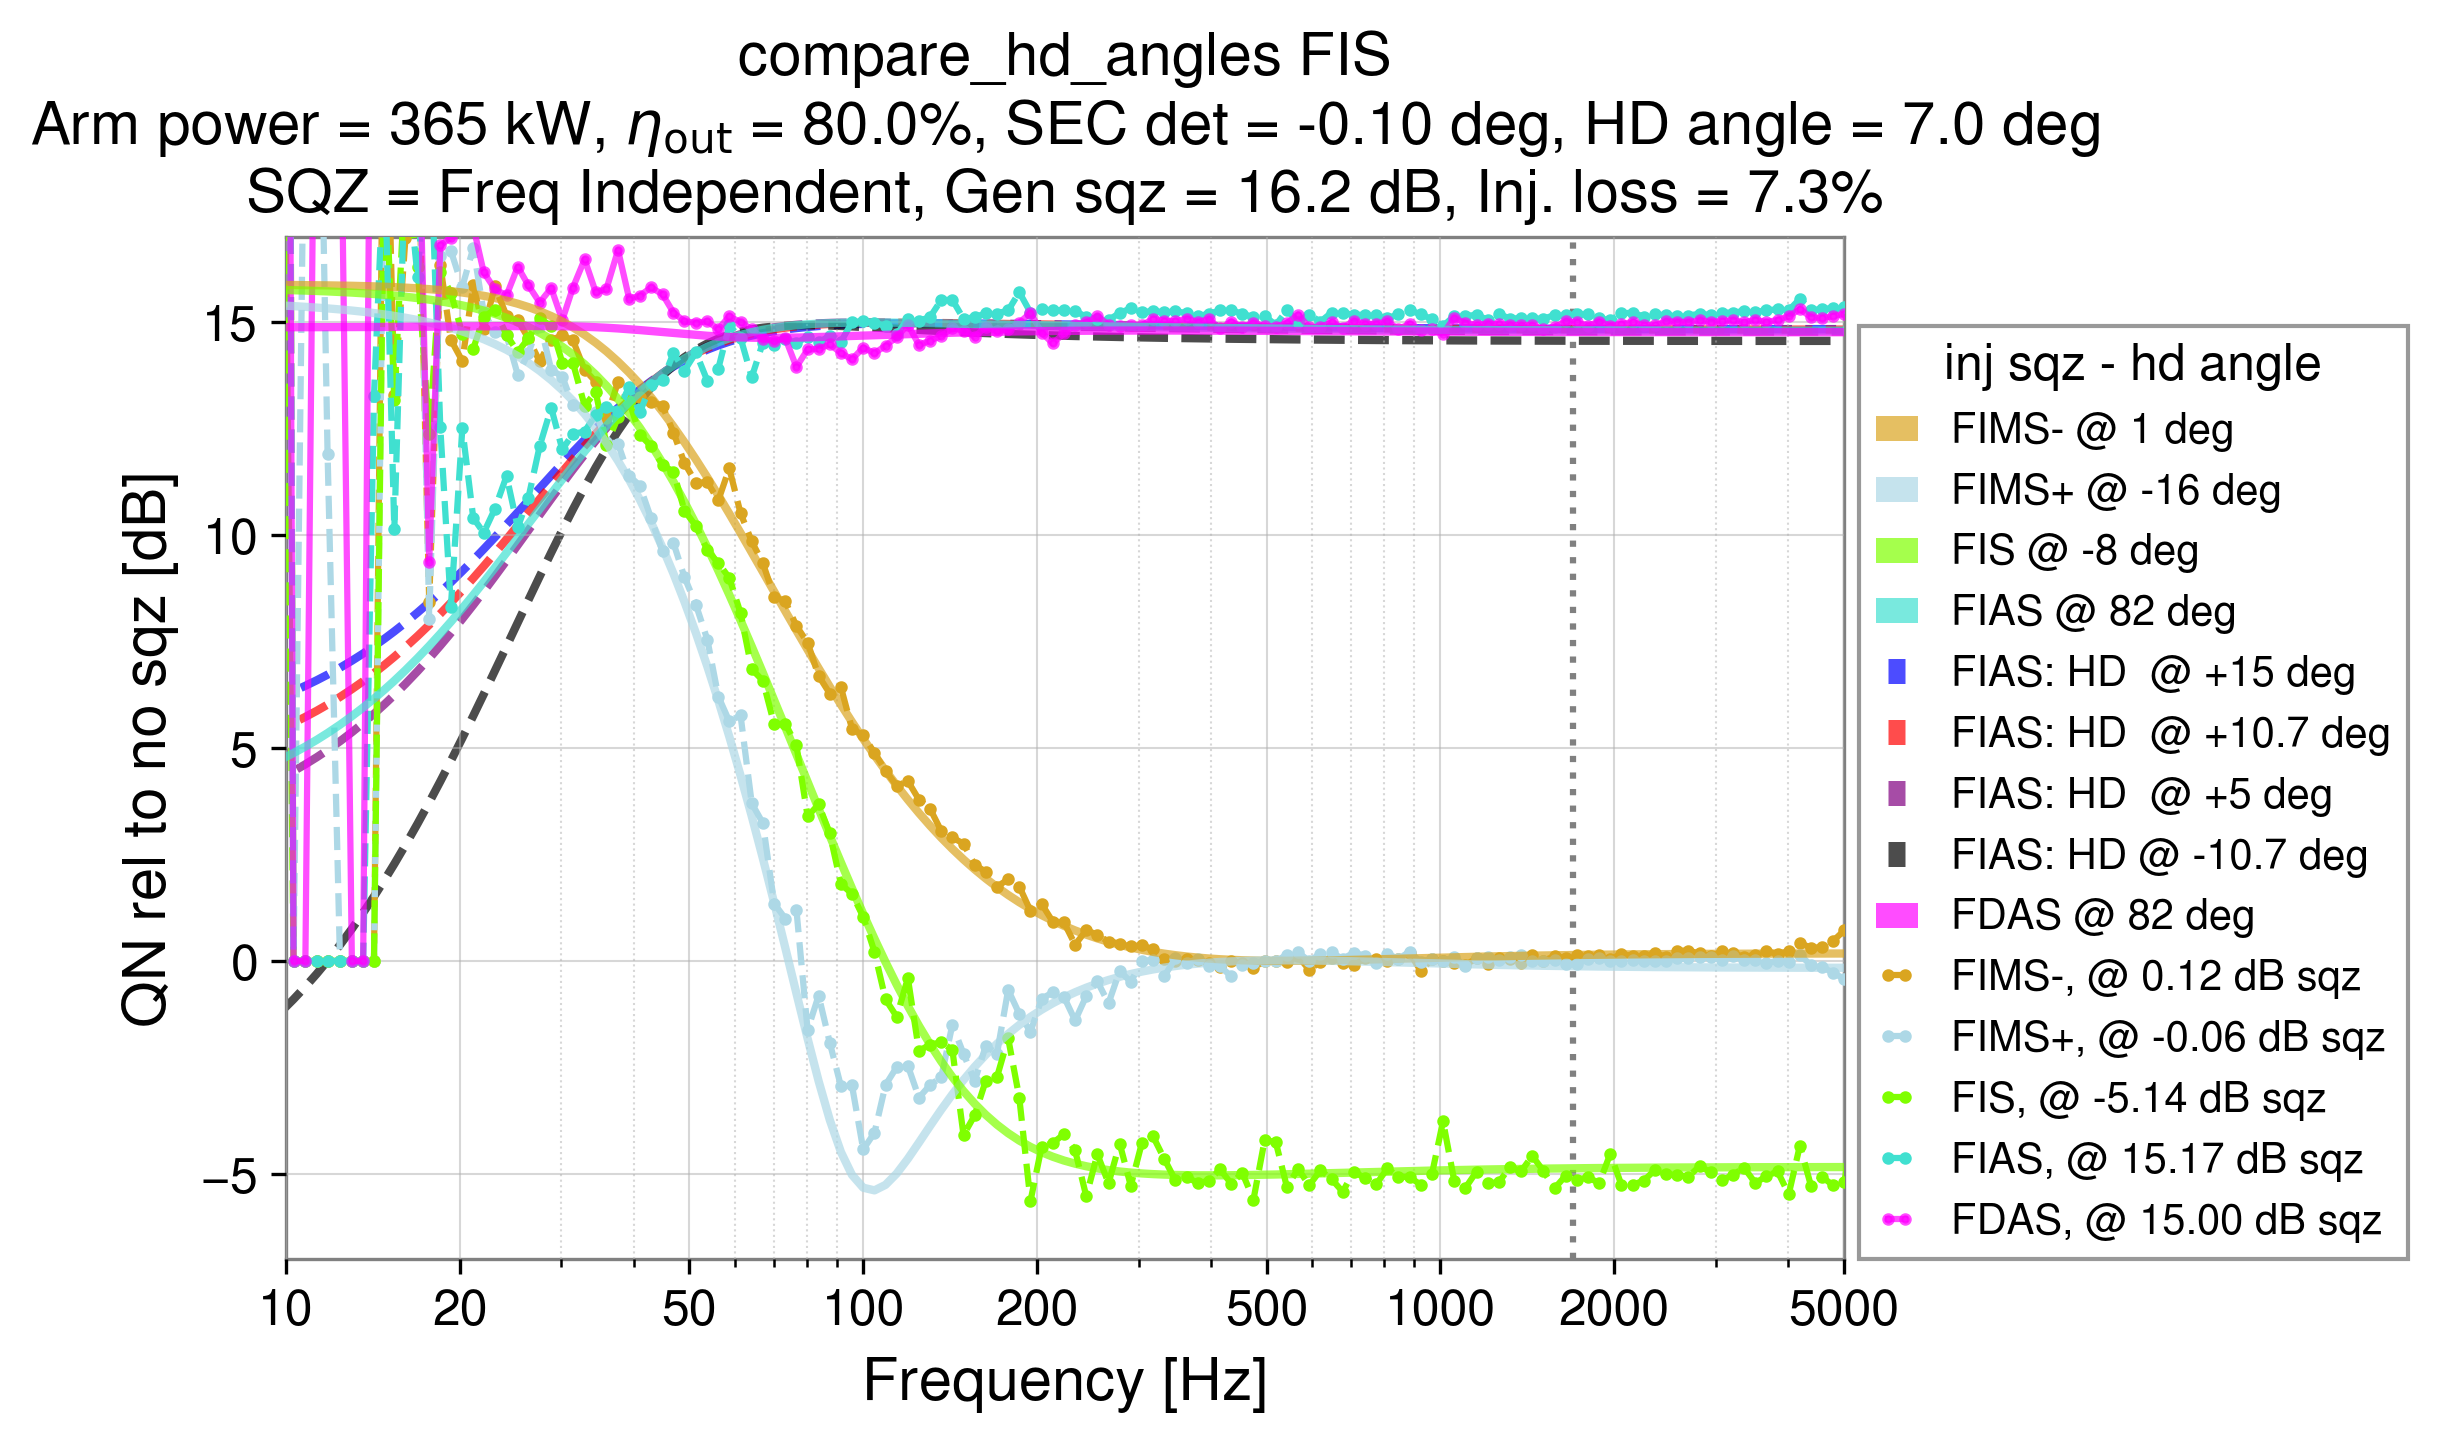
Summary: Today we learned that frequency independent anti-squeezing is a very good way to determine which sign the homodyne angle is.
Background: I've been working on using code from Vicky's repo and the noise budget repo to do some checks of a quantum noise model, this is in a new repo here.
Details about how this model is made:
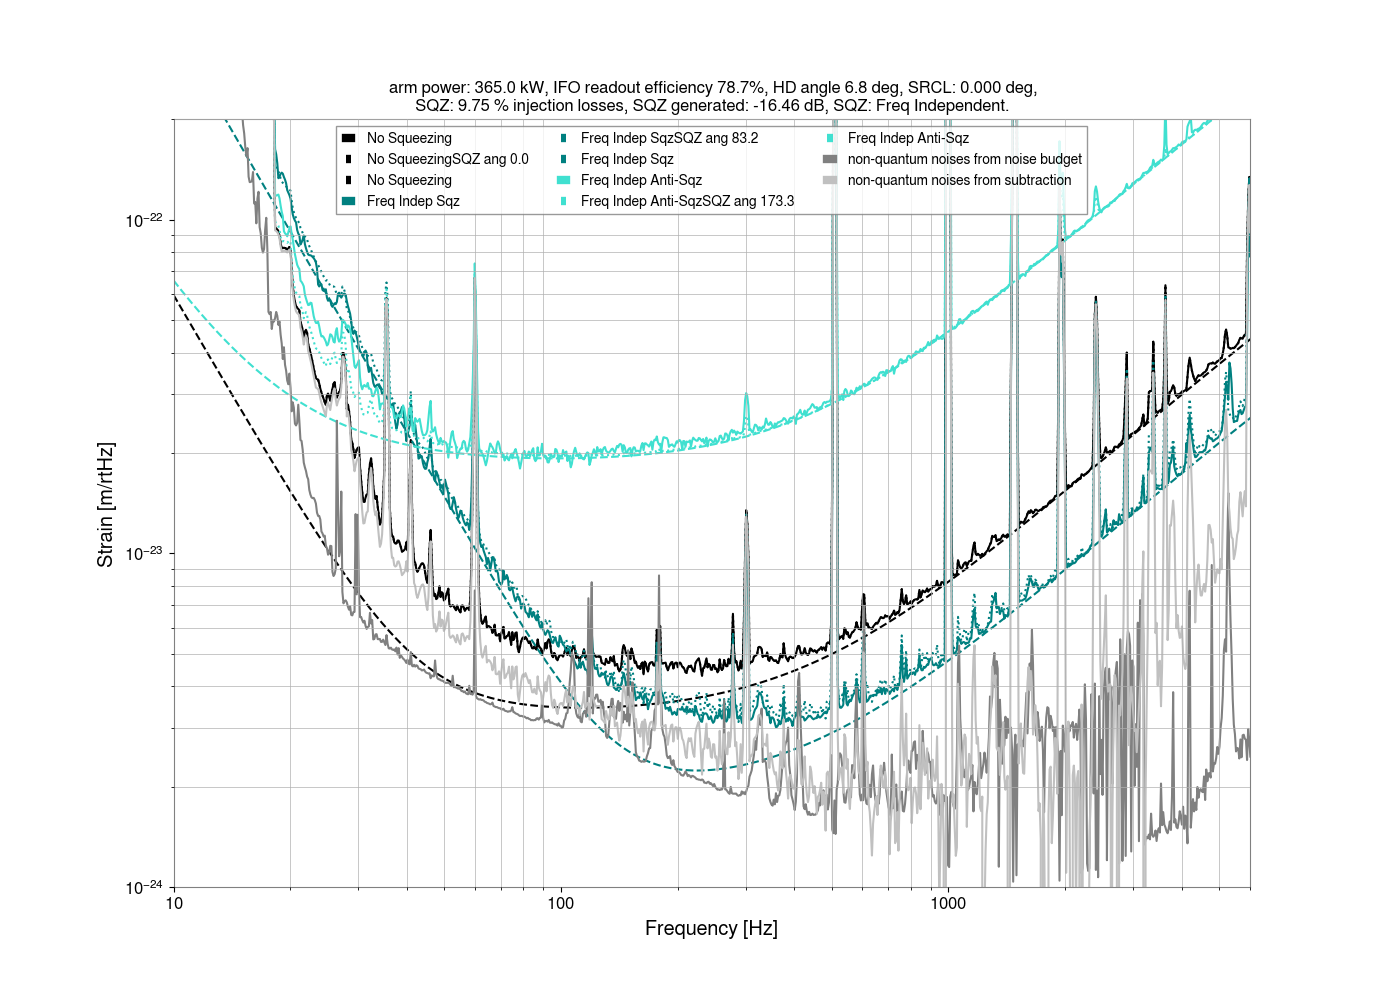
The first attached plot illustrates how these models and plots are made. It starts with a no squeezing time, and an esitmate of non quantum noises from the noise budget, (dark gray, this one is from Elenna's recent run of the noise budget: 80603 ) and an estimate of the arm circulating power along with other parameters set in a quantum parameters file in the same format that is used by the noise budget. It fits the readout losses by adding a gwinc model of quantum noise with the noise budget estimate of other noises, and adjusting the readout losses of the gwinc model, this is done from 1.5-1.8kHz in this case.
Based on this readoutlosses we get a model of quantum noise without squeezing, and subtract that from the no squeezing trace to get an estimate of the non-quantum noise. This is enough different from the noise budget one that I've used that as the estimate of the non-quantum noise for the rest of the traces.
By subtracting this subtraction estimate of the non-quantum noise, it estimates squeezing in dB, and finds a median level of dB from 1.5-1.8kHz for anti-squeezing and squeezing. This should be the same with and without the filter cavity, but in this data set there is slightly more anti-squeezing in the time without the filter cavity, so I've used FIS and FIAS to estimate the nonlinear gain and total efficiency for squeezing. The nonlinear gain is translated into generated squeezing for gwinc, and the injection losses for squeezing are set so that the injection efficiency* readout efficiency = total squeezing efficieny.
With this information we can generate models for anti-squeezing and squeezing traces, but fitting the squeezing angle to minimize or maximize quantum noise. Then for the mid angle traces, the squeezing angle is fit to minimize the residual between the data and the quadrature sum of the subtraction estimate of non quantum noise and the model. We can then look at these plots and try manually changing parameter in the quantum parameter file.
Homodyne angle:
We've been stumped for a while about the excess noise we see with low frequency anti-squeezing, in 79775 I went through old alogs and see that we've had this mismatch of model with our data for a long time. Today we tried flipping the sign of the homodyne angle and see that low frequency anti-squeezing is much closer to fit both with and without the filter cavity. Compare the 2nd and 3rd attachments to see this.
We still have more work to do on this model, including adding in the additional traces near squeezing and near anti-squeezing that Camilla took, and checking if it can give us any information about arm power (it doesn't seem very useful for that), or the mode mismatches.
I neglected to mention that this is based on the nice data set that Camilla collected here: 80664, and that three is more work to be done with this, checking SRC detuning, mode mismatch, and including the +/- 10 deg data.
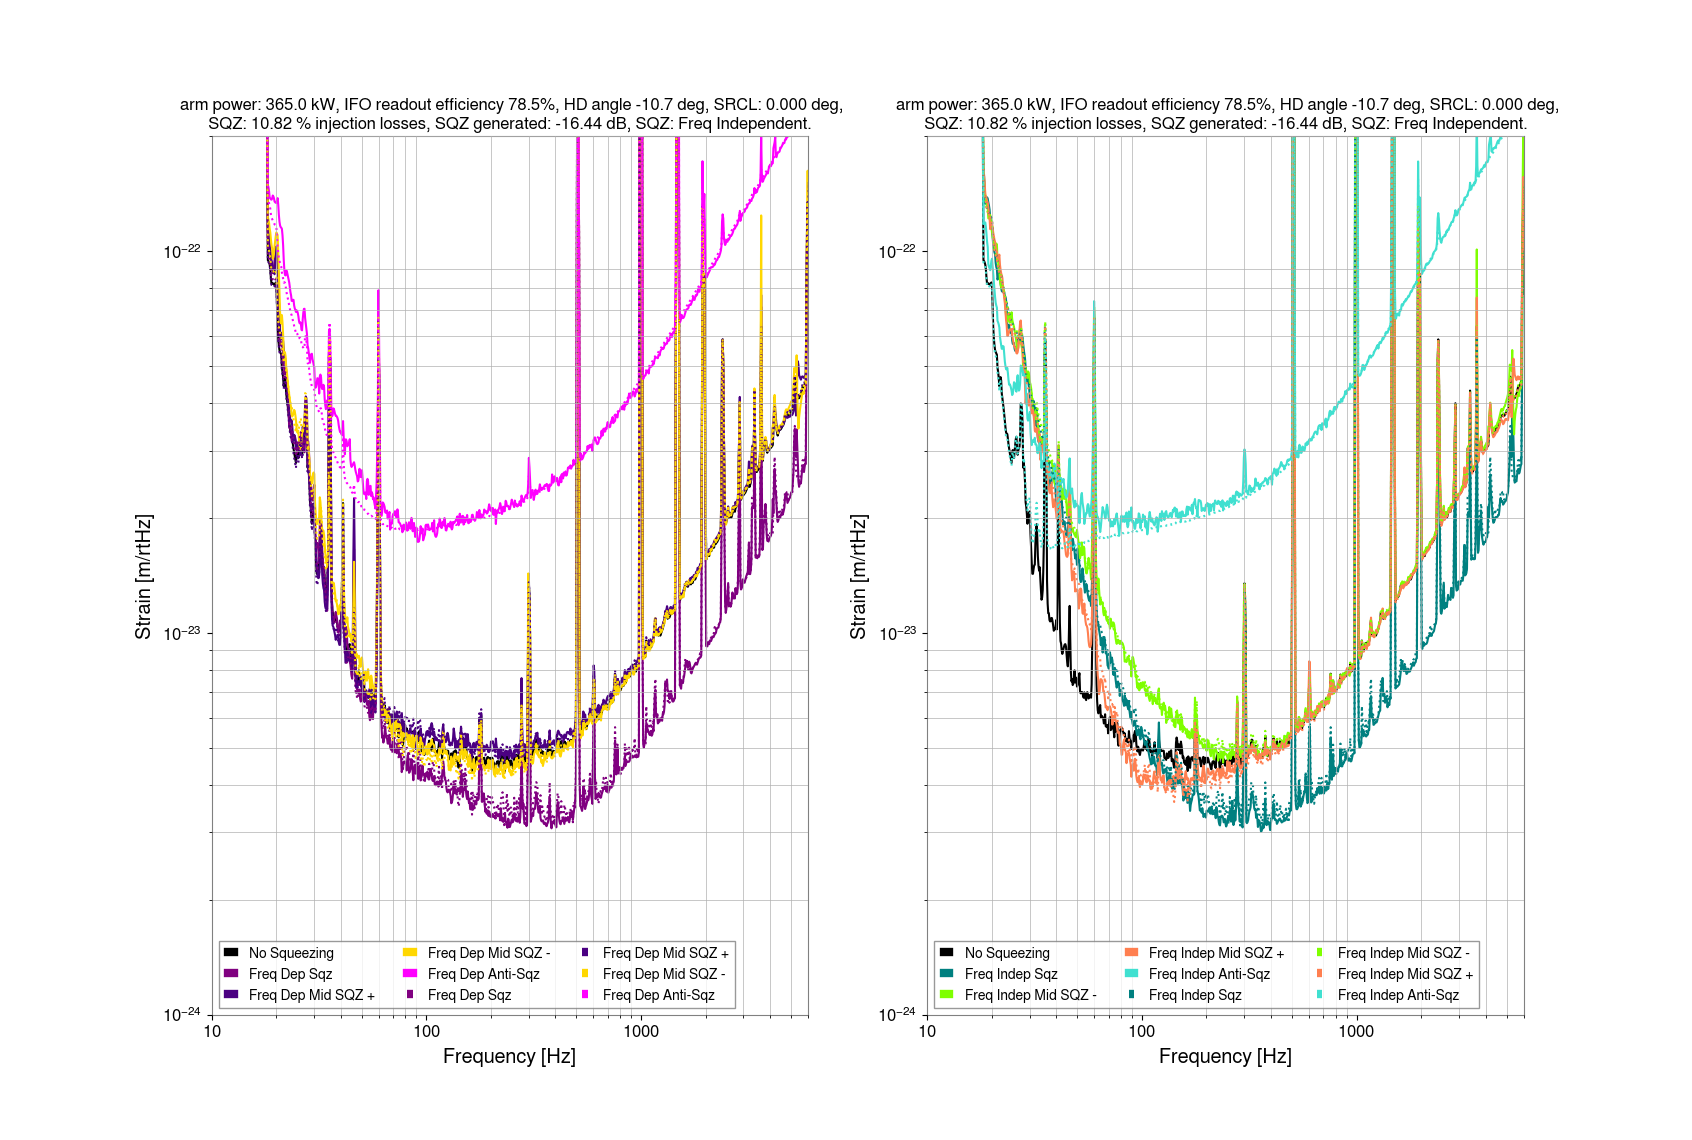
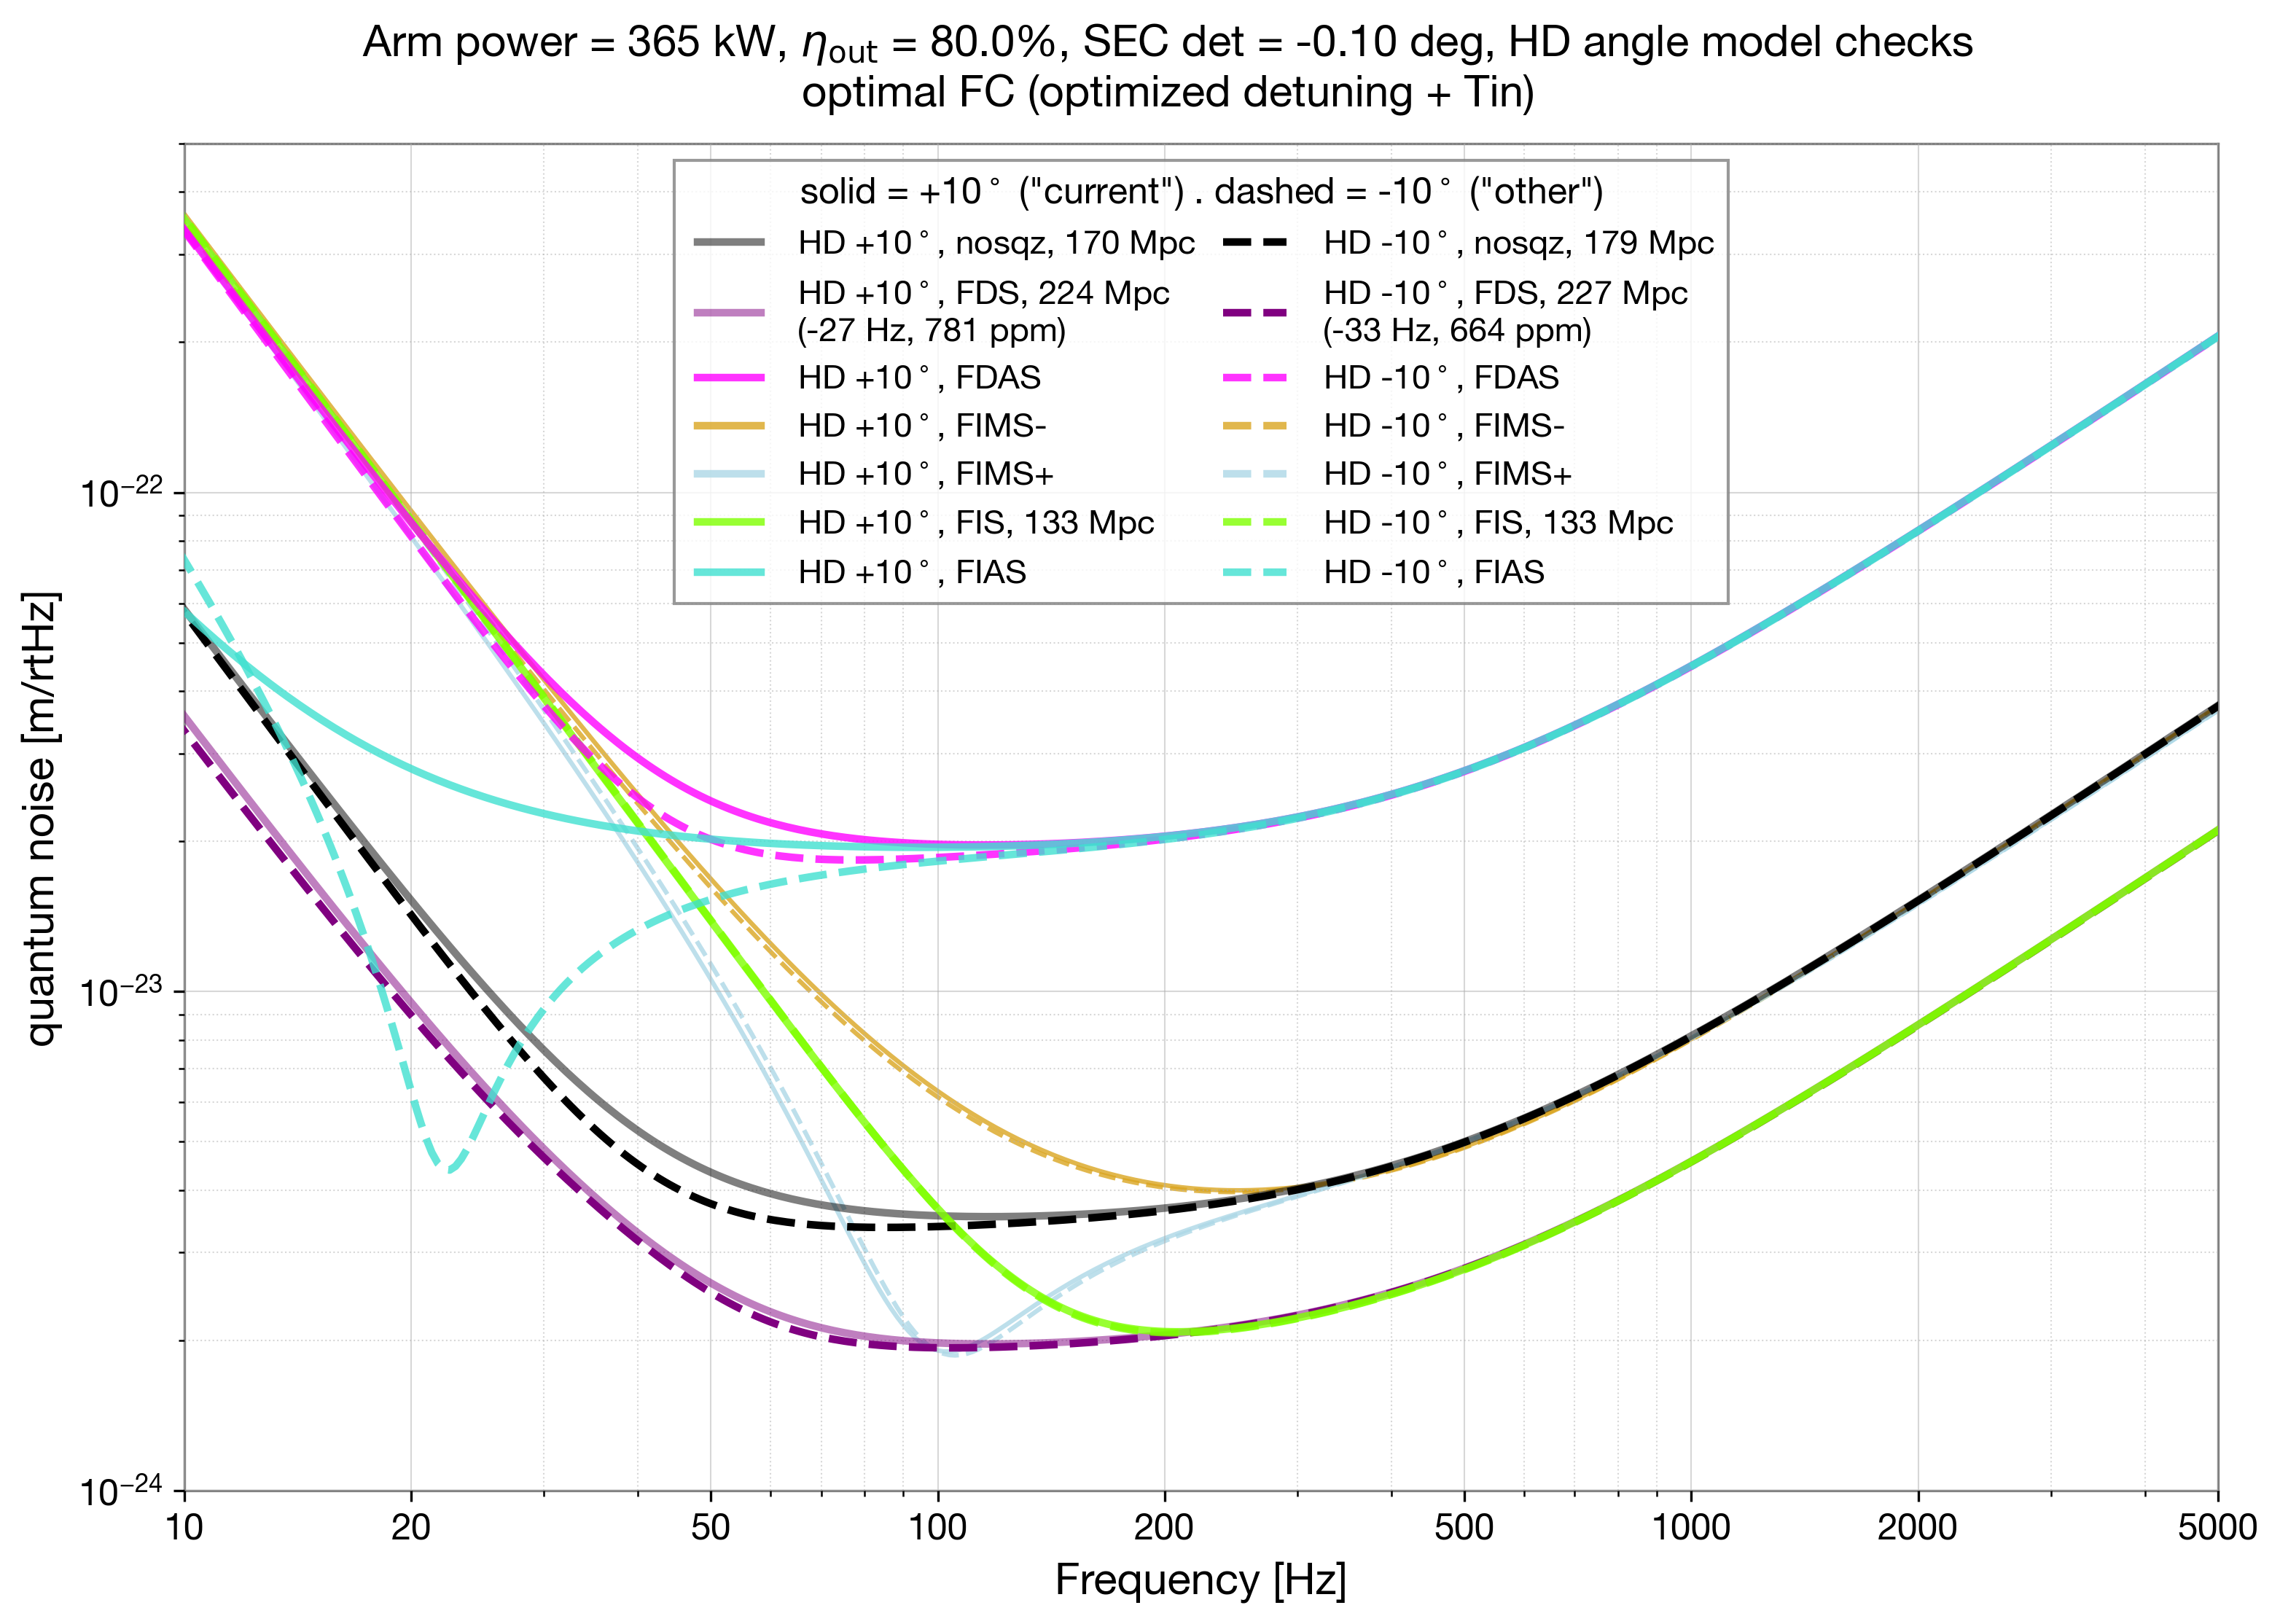
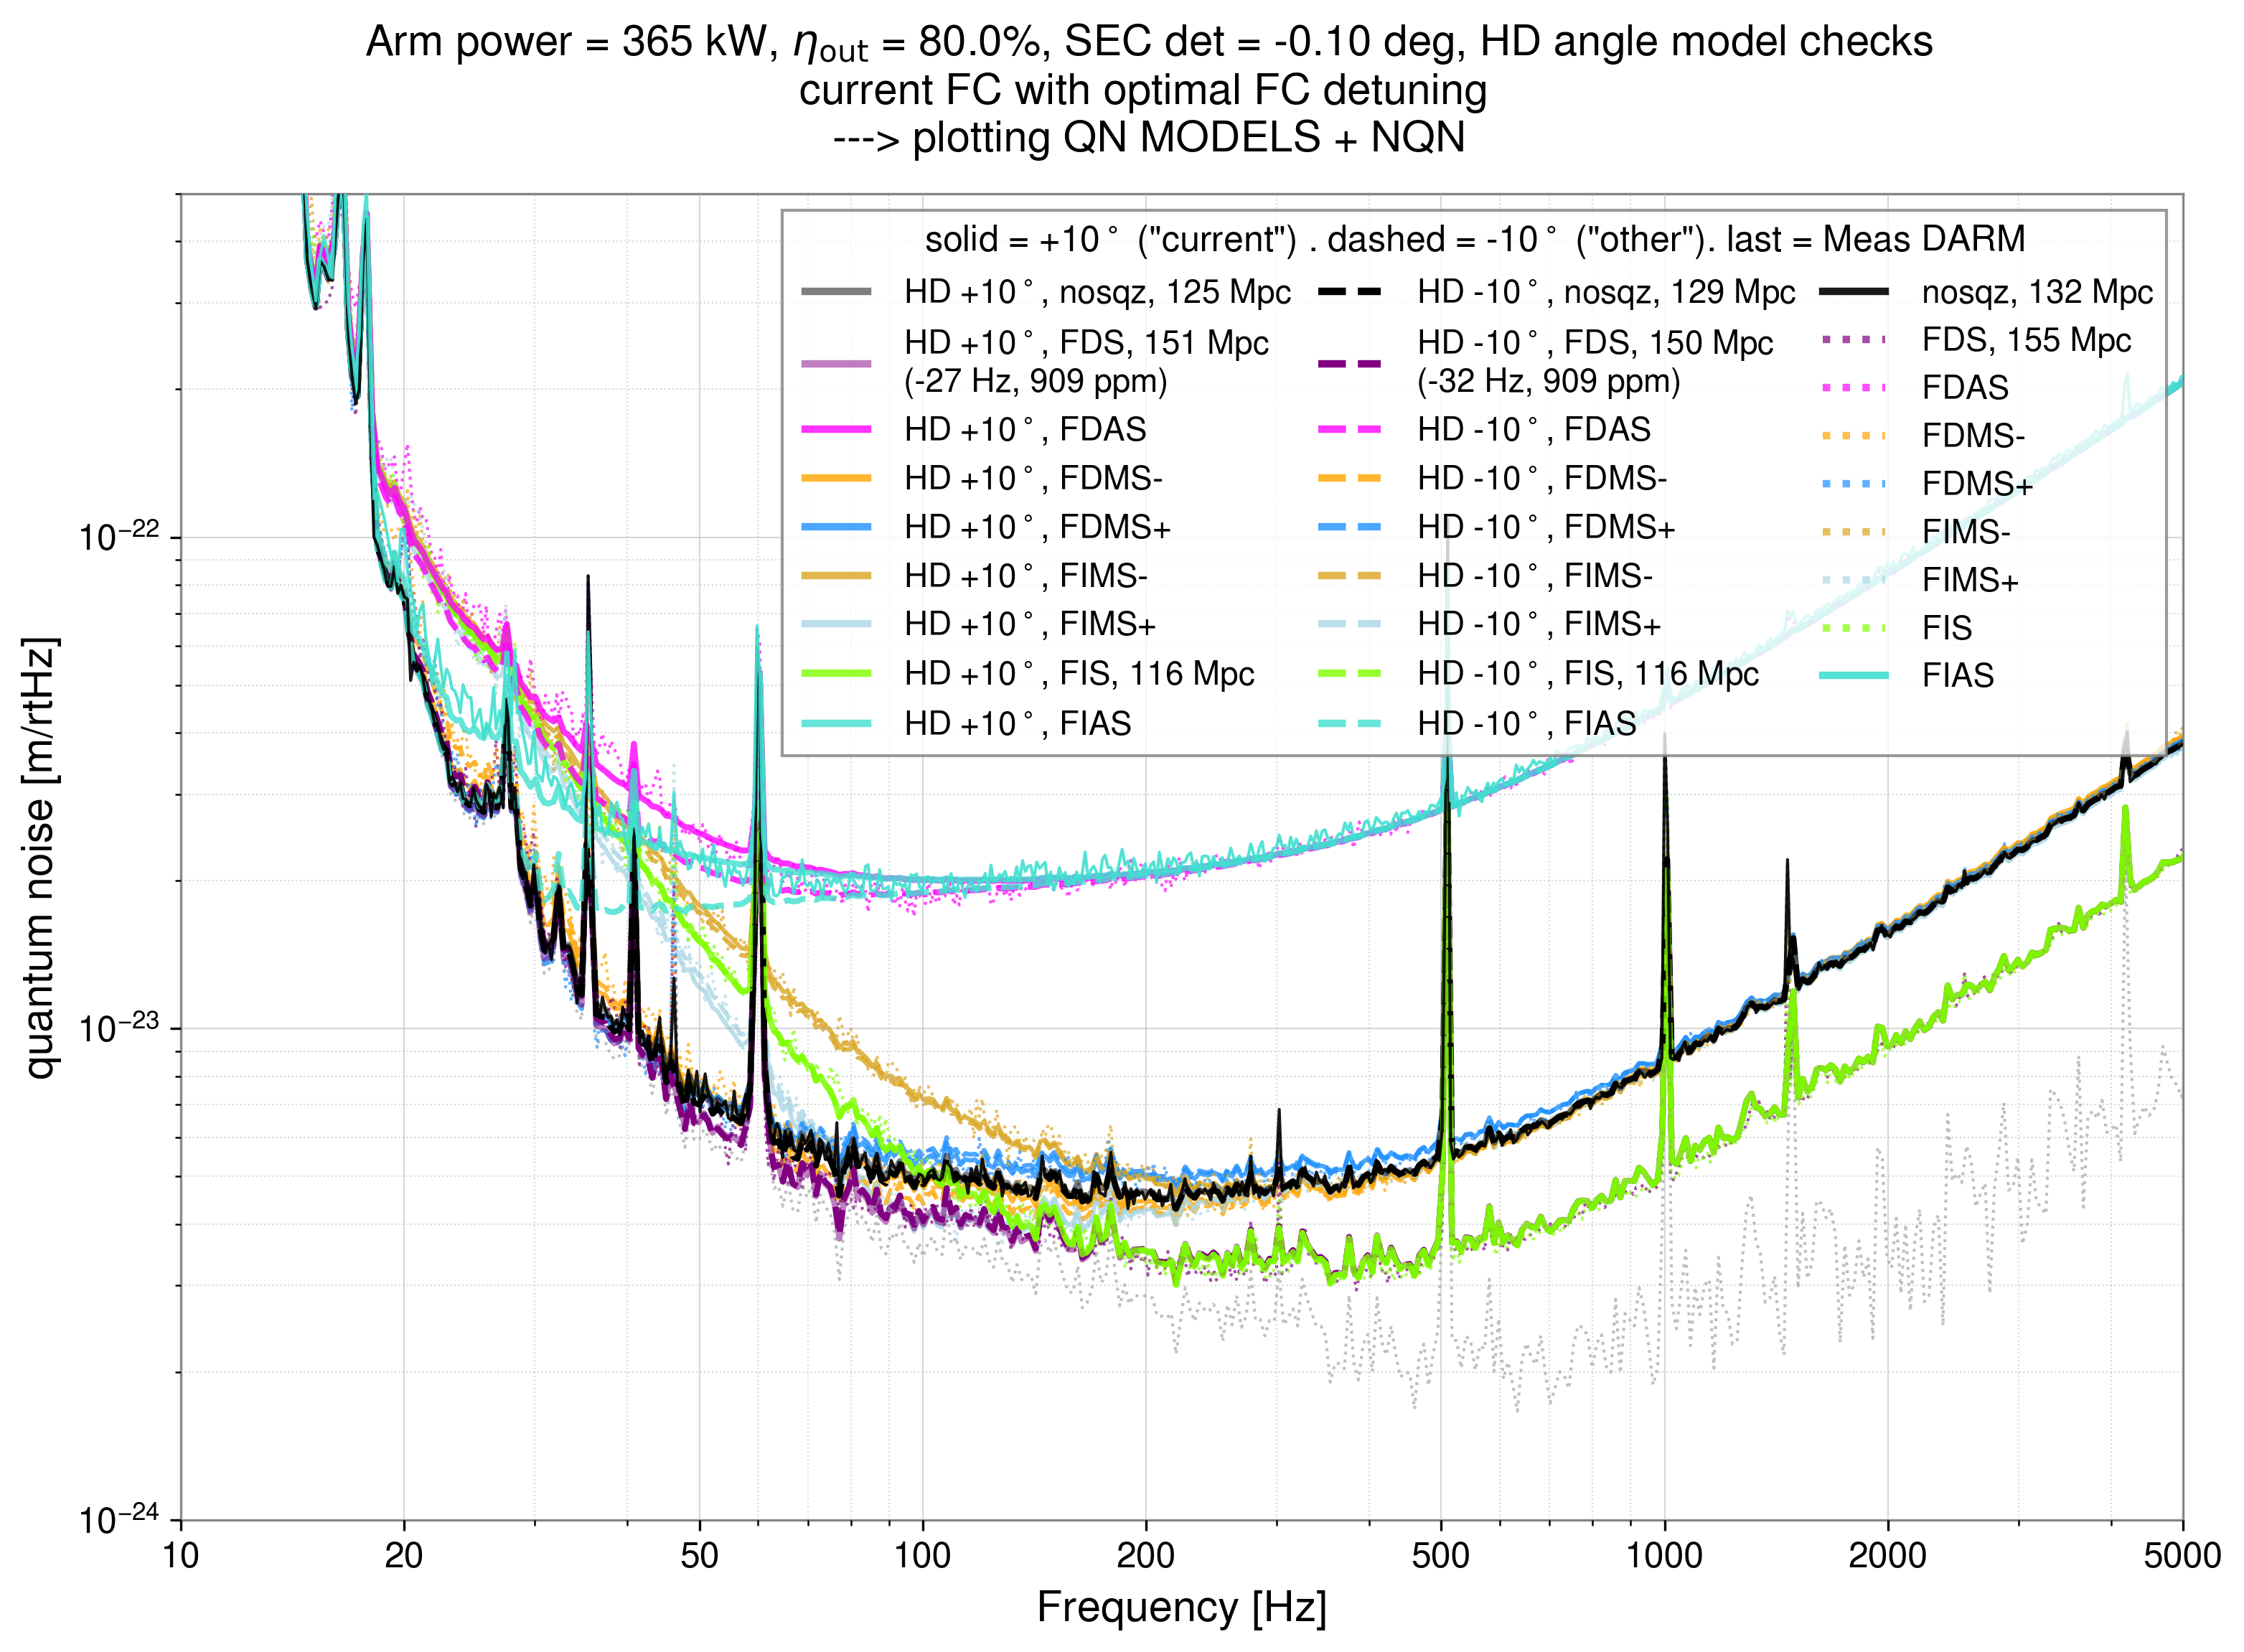
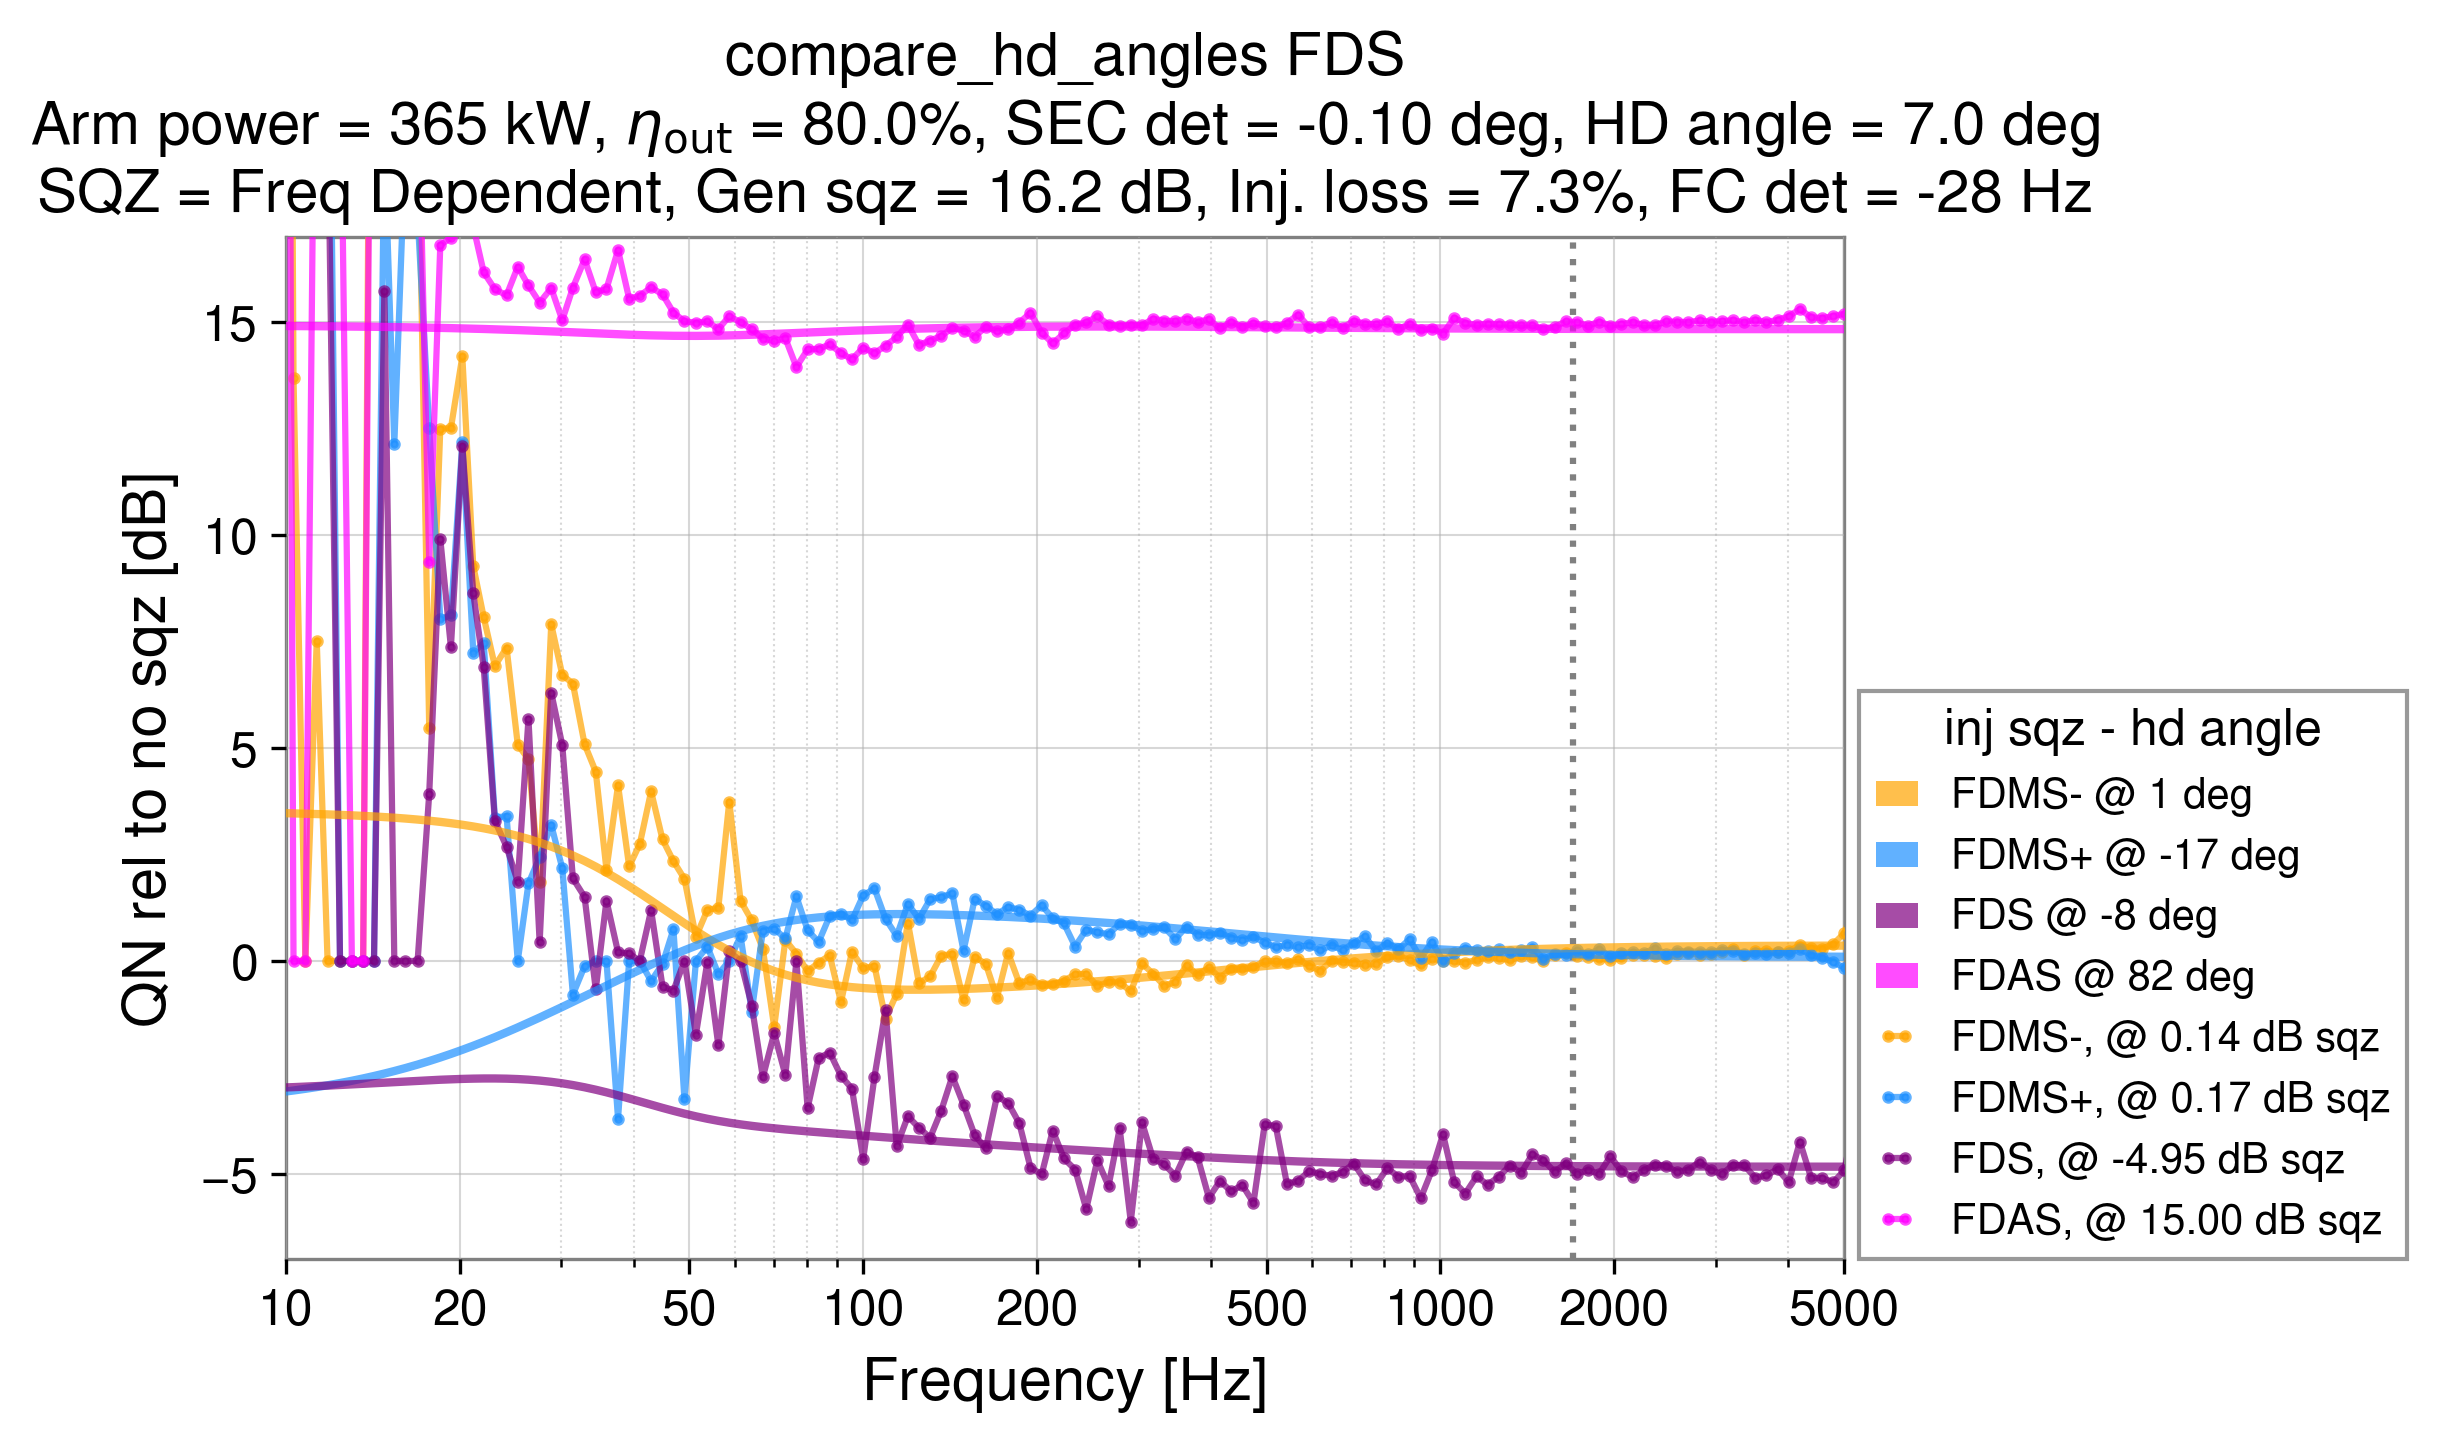
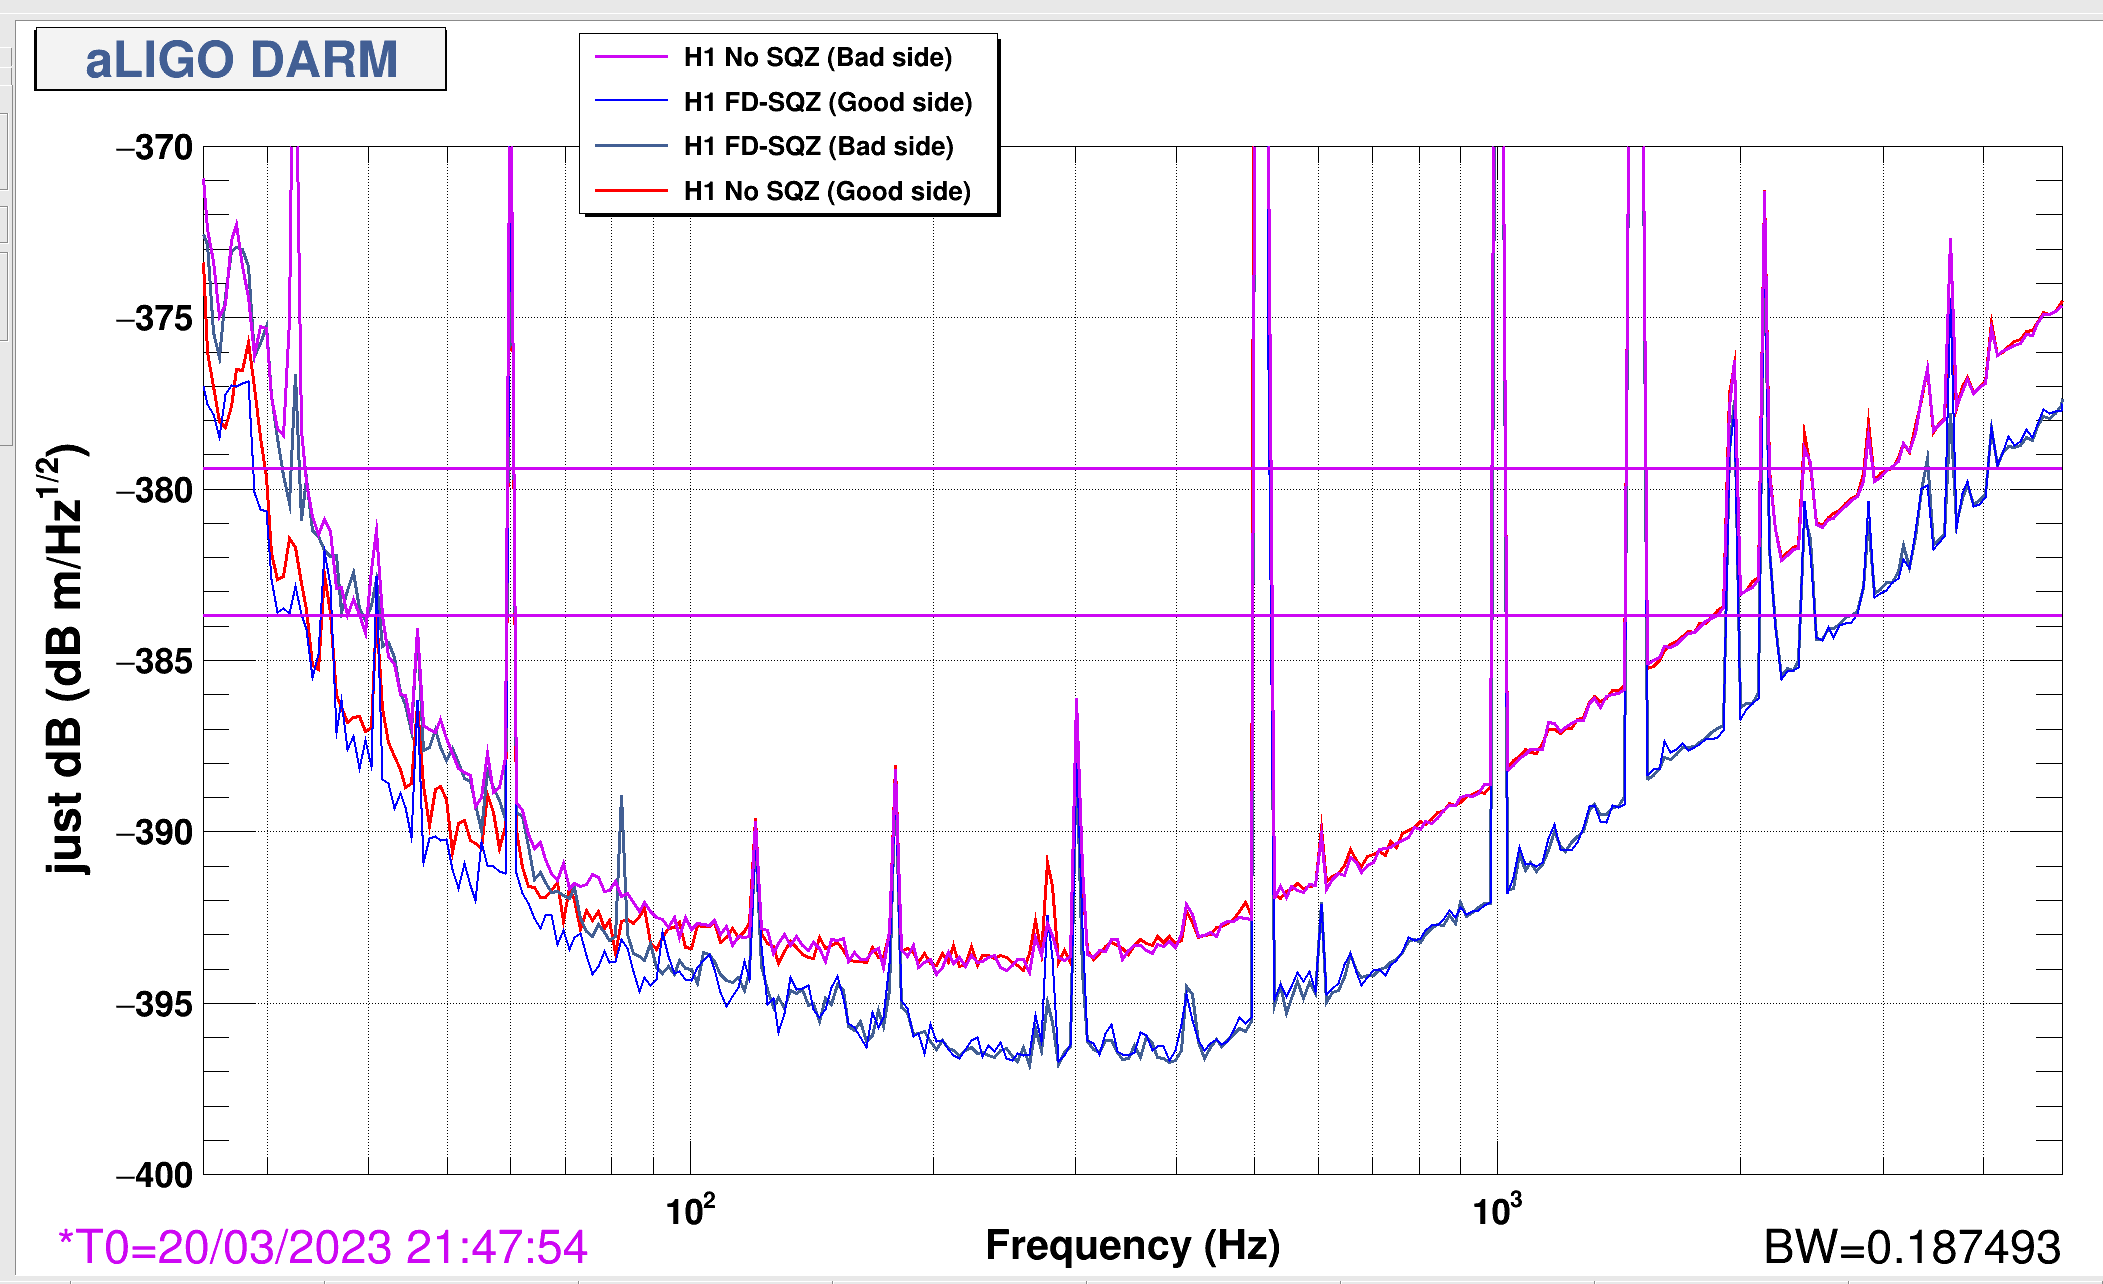
Sumary: seems the current (+) side of DARM is better for FDS, although it is opposite of our previous quantum noise models. But given the current sign is actually better for DARM, the model error doesn't really matter, and it's not really worth changing signs.
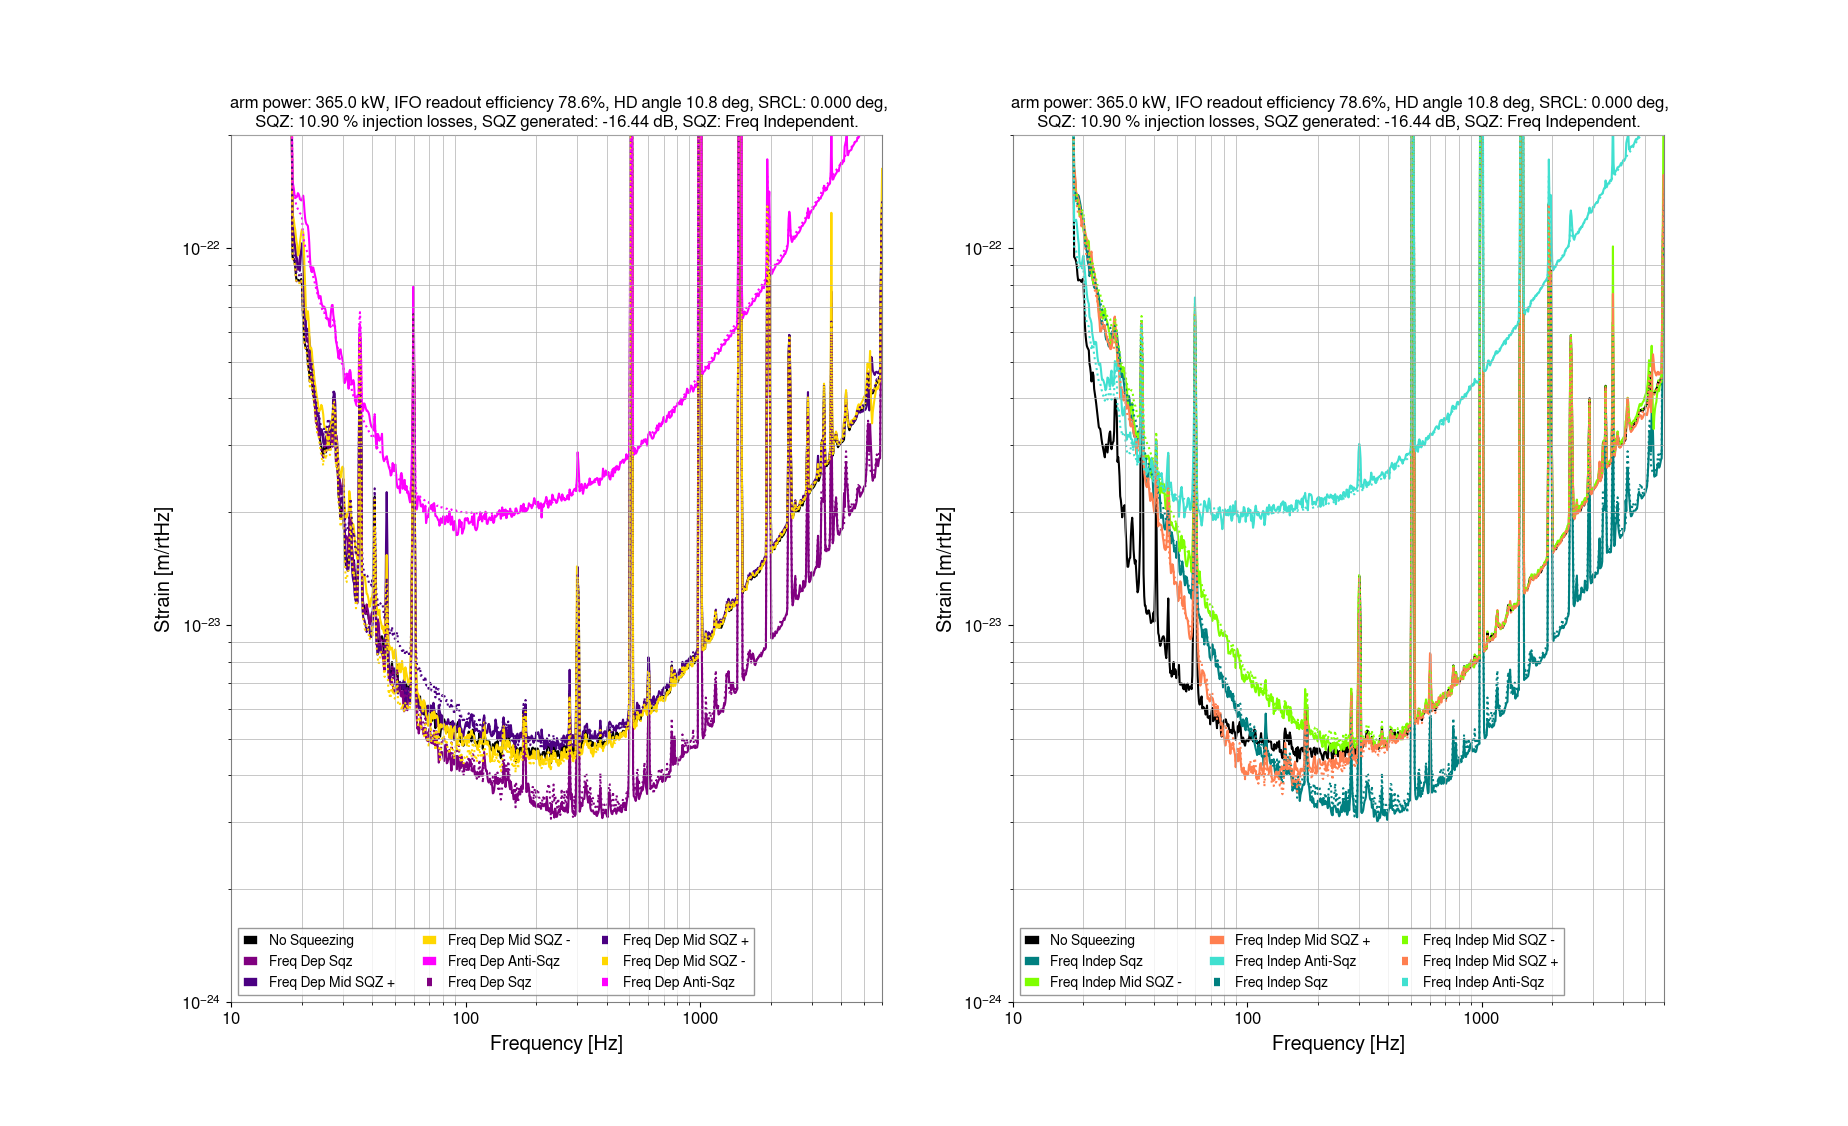
The wrong HD angle sign seems to be why none of our quantum noise models, despite fitting all other SQZ angles well, have ever fit FIAS properly. We will update our quantum noise models for the noise budget. Attached are some quantum noise models and DARM plots for Camilla's recent SQZ dataset lho80664.
Plots with optimal FDS (optimal fc detuning) for both signs of the homodyne angle: showing 1st just the quantum noise models without adding back non-quantum noise (NQN), and 2nd showing QN models + NQN.
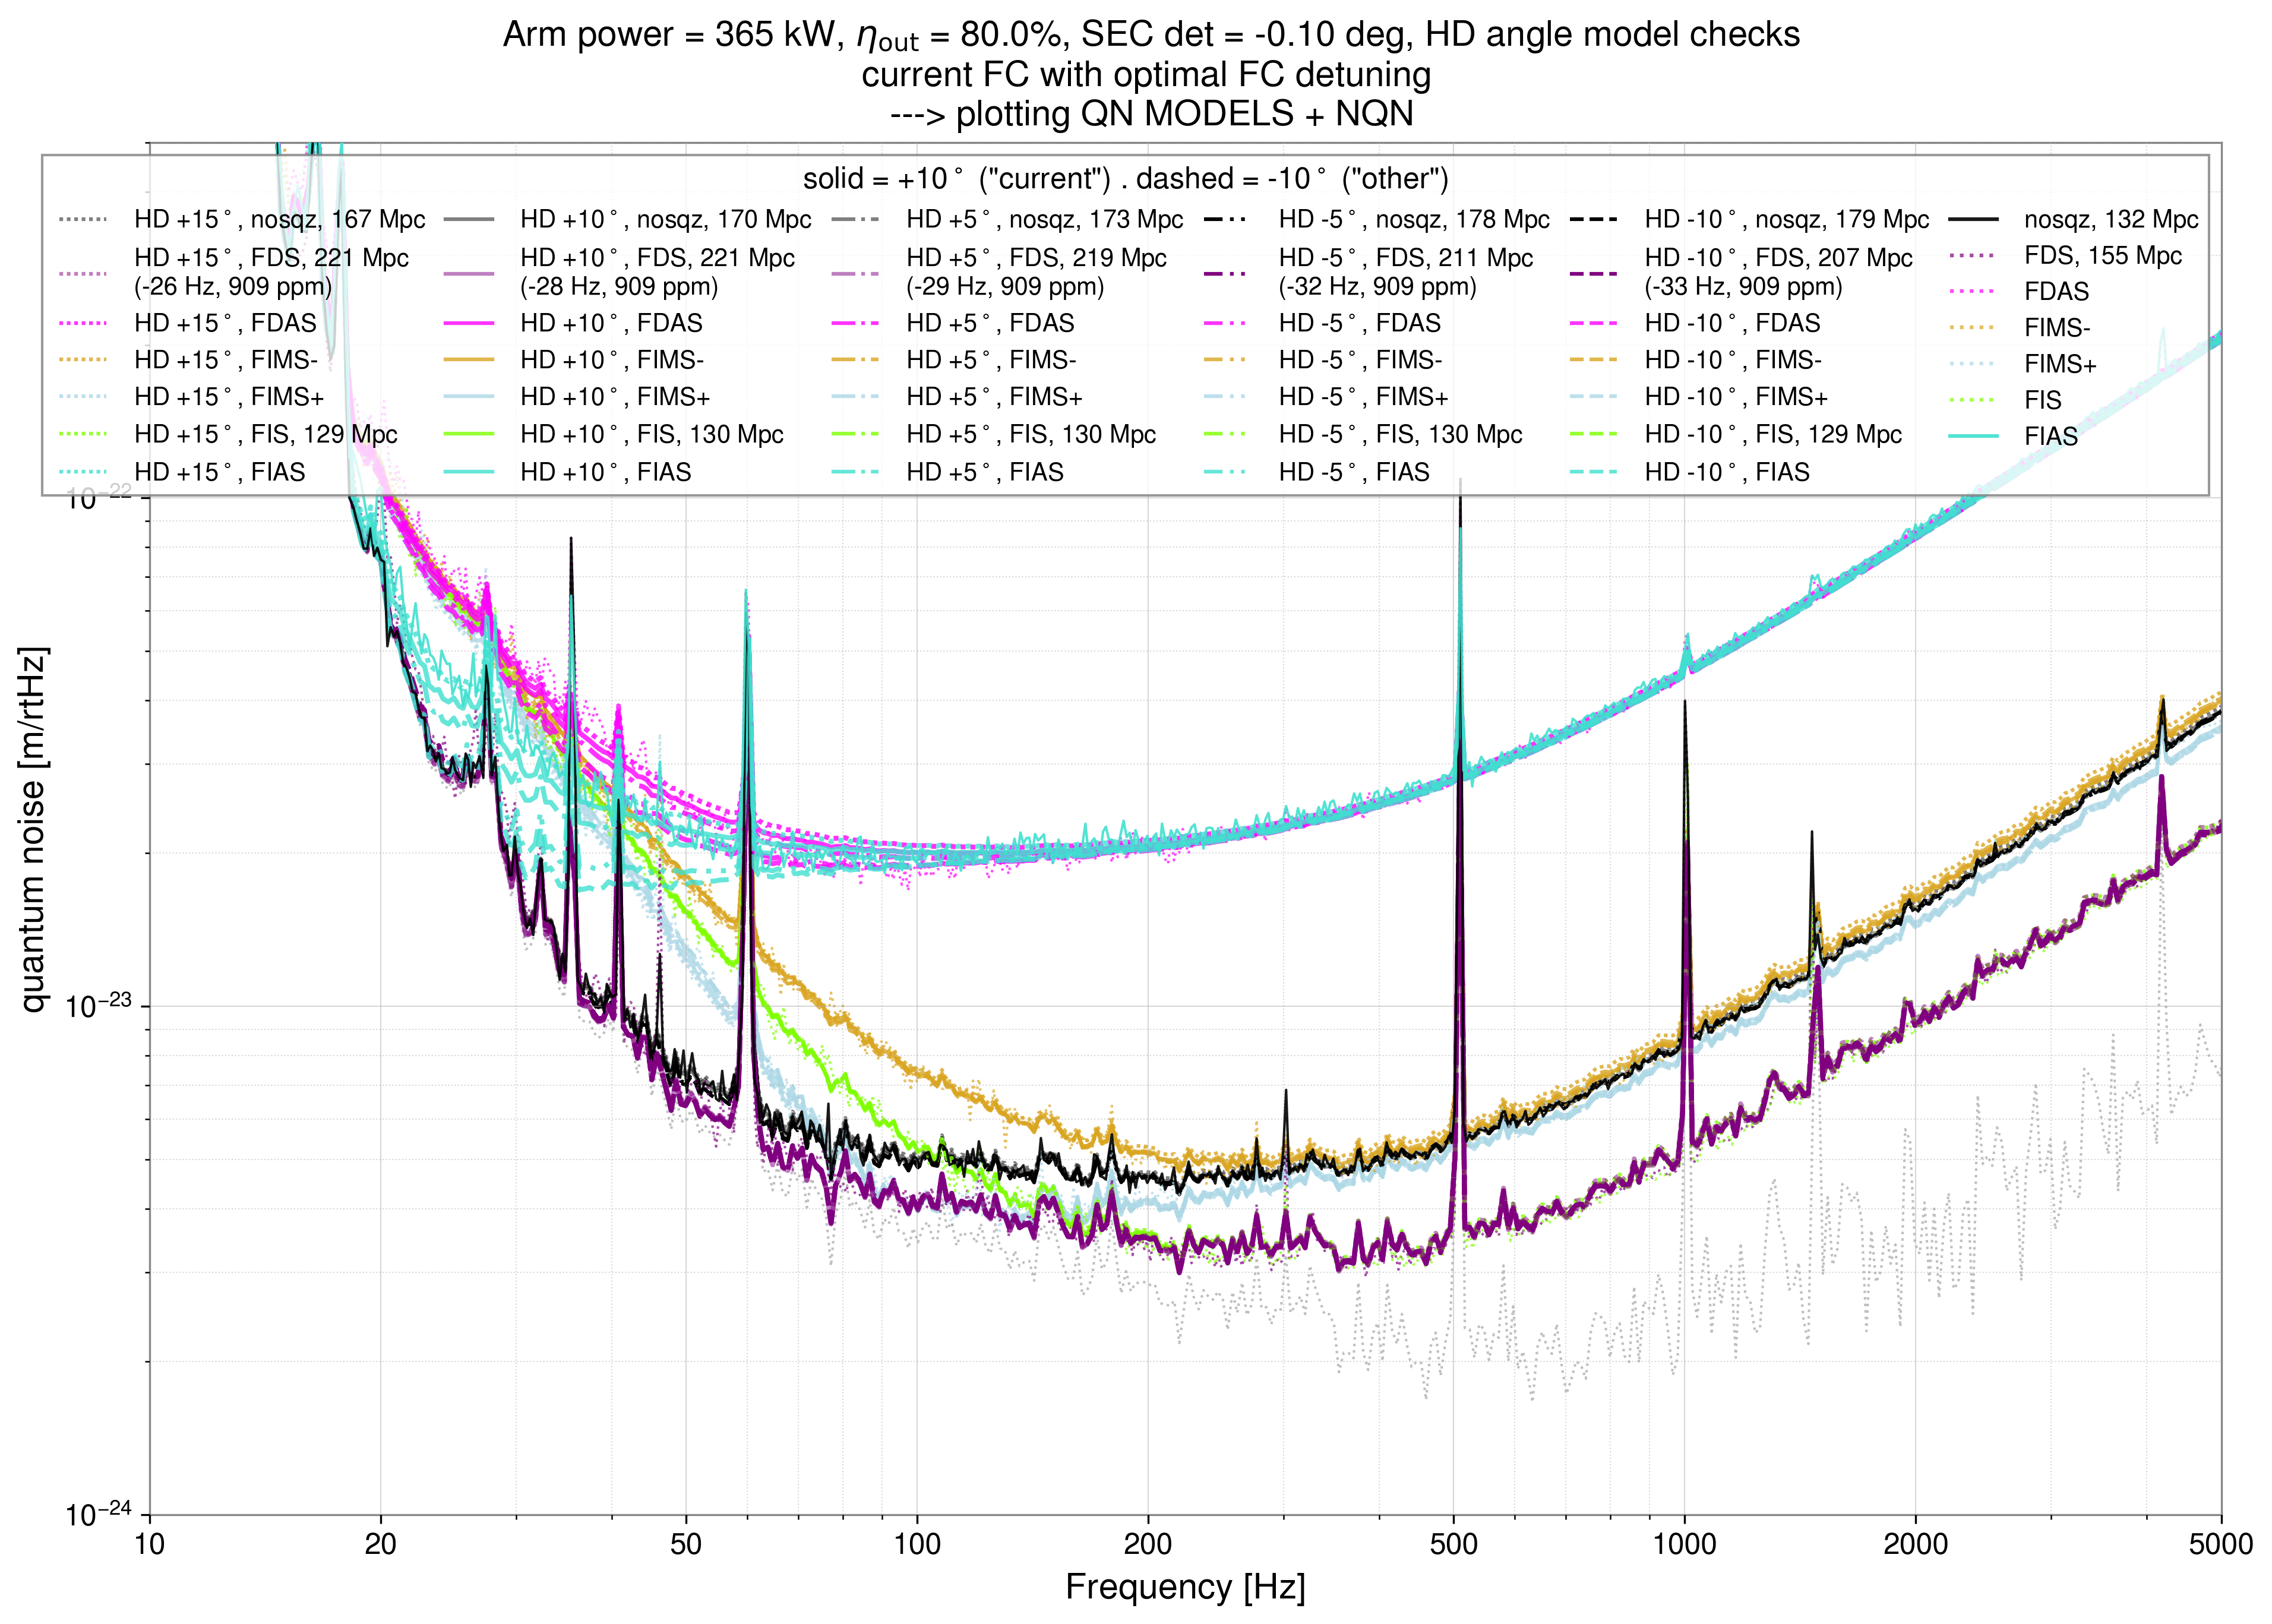
Third attachment (3rd) shows a wider range of homodyne angles, from +15 deg to -10 deg. So far the code for these plots is living here.
---------------------------------------------------------------------------------------------------------------------------------------------------------------------------------------------------
Altogether this is making progress on the quantum noise models for the noise budget!
Summarizing updates and what we're learning:
Vicky, Sheila
Based on the fit of total squeezing efficiency and nonlinear gain (which is based on subtracted SQZ and ASQZ from 1.5-1.8kHz), and known losses from loss google sheet, we can infer some possible maximum and minimum arm powers using the no squeezing data.
The first attachment shows the same plot as above, but with the latest jitter noise measured by Elenna in 80808 We noticed this afternoon that there is a problem with the way these jitter noises are being added in quadrature by the noise budget, but we haven't fixed that yet. In this data set, we have 15.1dB of anti-squeezing and 5.1dB of squeezing from 1.5-1.8kHz, we can use the Aoki equations to solve for nonlinear gain of 14.6 and total efficiency eta for squeezing of 73%. Since the known readoutlosses are 7.3% and the known squeezer injection losses are 8.8%, this gives us a minimum readout efficency of (eta/(1-known injection loss) = 79% and a maximum of 1-known readout loss = 91.2%. Using the level of noise between 1.5-1.8kHz with no squeezing (and an estimate of the non quantum noise) we can use these max and min readout efficencies to find min and max circulating powers in the arms.
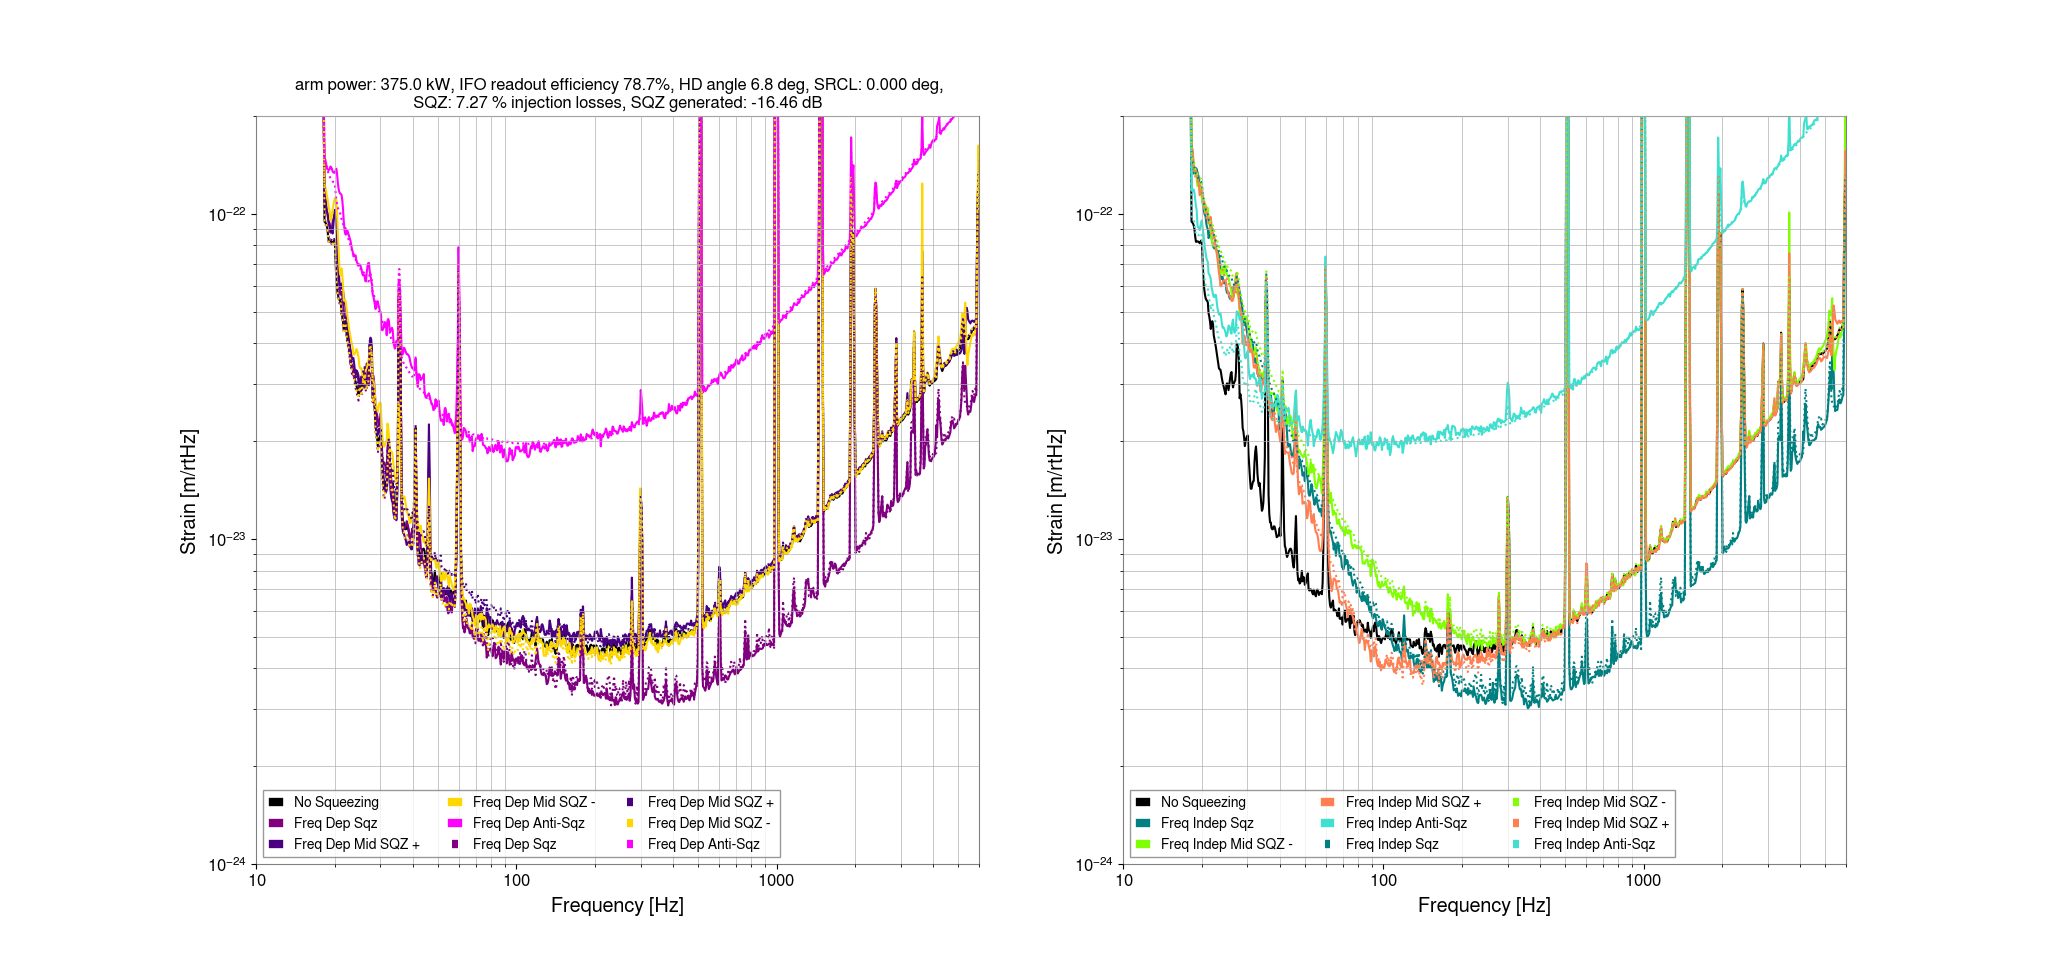
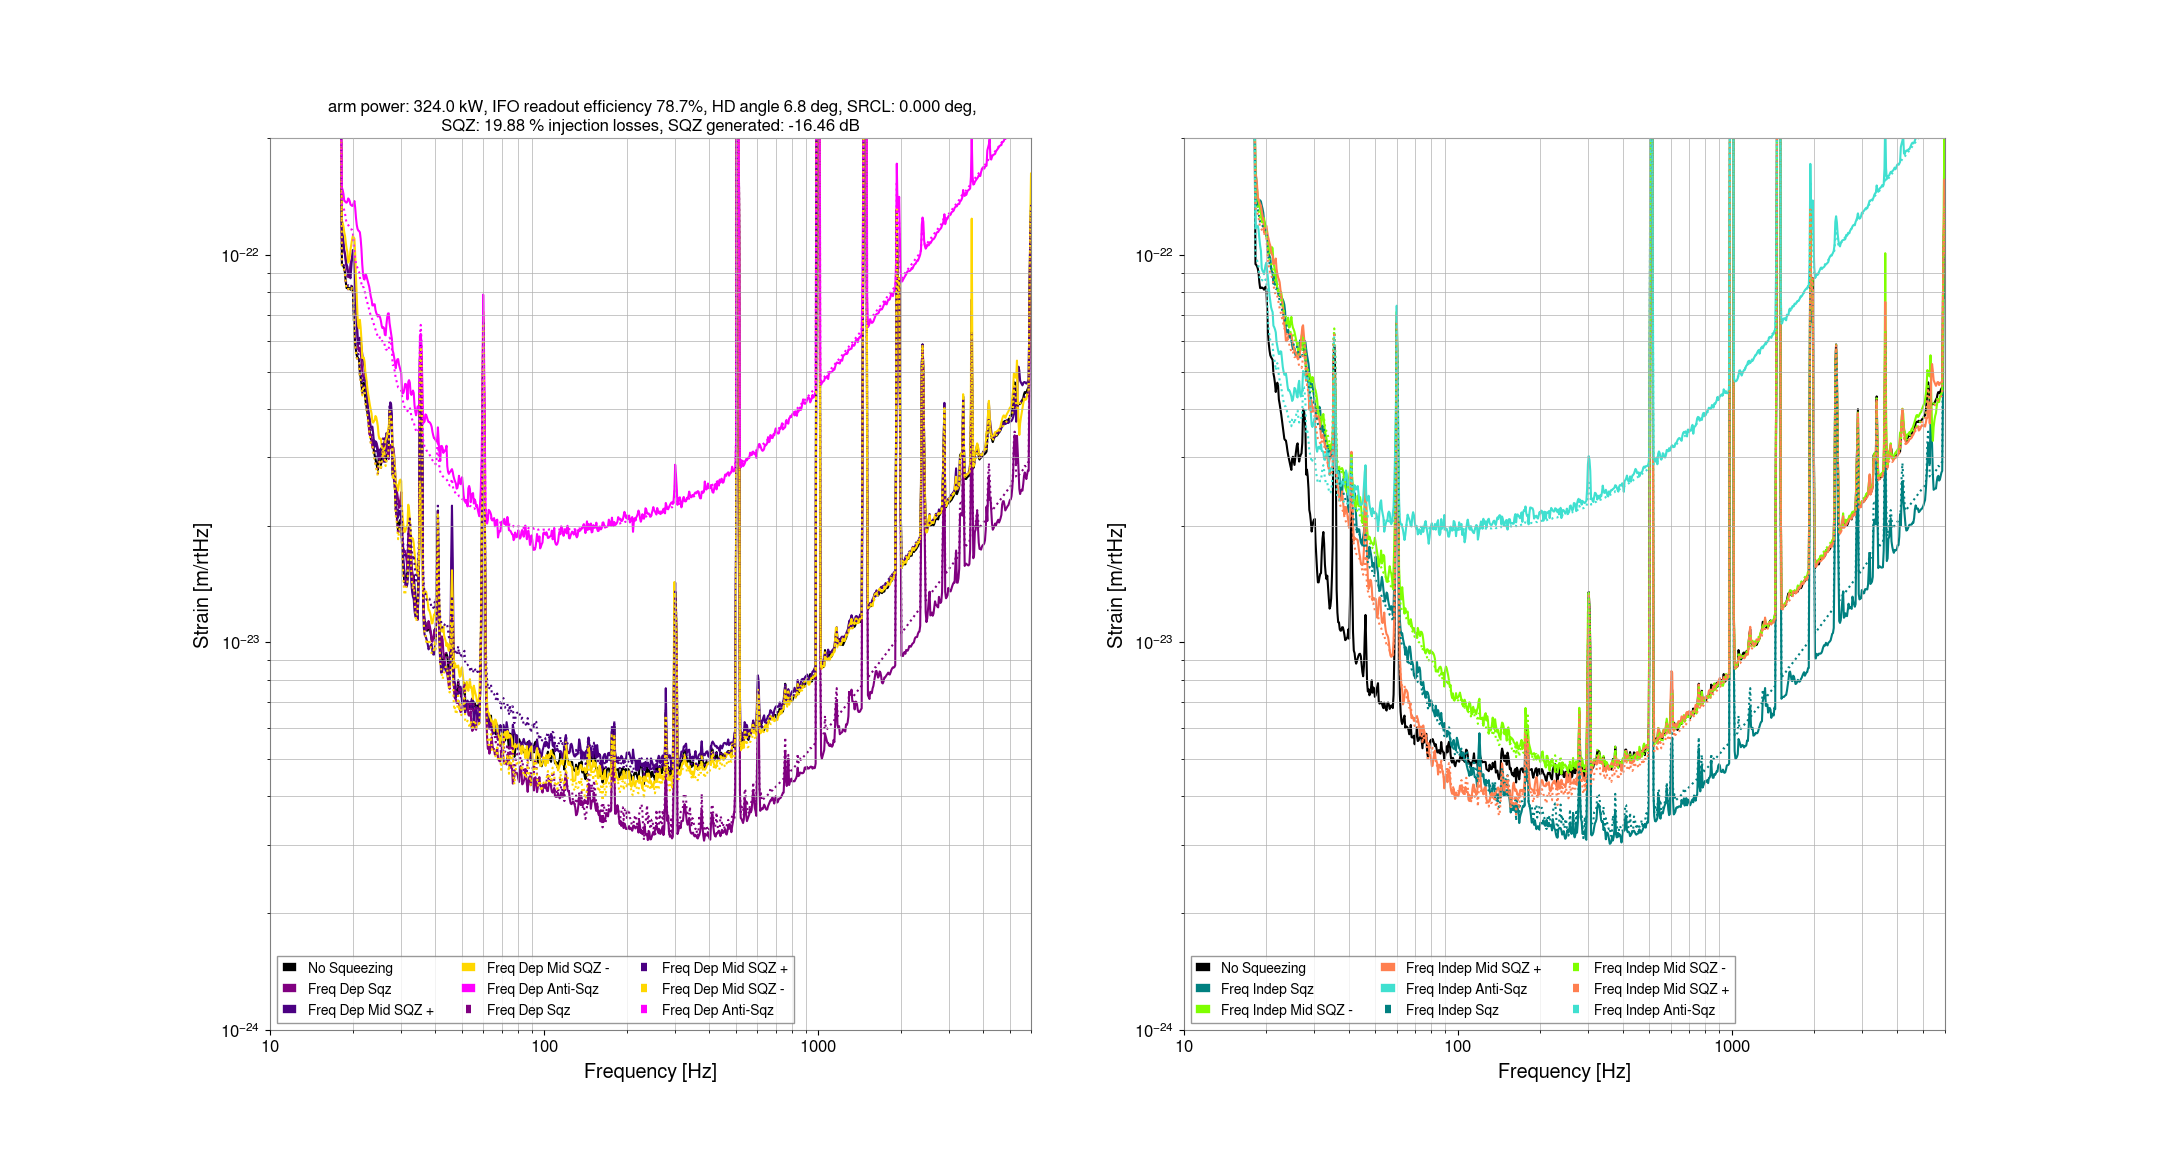
These arm power limits will be impacted by our estimate of the non-quantum noise, the homodyne angle, and the SRC detuning. With 0 SRC detuning, and a homodyne angle of 7 degrees, this resutls in a range of arm powers of 324-375kW. the estimate of non-quantum noise is the most important of these factors, while SRC detunings large engouh to change these estimates significantly seem outside the range that is allowed by other squeezing mesurements.
I've run the comparison of the model to different squeezing configurations for the low and high range and the nominal parameters (0 SRC, 7 degrees homodyne angle). Frequency independent squeezing and both types of mid squeezing are sensitive to the arm power from 50-100Hz, this comparison shows that the low end of the arm power range seems to have slightly too little arm power and the high range slightly too much. However these frequencies are also sensitive to homodyne angle and SRC detuning.
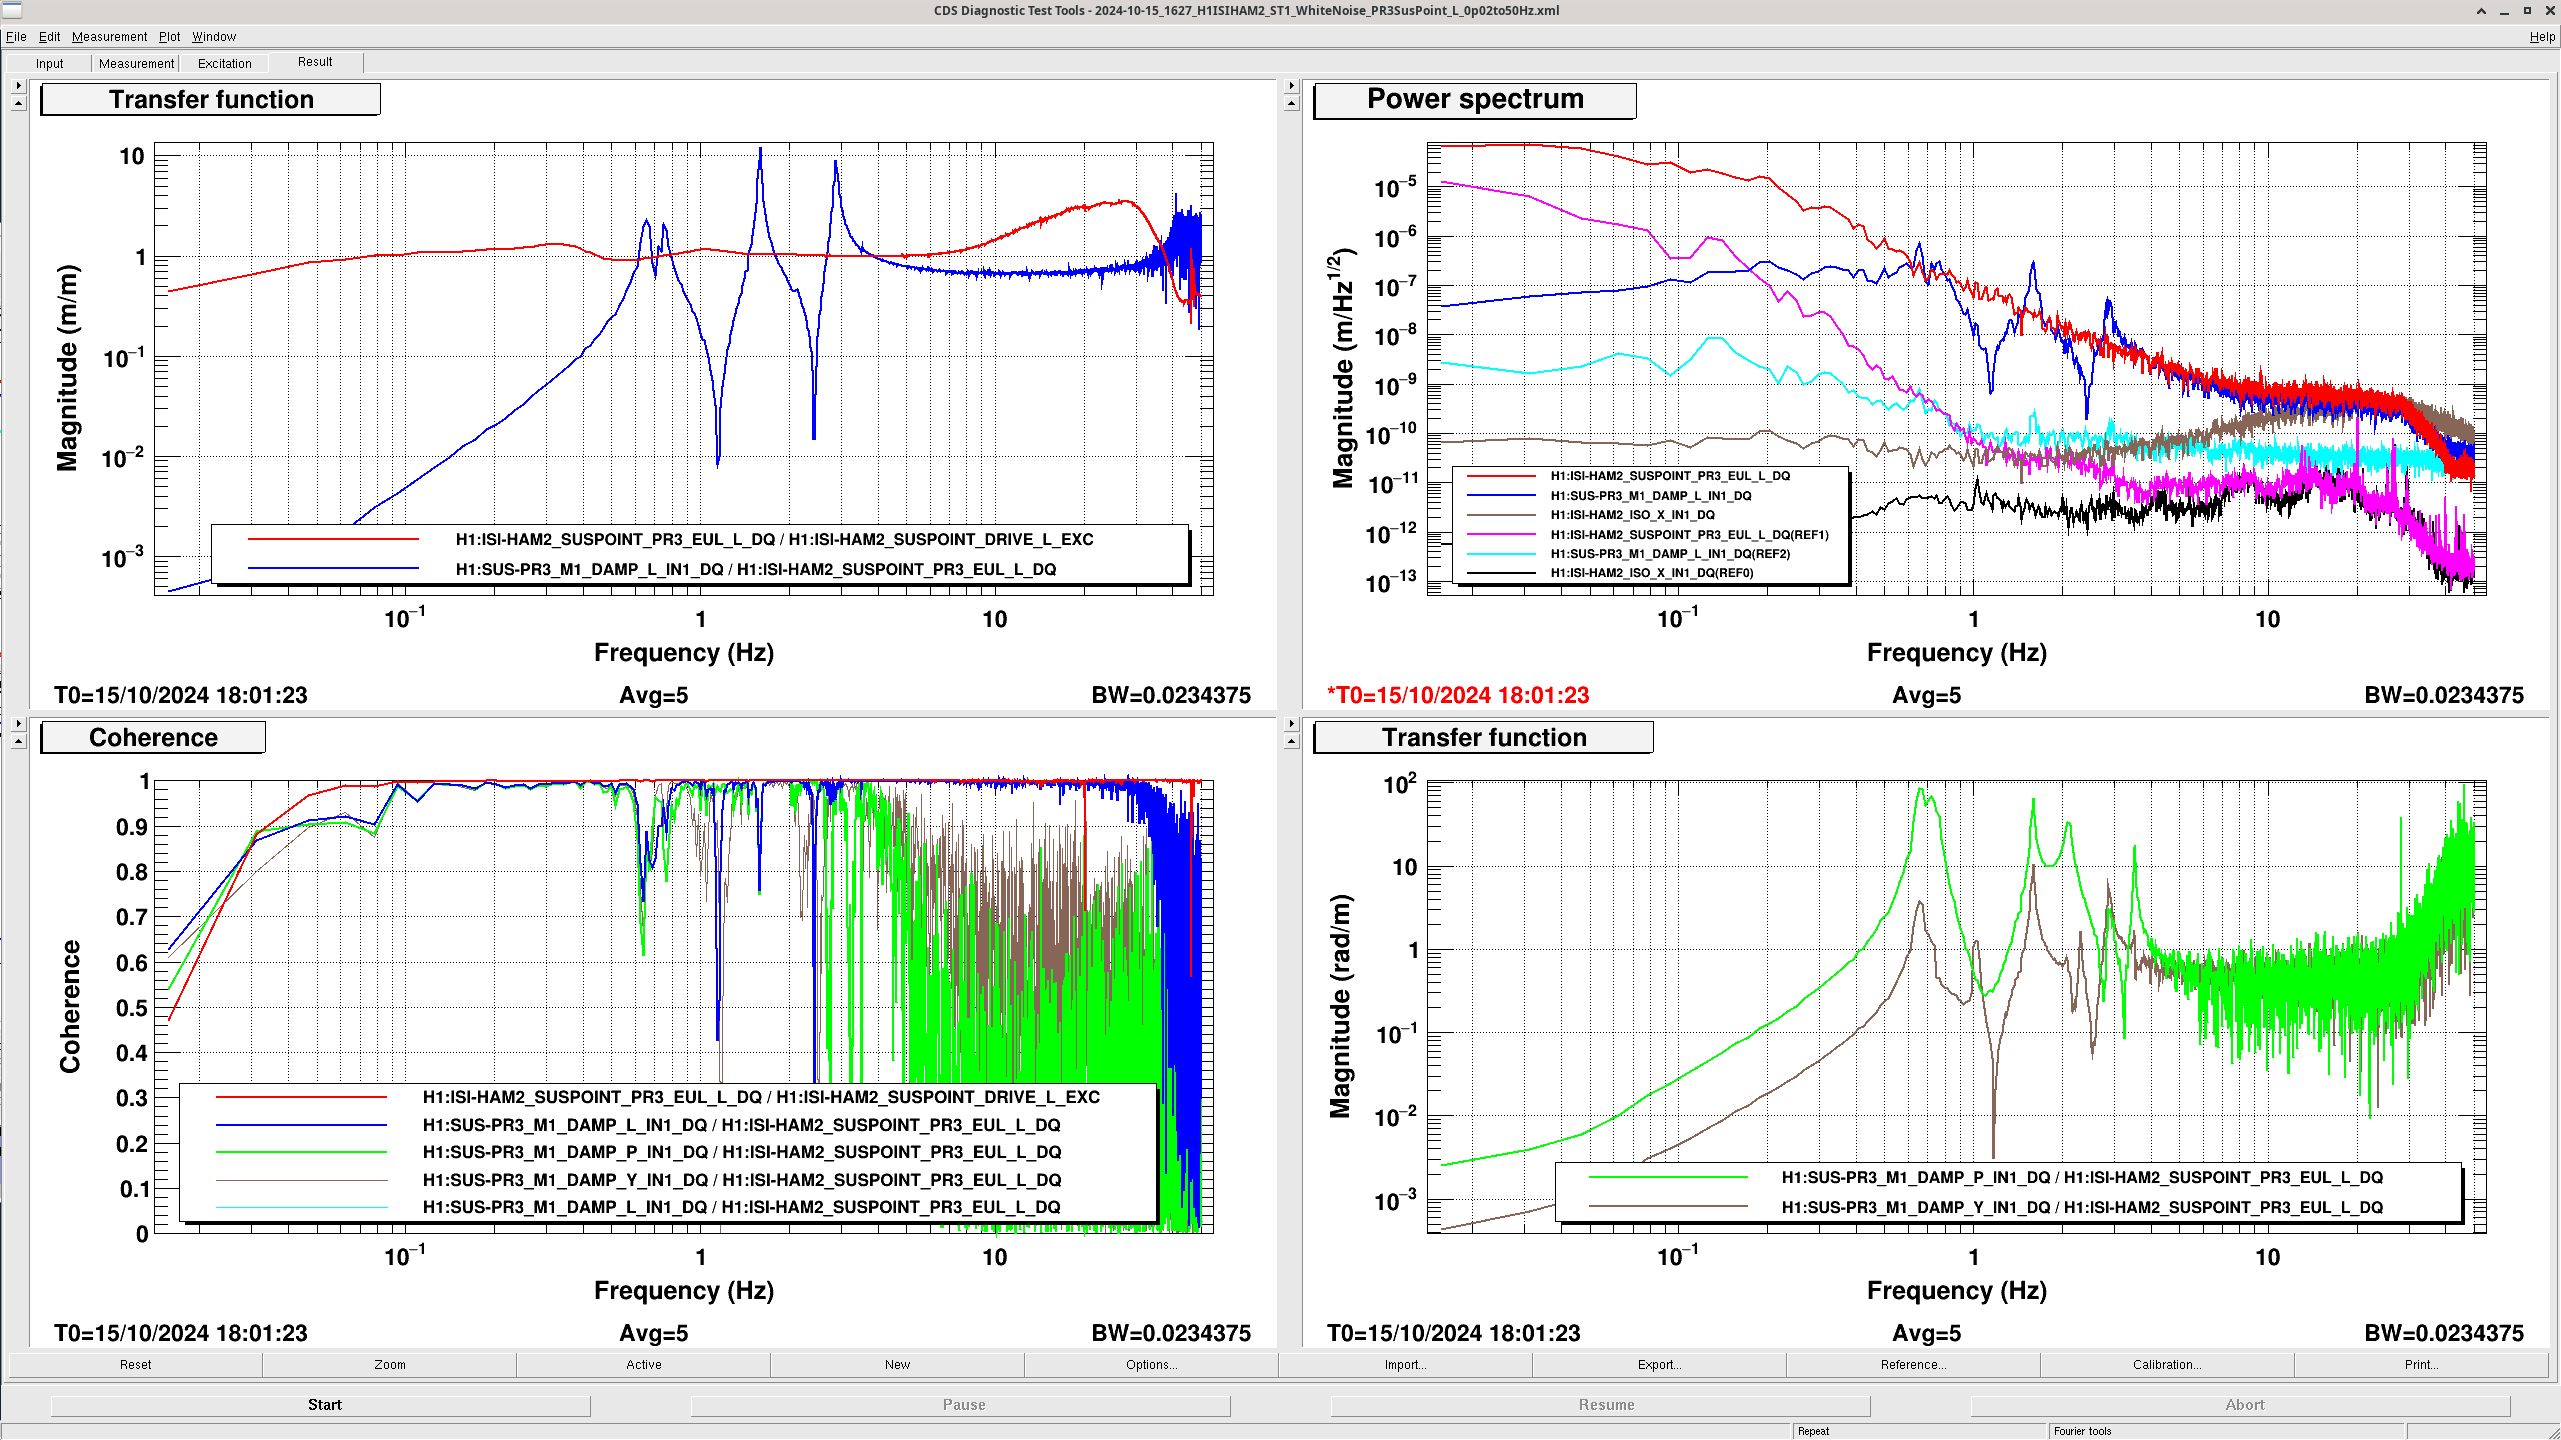
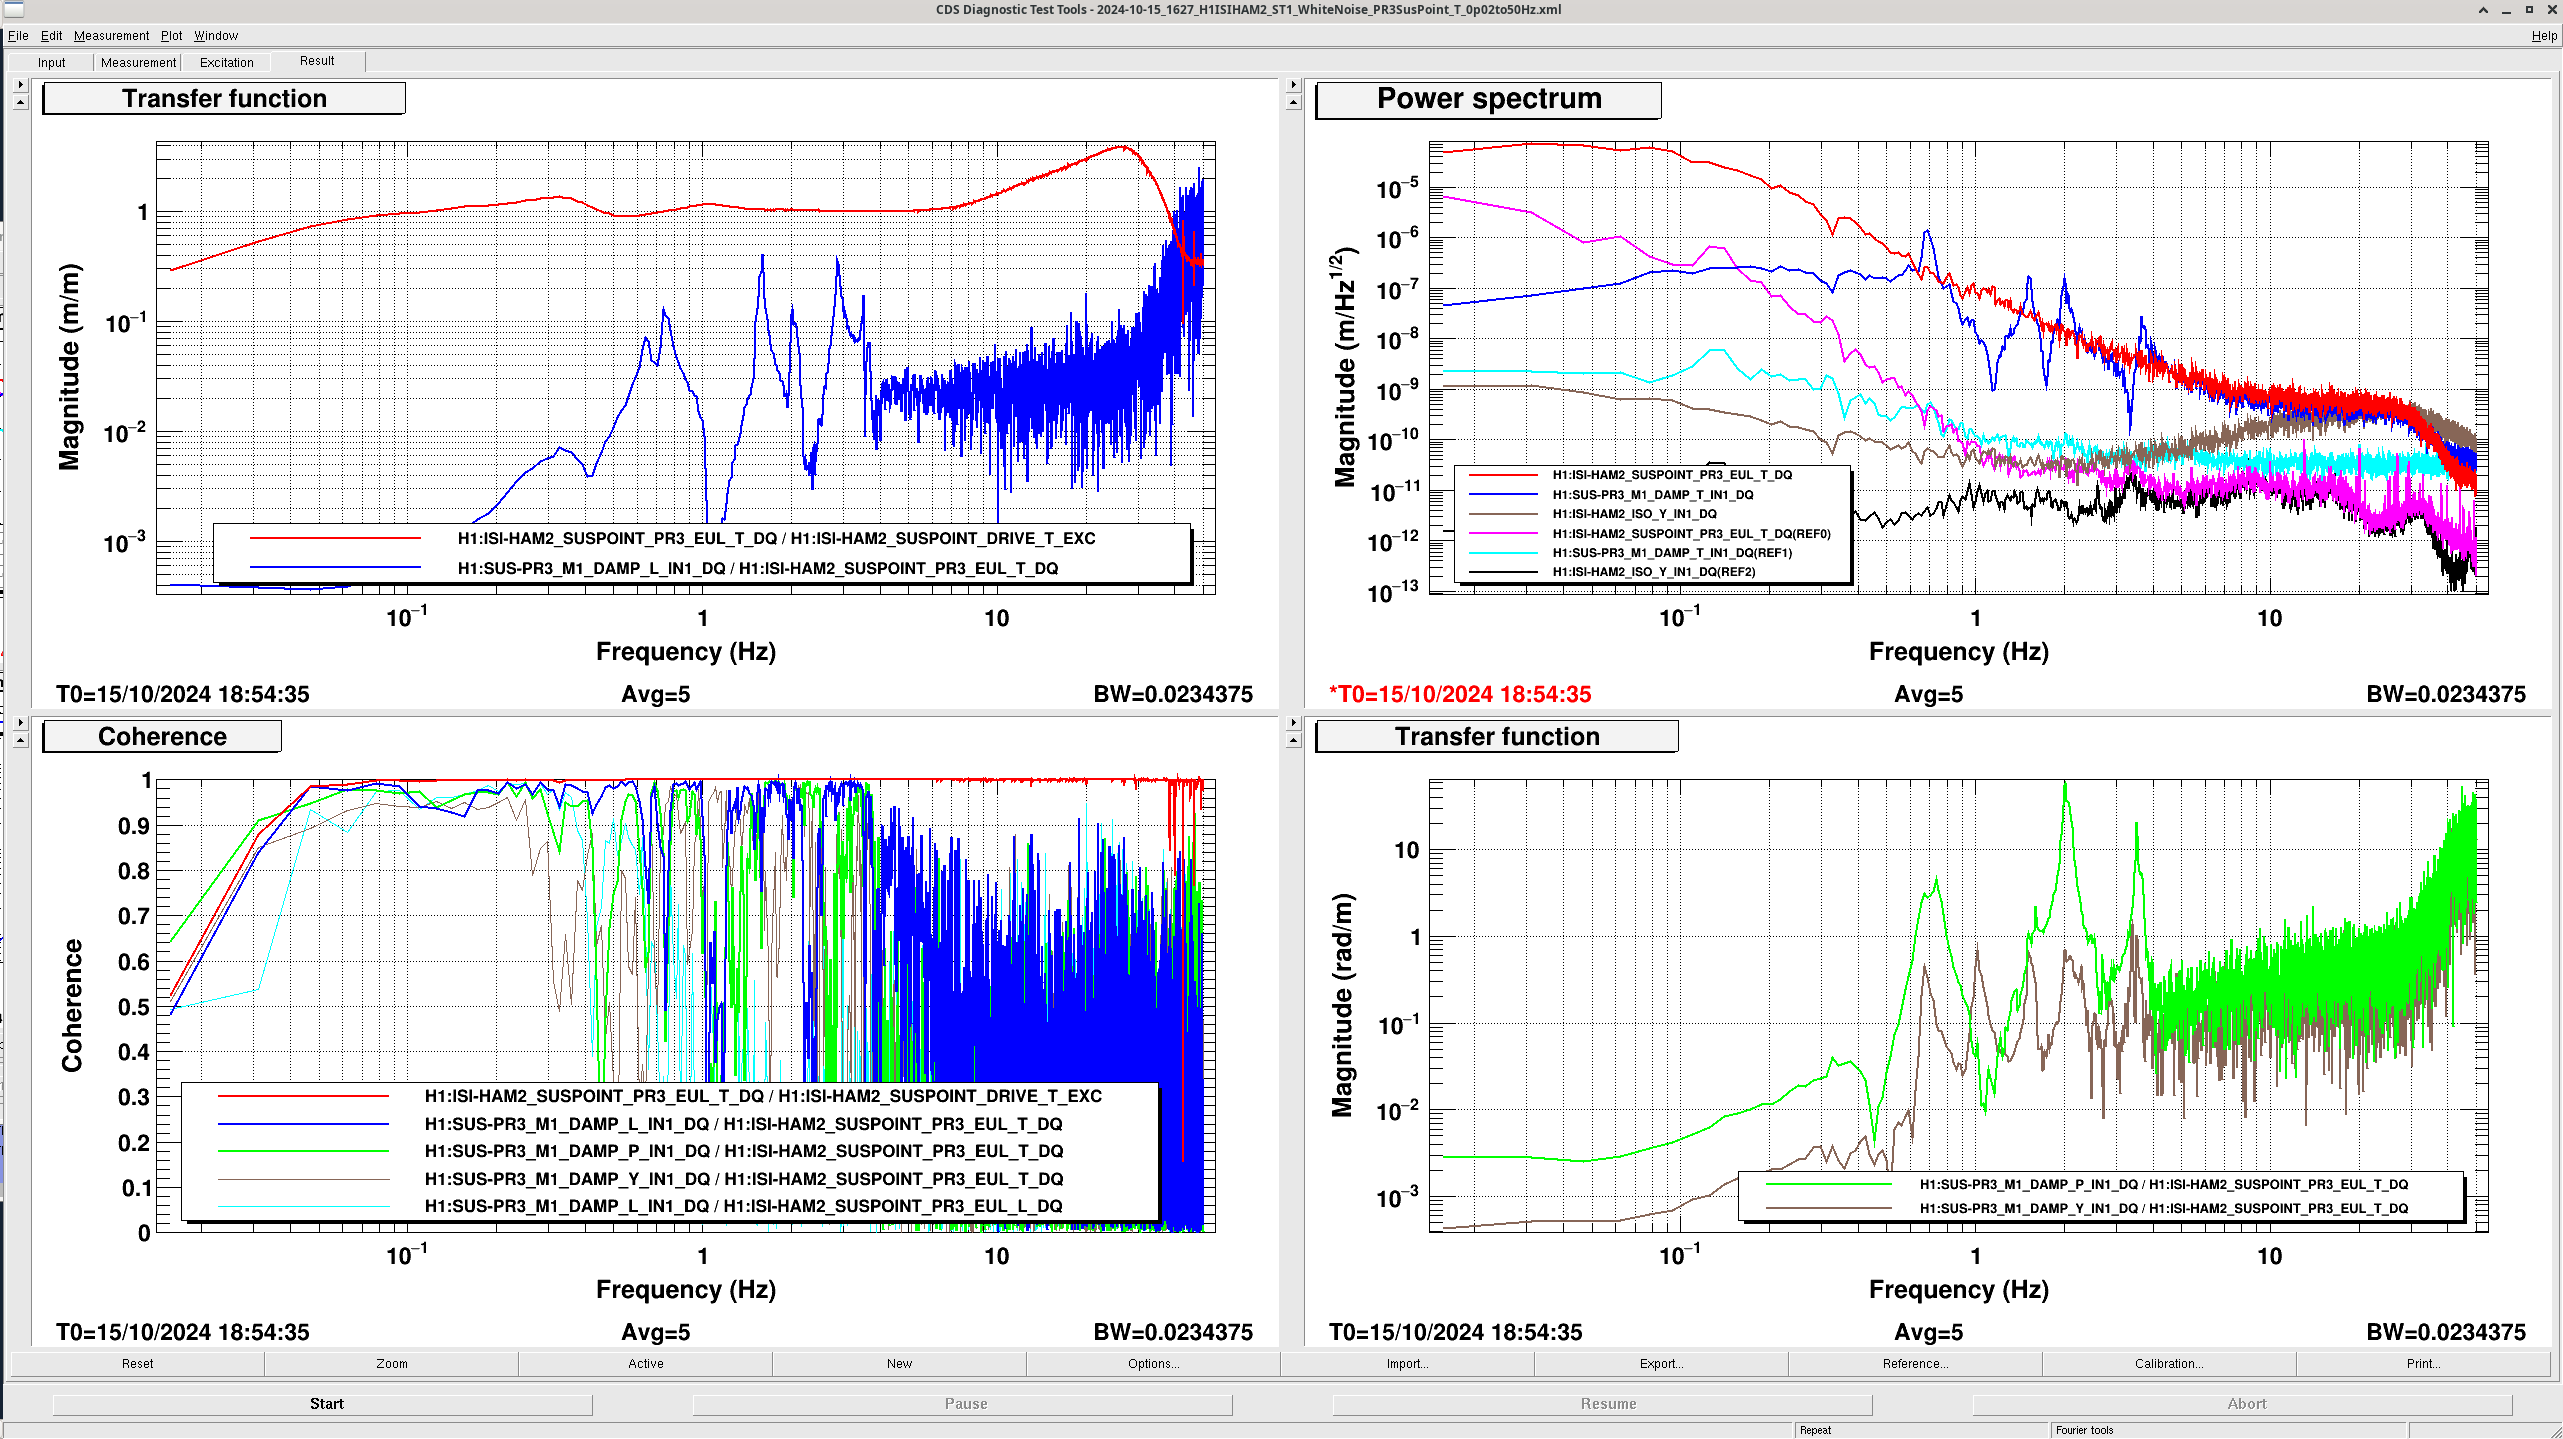
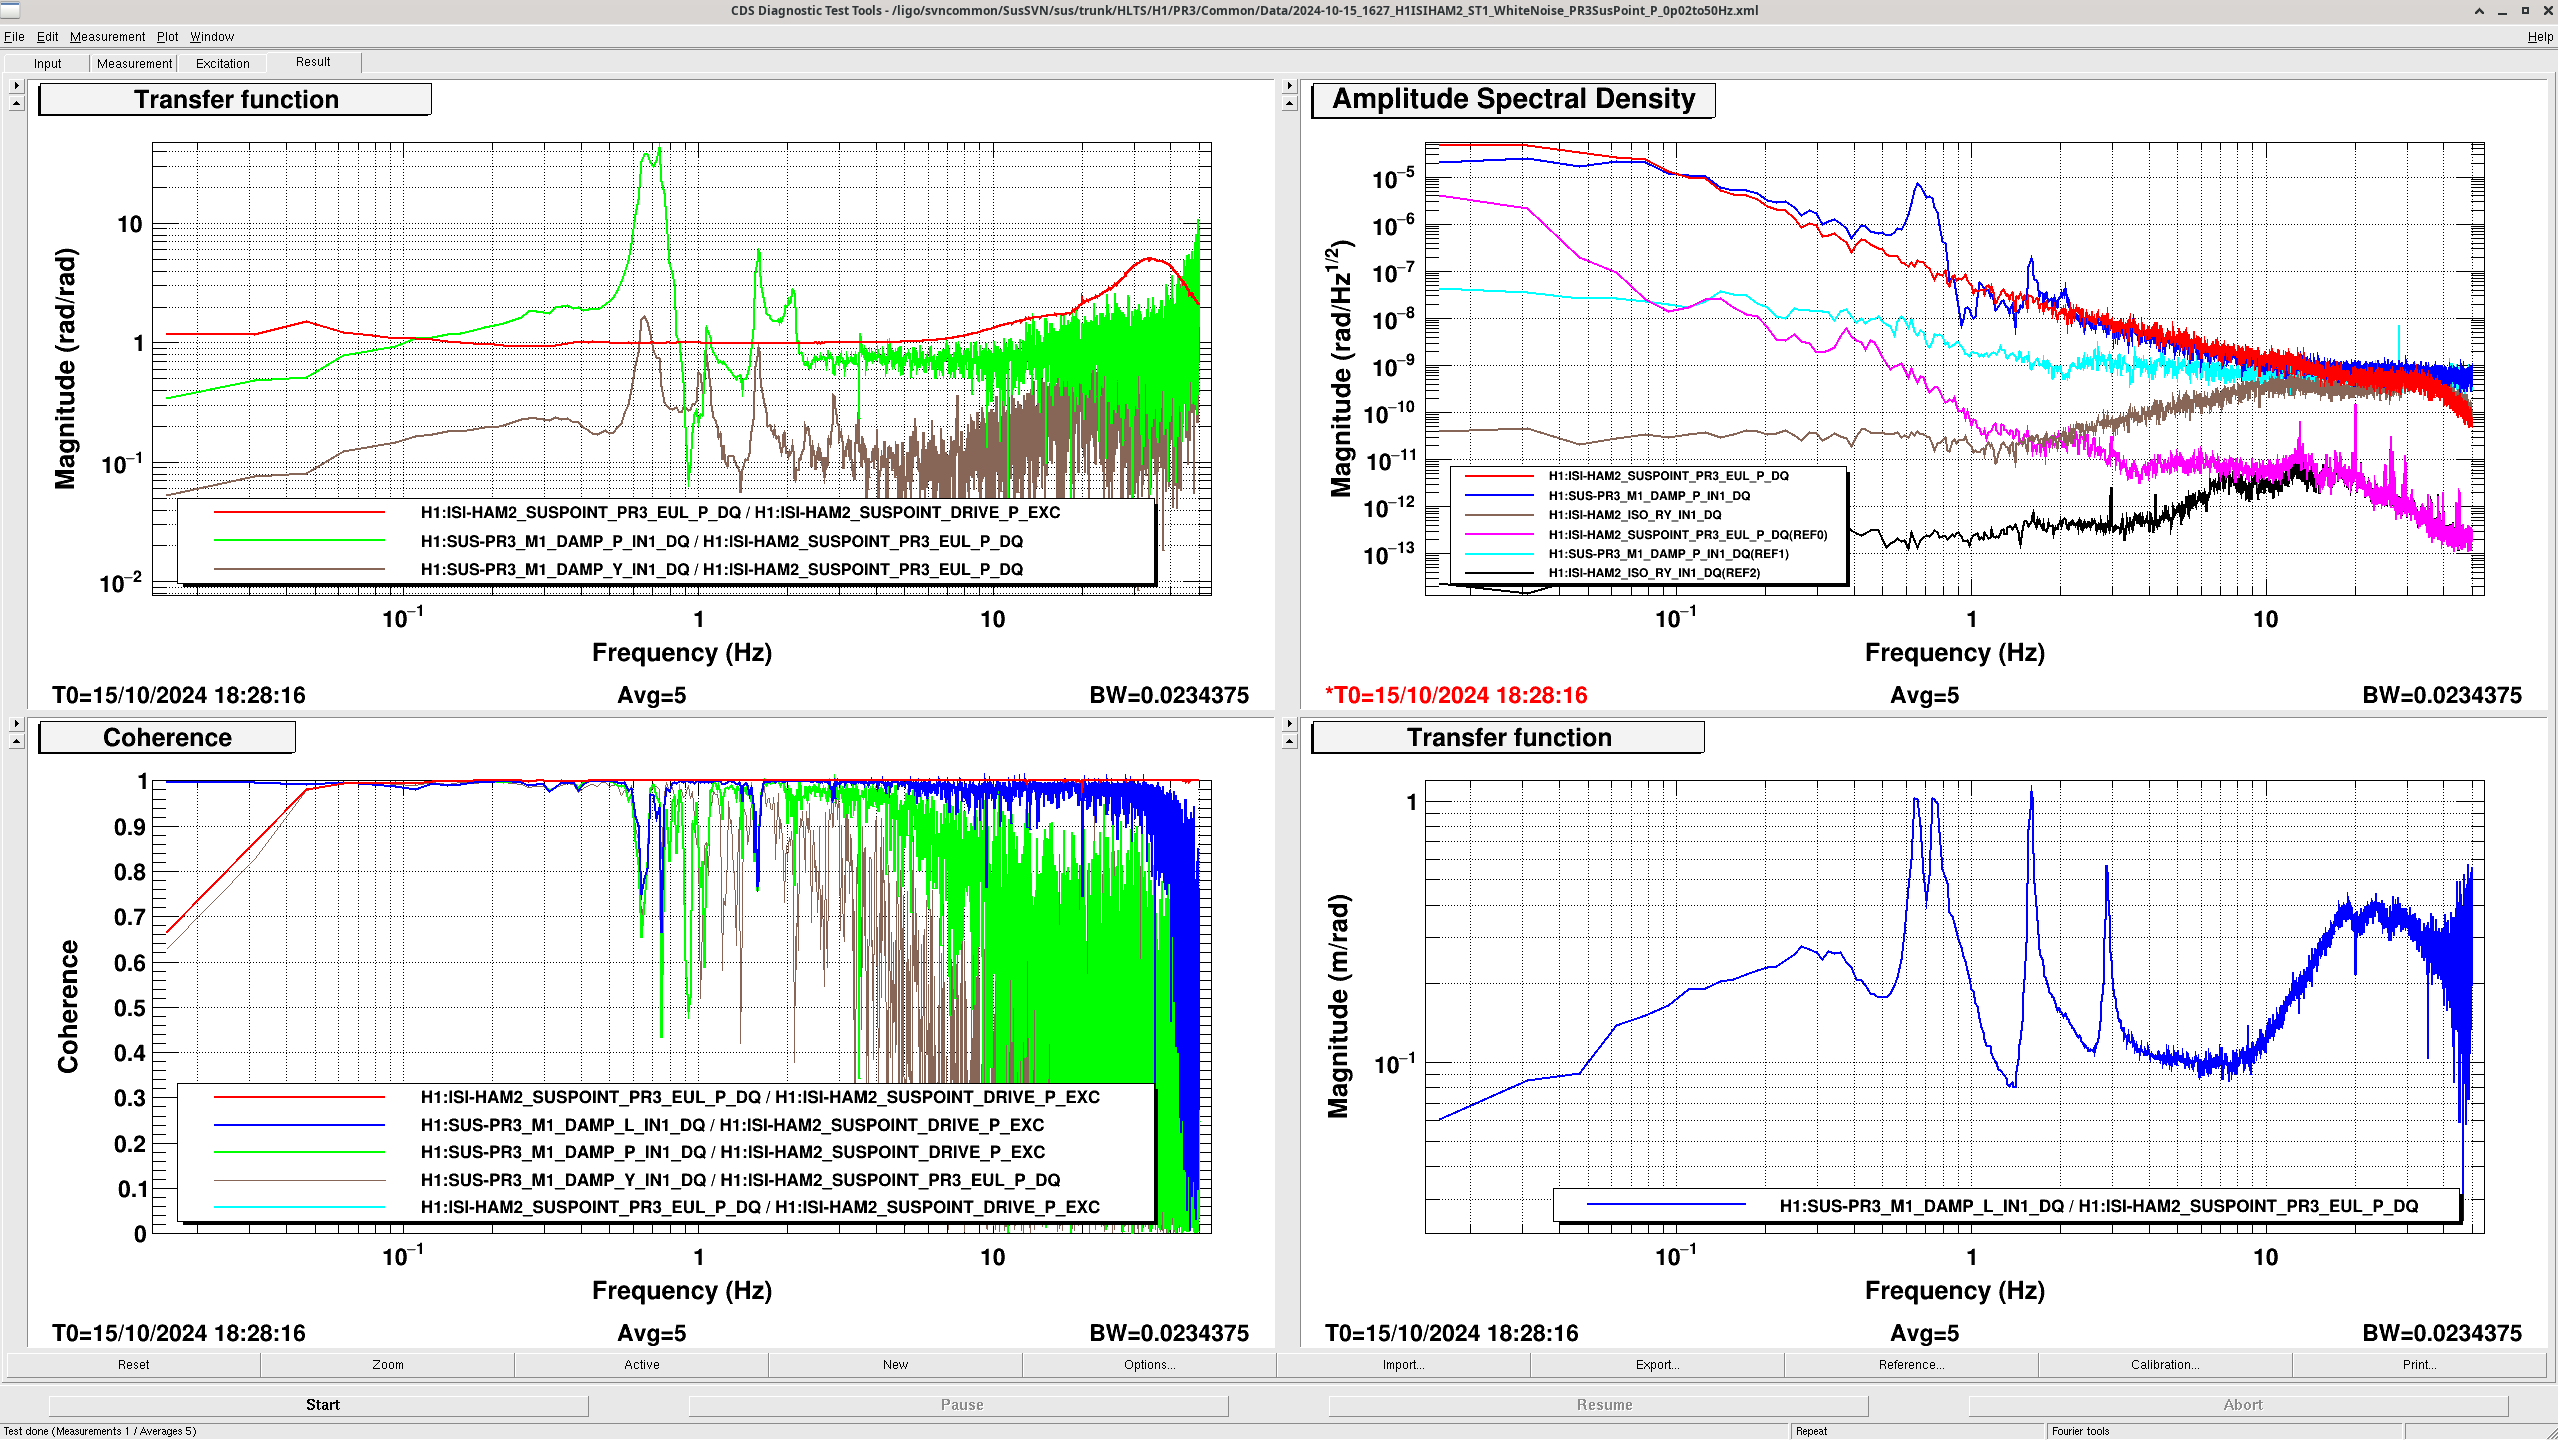
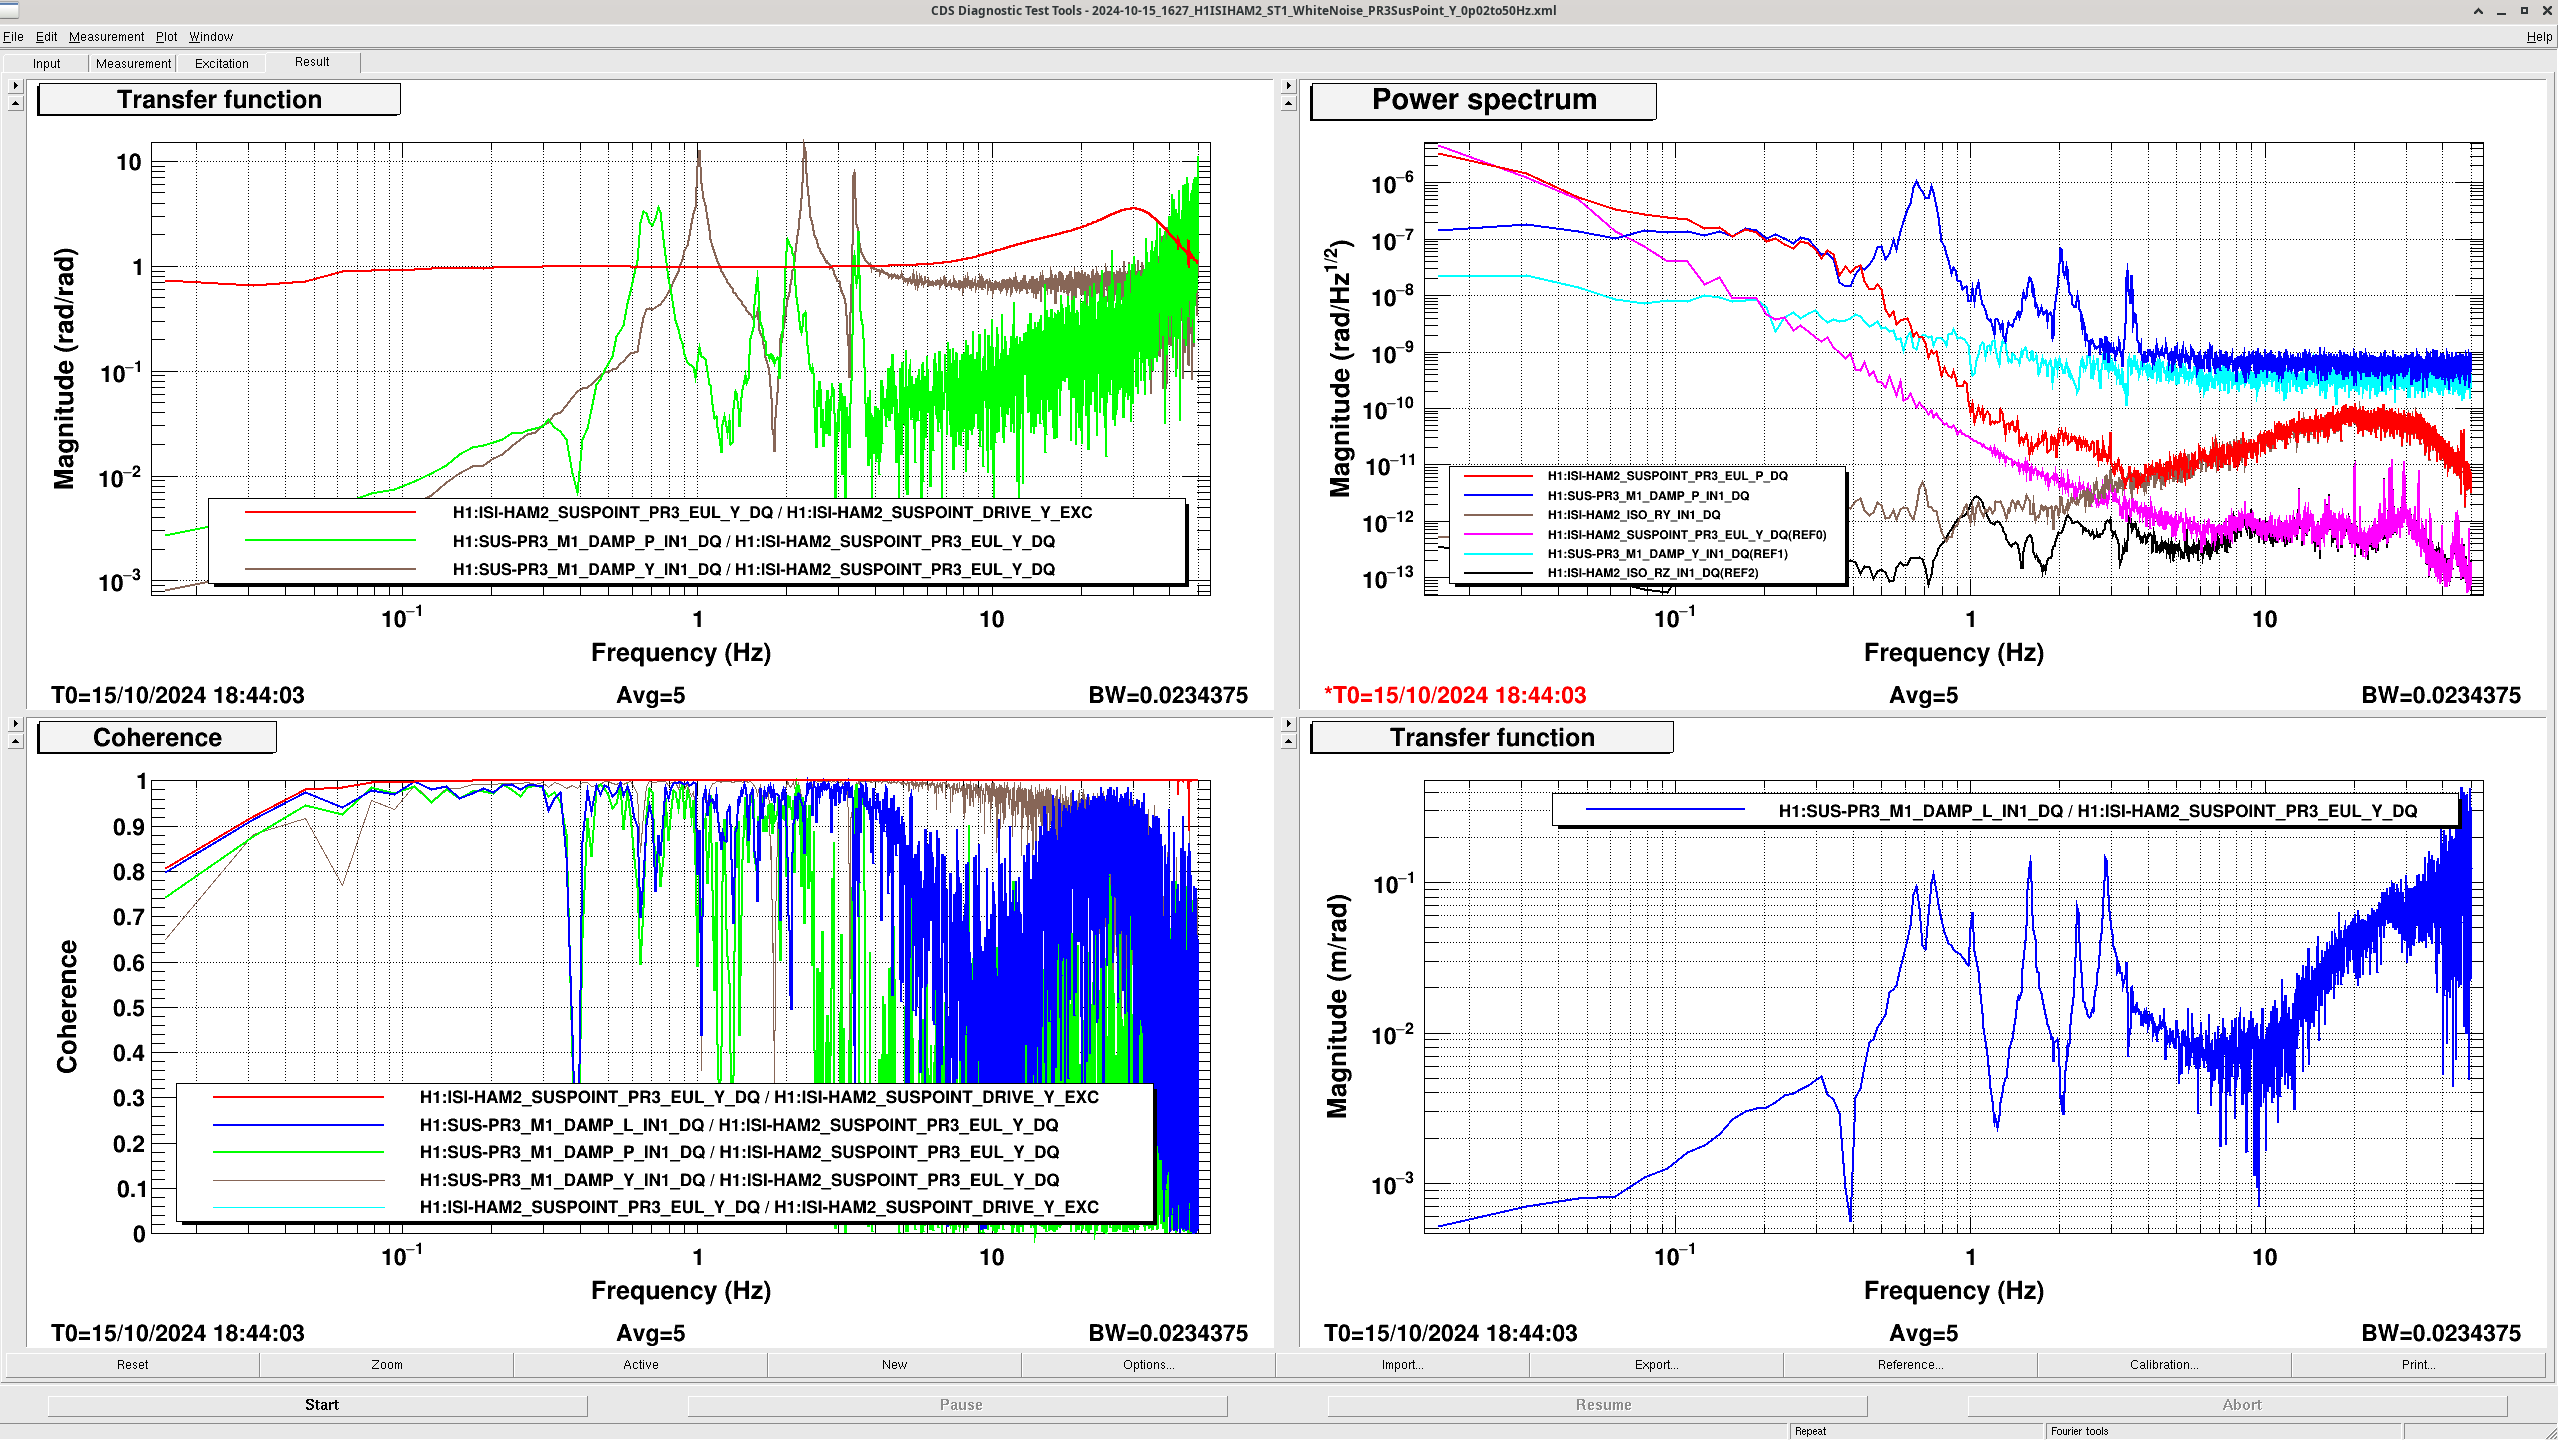
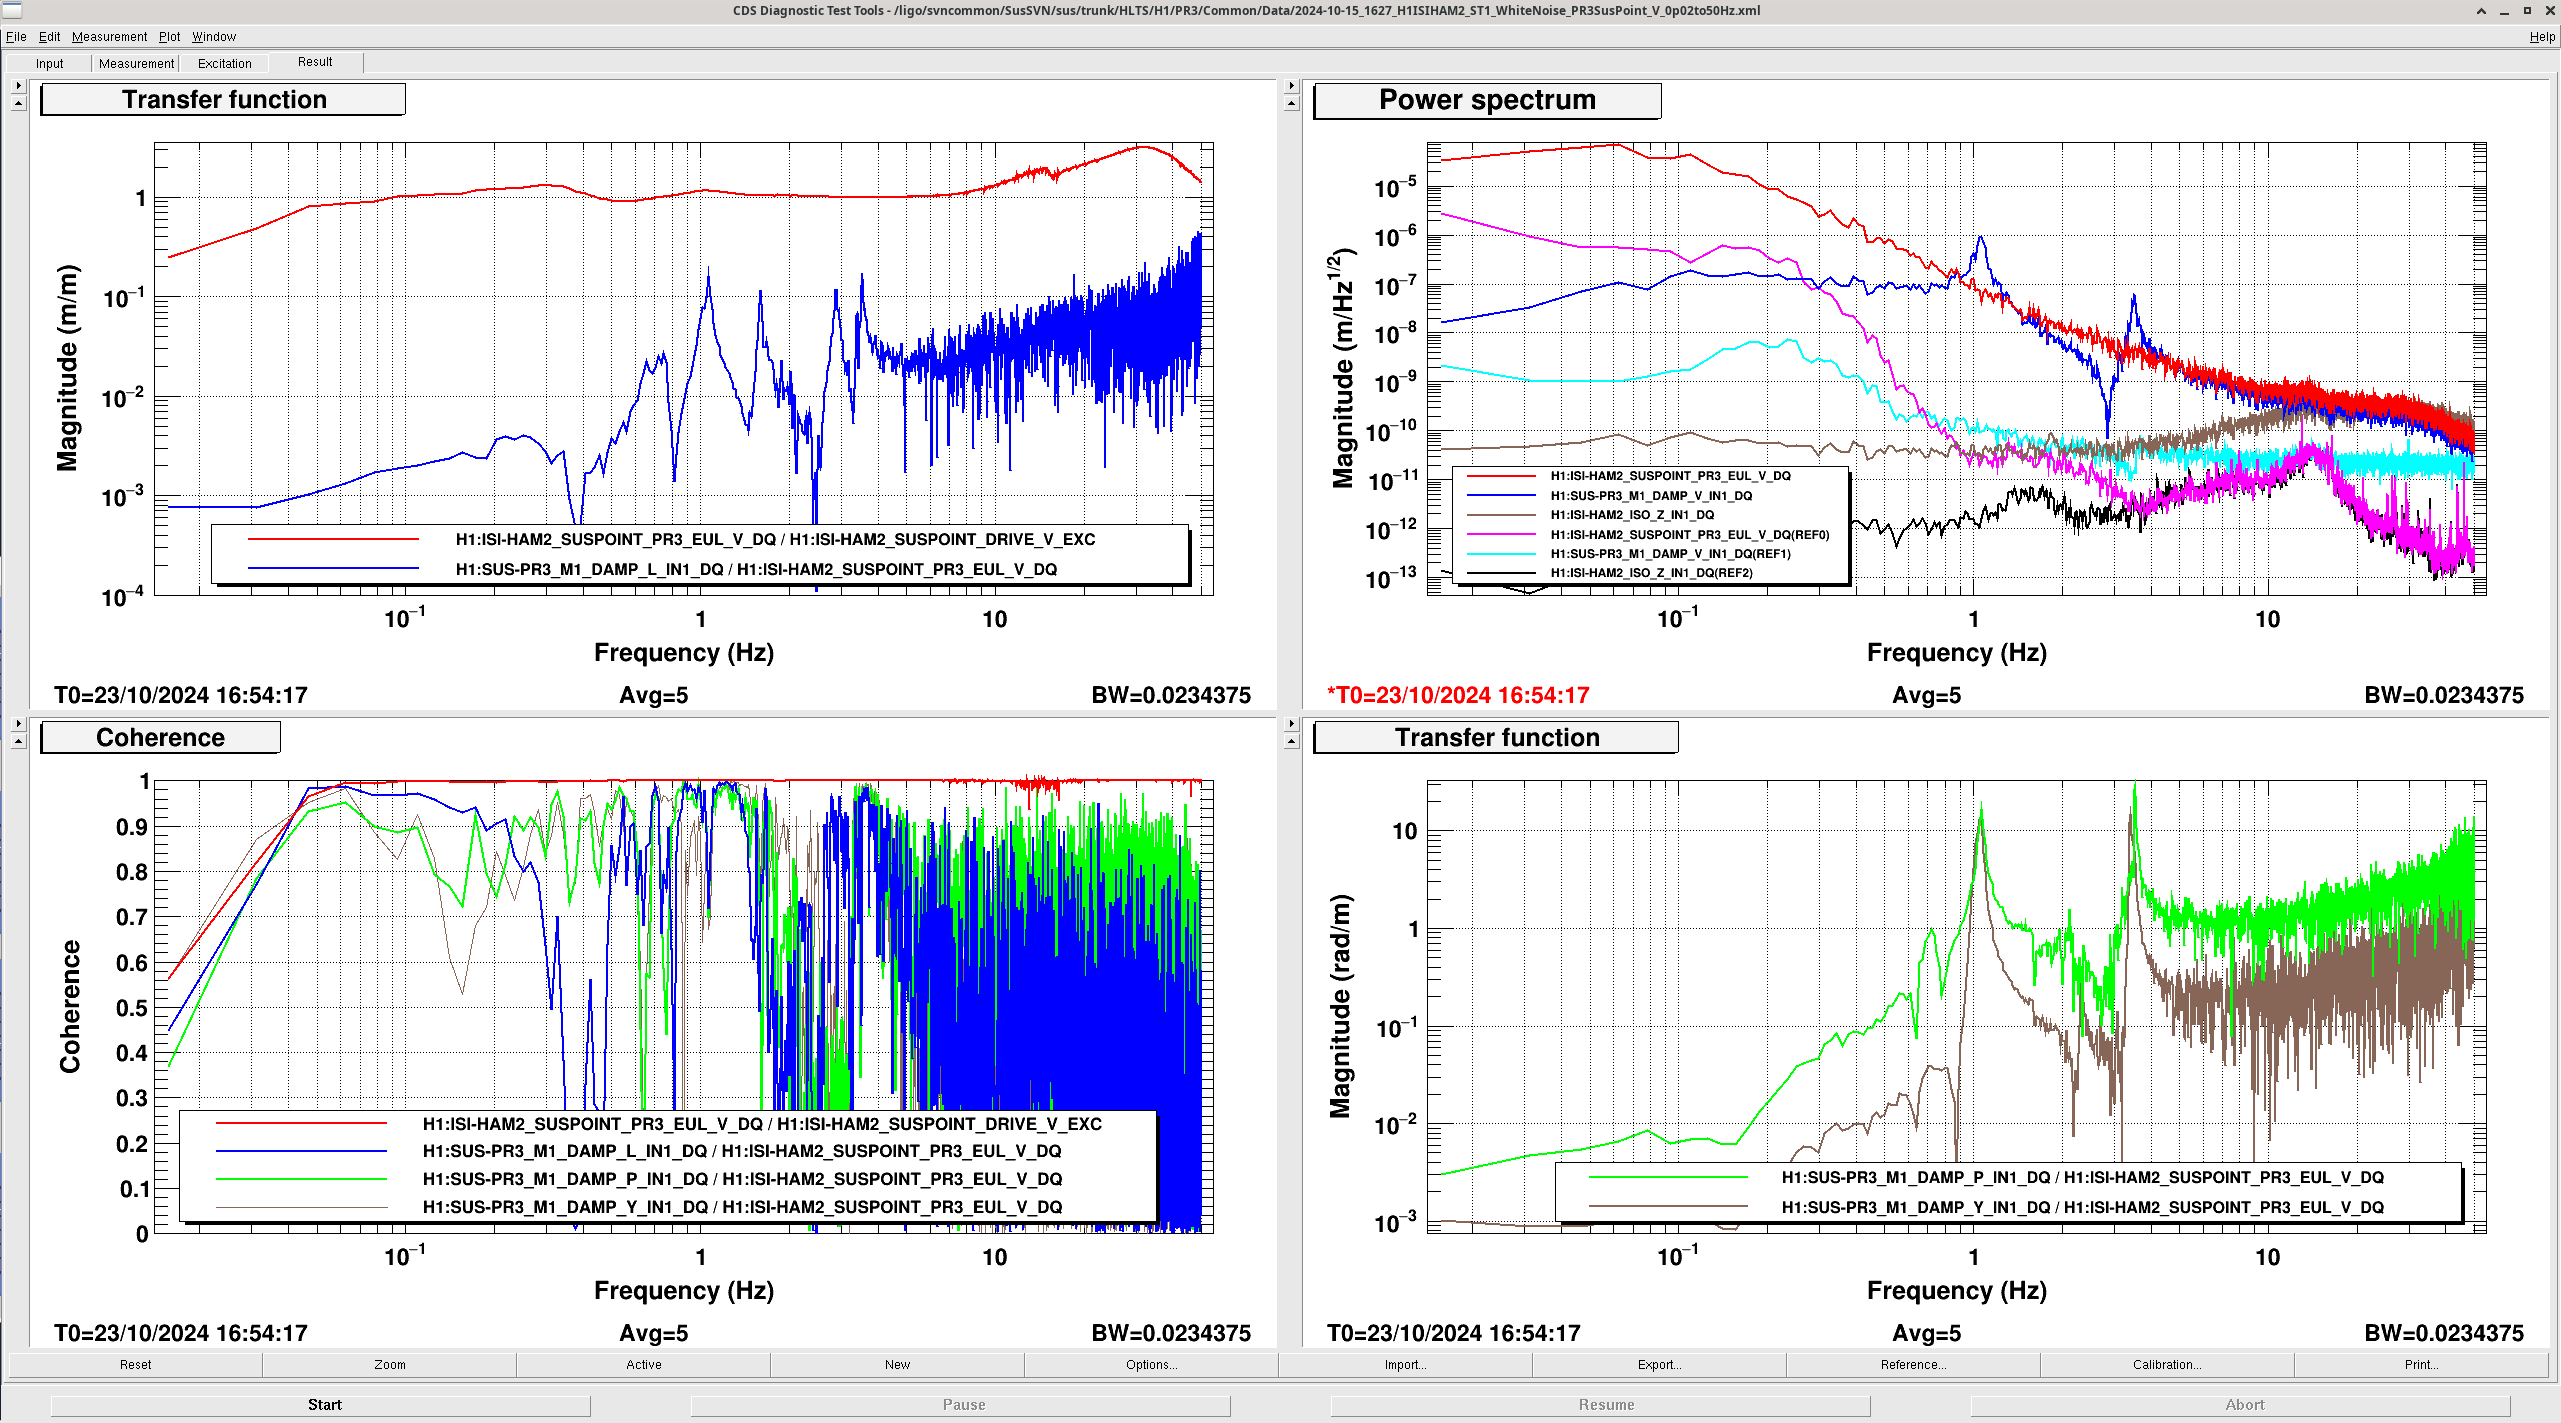
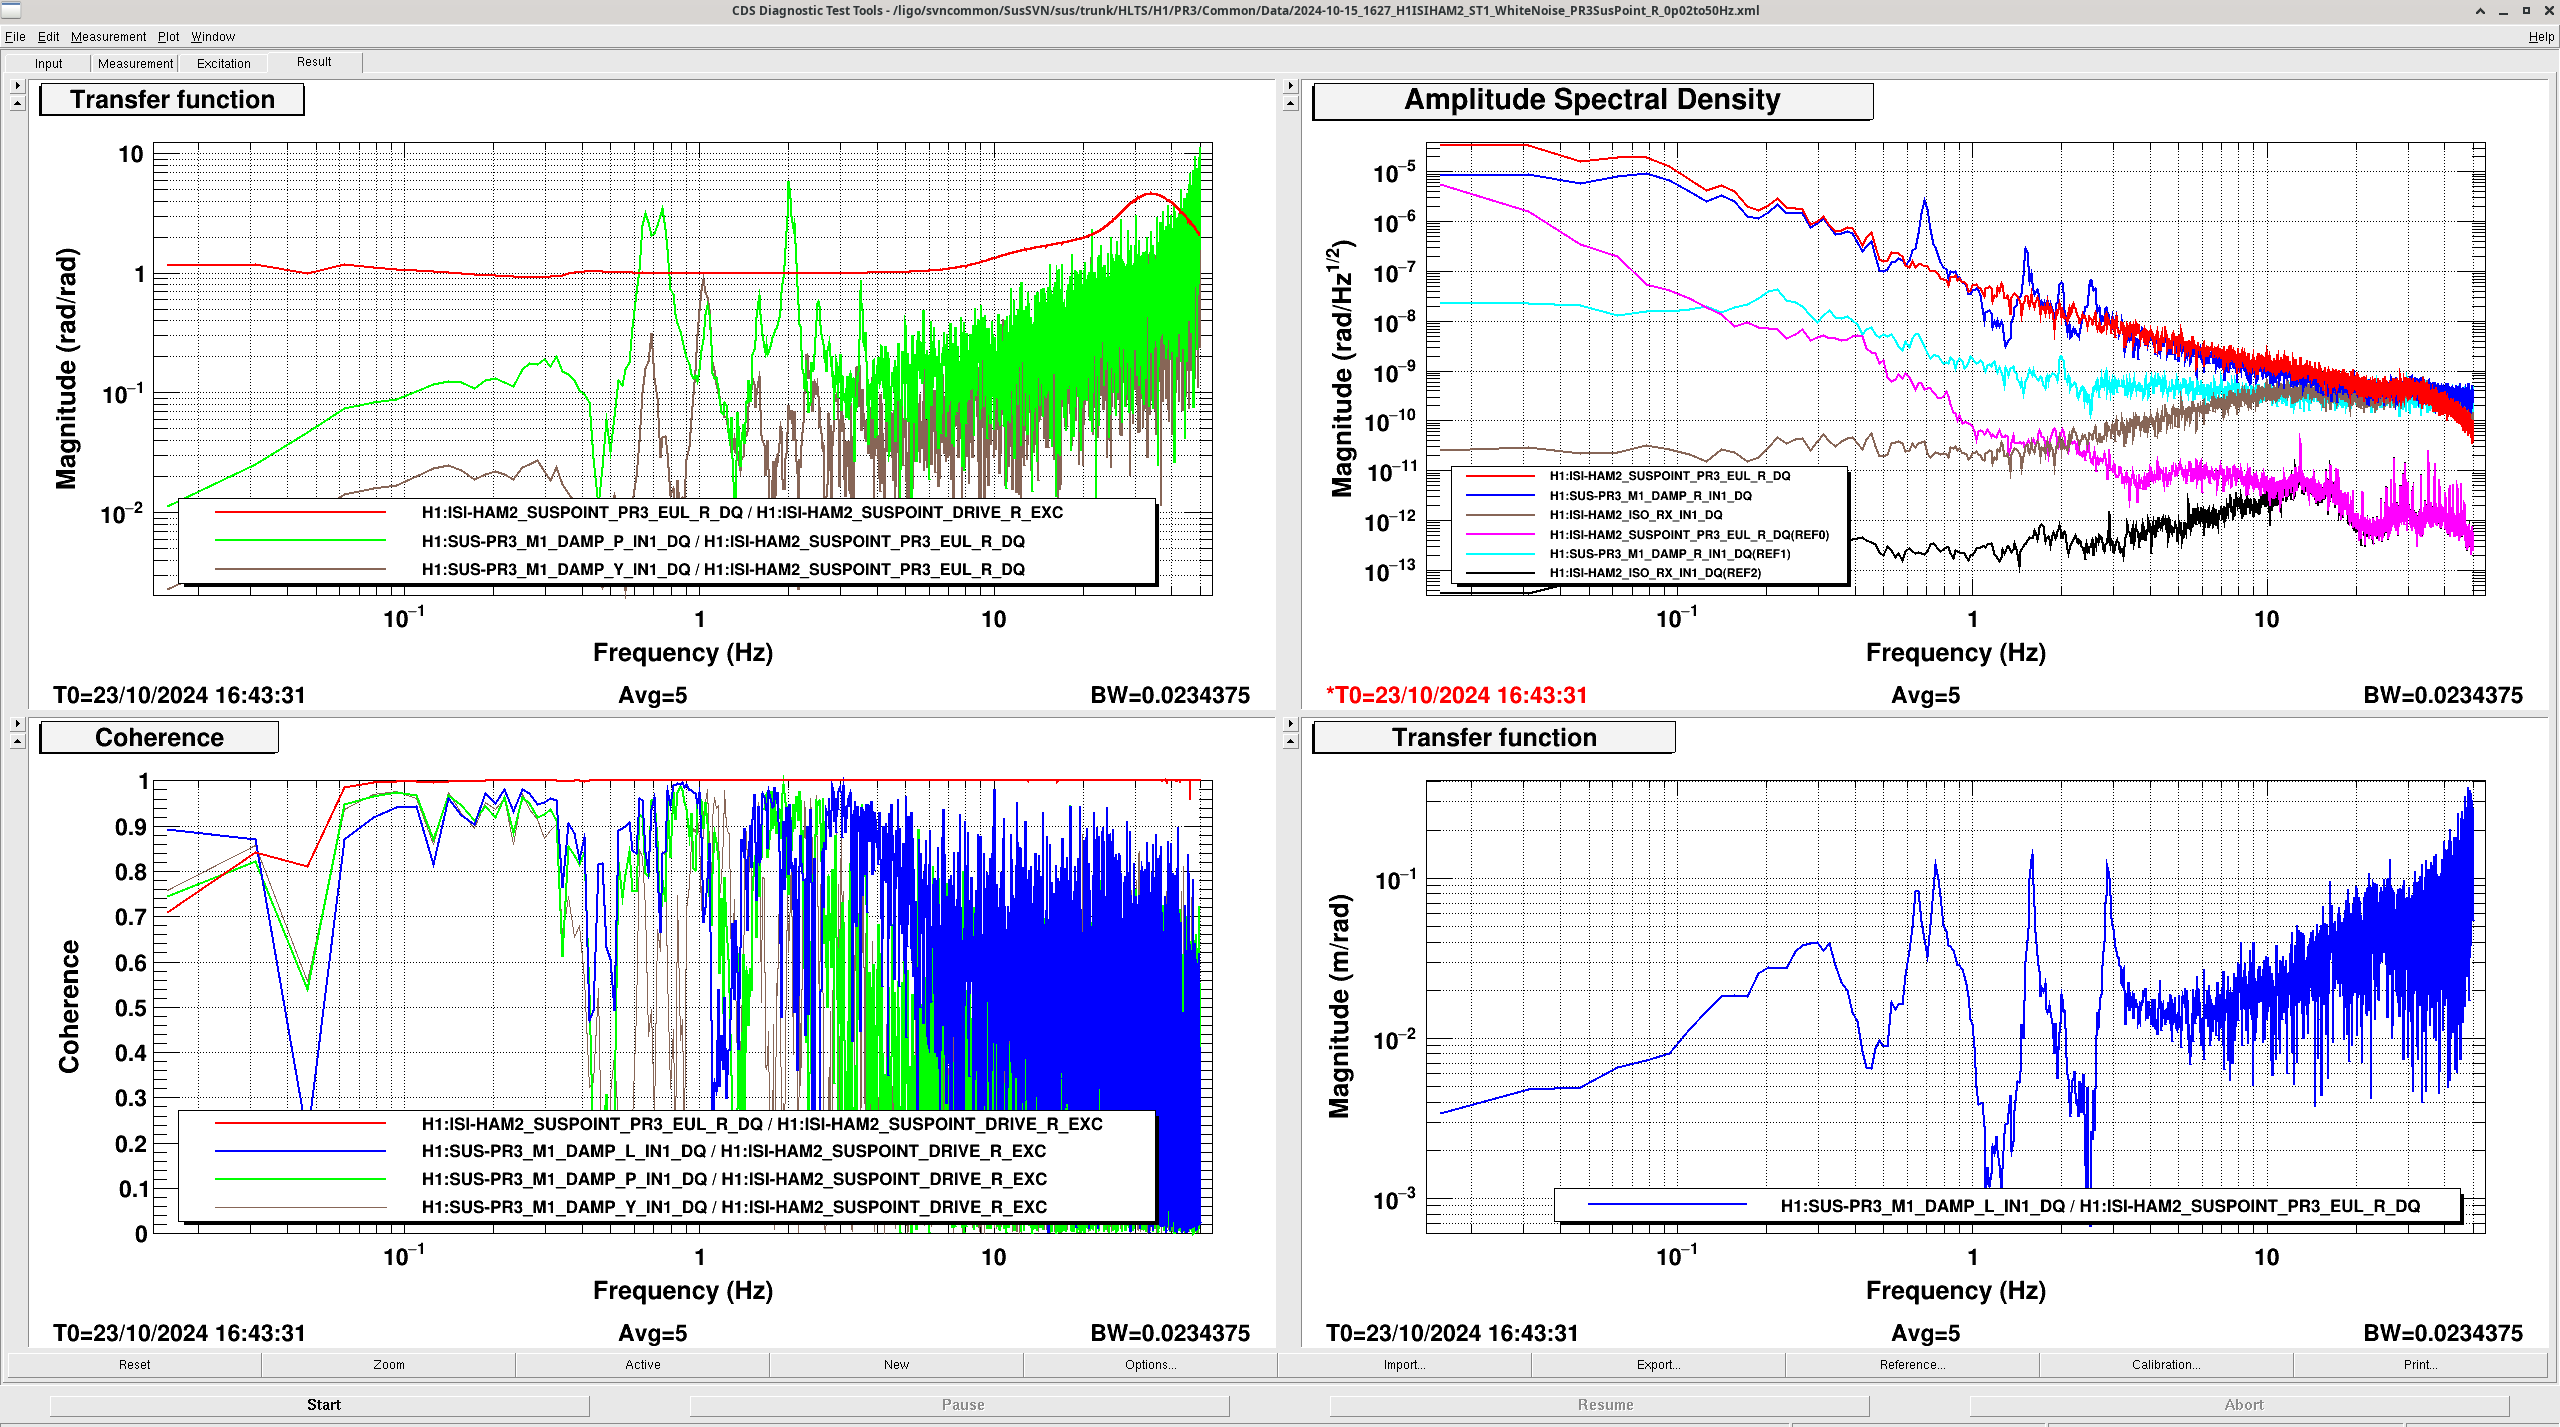
J. Kissel
WP 12140

I've completed 6 SUS + 4 ISI = 10 of 12 total DOF excitations that I wanted to drive before I ran out of time this morning. Each drive was "successful" in that I was able to get plenty of coherence between the 4 DOFs of ISI drive and SUS response, and some coherence between 6 SUS drive DOFs and ISI response. As expected, the bulk of the time was spent tuning the ISI excitations. I might have time to "finish" the data set and get the last two missing DOFs, but I was at least able to get both directions of LPY to LPY transfer functions, which are definitely juicy enough to get the analysis team started.

Measurement environmental/configuration differences of the HAM2 ISI from how they are nominally in observing:
    - PR3 M1 DAMP local damping loop gains are at -0.2, where they are nominally at -1.0. (The point of the test.)
    - CPS DIFF is OFF. (needed to do so for maintenance day)
    - Coil Driver z:p = 1:10 Hz analog low-pass (and digital compensation for it) is OFF. (need to do so to get good SNR on SUS M1 drive without saturating the SUS DACs)

Interesting things to call out that are the same as observing:
    - The PR3 alignment sliders were ON. P = -122 [urad]; Y = 100 [urad]. (Don't *expect* dynamics to change with ON vs. OFF, but we have seen diagonal response change if close an EQ stop. Haven't ever looked, but I wouldn't be surprised of off-diagonal responses change. Also DAC range gets consumed by DC alignment request, which is important for driving transfer functions.)
    - Corner station sensor correction, informed by the Bier Garten "ITMY" T240 on the ground. (the h1oaf0 computer got booted this morning, so we had to re-request the SEI_CS configuration guardian to be in WINDY. The SEI_ENV guardian had been set to LIGHT_MAINTENANCE.)
    - PR3 is NOT under any type of ISC global control; neither L, P, or Y. (global ISC feedback for the PRC's LPY DOFs goes to PRM and PR2.)

There are too many interesting transfer functions to attach, or even to export in the limited amount of time I have.
So -- I leave it to the LSC team that inspired this test to look at the data, and use as needed.

The data have been committed to the SVN here:
    /ligo/svncommon/SusSVN/sus/trunk/HLTS/H1/PR3/SAGM1/Data/
        2024-10-15_1627_H1SUSPR3_M1_WhiteNoise_L_0p02to50Hz.xml
        2024-10-15_1627_H1SUSPR3_M1_WhiteNoise_T_0p02to50Hz.xml
        2024-10-15_1627_H1SUSPR3_M1_WhiteNoise_V_0p02to50Hz.xml
        2024-10-15_1627_H1SUSPR3_M1_WhiteNoise_R_0p02to50Hz.xml
        2024-10-15_1627_H1SUSPR3_M1_WhiteNoise_P_0p02to50Hz.xml
        2024-10-15_1627_H1SUSPR3_M1_WhiteNoise_Y_0p02to50Hz.xml

    /ligo/svncommon/SusSVN/sus/trunk/HLTS/H1/PR3/Common/Data
        2024-10-15_1627_H1ISIHAM2_ST1_WhiteNoise_PR3SusPoint_L_0p02to50Hz.xml
        2024-10-15_1627_H1ISIHAM2_ST1_WhiteNoise_PR3SusPoint_T_0p02to50Hz.xml
            [ran out of time for V]
            [ran out of time for R]
        2024-10-15_1627_H1ISIHAM2_ST1_WhiteNoise_PR3SusPoint_P_0p02to50Hz.xml
        2024-10-15_1627_H1ISIHAM2_ST1_WhiteNoise_PR3SusPoint_Y_0p02to50Hz.xml


For the SUS drives templates, I gathered:
     Typical:
     - The top mass, M1, OSEM sensors, in the LTVRPY Euler Basis, calibrated into microns or microradians, [um] or [urad].
         H1:SUS-PR3_M1_DAMP_?_IN1_DQ             [Filtered with the 64x filter, then downsampled to to fs = 256 Hz]
     - The top mass, M1, OSEM sensors, in the T1T2T3LFRTSDD OSEM Sensor/Coil Basis, calibrated into microns, [um].
         H1:SUS-PR3_M1_OSEMINF_??_OUT_DQ         [Filtered with the 64x filter, then downsampled to to fs = 256 Hz]
     - The top mass, M1, OSEM coils' requested drive, in the T1T2T3LFRTSD OSEM Sensor/Coil Basis, in raw (18 bit) DAC counts, [ct_M1SUS18bitDAC].
         H1:SUS-PR3_M1_MASTER_OUT_??_DQ          [Filtered with the 32x filter, then downsampled to to fs = 512 Hz]

     For this set of templates:
     - The bottom mass i.e. optic, M3, OSEM sensors, in the LPY Euler Basis, calibrated into microns or microradians, [um] or [urad].
         H1:SUS-PR3_M3_WIT_?_DQ                  [Filtered with the 64x filter, then downsampled to to fs = 256 Hz]
     - The bottom mass i.e. optic, M3, optical lever, in PIT YAW Euler Basis, calibrated into mircoradians, [urad].
         H1:SUS-PR3_M3_OPLEV_???_OUT_DQ          [Filtered with the 64x filter, then downsampled to to fs = 256 Hz]
     - The ISI's Stage 1 GS13 inertial sensors, projected to the PR3 suspension point LTVRPY Euler basis, calibrated into nanometers or nanoradians, [nm] or [nrad]
         H1:ISI-HAM2_SUSPOINT_PR3_EUL_?_DQ       [Filtered with the 4x filter, then downsampled to to fs = 1024 Hz]
     - The ISI's Stage 1 super sensors, in the ISI's Cartesian XYZRXRYRZ basis, calibrated into nanometers or nanoradians, [nm] or [nrad]
         H1:ISI-HAM2_ISO_*_IN1_DQ                [Filtered with the 2x filter, then downsampled to to fs = 2048 Hz]

Note: The six M1 OSEM sensors in the Euler Basis are set to be the "A" channels, such that you can reconstruct the transfer function between the M1 Euler Basis to all the other response channels in the physical units stated above. As usual the excitation channel for the given drive DOF (in each template, that's H1:SUS-MC3_M1_TEST_?_EXC) is automatically stored, but these channels are in goofy "Euler Basis (18-bit) DAC counts," so tough to turn into physical units.

For the brand new ISI drive templates, I gathered:
     - The ISI's Stage 1 super sensors, in the ISI's Cartesian XYZRXRYRZ basis, calibrated into nanometers or nanoradians, [nm] or [nrad]
         H1:ISI-HAM2_ISO_*_IN1_DQ                [Filtered with the 2x filter, then downsampled to to fs = 2048 Hz]
     - The ISI's Stage 1 GS13 inertial sensors, projected to the PR3 suspension point LTVRPY Euler basis, calibrated into nanometers or nanoradians, [nm] or [nrad]
         H1:ISI-HAM2_SUSPOINT_PR3_EUL_?_DQ       [Filtered with the 4x filter, then downsampled to to fs = 1024 Hz]

     - The top mass, M1, OSEM sensors, in the LTVRPY Euler Basis, calibrated into microns or microradians, [um] or [urad].
         H1:SUS-PR3_M1_DAMP_?_IN1_DQ             [Filtered with the 64x filter, then downsampled to to fs = 256 Hz]
     - The bottom mass i.e. optic, M3, OSEM sensors, in the LPY Euler Basis, calibrated into microns or microradians, [um] or [urad].
         H1:SUS-PR3_M3_WIT_?_DQ                  [Filtered with the 64x filter, then downsampled to to fs = 256 Hz]
     - The bottom mass i.e. optic, M3, optical lever, in PIT YAW Euler Basis, calibrated into mircoradians, [urad].
         H1:SUS-PR3_M3_OPLEV_???_OUT_DQ          [Filtered with the 64x filter, then downsampled to to fs = 256 Hz]
     - The ISI's Stage 1 actuators' requested drive, in the H1H2H3V1V2V3 ISI actuator basis, in raw (16-bit) DAC counts, [ct_ISIST116bitDAC].
         H1:ISI-HAM2_OUTF_??_OUT                 [Didn't realize in time that there are DQ channels H1:ISI-HAM2_MASTER_??_DRIVE_DQ stored at fs = 2048 Hz, or I would have used those.]

Note: Here, I set the number of "A" channels to twelve, such that both the ISI's Cartesian basis and the PR3 Suspoint basis versions of the GS13s can be used as the transfer function reference channel.
OK ok ok. I couldn't resist and it didn't take that long.

I attach the unit-full transfer functions between the ISI Sus. Point Drive DOFs (L, P, Y, and T) and the Top Mass SUS M1 OSEMs response in L, P, Y.

It's.... a complicated collection of TFs; and this isn't all of them that are relevant!

Just to make the point that Dan DeBra taught Brian Lantz, who taught me, and we're passing down to Edgard Bonilla: *every* DOF matters; the one you ignore is the one that will bite you.
The transverse, T, DOF drive data set demonstrates this point. None of these transverse to LPY couplings nominally exist if we just consider first principles equations of rigid-body motion of an ideal suspension. But alas, the on-resonance coupling from T to L, P, Y ranges from 0.1 ... to 50 [m/m] or [rad/m].

I may need to drive the ISI with an entirely different color of excitation to resolve these transfer functions above 5 Hz, where it's perhaps most interesting for DARM, but this is a good start.

The ISI drive templates have been re-committed to the repo with the calibrations of each channel in place. (It was really easy: just multiplying each channel by the appropriate 1e-9 [m/nm] or 1e-6 [m/um] in translation, and similar 1e-9 [rad/nrad] or 1e-6 [rad/urad].)
Thank Jeff!
You were right - this looks much more interesting than I had hoped. We'll run the scripts for the SUS to SUS TFs and put them up here, too.
Transverse to Pitch at 50 rad/m on resonance. Maybe "only" 10 when you turn up the damping to nominal? Ug.
I've also taken a look at how much the ISI moves when Jeff drives the BOSEMs on the top stage of PR3. The answer is "not very much". I've attached two plots, one for the top mass Yaw drive and the other for the top mass length drive. note - The ISI reponses need to be divided by 1000 - they are showing nm or nrad/drive, while the SUS is showing microns or microradians/drive.
So - the back reaction of the osem drives can be safely ignored for PR3, and probably all the triples, as expected. (maybe not for the TMs, not that it matters right now).
It raises 2 questions
1. How do I divide a line by 1000 in a dtt plot? (I feel so old)
2. Why does the green line (SUSPoint) look so much noiser that the cart-basis blend signals? I would expect these to look nearly identical above about 1/2 Hz, because the blend signal is mostly GS-13. The calibrations look right, so why does the TF to the GS-13 signal look so much worse than the TF to the blend output?
These plots are at {SUS_SVN}/HLTS/H1/PR3/SAGM1/Results/
2024-10-15_length_to_length_plot.pdf
2024-10-15_yaw_to_yaw_plot.pdf
I grabbed the remaining ISI drive degrees of freedom this morning, V and R. The color and strength of the excitation was the same as it was on Oct 15th, where I used the L drive excitation params for V, and the P drive excitation params for R.

PR3 damping loops gains were at -0.2 again,
Sensor correction is ON,
CPS DIFF is OFF.
PR3 alignment offsets are ON.

For these two data sets, the PR3 top mass coil driver low pass was still ON (unlike the Oct 15th data), but with the damping loop gains at -0.2, there's no danger of saturation at all, and the low pass filter's response is well compensated, so it has no impact on any of the ISI excitation transfer functions to SUS-PR3_M1_DAMP_?_IN1_DQ response channels. It's only really important to have the LP filter OFF when driving the SUS.

There was the remnants of an earthquake happening, but the excitations were loud enough that we still got coherence above at least 0.05 Hz.

Just for consistency's sake of having a complete data set, I saved the files with virtually the same file name:
     /ligo/svncommon/SusSVN/sus/trunk/HLTS/H1/PR3/Common/Data/
         2024-10-15_1627_H1ISIHAM2_ST1_WhiteNoise_PR3SusPoint_L_0p02to50Hz.xml
         2024-10-15_1627_H1ISIHAM2_ST1_WhiteNoise_PR3SusPoint_T_0p02to50Hz.xml
         2024-10-15_1627_H1ISIHAM2_ST1_WhiteNoise_PR3SusPoint_V_0p02to50Hz.xml   # New as of Oct 23
         2024-10-15_1627_H1ISIHAM2_ST1_WhiteNoise_PR3SusPoint_R_0p02to50Hz.xml   # New as of Oct 23
         2024-10-15_1627_H1ISIHAM2_ST1_WhiteNoise_PR3SusPoint_P_0p02to50Hz.xml
         2024-10-15_1627_H1ISIHAM2_ST1_WhiteNoise_PR3SusPoint_Y_0p02to50Hz.xml
Today I also gathered another round of all six DOFs of ISI excitation, but this time changing the color of the excitation to get more coherence between 1 to 20 Hz -- since this is where the OSEM noise matters the most for the IFO. In the end, the future fitter may have to end up combining the two data sets to get the best estimate of the plant.

In the same folder, you'll find
    /ligo/svncommon/SusSVN/sus/trunk/HLTS/H1/PR3/Common/Data
        2024-10-23_1739_H1ISIHAM2_ST1_WhiteNoise_PR3SusPoint_L_0p02to50Hz.xml
        2024-10-23_1739_H1ISIHAM2_ST1_WhiteNoise_PR3SusPoint_P_0p02to50Hz.xml
        2024-10-23_1739_H1ISIHAM2_ST1_WhiteNoise_PR3SusPoint_R_0p02to50Hz.xml
        2024-10-23_1739_H1ISIHAM2_ST1_WhiteNoise_PR3SusPoint_T_0p02to50Hz.xml
        2024-10-23_1739_H1ISIHAM2_ST1_WhiteNoise_PR3SusPoint_V_0p02to50Hz.xml
        2024-10-23_1739_H1ISIHAM2_ST1_WhiteNoise_PR3SusPoint_Y_0p02to50Hz.xml

Happy fitting!
Here is the set of plots generated by {SUSsvn}/Common/MatlabTools/plotHLTS_dtttfs_M1 for the data Jeff collected on Oct 15.
(see above, the data set is in 6 text file with names like 2024-10-15_1627_H1SUSPR3_M1_WhiteNoise_L_0p02to50Hz_tf.txt (L, P, Y, etc)
These are funny looking because the damping loops are only running at 1/5 of the normal gain. This gives higher-Q peaks and less OSEM noise coupling. This is done as part of an exercise to run the detector with a combination of real OSEM signals (ie the ones here) PLUS model-based OSEM estimators. I've set the script to show all the cross terms, and these are clearly present. It remains to be seen how much the various cross terms will matter. This is the data we will use to help answer that question.
I've also attached a slimmed-down version of the cross-coupling plots which just shows the coupling to yaw. These are the same plots as above with some of the lines removed so that I can see what is happening to yaw more easily. In each plot the red is the measured cross-coupling from dof-drive to Yaw-response. For reference, these also include the light-blue yaw-to-yaw and the grey dof-to-dof measurements.
These plots and the .mat file are in the SUS SVN at {SUS_SVN}/HLTS/H1/PR3/SAGM1/Results/
2024-10-15_1627_H1SUSPR3_M1.mat
2024-10-15_1627_H1SUSPR3_TFs_lightdamping_yawonly.pdf
2024-10-15_1627_H1SUSPR4_M1_ALL_TFs_lightdamping.pdf
On a side note, the ISI to ISI TFs are not unity between 0.1 and 1 Hz. I think they should be. This is a drive from the blended input of the control loop (well, several, because it's in the EUL basis) to the signal seen on the GS-13, in the same EUL basis, converted to displacement (so it will roll off below 30 mHz, because the the realtime calibration of the GS-13s in displacement rolls off, and it has a bump at 30 Hz because this is really the complementary sensitivity, and that has a bump because of the servo bump)
But it should be really close to 1 from 0.1 to 3 Hz. The rotational DOFs (right side, red line) look pretty good, but the translations (L, V, T) all show a similar non-unity response. Jim and Brian should discuss. They look similar to each other, so maybe it's a blend which isn't quite complementary?
I've plotted the TFs from the SUSpoint drive to the M1 EUL basis TFs. Note that in the plots, I've adjusted the on-diagonal model plots to be -1 + model. The model is the INERTIAL motion of the top stage, the measured TFs all show the RELATIVE motion between the ISI and top stage. So you want to model Top/ISI - ISI/ISI or -1 + model. This is only true for the on-diagonal TFs.
The code to do this lives in {SUSsvn}/HLTS/Common/MatlabTools/plotHLTS_ISI_dtttfs_M1.m
I've attached a big set of pdfs. The cross couplings look not-so-great. See the last 5 plots for the cross-couplings of dof->Yaw. in particular, L->Y is about the same as Y->Y. (pg 22)
The pdfs and the .mat file have been committed to the SVN at
{SUSsvn}/HLTS/H1/PR3/SAGM1/Results/
2024-10-15_1627_H1SUSPR3_M1_SUSpointDrive.mat
2024-10-15_1627_H1SUSPR3_M1_ALL_TFs_lightdamping_SUSpointDrive.pdf
(Also, see in the previous comments, there was a file which I named ...PR4... this is now corrected to ...PR3... )

