Following yesterday's work (alog 89745), ISCT1 was moved in place (but not landed, so the table is much higher than usual for now) to check the in-air beams.
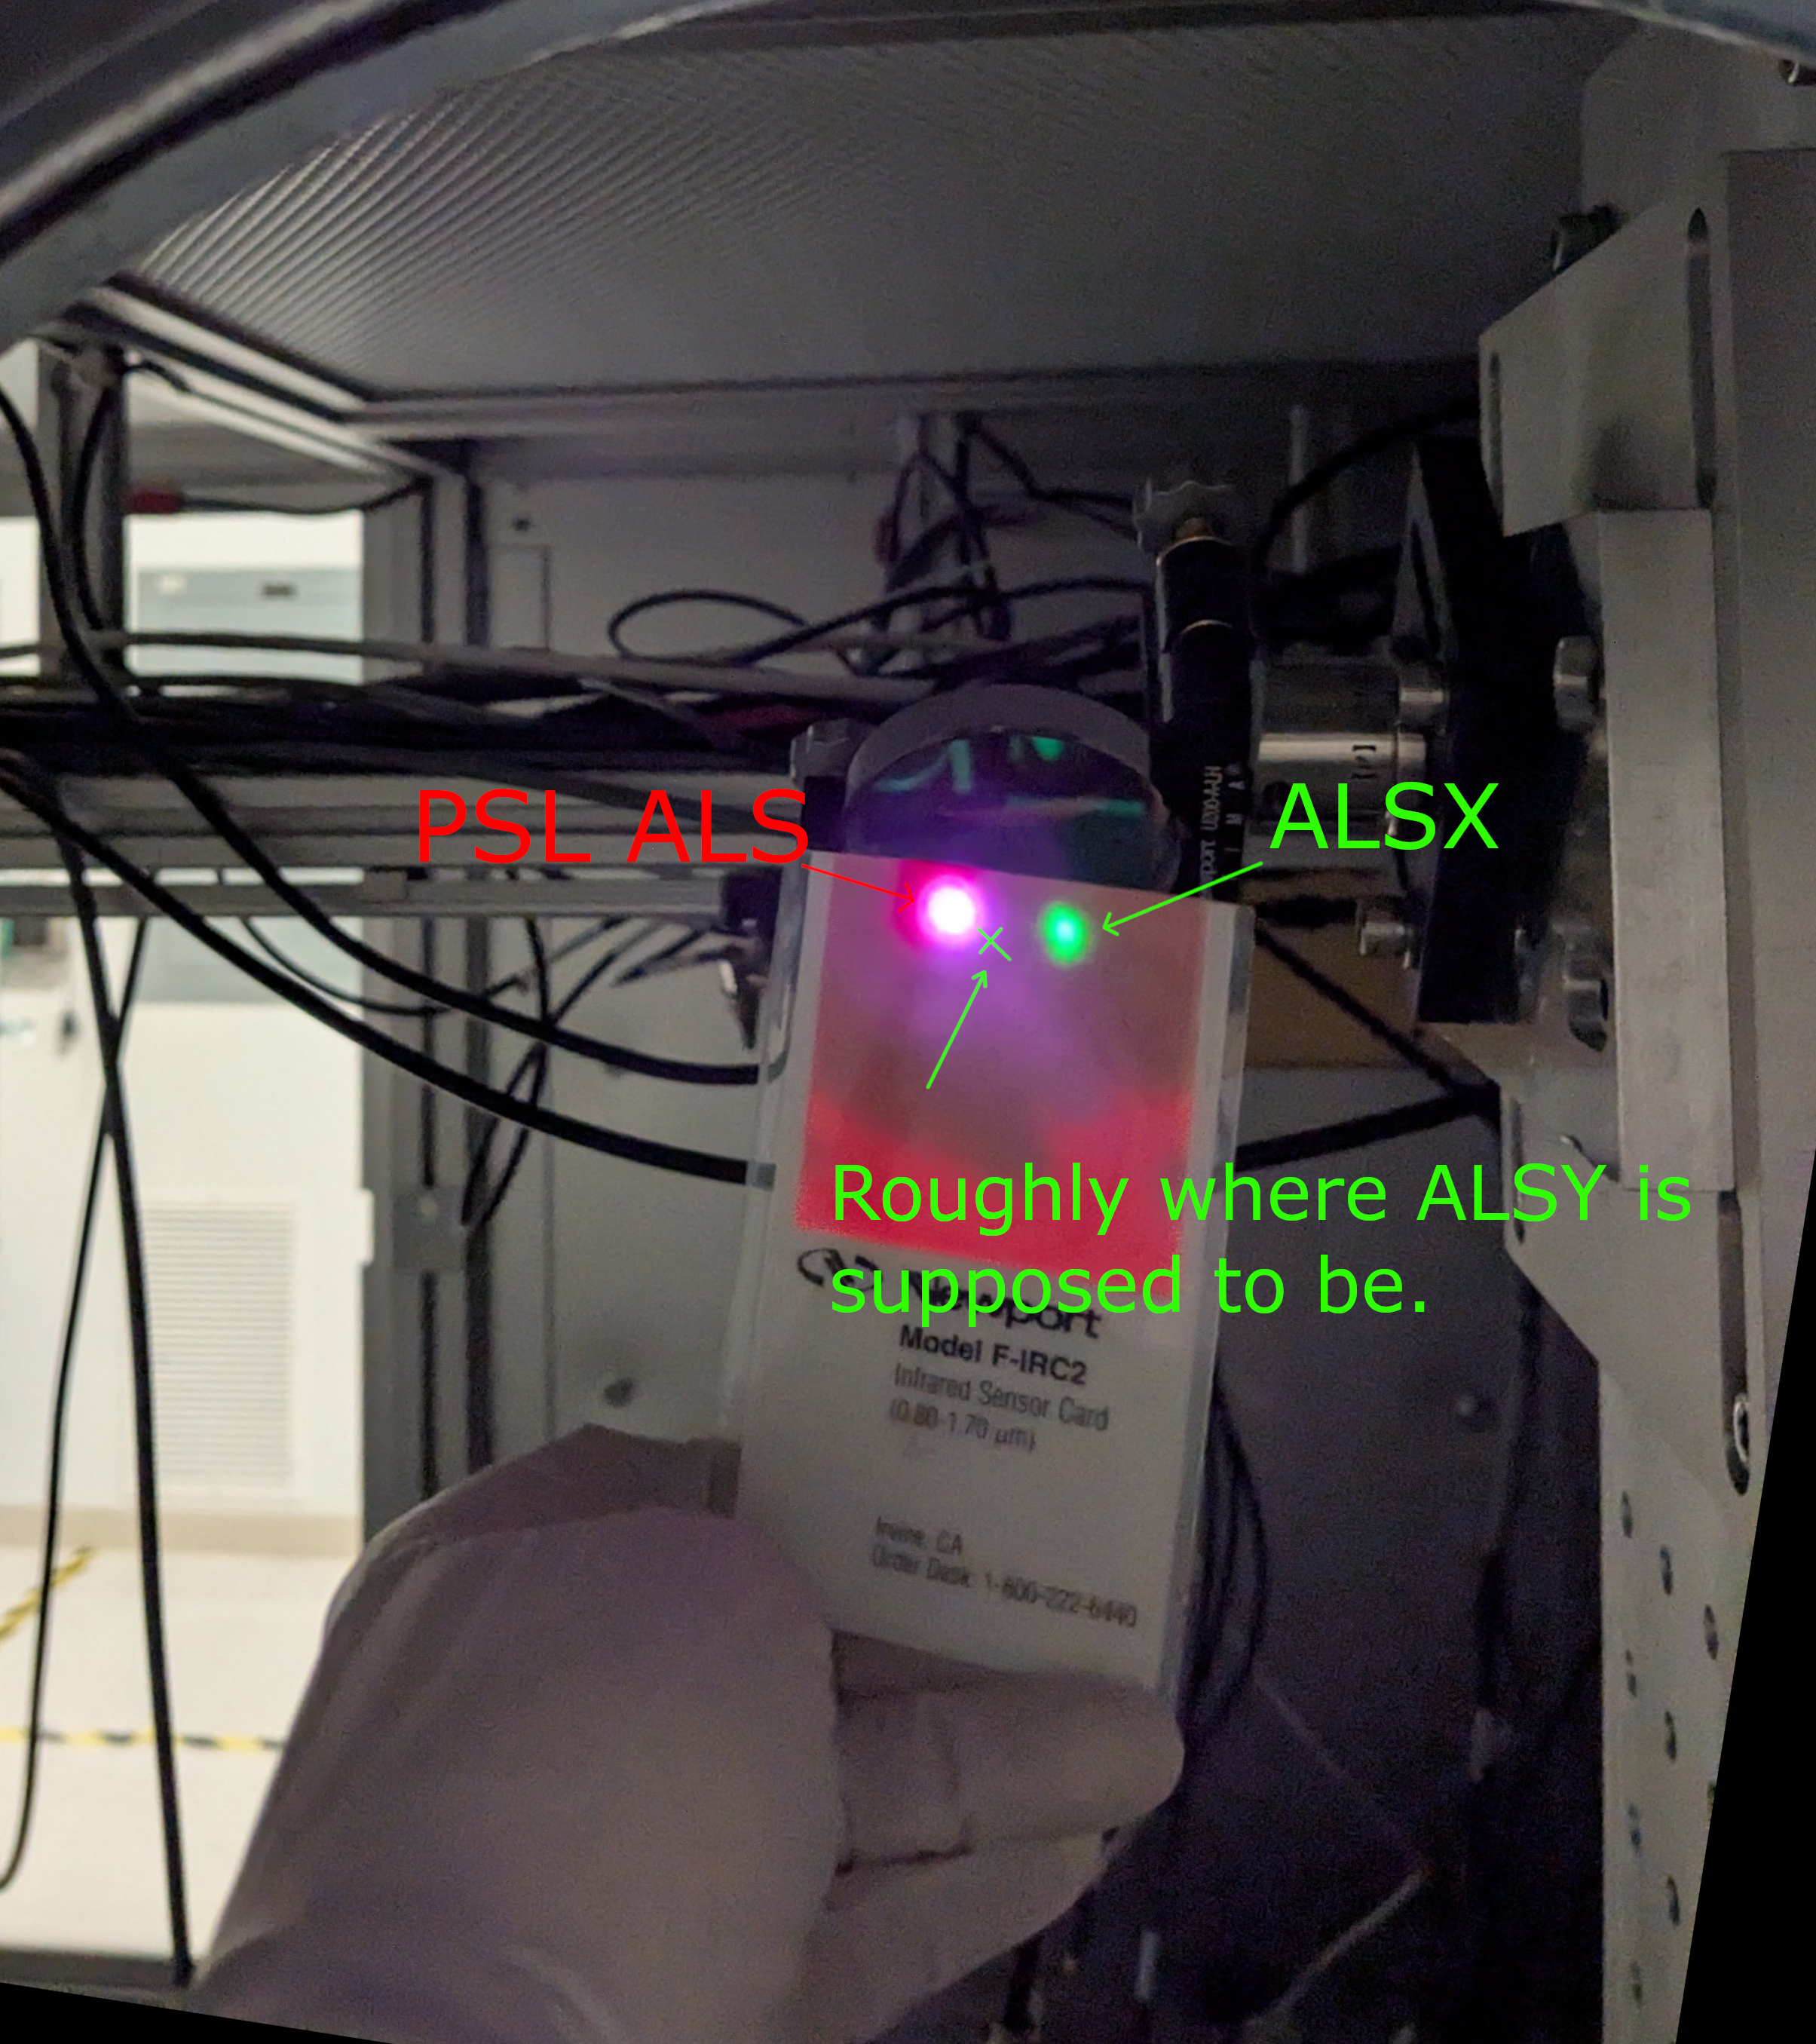
ALS beam from the PSL table as well as green ALSX beam:
Was already good. See ALS_beampos.jpg.
Note that ALSY beam is supposed to be at the same height as ALSX but shifted horizontally by 10mm or so in -X direction on the periscope mirror. According to Mike Smith's L1200282 Table 1 (which is the table we should use though there are other similar tables in that document) ALSY is shifted by 8.5mm in +Y direction relative to ALSX on the septum window (and the two beams are diverging after 3" mirror in HAM3).
REFL air and POP air:
REFL was already hitting the ISCT1 top peri mirror but was close to the +X edge (REFL_before.jpg). POP air beam was coming to the same mirror mount as was described back in May/25/2025 in alog 84558 (especially this picture in that alog) though I didn't know/remember. (Turns out that I was away for a week when that was done, my recollection only included my May/09/2025 alog 84334.)
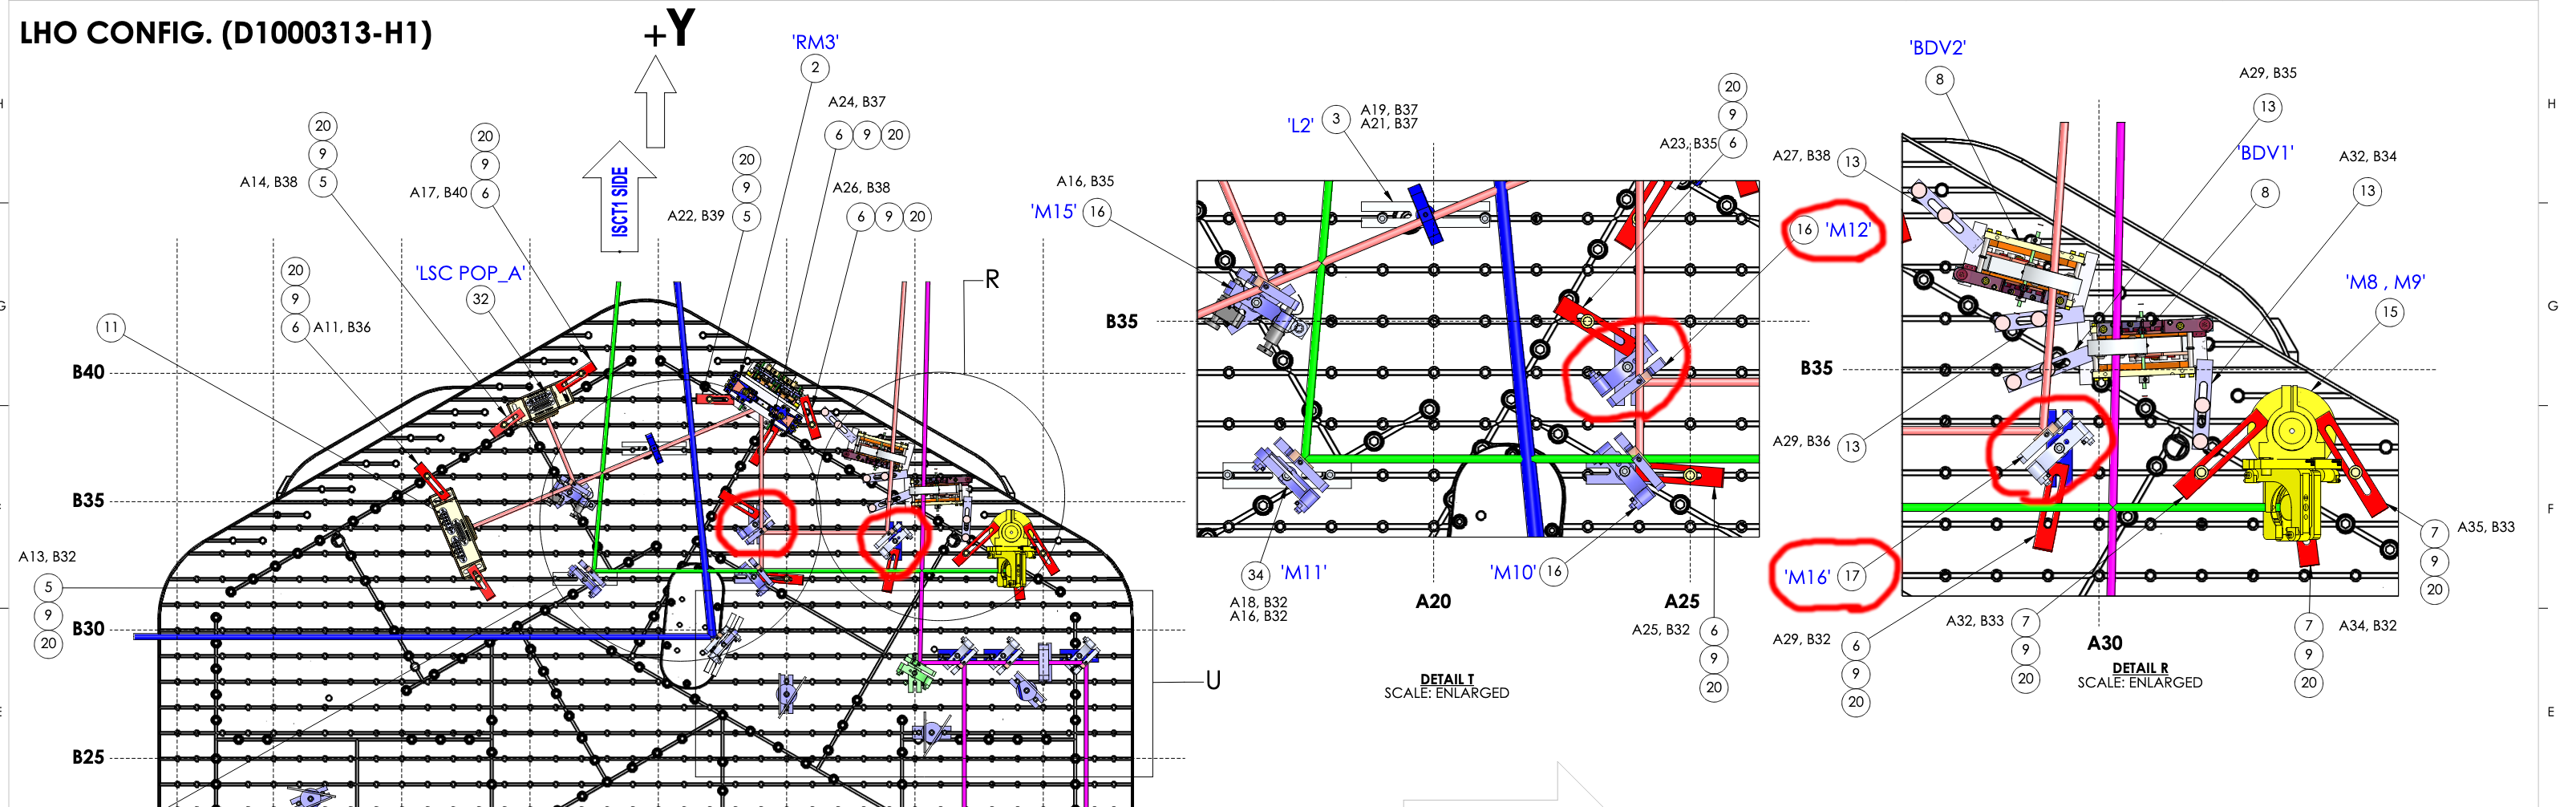
I didn't like that POP and REFL beam are both at the edge of the mirror and "fixed" it, i.e. I undid the work people did on May/25/2025 (sorry). I adjusted 90:10 air-vac splitter (M12 in layout.png) to make sure that the beam is not close to the edge of the last steering mirror for the POP air path (M16), and used M16 to steer the POP beam back to the top POP periscope mirror in ISCT1.
I found that the beam was too much in +X direction at the bottom and didn't hit the bottom periscope mirror even when I maxed out the YAW adjustment range of the top peri mirror. (My guess was that people found that back then and decided to shift the POP beam onto the REFL top peri mirror, but Sheila didn't think so even though neither she nor Camilla remembered exactly why.)
Anyway, since I still didn't like that the beams are both close to the edge of the mirror, I decided to keep the "new" configuration where REFL hits REFL periscope and POP hits POP periscope.
I shifted the REFL top periscope mirror by ~1" in +X direction so the REFL beam is not close to the edge of the mirror. Betsy took the picture of the REFL beam on the top periscope mirror.
The REFL beam hits the bottom periscope mirror. Further adjustment is necessary downstream.
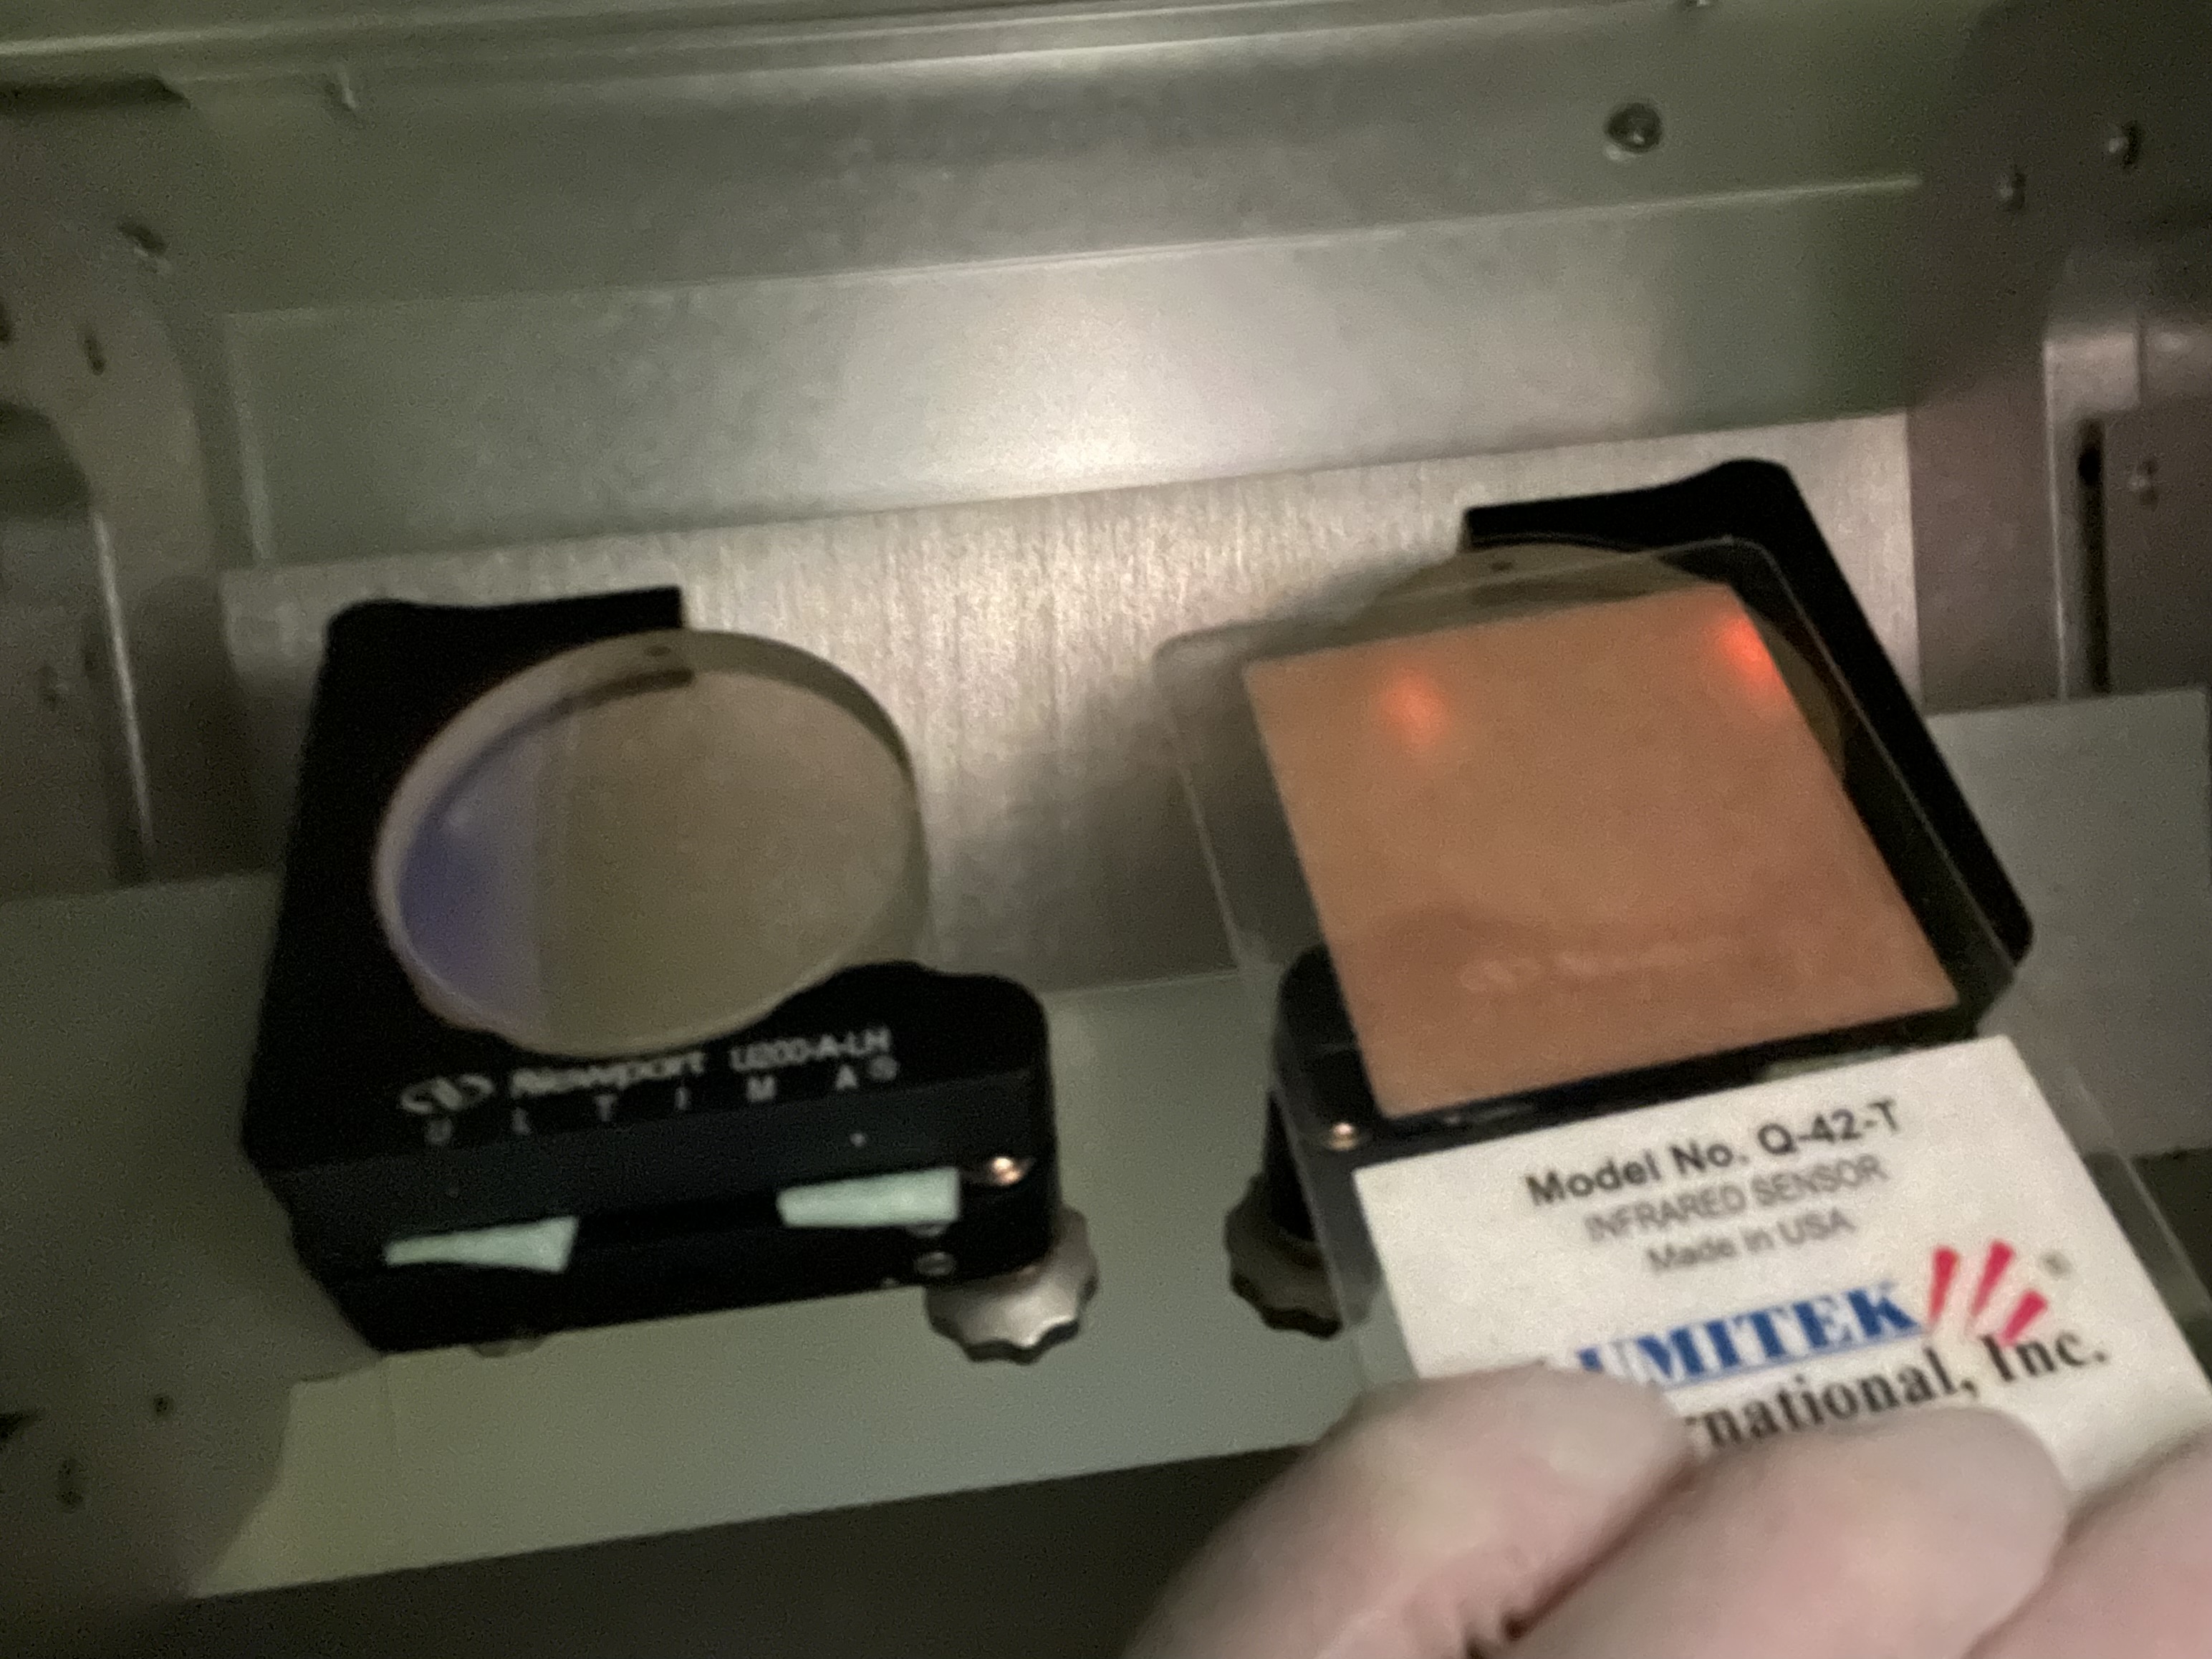
For POP, since the only thing lacking was the adjustment range of the top peri mirror, at first I wanted to swap the mirror mount (ultima with 2 actuators) with a 3-actuators variation to gain more adjustment range, but it turns out that the adjustment knob on the "third" actuator would interfere with the bracket on which the mirror mount is bolted. As a quick fix, I merely "pushed in" the fixed pivot pin to tilt the mirror in a disired direction, which worked. See top_POP_peri_mechanical_tweak.jpg.
I also steered down the beam by M16 a bit, shifted the top POP peri mirror in +X direction by ~1" like I did for the top REFL peri mirror, used M16 to steer the beam again, and ended up with an OK position on the top peri mirror. See POP_top_peri_beamPos.jpg.
The beam hit the bottom peri mirror, it's not centered but is OK. Further downstream alignment should be done in the future.
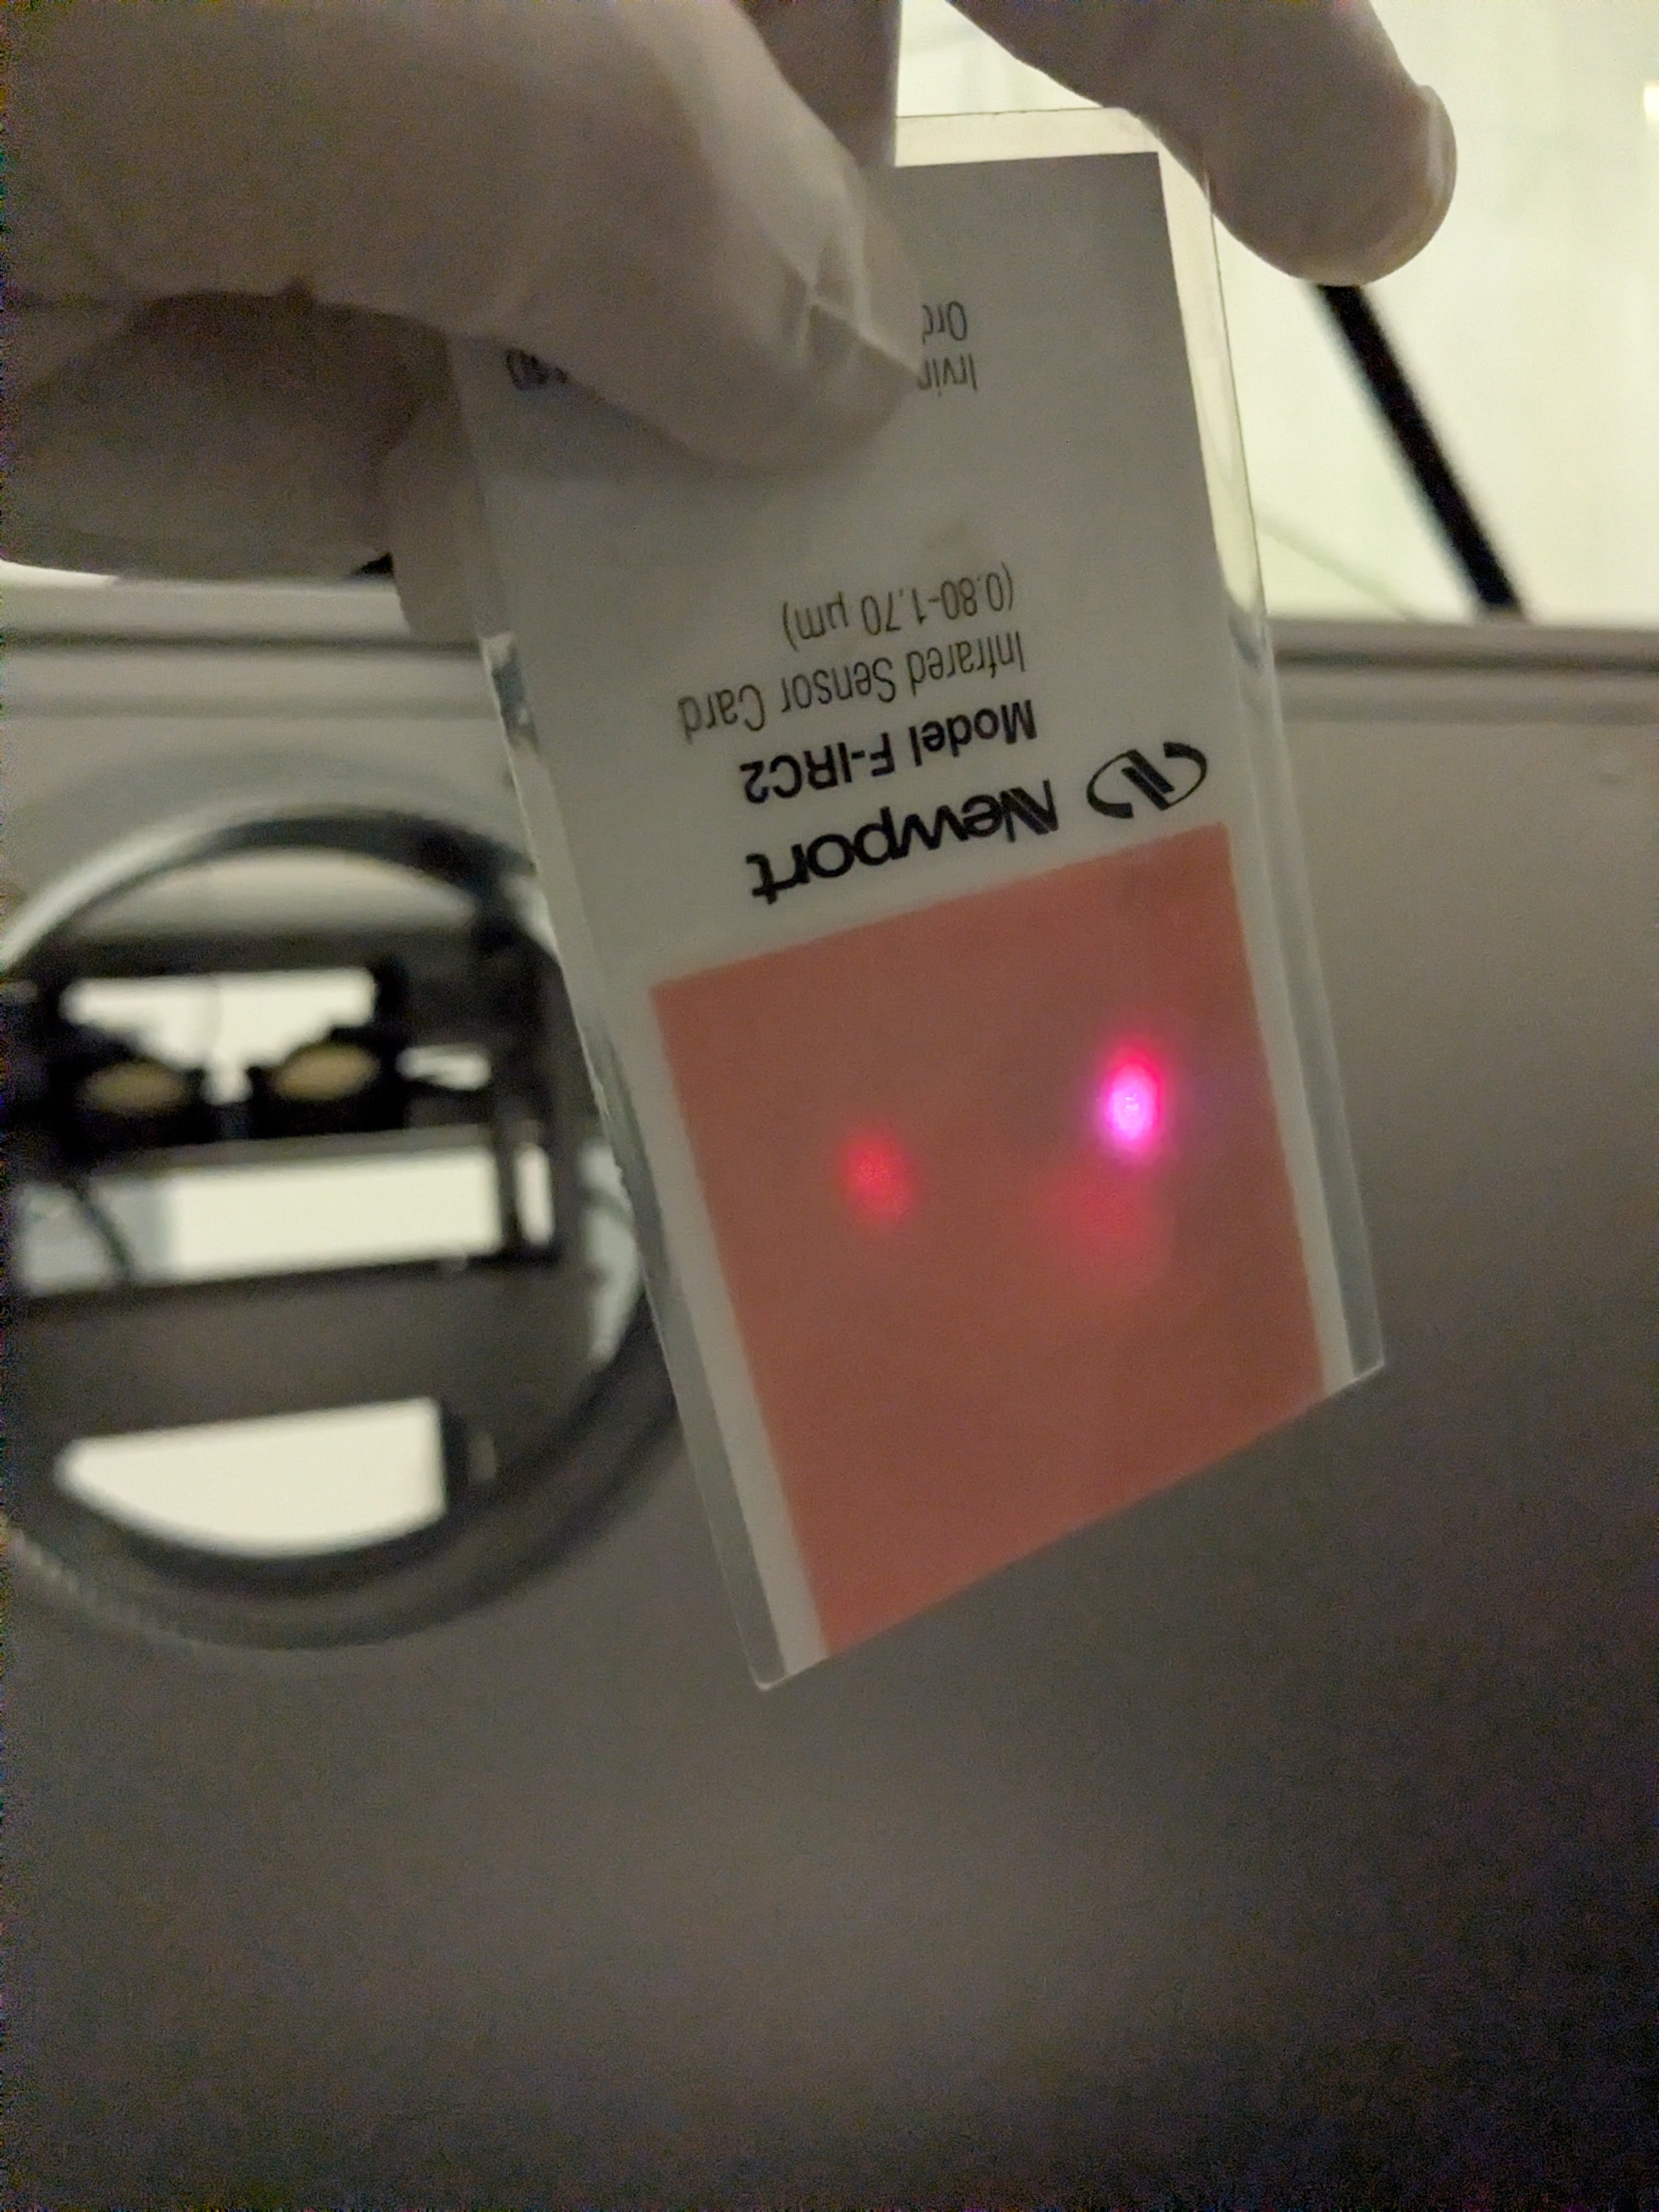
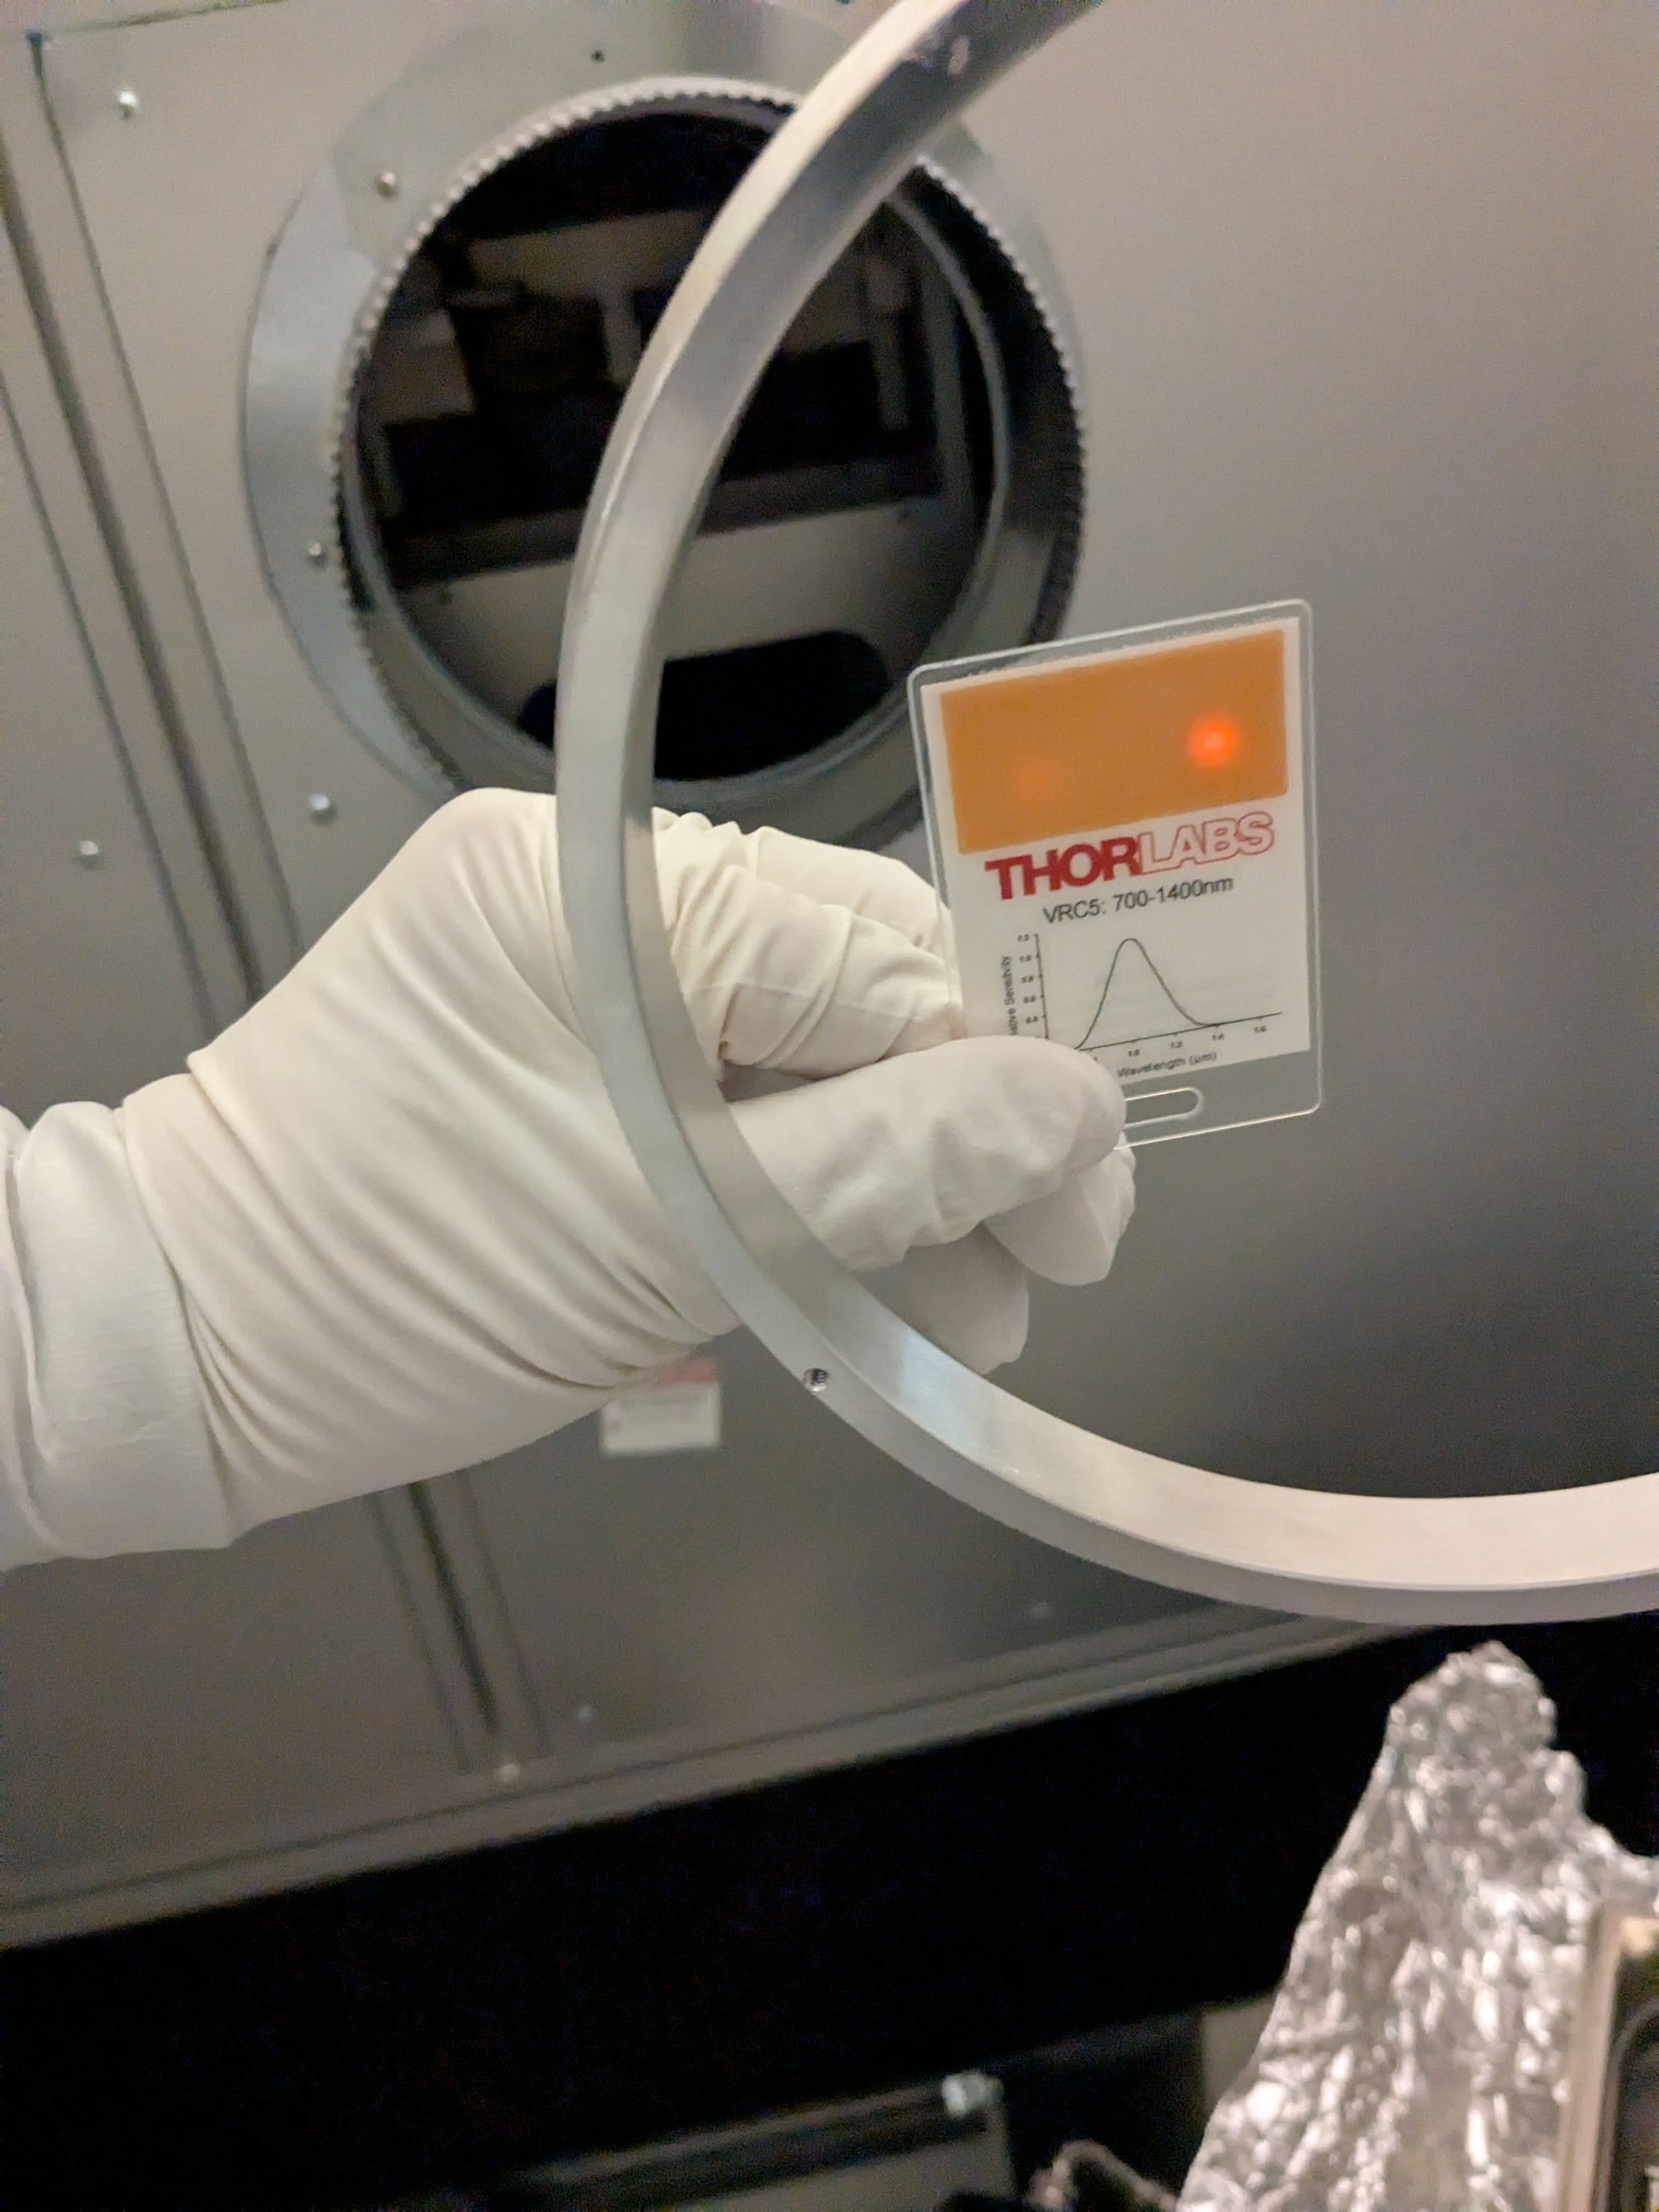
Finally, POP_REFL_at_VP_position.jpg shows the REFL and POP air beam when the card was held very roughly at the location of the viewport. This more or less agrees with one of the pictures (https://alog.ligo-wa.caltech.edu/aLOG/uploads/84344_20250509211310_PXL_20250509_231320536.jpg) in my May/09/2025 alog and I'm positive that the POP won't be clipped by the VP.
REFL_AIR and POP_AIR Beam dumps:
REFL air goes to beam dump when the REFL beam diverter closes (forgot to take picture but not surprising as REFL air path wasn't touched).
Unfortunately I forgot to check if the POP air beam goes to the beam dump when the POP beam diverter closes. This needs to be checked the first thing tomorrow.


HAM1 was under vacuum May 23rd, 84334, which is why we did not adjust the in vac alignment at that time.
Friday update: We're done with HAM1. (Randy, Sheila, Keita)
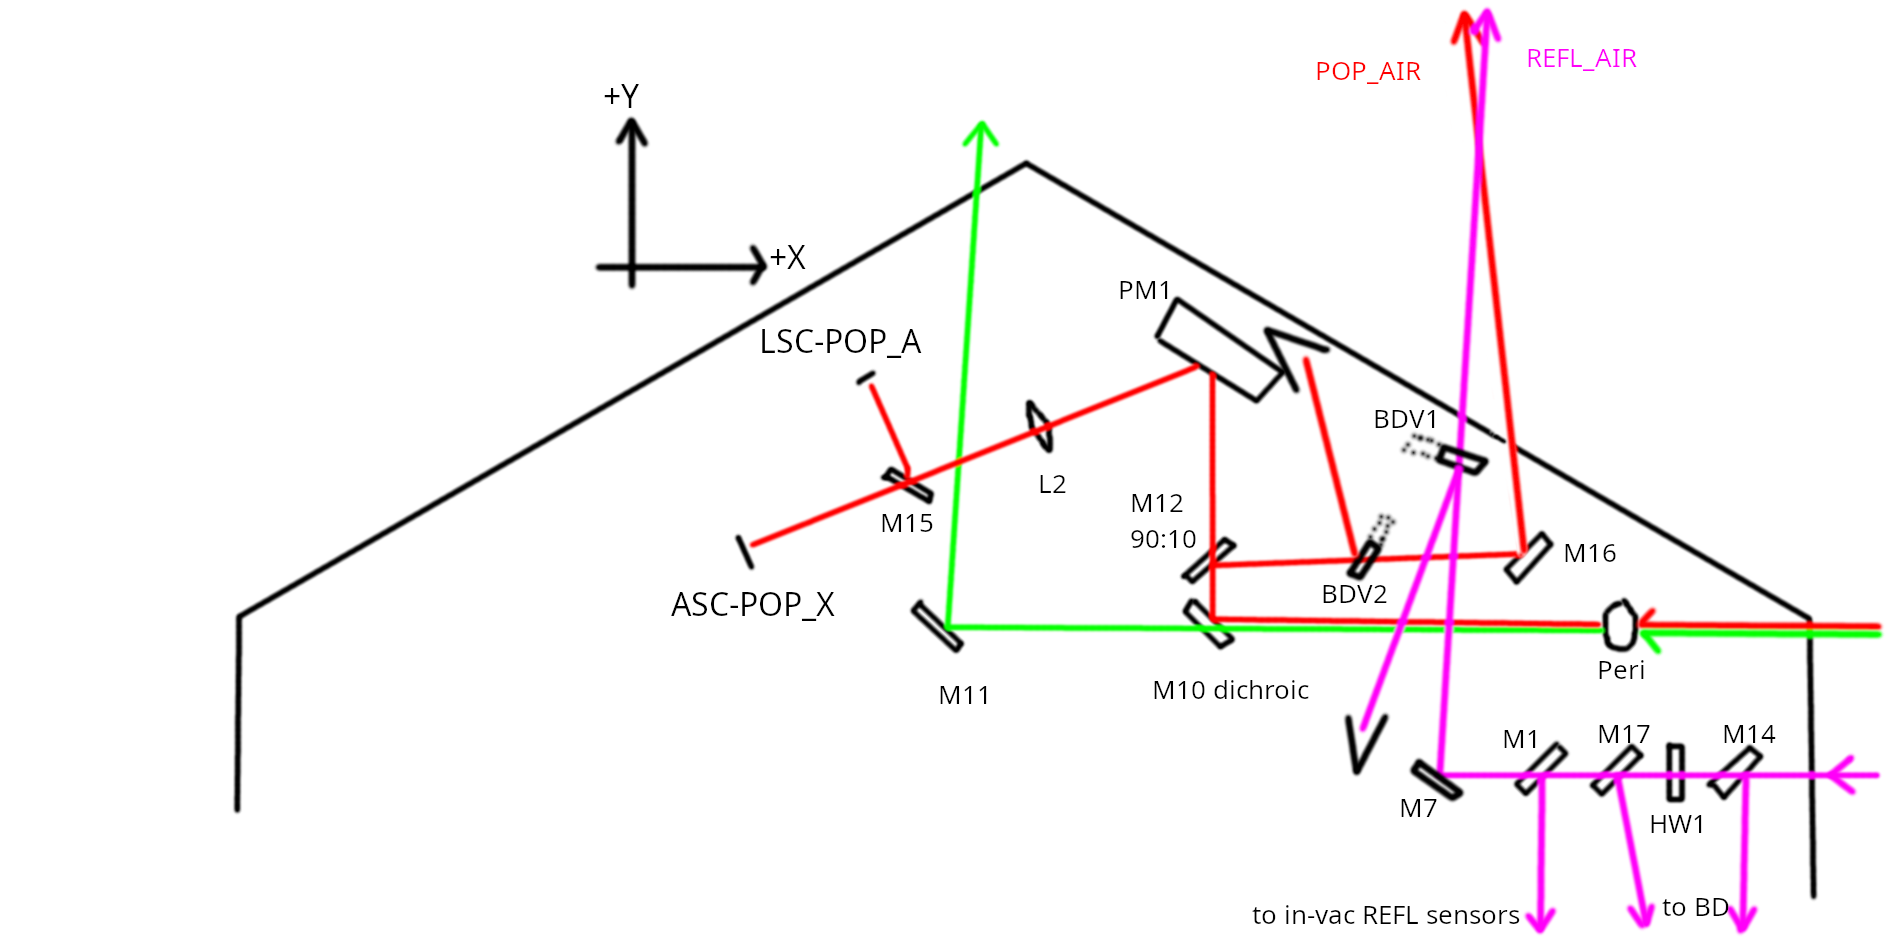
For component names see layout_truer.png which should be better than HAM1 layout on DCC as of now (D1000313-v20) as POP AIR and REFL AIR paths are both incorrect on DCC.
Anyway, I looked at the REFL_AIR and POP_AIR beam when the beam diverters were closed and both landed on the beam dump.
REFL_AIR:
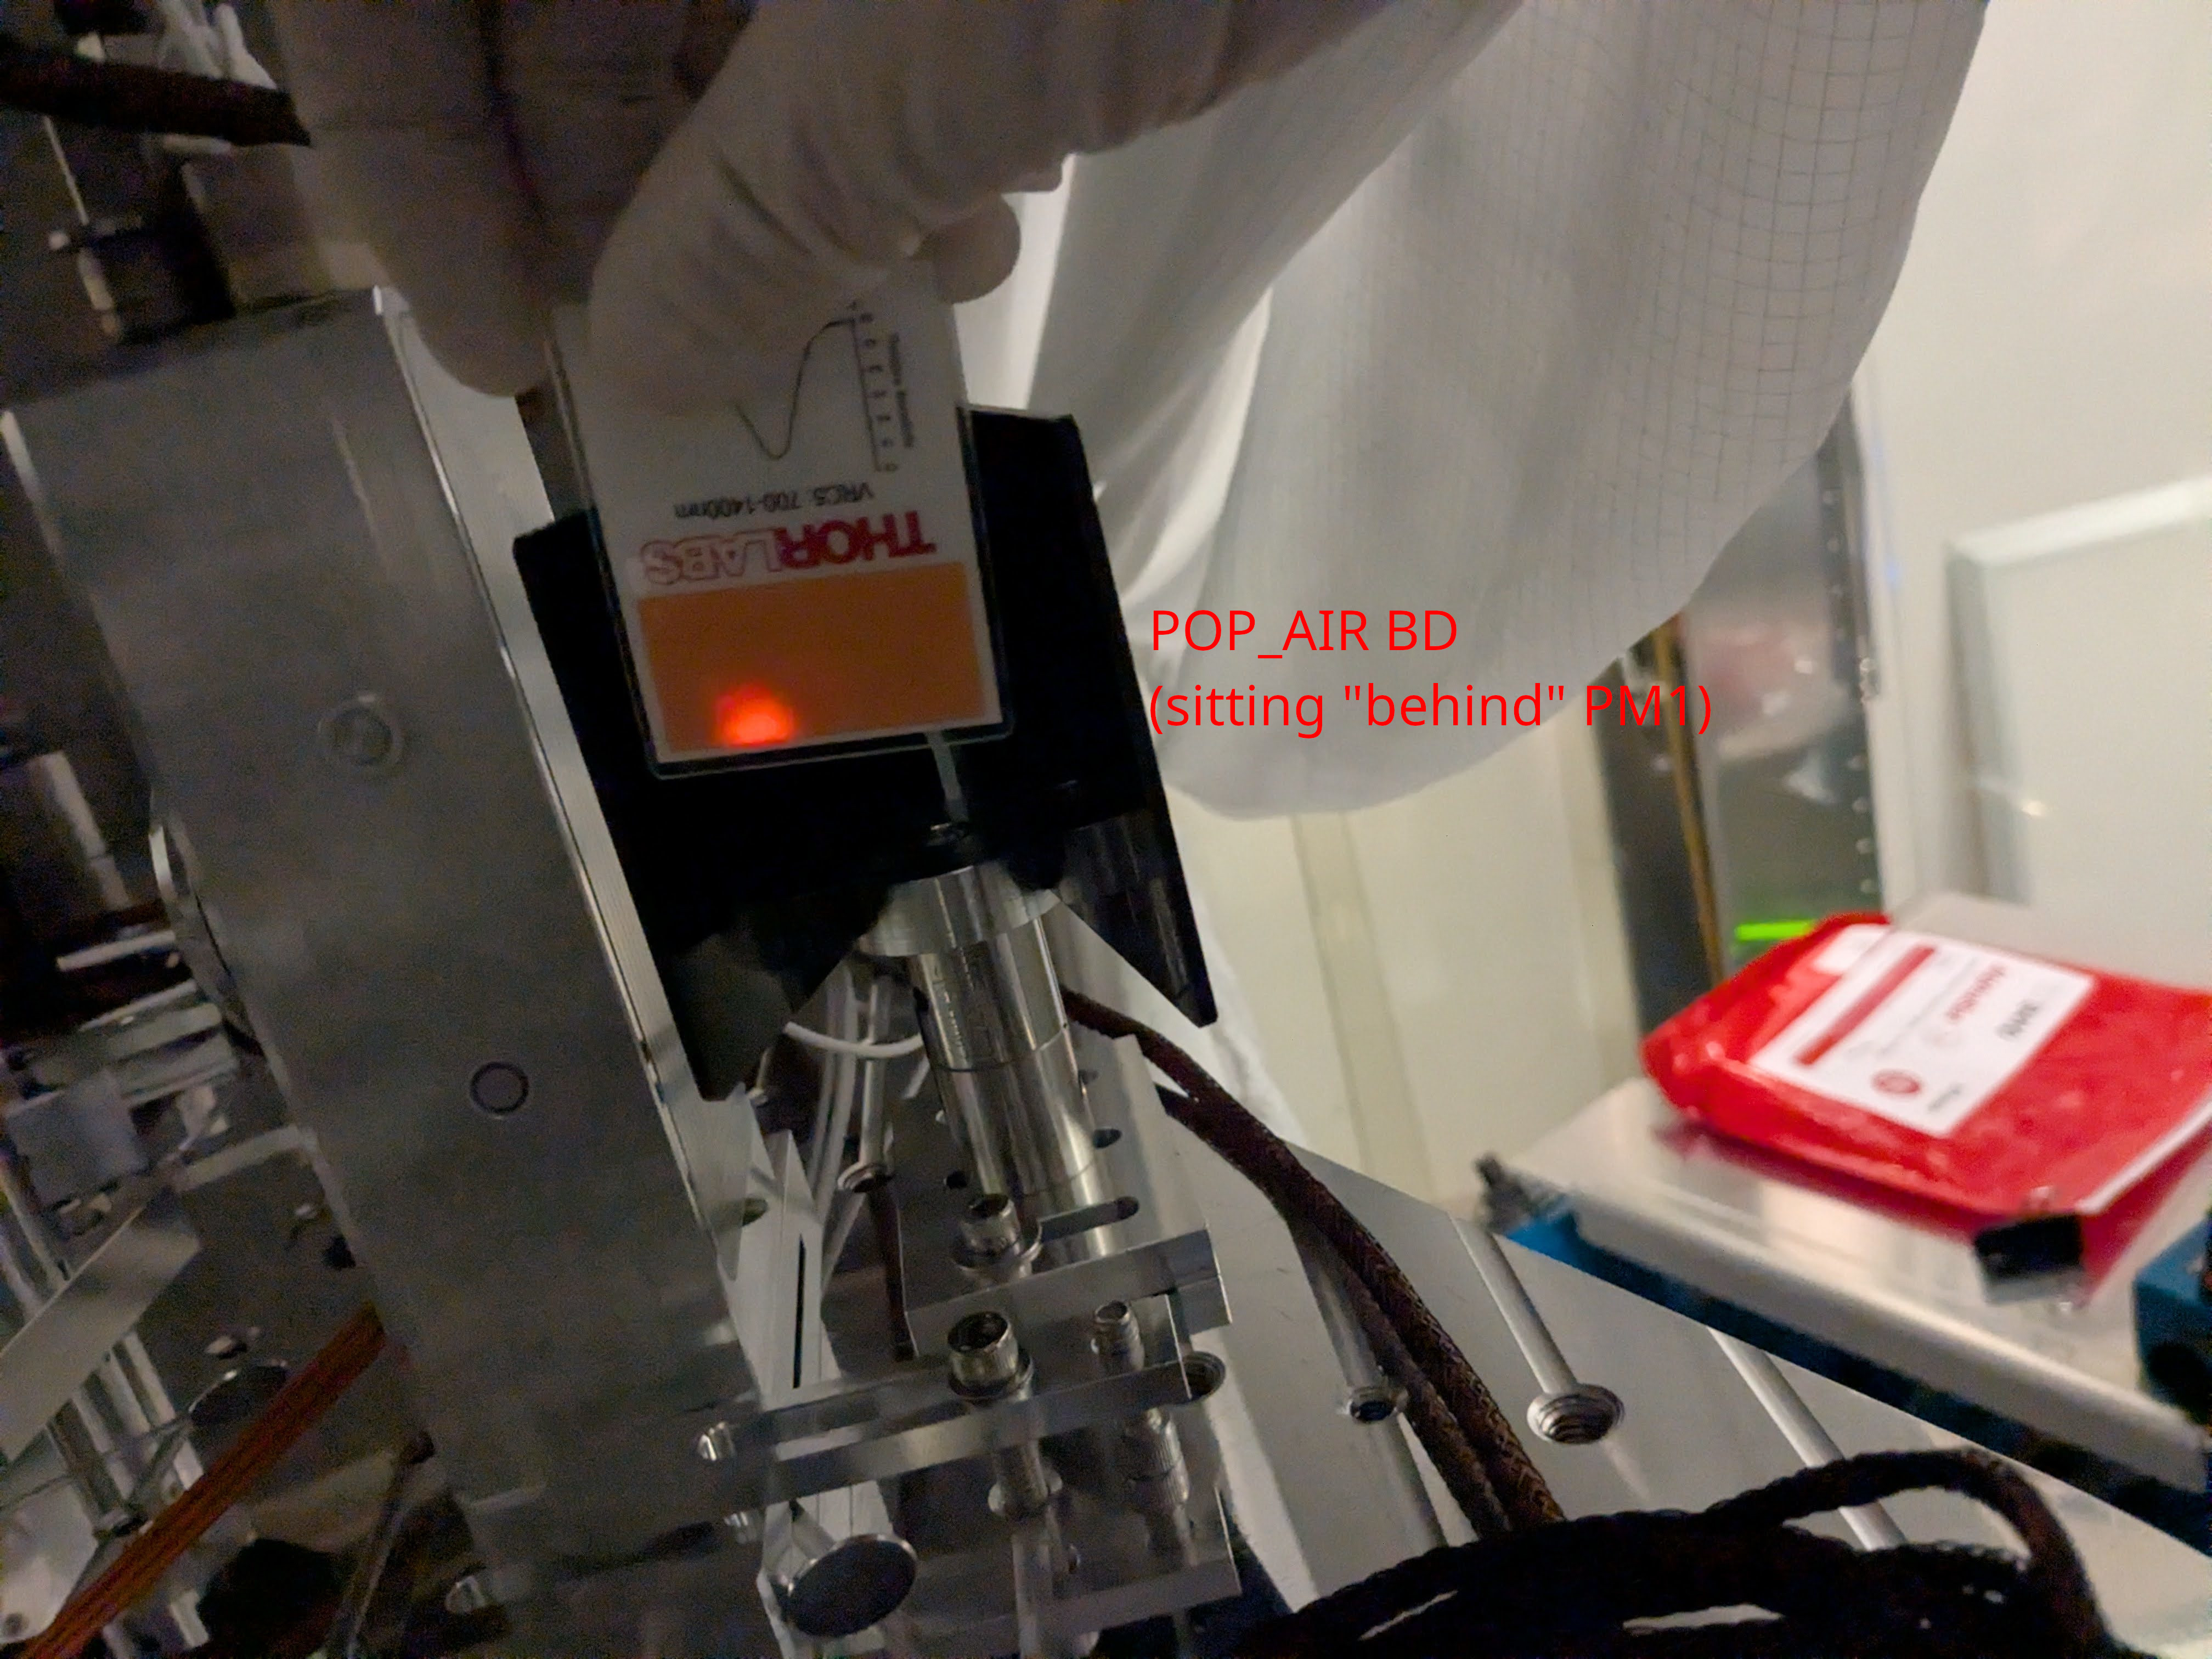
POP_AIR:
However, when Sheila opened the POP beam diverter, the IR beam was reasonably centered in PIT on the last steering mirror M16. It seems that the beam is shot up probably from the dichroic, and was made level by M16 in the POP_AIR path and by PM1 and L2 in the POP path.
Tables were moved out:
We closed the PSL light pipe, closed the door cover (Sheila removed the lower cover for the +Y door as there were small rips, so that door is now covered by a single fabric), disconnected cables from IOT1, closed the bellows opening of that cable, and removed the laser barriers.
Randy temporarily craned one of the doors so he can drive fork lift to move ISCT1 by HAM2-HAM3 tube, and put the craned door back on the same spot on the floor as before.
Randy and I marked the feet of the IOT1 on the floor and rolled that table to its temporary parking position.


