corey.gray@LIGO.ORG - posted 16:30, Wednesday 01 April 2026 - last comment - 17:03, Wednesday 01 April 2026(89726)
Wed DAY Ops Summary
TITLE: 04/01 Day Shift: 1430-2330 UTC (0730-1630 PST), all times posted in UTC
STATE of H1: Planned Engineering
INCOMING OPERATOR: None
SHIFT SUMMARY:
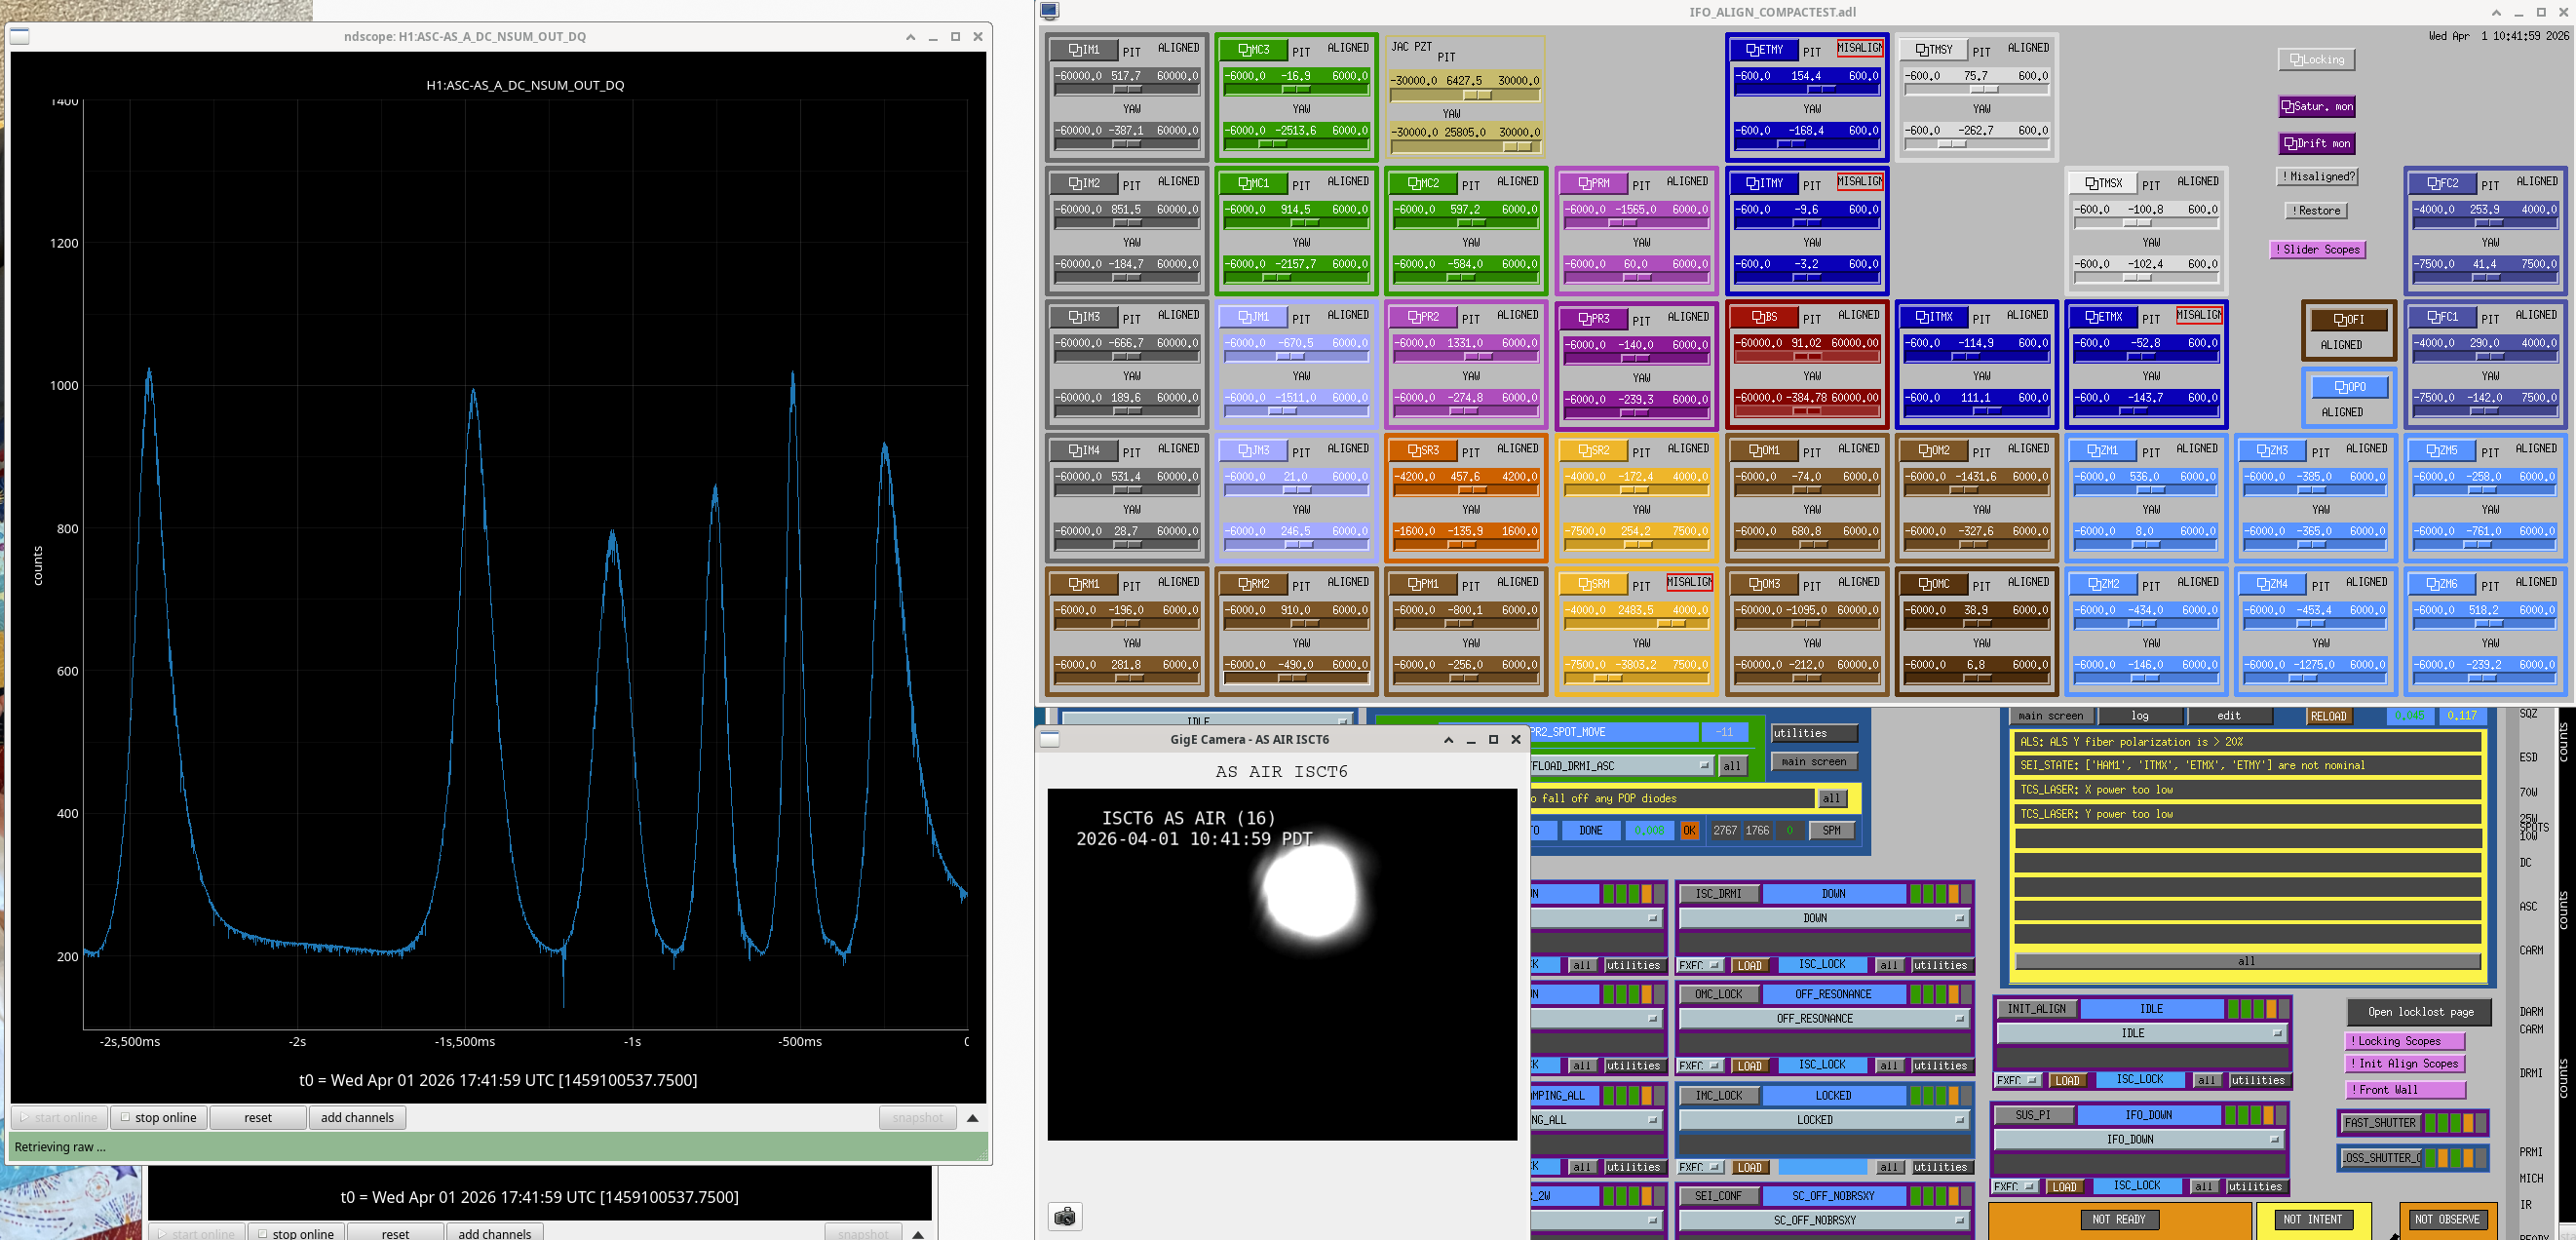
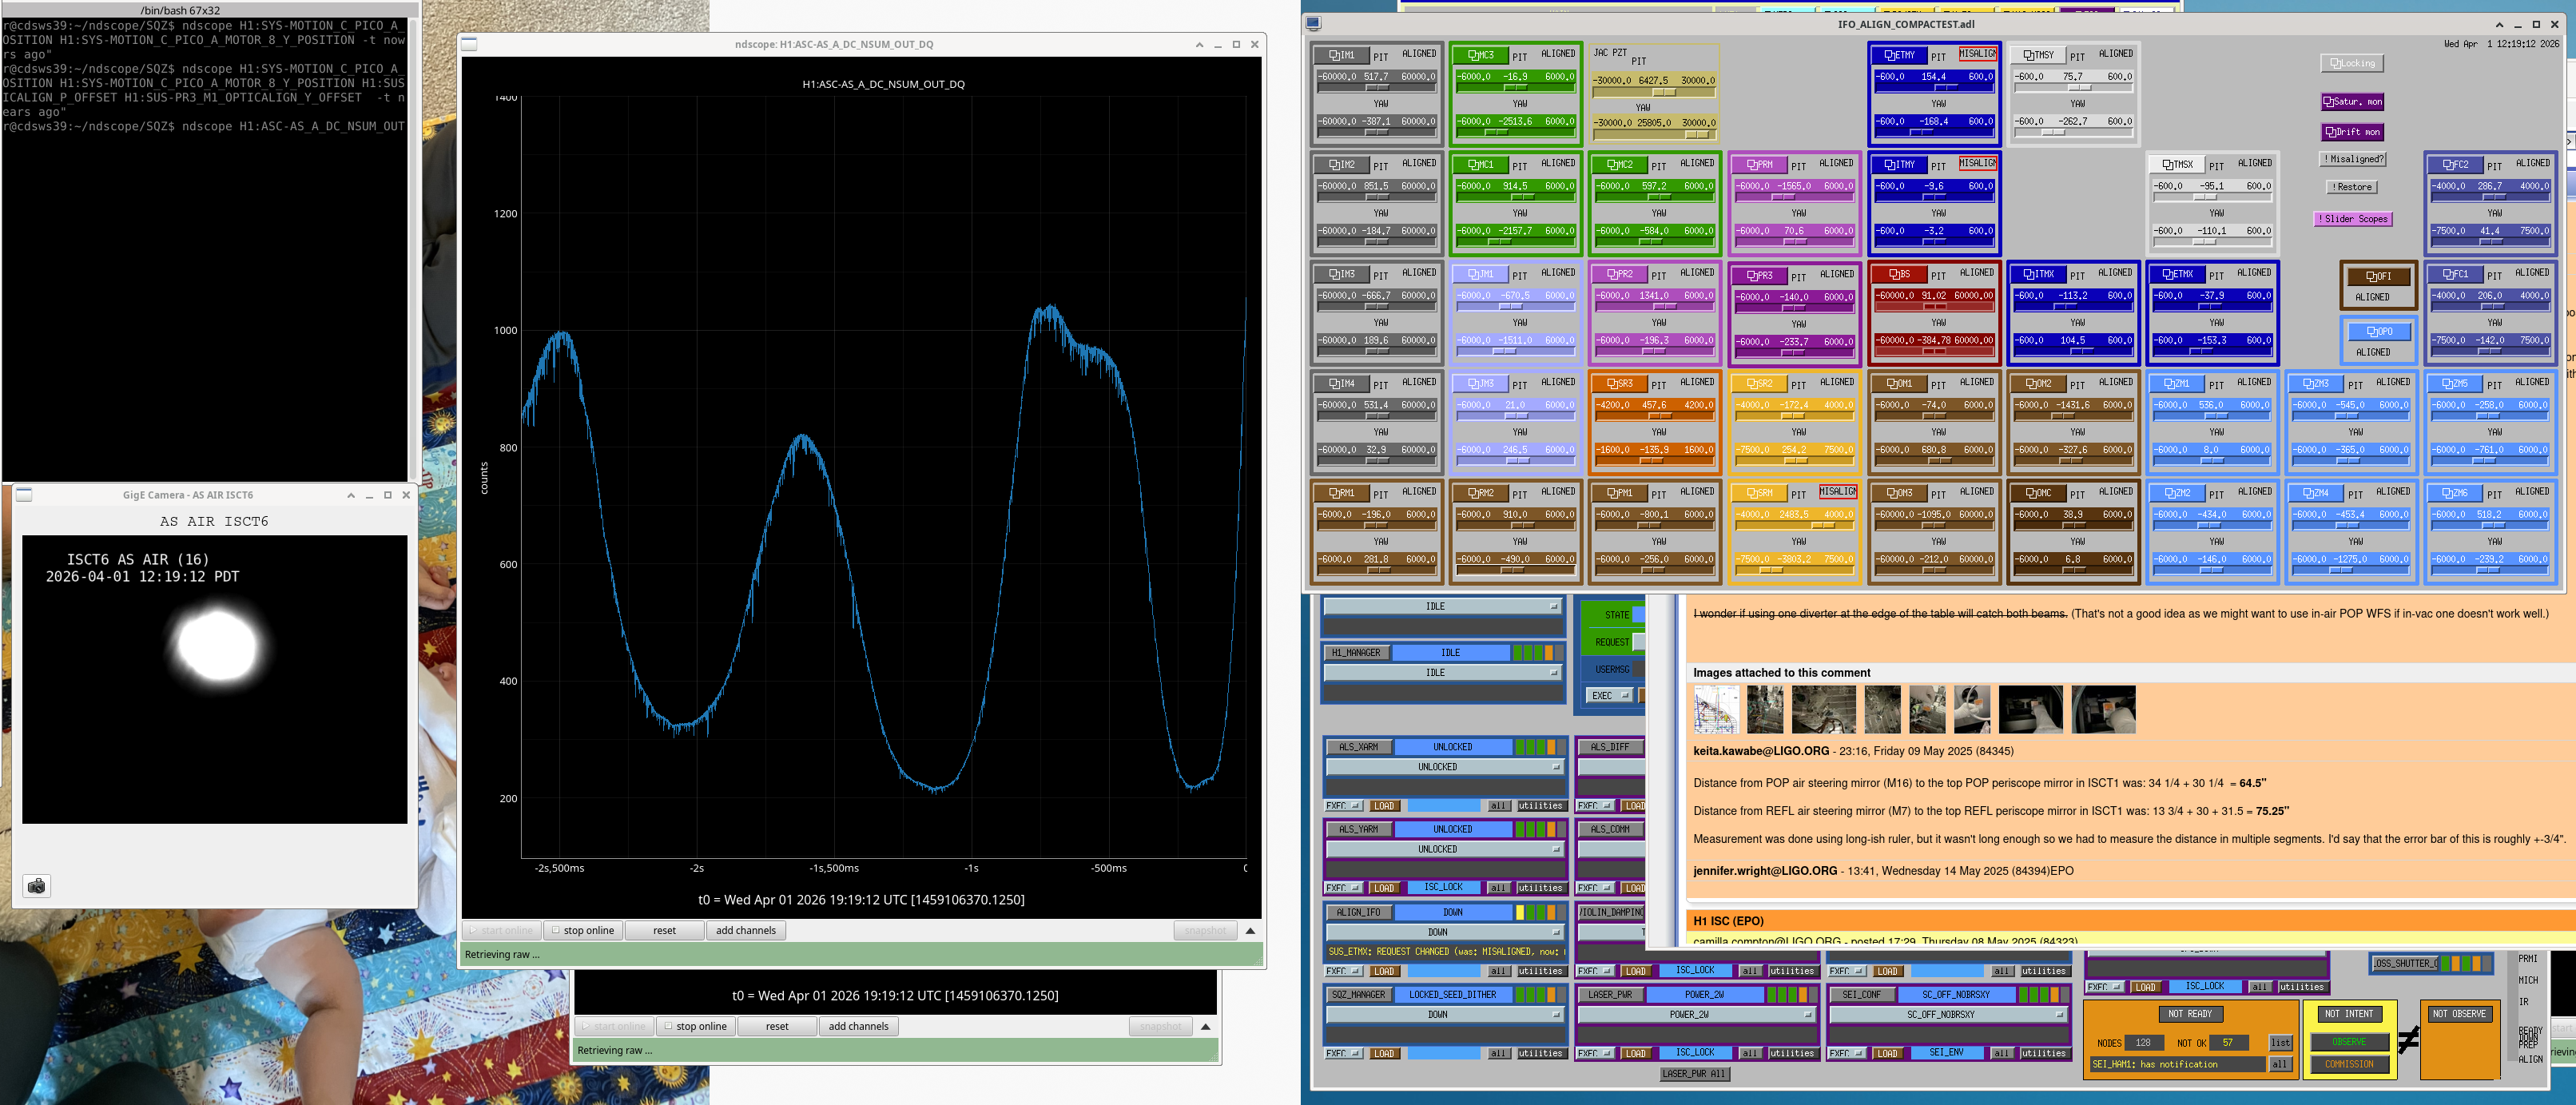
HAM1 & SQZ alignment work continued with focus on HAM1 GV7 was opened for a check down the X-arm for HAM1 work. Team is still out at HAM1 and GV7 will be open overnight. Would like to have ISCT1 rolled into place in the morning.
LOG:
- 1406- lvea technical cleaning (nellie.kim)
- 1526 nellie out
- 1600-1634 MY technical cleaning (nellie)
- 1420-1520 craning handrails up to the eMod (randy)
- 1550-1740 clean-up in lvea
- 1511-1645 HEPA Fan swap at h1psl (tyler,eric)
- 1645-1655 Move to optics lab for termites? (tyler)
- 1529-1657 SPI in optics lab (sina)
- 1626-1657 SPI in optics lab...but only for about 30min before a meeting (jeffK)
- restart after meeting - 1915 More SPI before lunch (sina, jeff)
- 1614-1638 lvea walkabout around h1psl (richard)
- 1702-1708 turning off mega cleanroom fans (richard)
- 1703-1717 Opening lightpipe & HAM1 door cloth cover for alignment work (sheila)
- 1706-1714 checking h1psl hvac (post new fan install) [jason]
- 1725-1731 Turning down HAM1 purge (keita)
- 1728 cheta lab (sophie,georgia)
- 1745-1905 susR2 rack near HAM3 + upstairs of CER (fil)
- 2000-2320 Continue rack & CER work (fil)
- 1757 OPEN GV7 (gerardo.travis)
- 1808 jordan joining
- 1825 GV7 OPENED
- 1940-2038 Cleanroom lowering a few inches in West Bay (randy,eric,tyler,mitchell)
- 1953-2148 BHSS laser HAZARD work (elenna,oli)
- 2049 Oli out
- 1959 Checking green beam at HAM1 (keita)
- 2013 jenne & sheila joining
- 2249 Jenne out
- 2259 sheila out---
- 2007-2148 CHeTA laser set-up (sophie, georgia)
- 2022-2142 Camilla joining
- 2013 MX weather station work (jonathan)
- 2018 checking on cleanroom team (richard)
- 2053 SPI assy & alignment (jeff, sina)
- 2054-2113 RGA search (gerardo)
- 2104-2110 Running cleanroom roof sock to lvea (randy)
- 2118-2122 fiber feedthru check at HAM7 (travis)
- 2120-2143 EX cleanroom accessory search (randy)
- 2130 PM1 @HAM1 had software WD tripped noticed, and he is bypassing (since there is lots of shaking out there) [dave]
- 2143-2200 Going to PCal Lab for dustmonitors (ryanC)
- 2226 now going to swap out a cable--heading to CER & then back to PCal lab (ryanC)
- 2155 Betsy & Camilla joining HAM1 team on the floor
- 2216-2316 BHSS alighnment (elenna,georgia)
- 2236 Artemis launch!
- 2256 M7.8 EQ in the south Pacific with S&P waves hitting at 2300 (R-waves due around 2350-0000)
- 2302 Checking on HAM1 team (richard)
- 2307 CHeTA laser HAZARD work (sophie)


Zone4s' temperature has dropped rapidly over the past half hour. Minute trends look like it may be rebounding but I can't tell yet.