J. Oberling, O. Patane
Today we started to re-center the SR3 optical lever after SR3 alignment was reverted to its pre-April alignment. That's not quite how it went down, however...
We started by hooking up the motor driver and moving the QPD around (via the crossed translation stages it is attached to), and could not see any improvement to the OpLev signal. While moving the horizontal translation stage it suddenly stopped and started making a loud grinding noise, like it had hit its, or a, limit. Not liking the sound of that, we launched on figuring out fall protection to climb on top of HAM4 to investigate. While the fall protection was getting figured out we took a look at the laser and found it dead. No light, no life, all dead. So we grabbed a spare laser from the Optics Lab and installed it (did not turn it on yet).
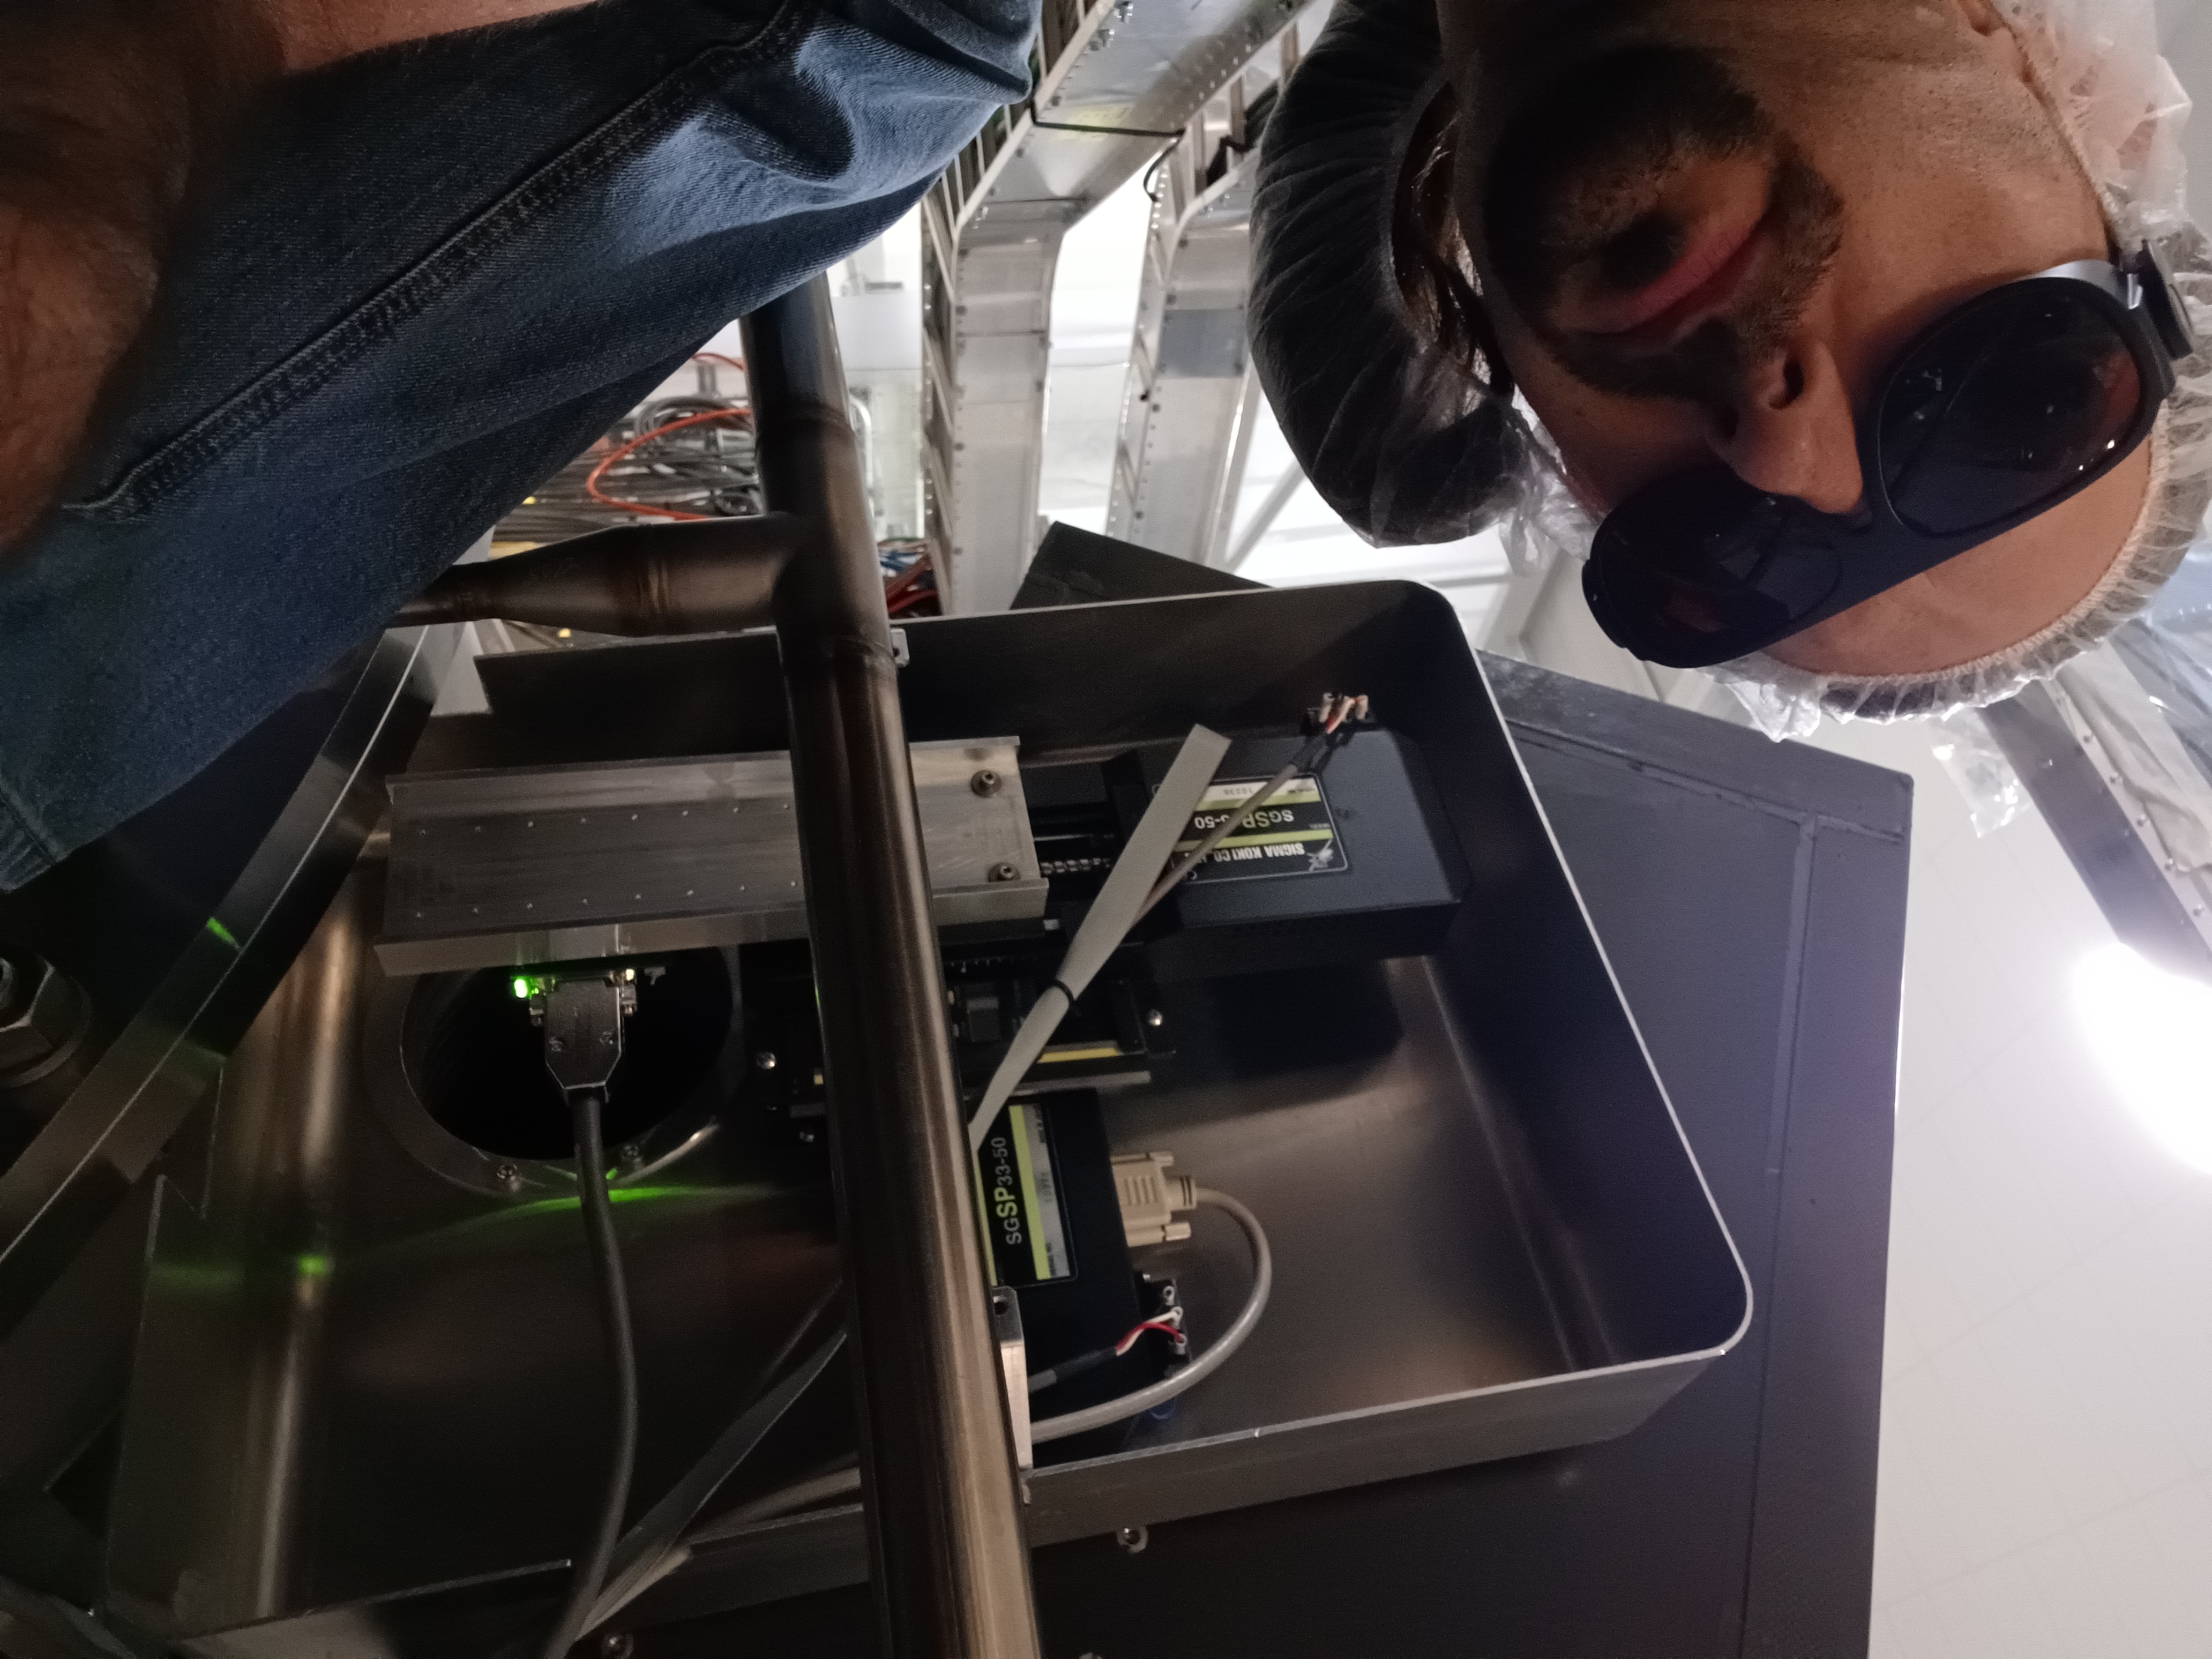
Once the fall protection was figured out I climbed on top of HAM4 and opened the OpLev receiver. I couldn't visually see anything wrong with the stage. It was near the center of its travel range, and nothing else looked like it was hung up. I removed the QPD plate and the vertically mounted translation stage to get a better view of the stuck stage, and could still see nothing wrong. Oli tried moving the stage with the driver and it was still making the loud noise, and the stage was not moving. So it was well and truly stuck. We grabbed one of the two spare translation stages from the EE shop (where Fernando was testing the remote OpLev recentering setup), tested it to make sure it worked (it did!), and installed it in the SR3 OpLev receiver. The whole receiver was reassembled and the laser was turned on. Oli slowly turned up the laser power while I watched for the beam, and once it was bright enough Oli then moved the translation stages to roughly center it on the QPD.
Something interesting, as Oli was turning up the laser power it would occasionally flash bright and then return to the brightness it was at before the flash. They got it bright enough to see a SUM count of ~3k, and then re-centered the OpLev. At this point I closed up the receiver and came down from the chamber. I turned the laser power up to return the SUM counts to the ~20k it was at before the SR3 alignment shift and saw the SUM counts jump just like the beam would flash. This happened early in the power adjustment (for example: started at ~3k SUM, adjusted up and saw a flash to ~15k, then back down to ~6k) but leveled off once the power was higher (I saw no jumps once the SUM counts were above 15k or so). Maybe some oddness with a low injection current for the laser diode? Not sure. The OpLev is currently reading ~20k SUM counts and looks OK, but we'll keep an eye out to see if it remains stable starts behaving oddly.
The SR3 optical lever is now fixed and working again.
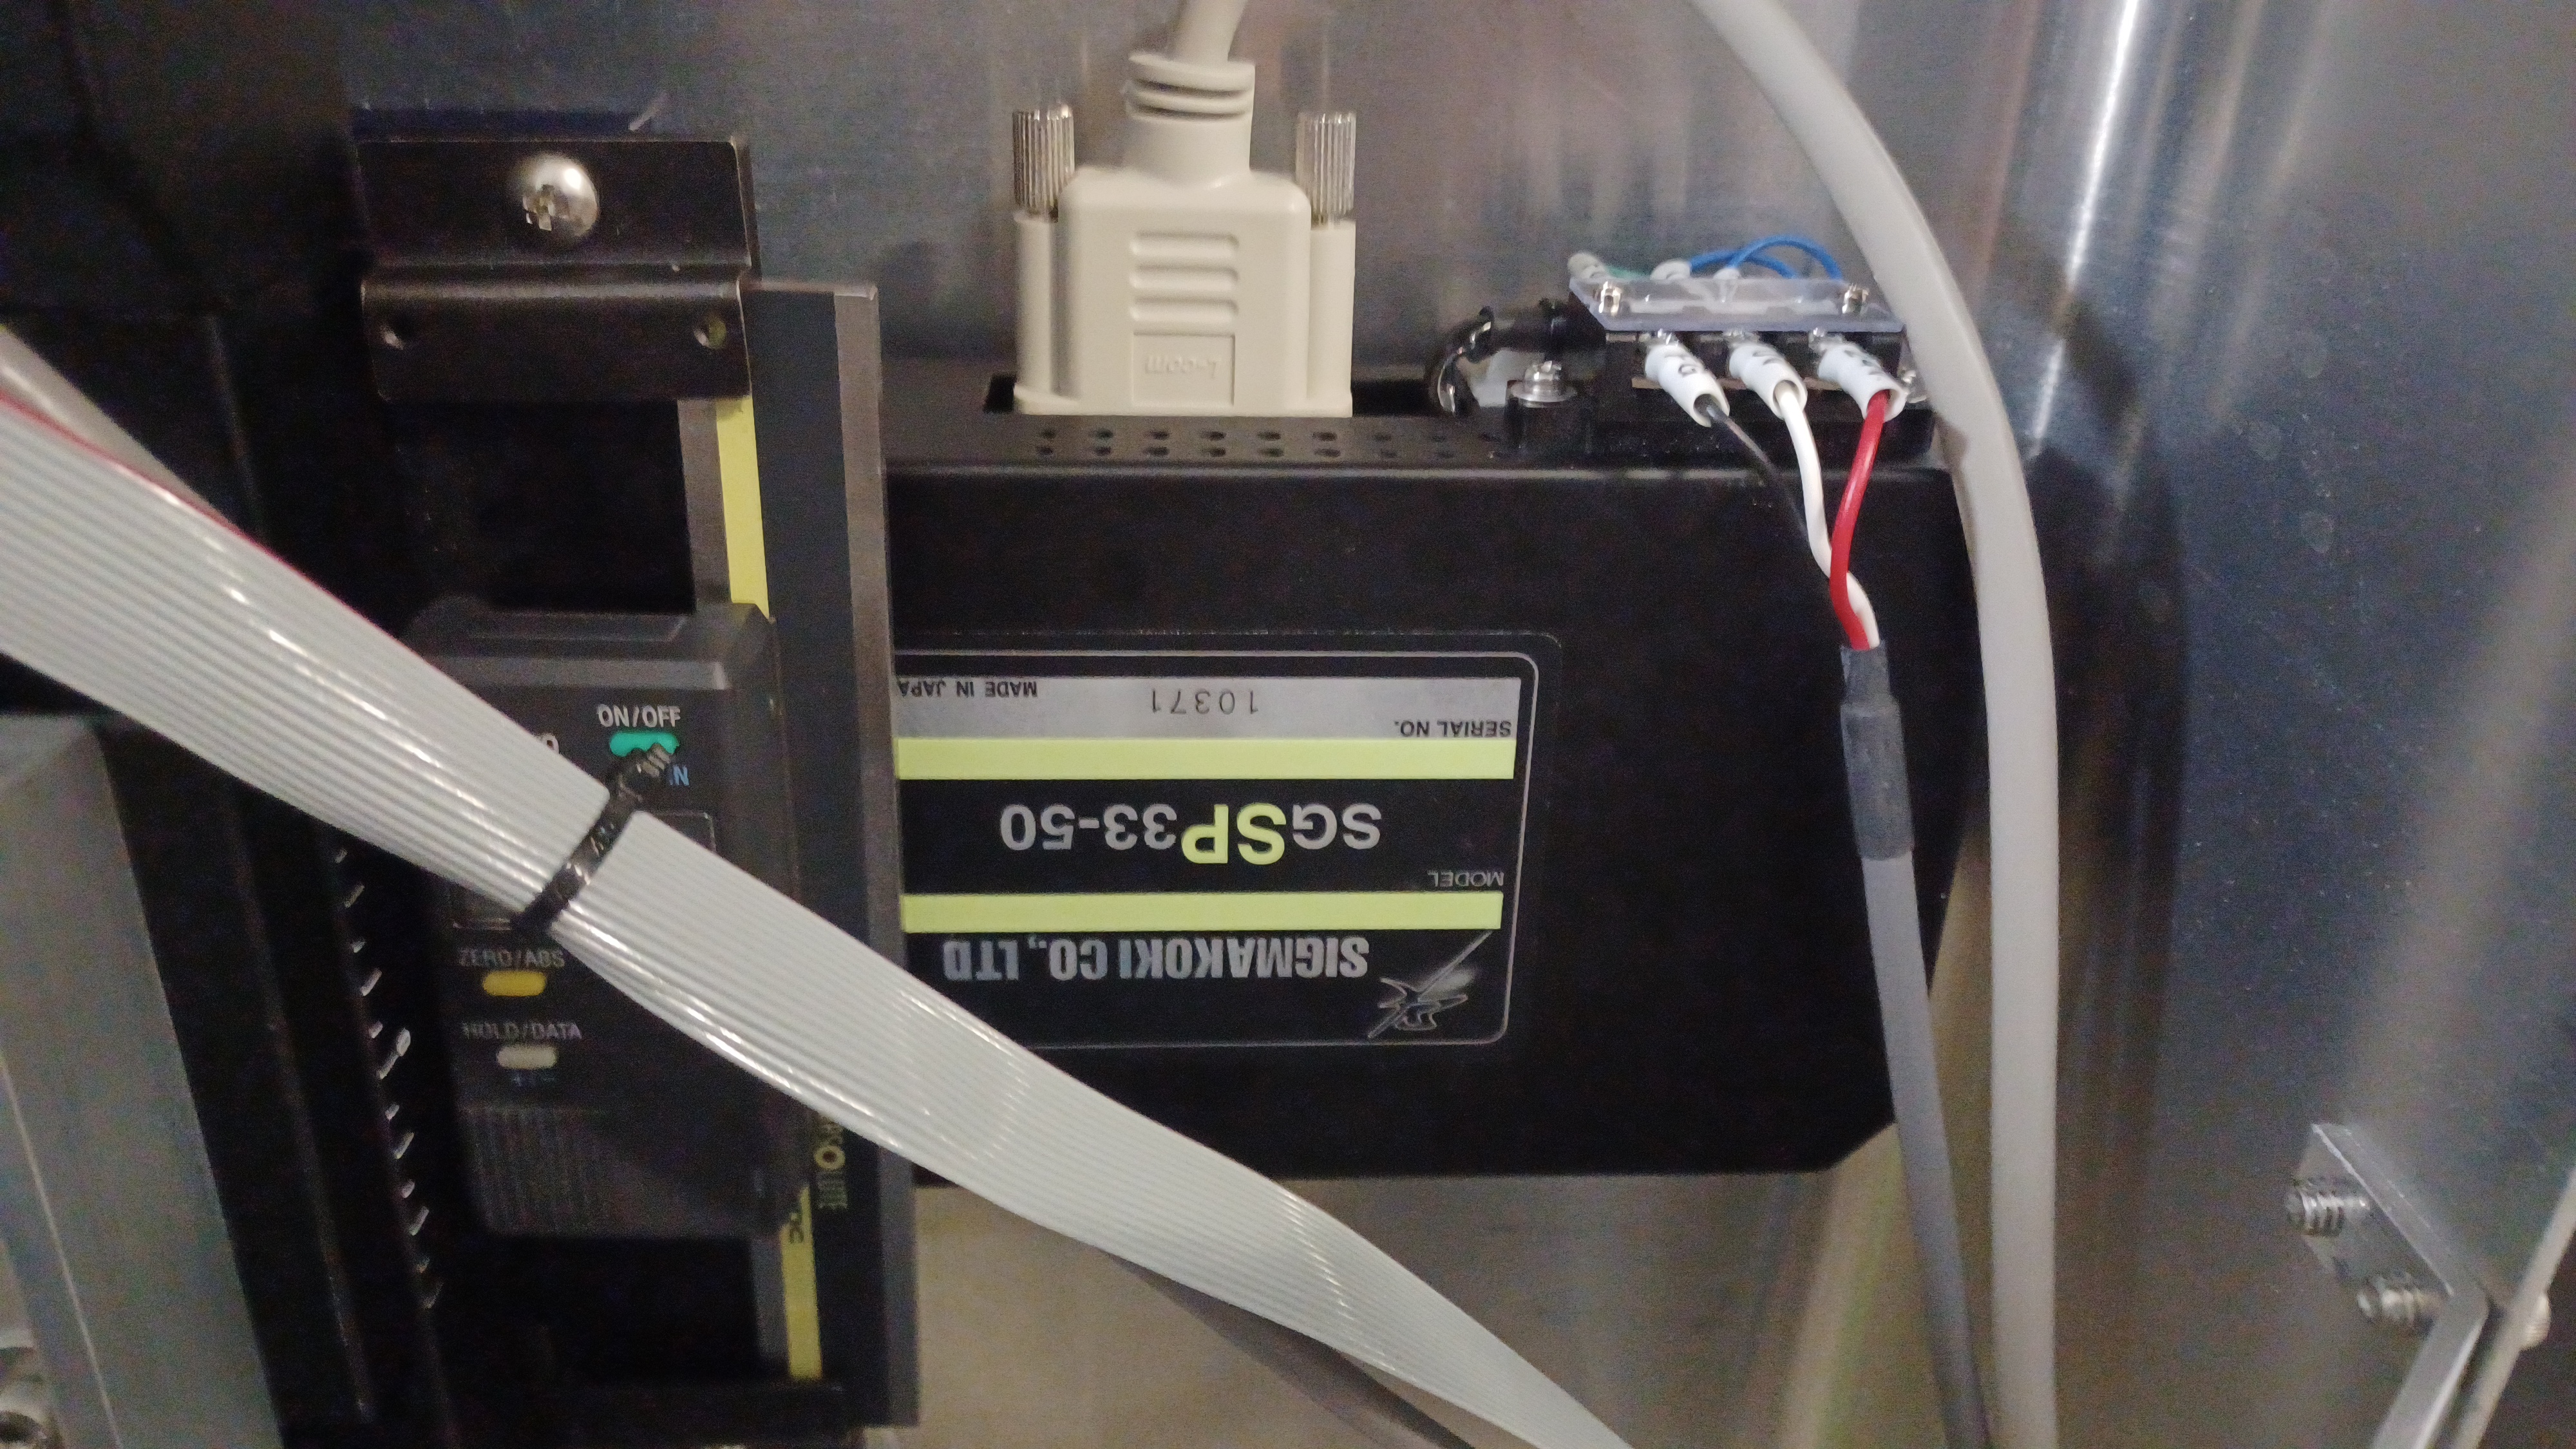
New laser SN is 197-3, old laser SN is 104-1. SN of the new translation stage is 10371
Forgot to add, once the translation stage became stuck the driver was still recording movement as the counts would change when we tried to move the stage but the stage was clearly not moving. So the motor encoder for the stage was working while the stage itself was stuck.

