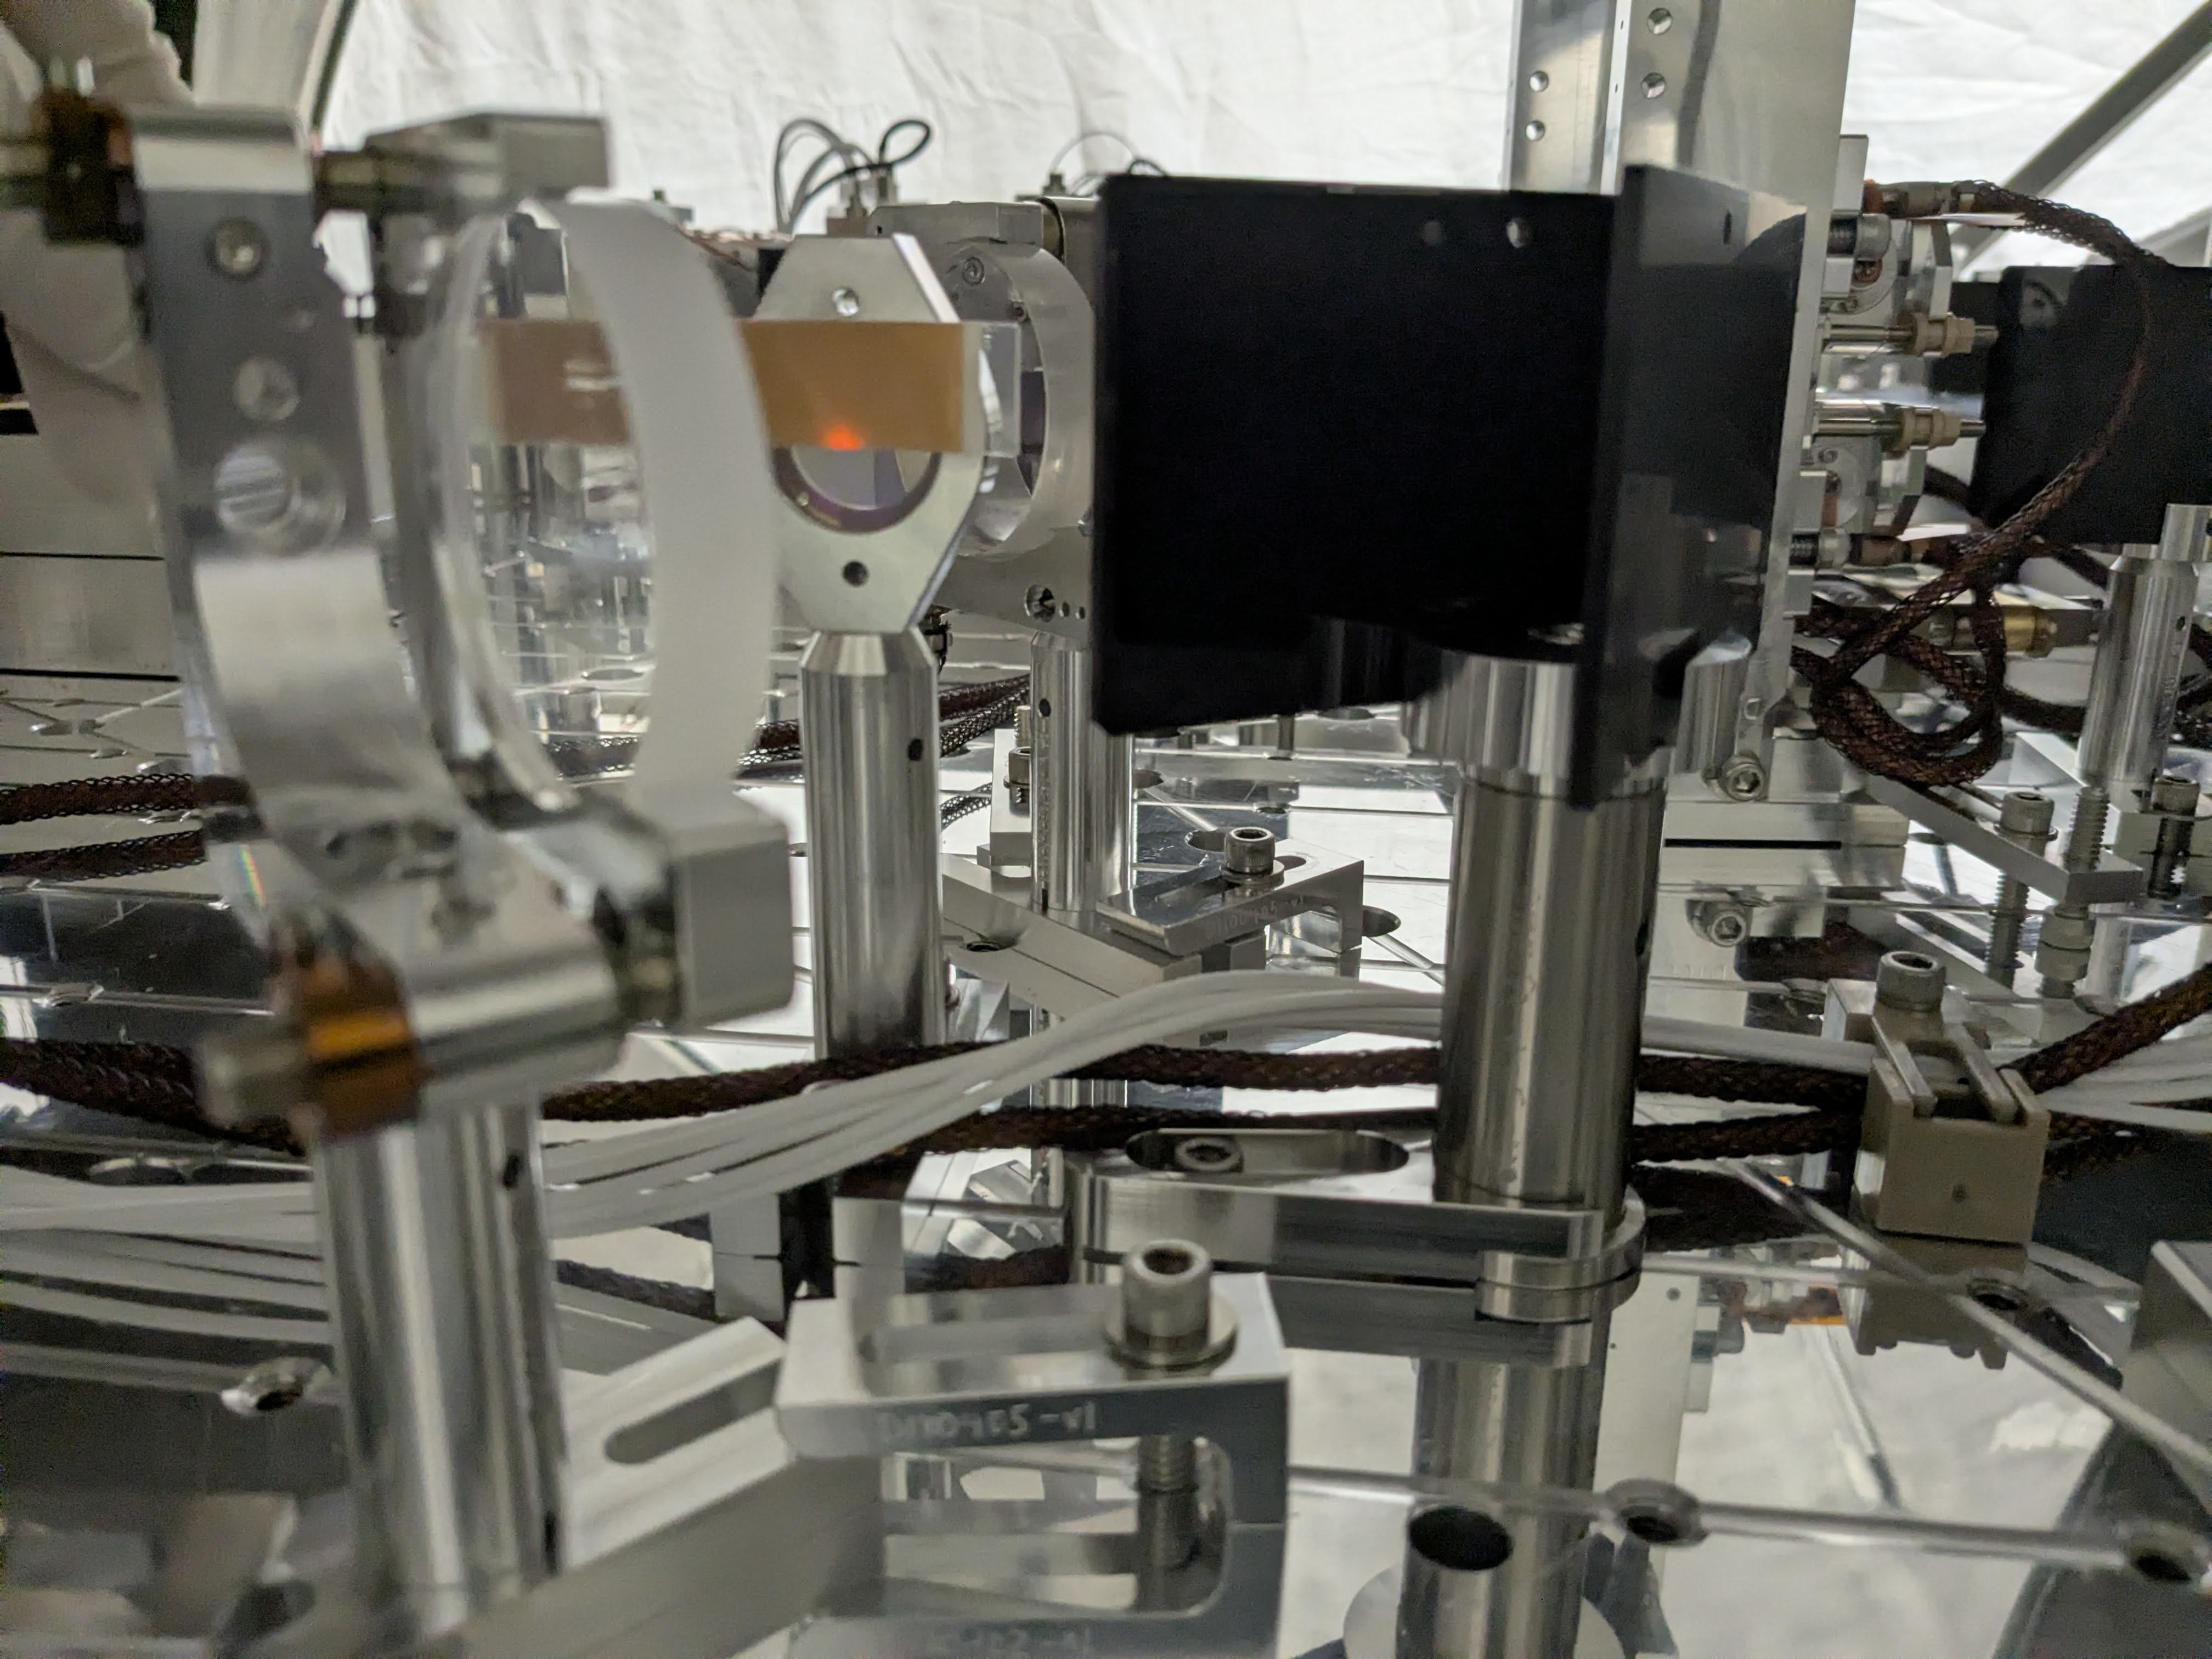
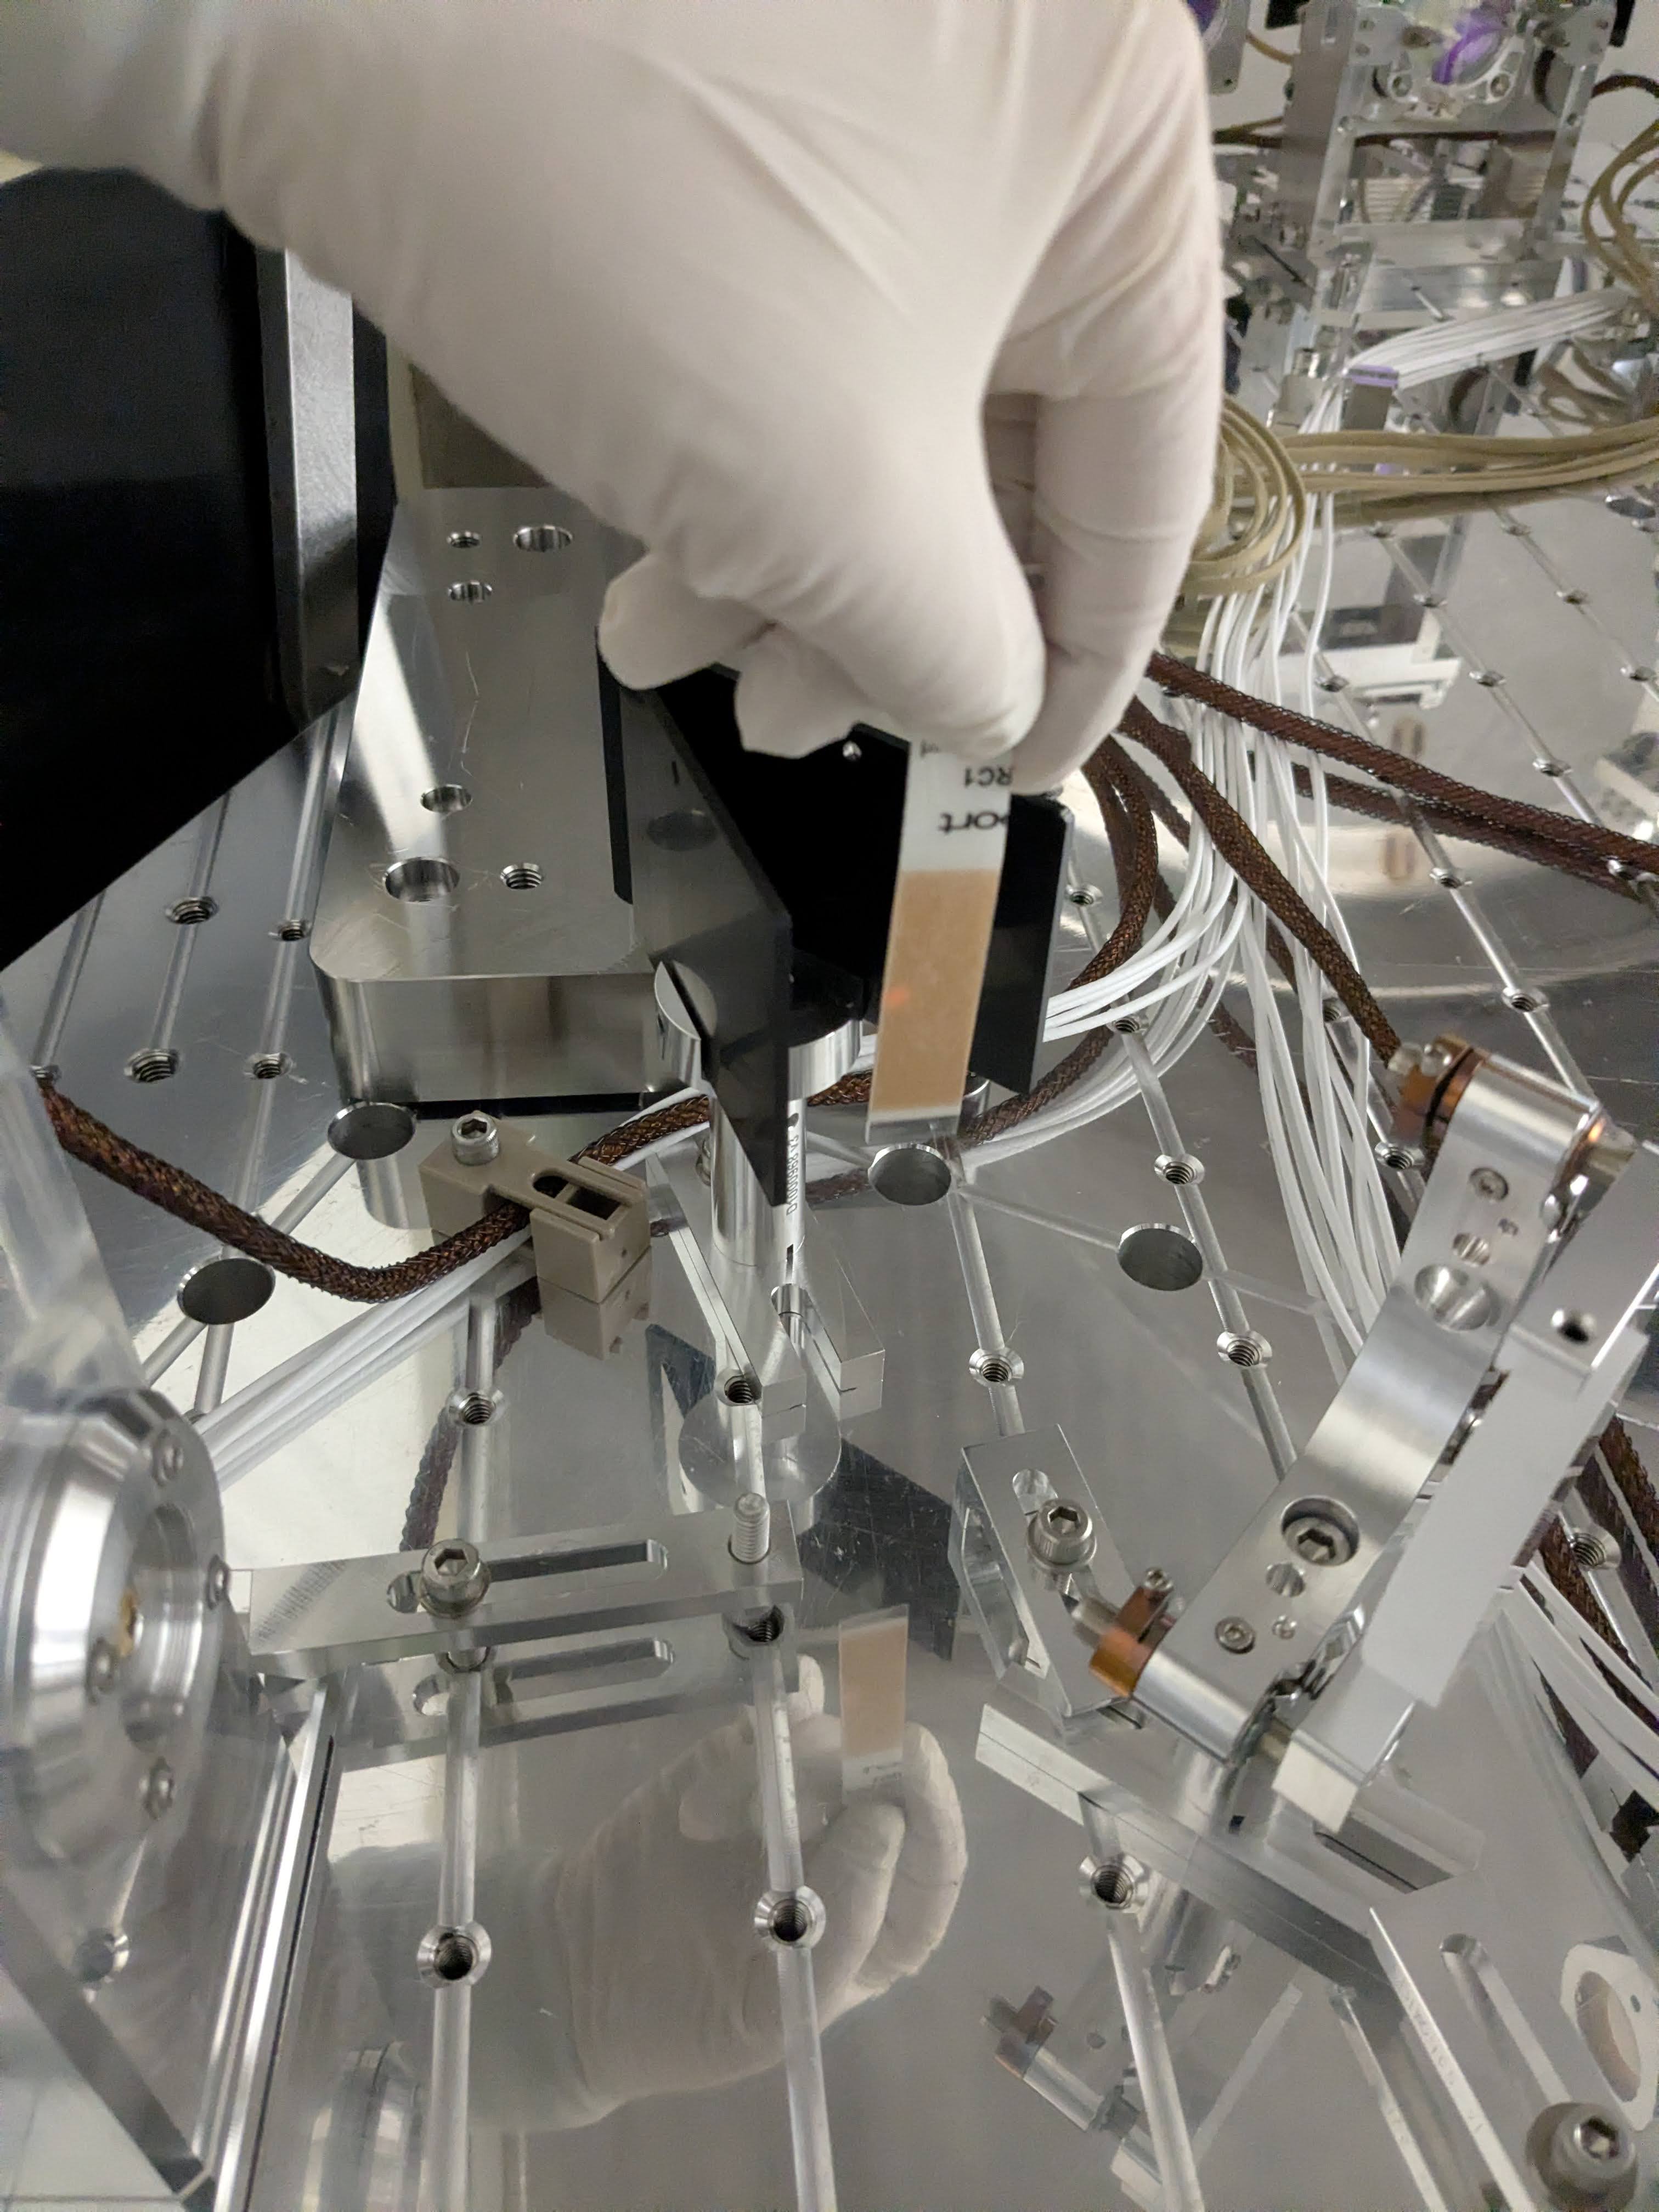
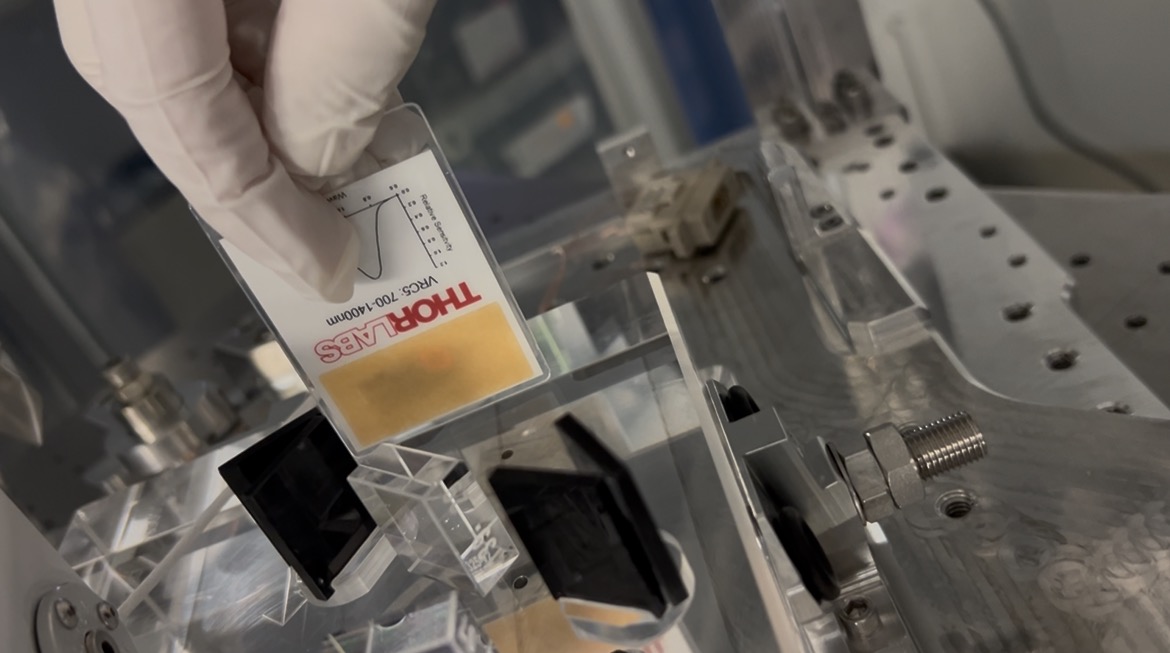
Today, Keita and Oli turned up the power to the fiber again so we are getting about 30 mW out. This is enough power that you can see the beam transmit the input coupler of the OMCs easily on a card. With the room lights dim, you can see flashing of the beam at both DCPDs with a card. Using the IR sensitive camera, we are able to fine tune the input alignment further.
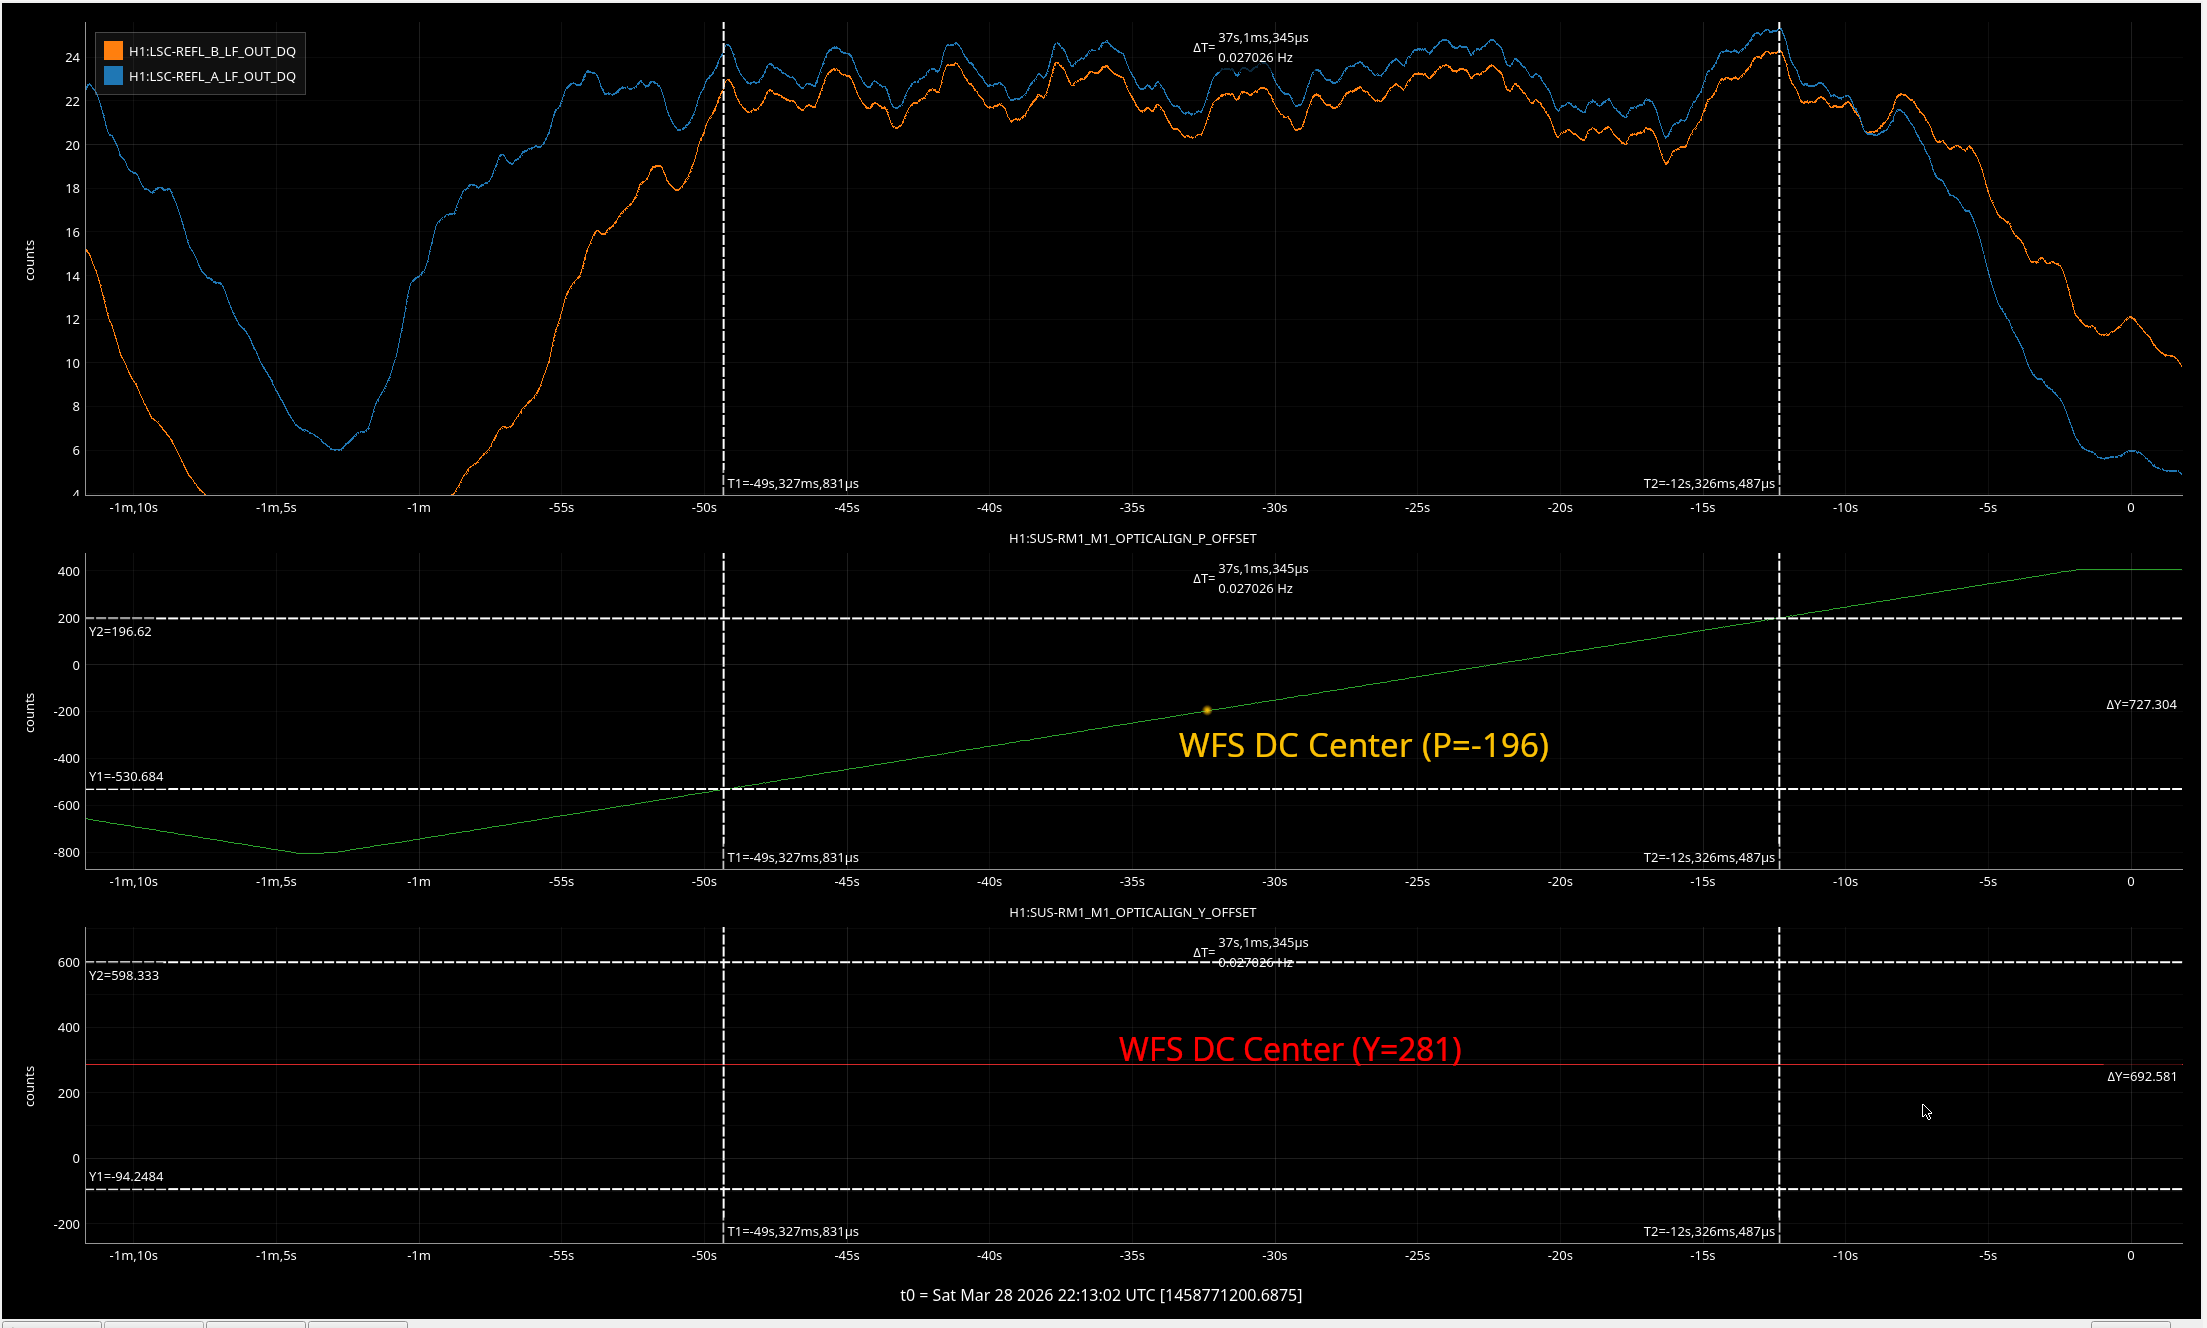
The beam has been well-aligned to OMCA, and the flashing present at the DCPDs looks mostly like mode mismatch, which makes sense because we made no effort to mode-match our input beam to the OMCs.
The beam alignment to OMCB still needs some work. It looks predominantly like a yaw misalignment, so we need to make some finer adjustments of the upstream optics.
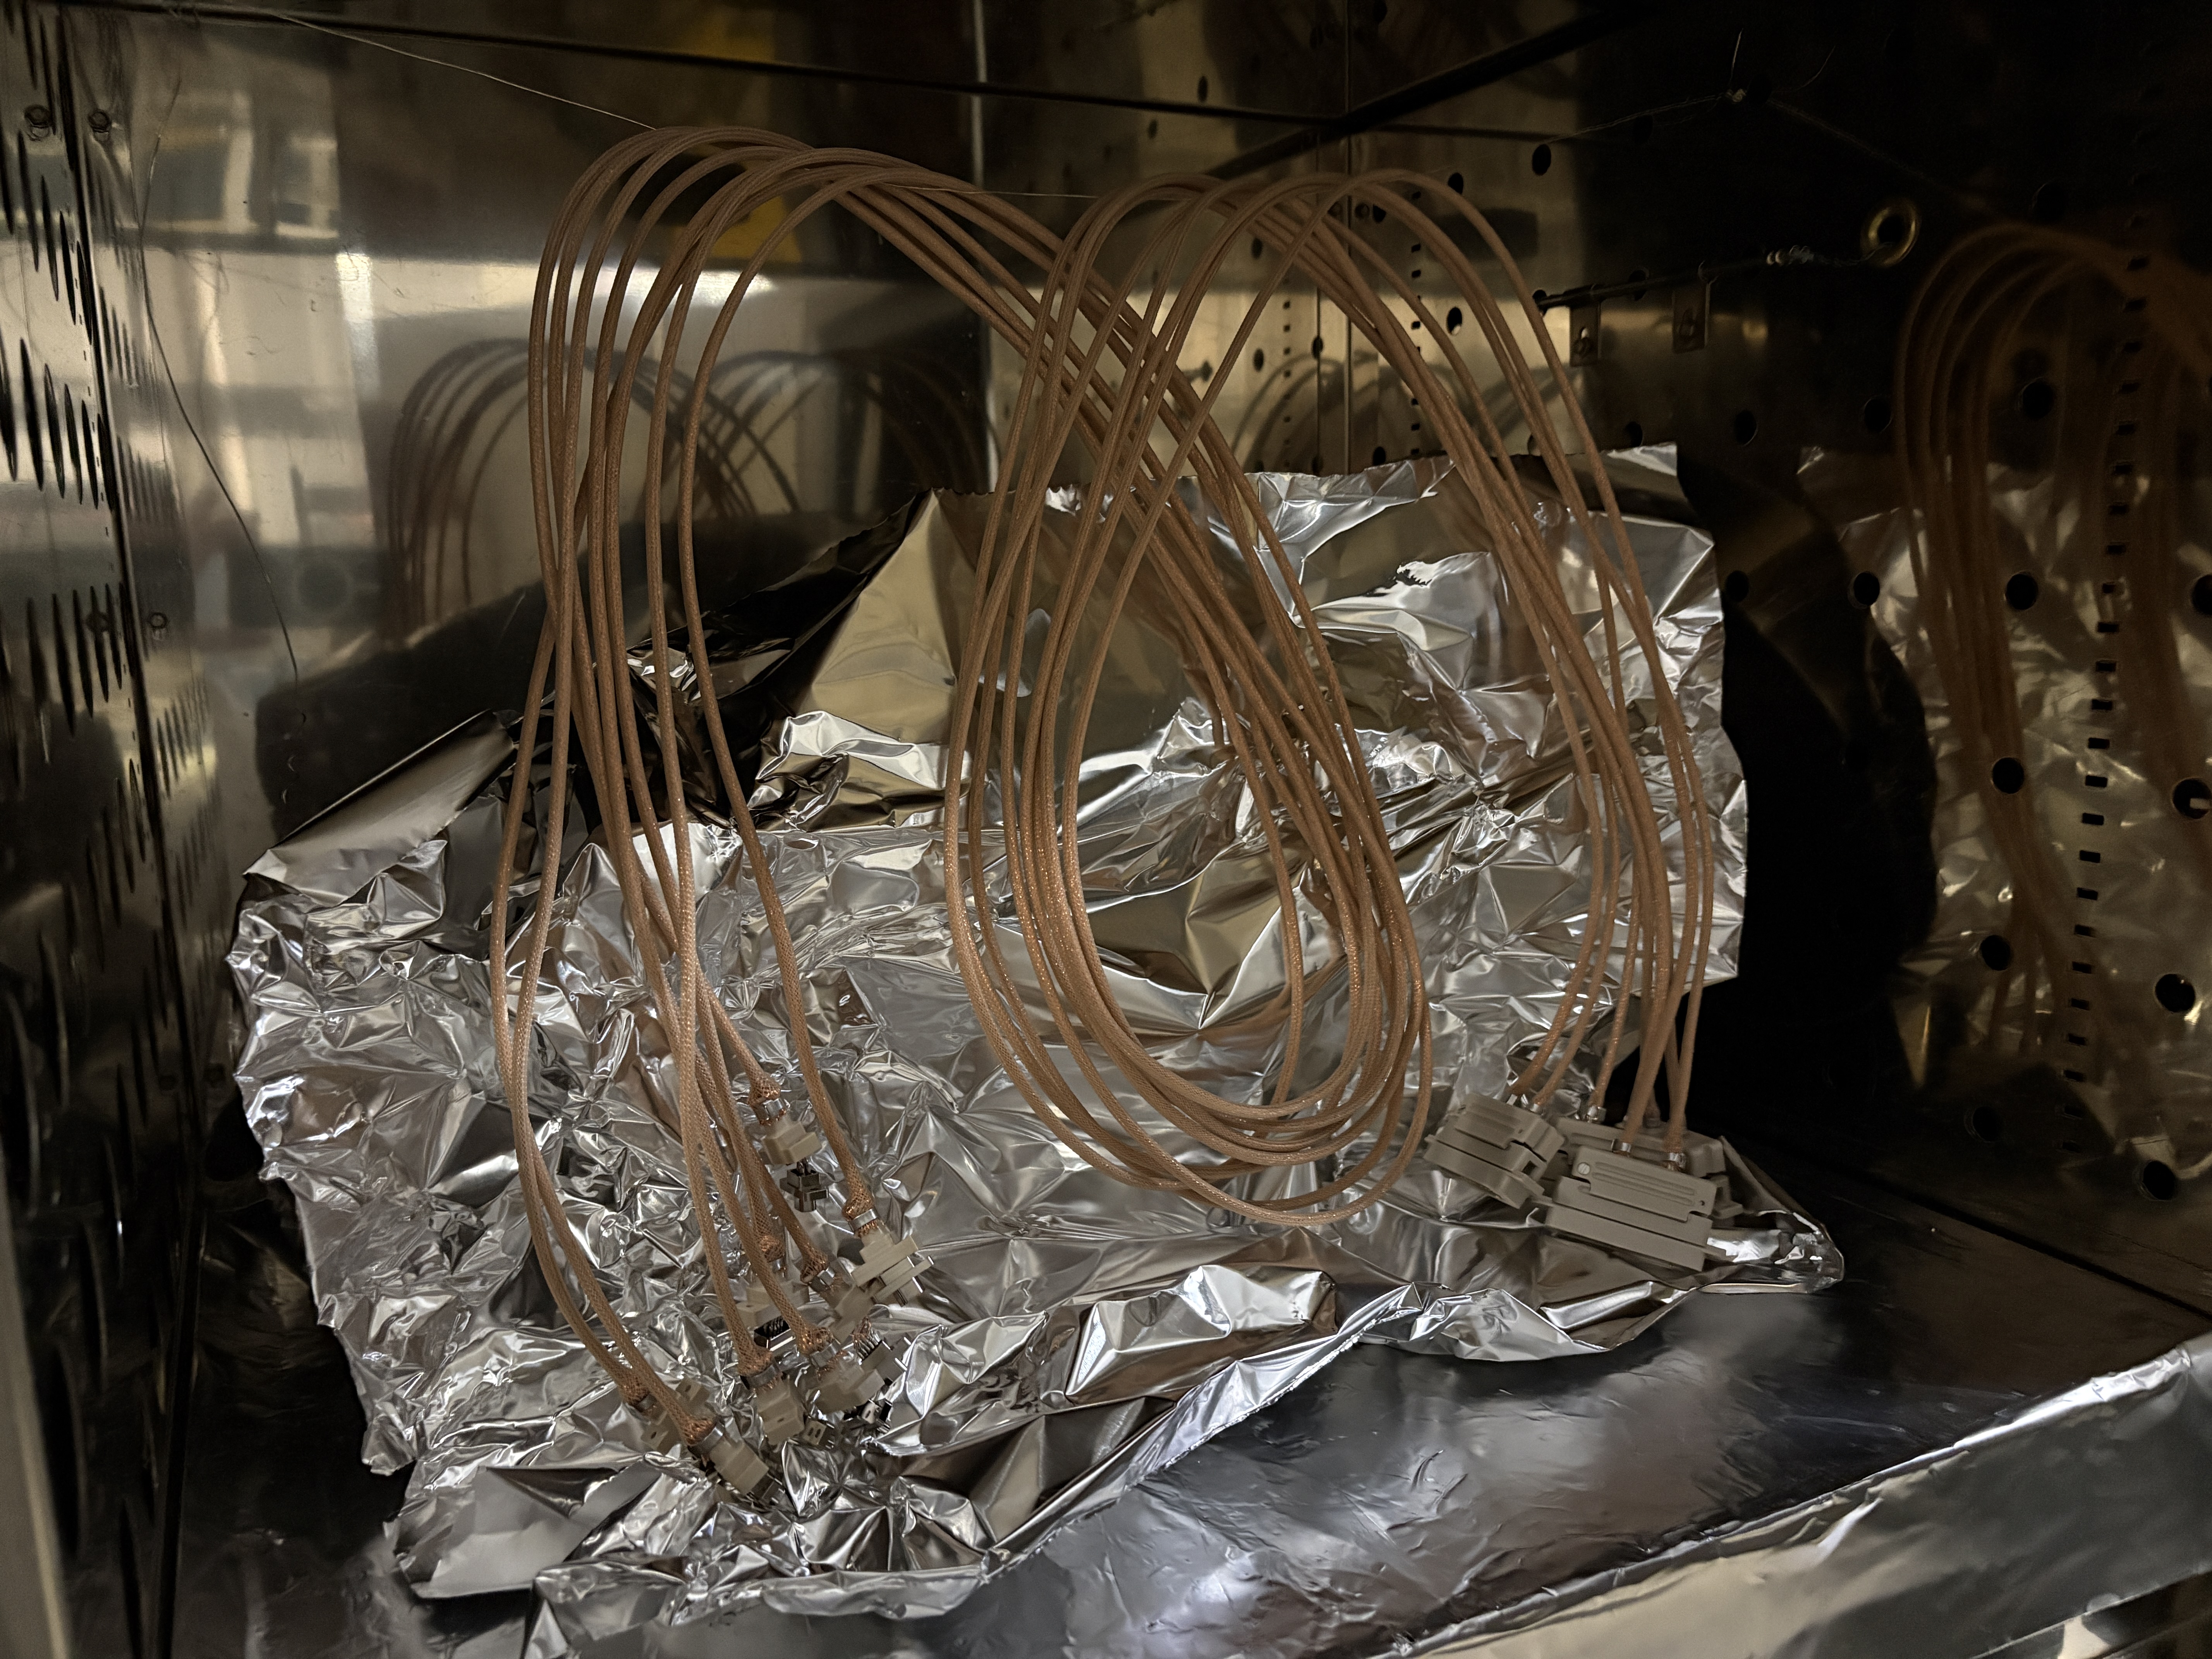
Since all of the BHSS optics have been pre-angled using the clocking tool, I followed the map on slide 86 of T2100190 to place the lenses, mirrors and beam dumps. Just by eye, I can tell we will need to fine tune this alignment further once we have laser beam. I was unable to place one beam dump because it goes roughly where we are pooling the OMCA cables. Once we can route and clamp those cables properly, there will be room for the dump. I haven't placed the QPDs yet, they are still bagged. I also placed the three head optics randomly, since they can't be placed until the OMC iris template is removed.
As a reminder, the order of operations here is to use the iris alignment template to get good input alignment to both OMCs. Then, this template is removed so we can use other precision templates to align the three optics that go at the head of the manta ray: mirrors A/B-R1 and 36-R1. Then, we can finish the rest of the beam paths to the OMC QPDs.
I took a phone video of OMCA flashing and managed to screengrab these two photos from the videos: DCPDA, DCPDB