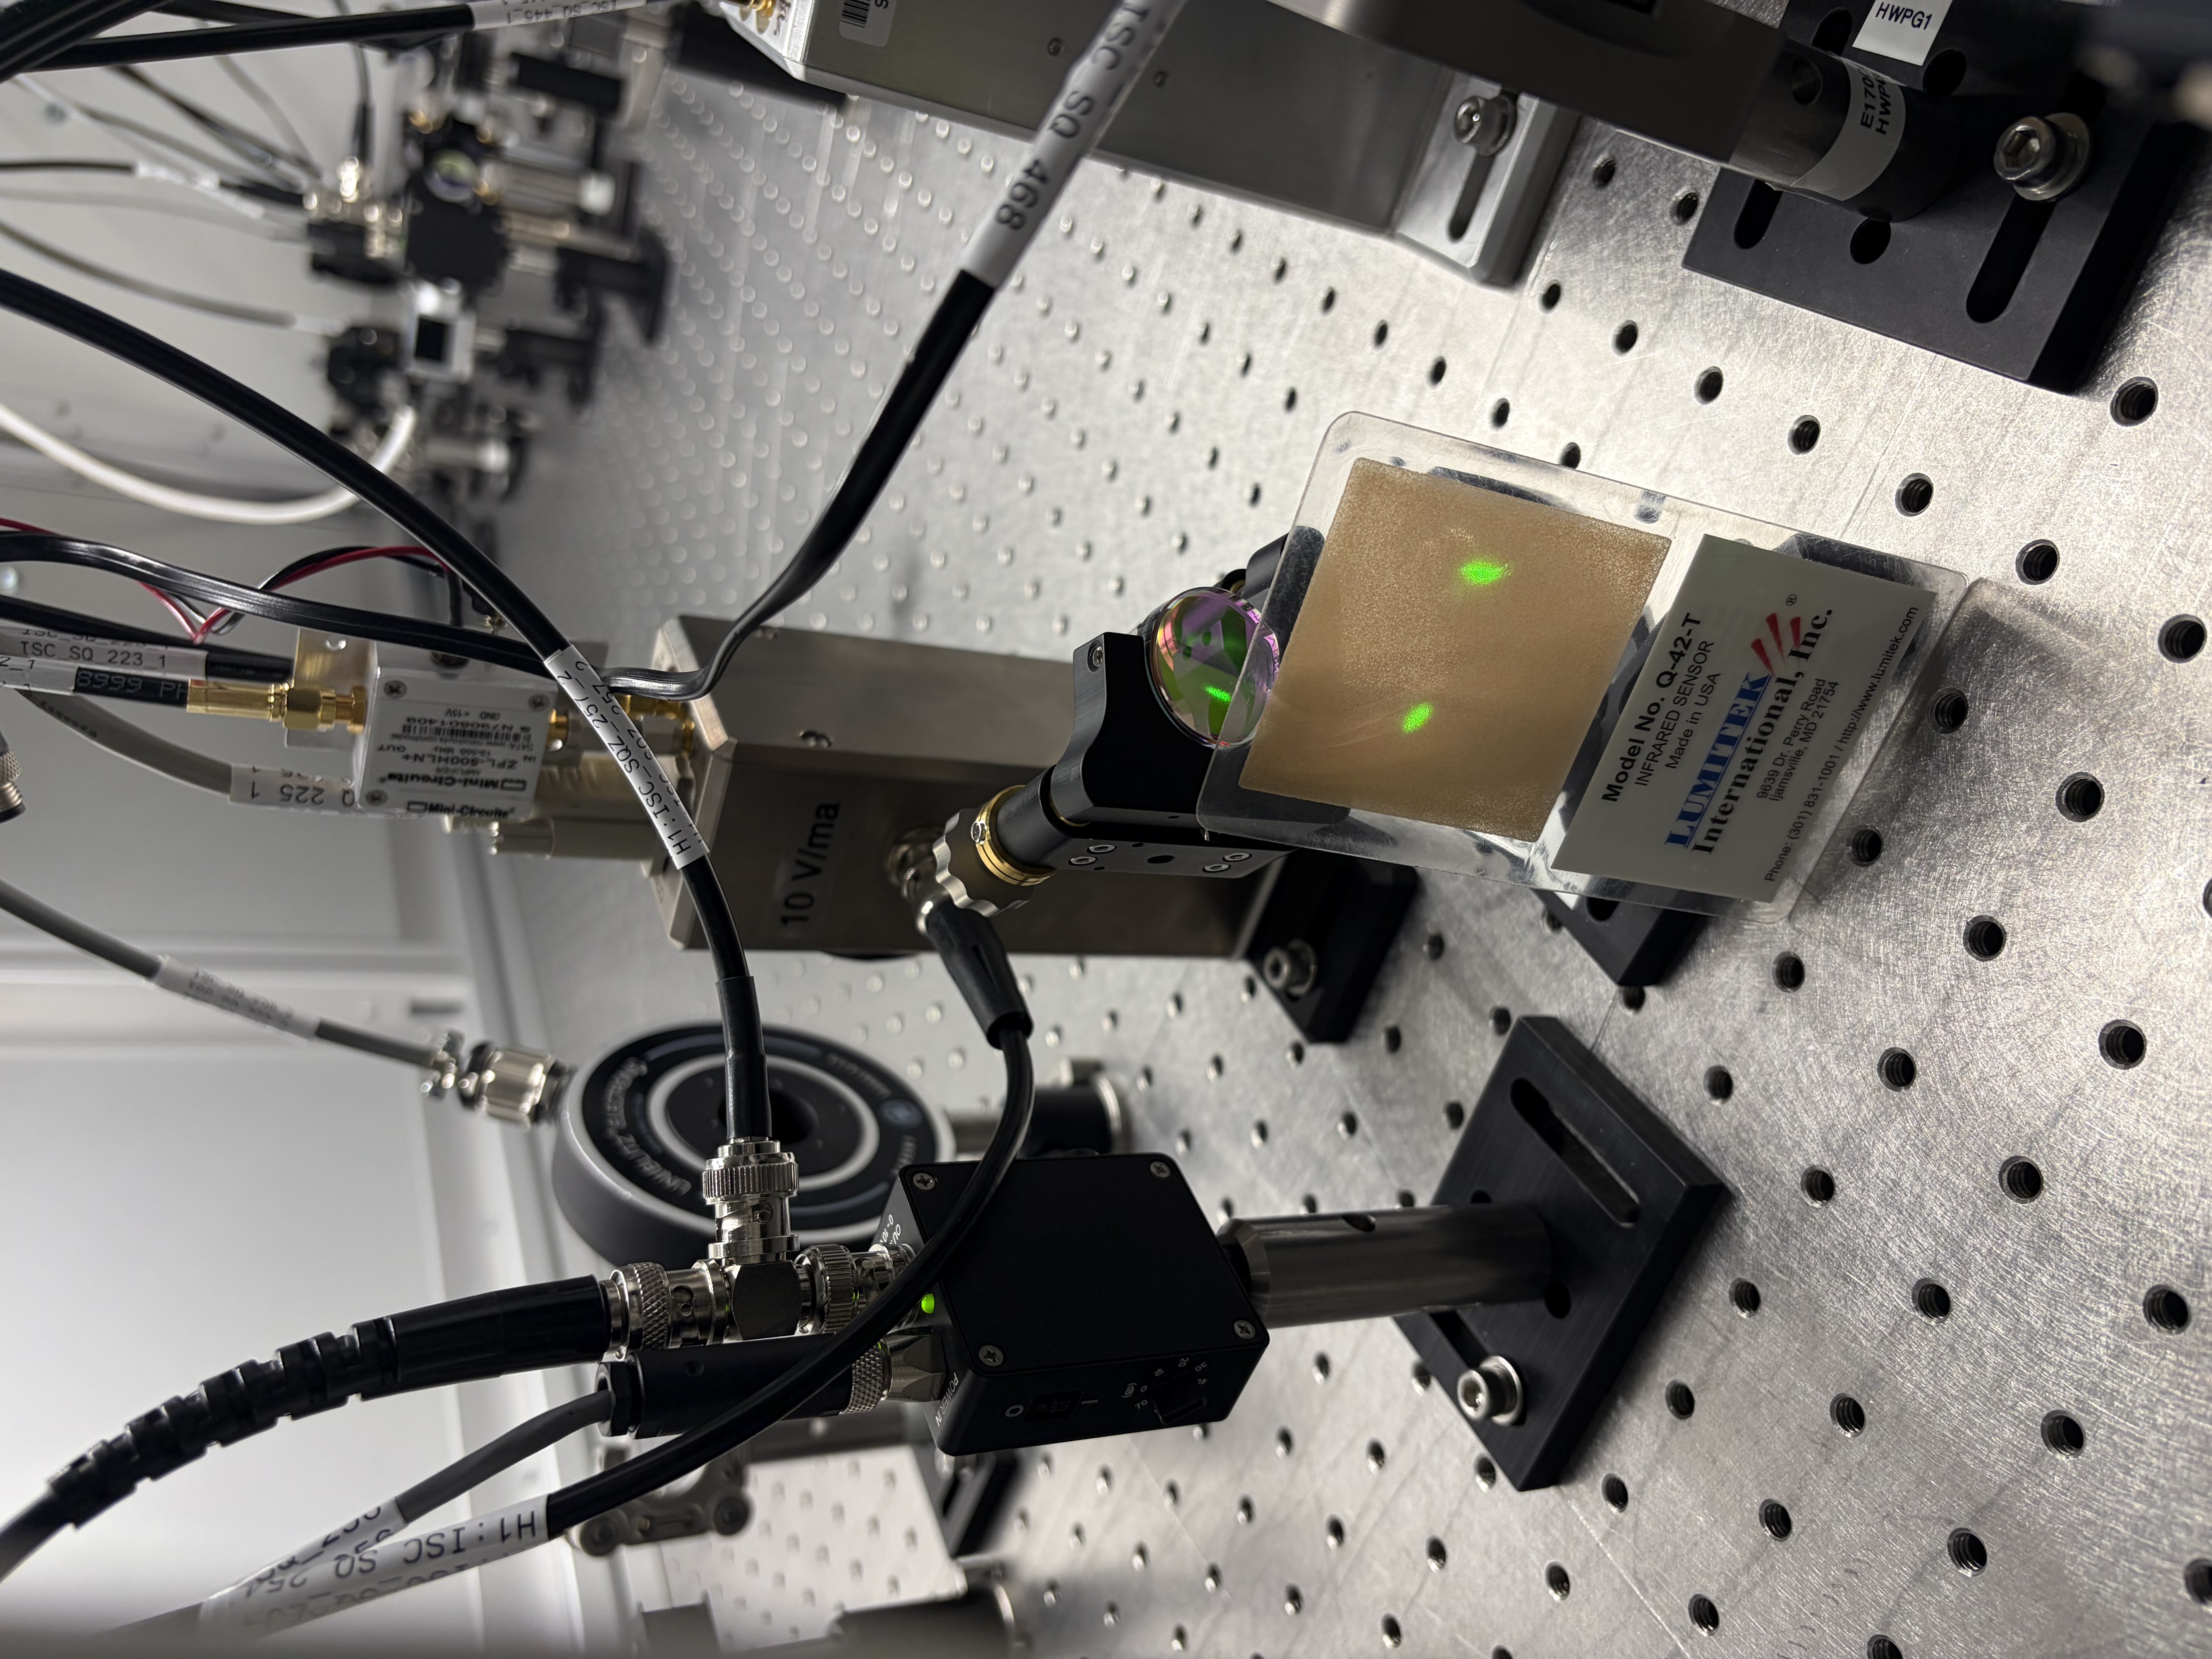
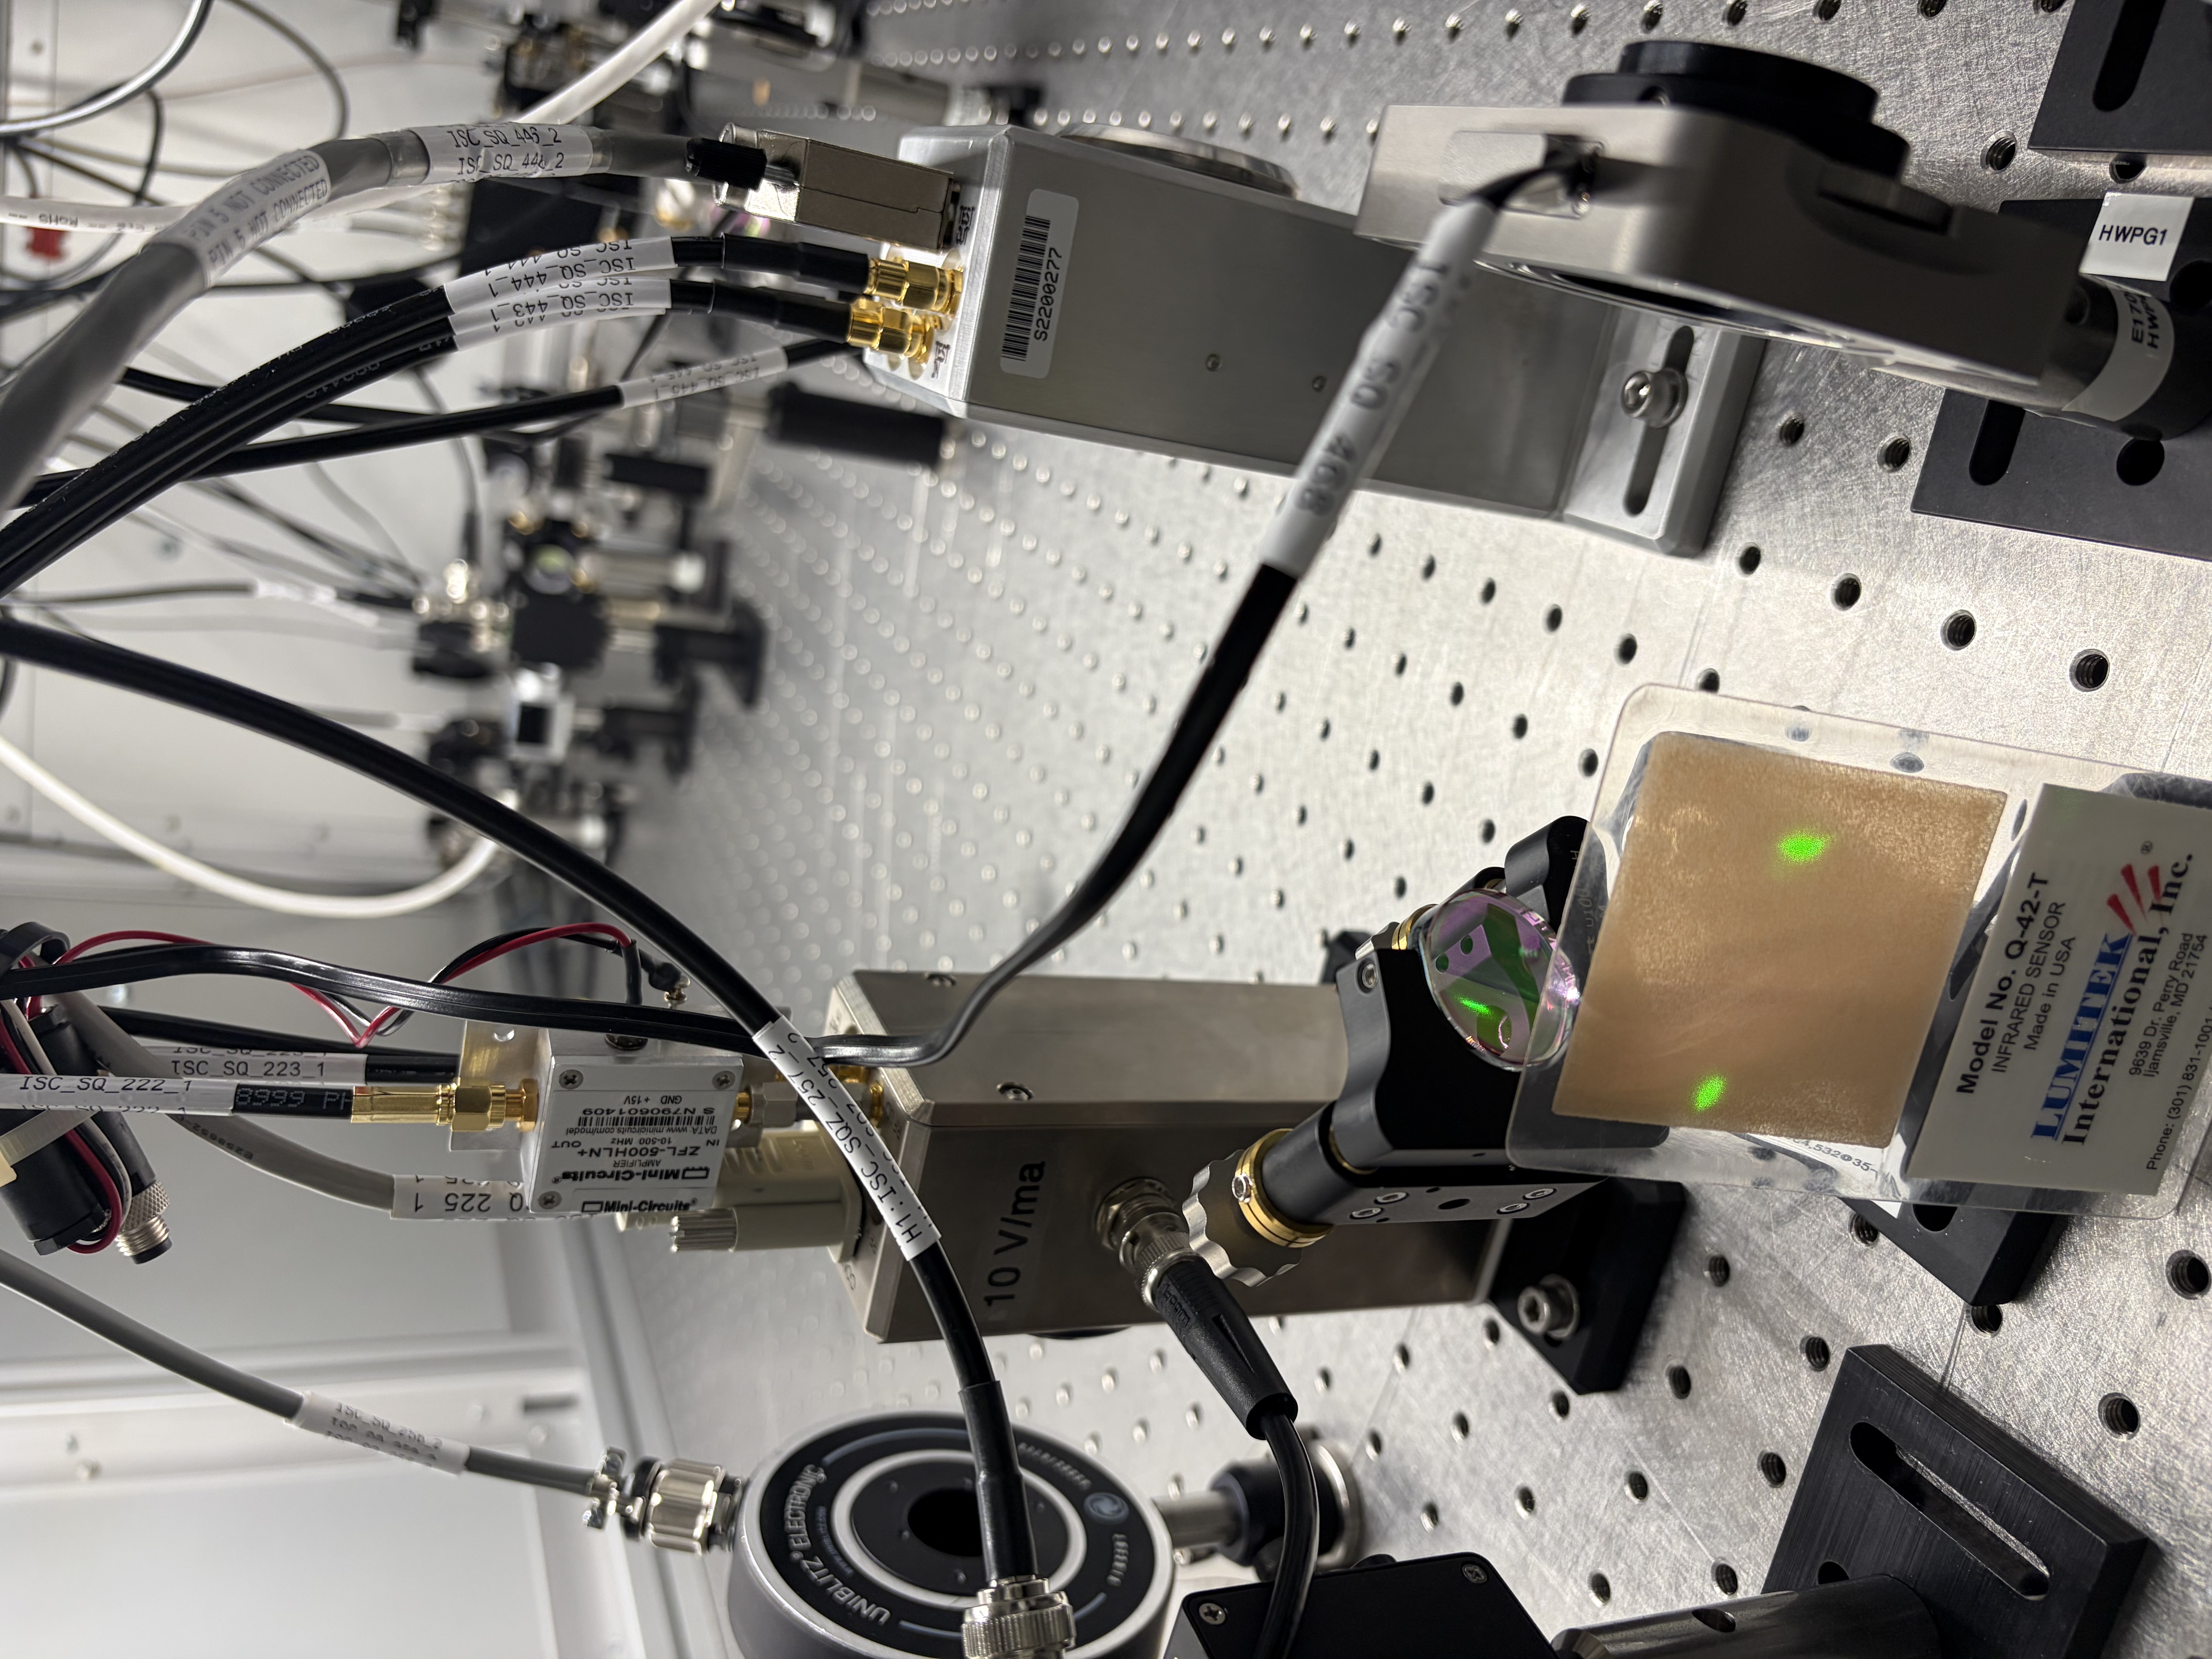
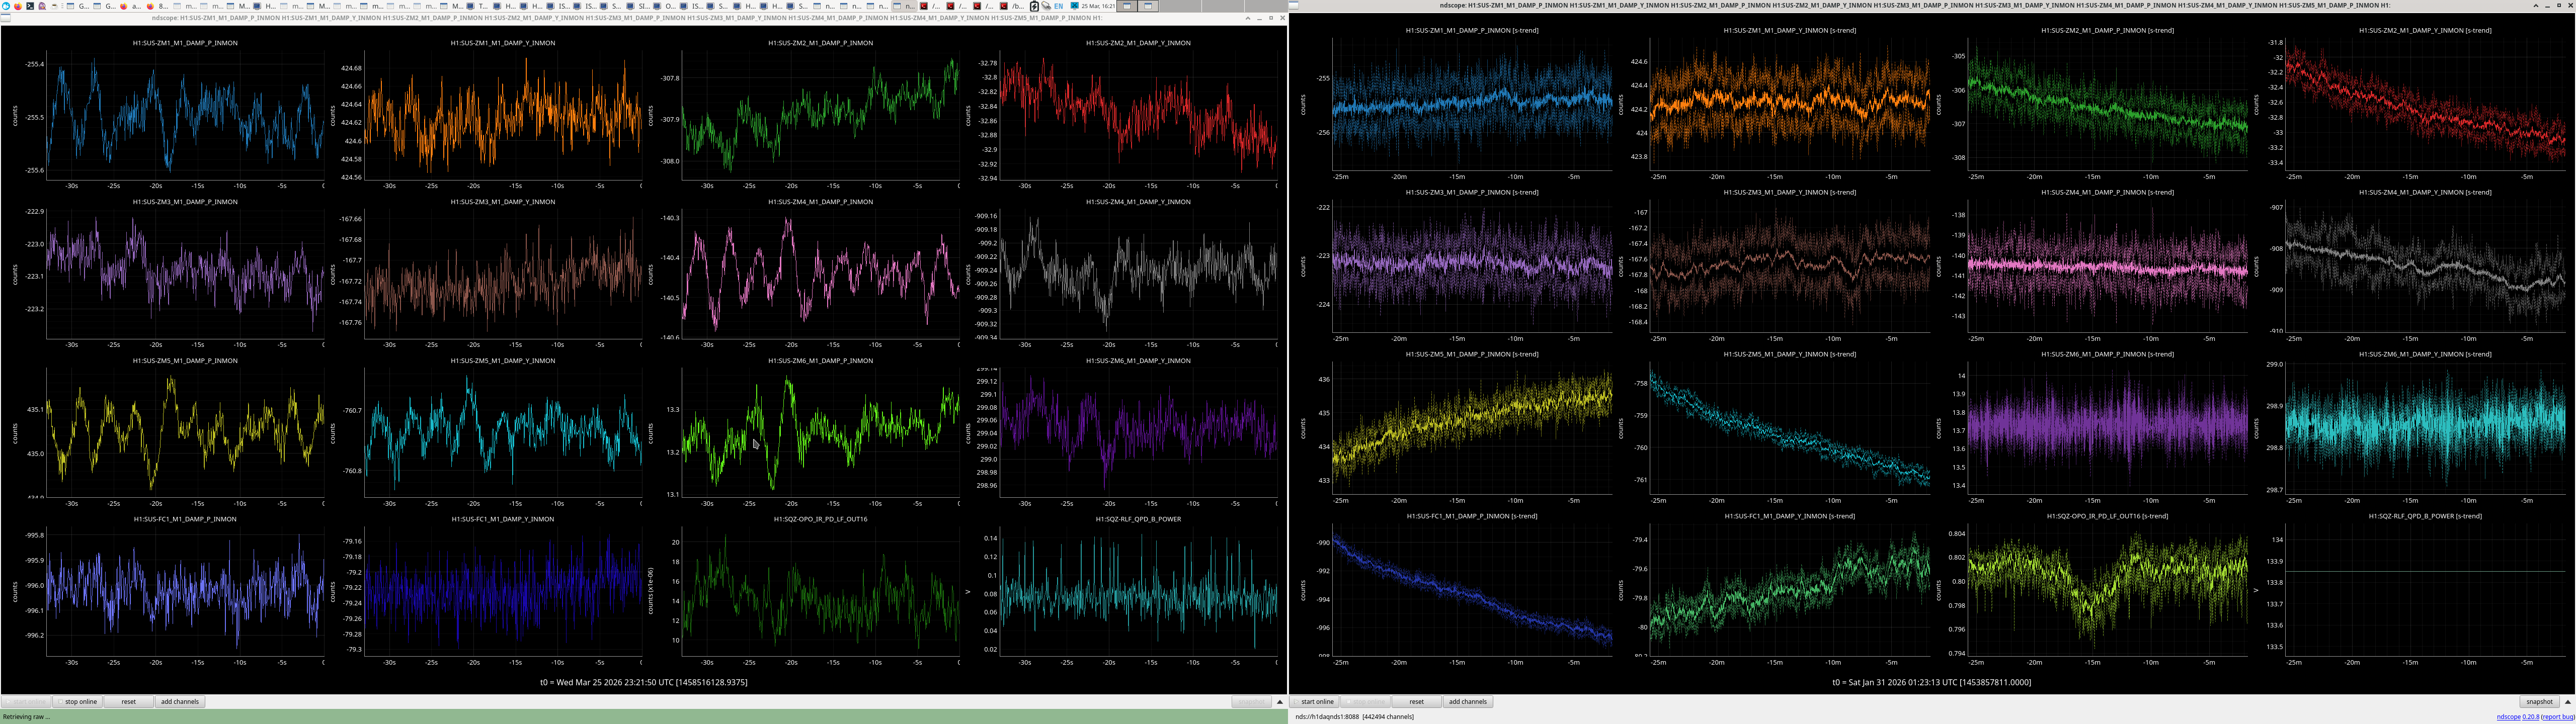
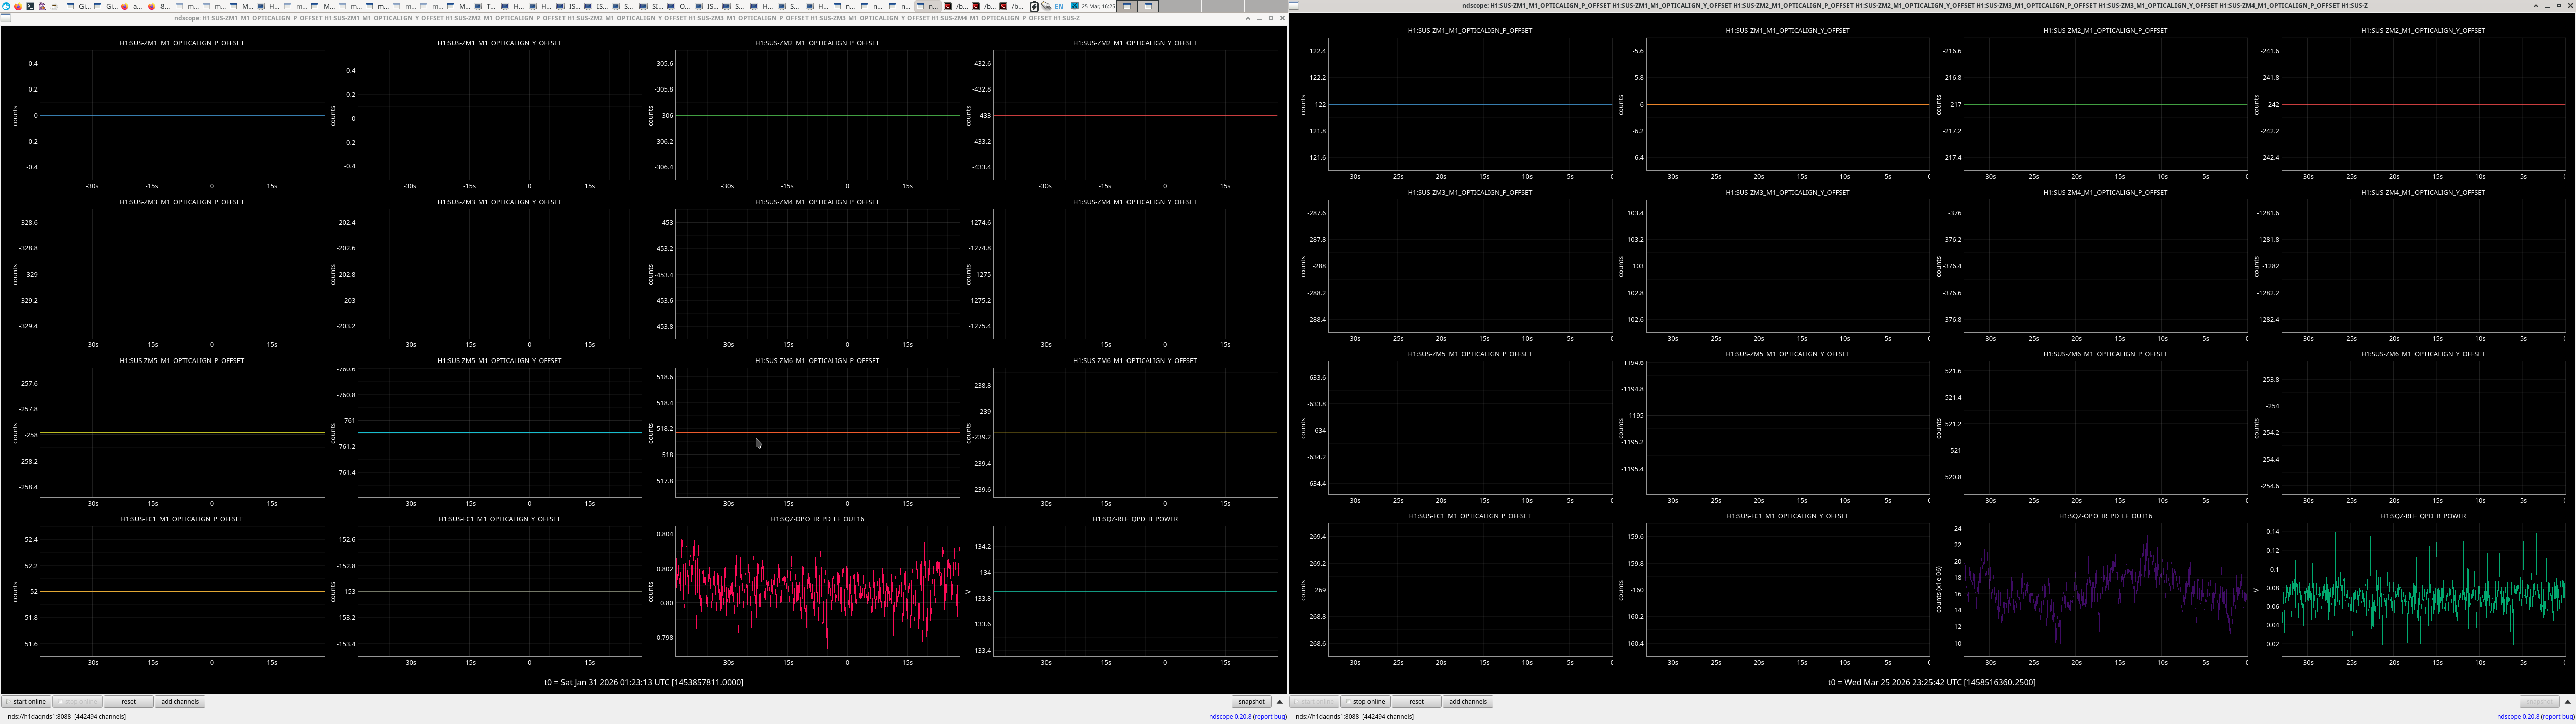
Commissioning wrapped up, back to Observing 2007UTC.
Locked for 22 hours.
This morning I swapped out the dust monitor in the VAC prep lab for a spare that was calibrated earlier this year. After swapping the connection issues remain.
Since we've been having issues with PI24 ringing up lately we decided to change the SUS_PI guardian code to increase the bias offset on ETMY L3 LOCK. That bias offset value is normally -4.9, and we noticed that when damping PI24, we typically start hitting our damping limit when PI24 RMSMON exceeds a value of 10. I have turned the PI_DAMPING state into a generator function so it can now make two different states, PI_DAMPING and EXTREME_PI_DAMPING. When in PI_DAMPING, pi24 will be damped with our normal bias until we reach an RMSMON average value of 20. Once that happens, the guardian will jump to a state called INCREASE_BIAS (what it does is self-explanatory), and then goes into XTREME_PI_DAMPING, where it continues damping and changing phase as needed until we are back under an RMSMON value of 4(pi24 script logic). Once we are good the guardian will take us through DECREASE_BIAS (guess what that does) and then back into PI_DAMPING(node graph, states list).
Because the nominal state for Observing is PI_DAMPING, when we move into one of these other states we will be taken out of Observing (tagging OPS). Once we are back in PI_DAMPING we will automatically go back into Observing as long as we are in AUTOMATIC.
Occasionally we do get small quick ringups that go up above 20 that are capable of being damped by regular damping and just changing the phase - ndscope1(versus the slower ringups that cannot - ndscope2), so with these script changes, when these happen we will be taken out of Observing as the SUS_PI guardian jumps to up the bias and damp harder. These don't happen very often so we are okay for now, but a future to-do is to edit the script to keep it from increasing the bias at least until it's tried all phase changes.
Camilla, Sheila, Following on from 81852.
Today I re-ran the sqz/h1/scripts/SCAN_PSAMS.py script, with SQZ_MANAGER guardian paused (so it's not forcing the ADF servo on). The script worked as expected (setup by turning off ADF servo and increasing SQZ ASC gain to speed up, then changed ZM PSAMS, waited 120s for ASC to coverage, turned off ASC, scanned sqz angle and saved data and then repeated) and took ~3m30 per step.
The results are attached (heatmap, scans) but didn't show an obvious direction to move in. Maybe the steps were too small but are already larger than those use at LLO LLO#72749: 0.3V vs 0.1V per step.
Our initial ZM4/5 PSAMs values were 5.6V, -1.1V and looking at the attached data, we took them to 5.2V, -1.5V. We then decided ther range looked better when the PSAMs were higher to went to 6.0V, -0.4Vthis seemed to gain improve the range ~5MPc, we checked by going back to 5.2V, -1.5V and the range again dropped, main change appears to be in orange BAND_2 OMC BLRMs which is 20-34Hz, the places with glitches in OAF BLRMS are noisy times from Robert's injections. Then went further in this direction to 6.5V, 0.0V, this didn't help the range so we are staying at 6.0V, -0.4V, sdf's attached. This seemed to be a repeat-able change that gave us a few MPc's in range! Success for PSAMS: zoomed out and zoomed in plots attached.
Future work: we could run the SCAN_PSAMS.py script with small 0.1V changes as LLO does.
Vicky asked to check the HOM plot and wide plot, don't see a big difference, if anything it's worse with larger HOM peaks after the PSAMS change. We can see that the 20-35Hz in DARM looks a little better, though this does drift throughout the lock as Sheila showed in 81843.
Thu Dec 19 10:15:29 2024 INFO: Fill completed in 15min 25secs
Gerardo confirmed a good fill curbside.
TC-B suddenly jumped up in temperature at 04:16 this morning by +15C. Gerardo took a look, both TCs are currently encased in ice (see photo).
TC-mins for today's fill (trip temp = -65C) TC-A = -116C, TC-B = -56C. Which means only TC-A was able to stop the fill by exceeding the trip temp.
Following the new instructions but on the usual wiki, I ran a broad band and then a new version of simulines like Corey did last week (alog81828).
Simulines start:
PST: 2024-12-19 08:37:18.337770 PST
UTC: 2024-12-19 16:37:18.337770 UTC
GPS: 1418661456.337770
End:
PST: 2024-12-19 09:01:04.771446 PST
UTC: 2024-12-19 17:01:04.771446 UTC
GPS: 1418662882.771446
Files:
2024-12-19 17:01:04,693 | INFO | File written out to: /ligo/groups/cal/H1/measurements/DARMOLG_SS/DARMOLG_SS_2024
1219T163719Z.hdf5
2024-12-19 17:01:04,700 | INFO | File written out to: /ligo/groups/cal/H1/measurements/PCALY2DARM_SS/PCALY2DARM_S
S_20241219T163719Z.hdf5
2024-12-19 17:01:04,704 | INFO | File written out to: /ligo/groups/cal/H1/measurements/SUSETMX_L1_SS/SUSETMX_L1_S
S_20241219T163719Z.hdf5
2024-12-19 17:01:04,708 | INFO | File written out to: /ligo/groups/cal/H1/measurements/SUSETMX_L2_SS/SUSETMX_L2_S
S_20241219T163719Z.hdf5
2024-12-19 17:01:04,712 | INFO | File written out to: /ligo/groups/cal/H1/measurements/SUSETMX_L3_SS/SUSETMX_L3_S
S_20241219T163719Z.hdf5
VACSTAT detected another BSC3 PT132 sensor glitch at 00:53 Thu 19dec2024. I reset vacstat_ioc.service on cdsioc0 at 07:32 to clear it.
TITLE: 12/19 Day Shift: 1530-0030 UTC (0730-1630 PST), all times posted in UTC
STATE of H1: Observing at 157Mpc
OUTGOING OPERATOR: Ryan S
CURRENT ENVIRONMENT:
SEI_ENV state: CALM
Wind: 9mph Gusts, 7mph 3min avg
Primary useism: 0.04 μm/s
Secondary useism: 0.35 μm/s
QUICK SUMMARY: Locked for 17.5 hours, range stable, environment calm. Planned calibration and commissioning today starting at 0830PT (1630UTC).
TITLE: 12/19 Eve Shift: 0030-0600 UTC (1630-2200 PST), all times posted in UTC
STATE of H1: Observing at 157Mpc
INCOMING OPERATOR: Ryan S
SHIFT SUMMARY:
H1 has been locked all shift!
A few small earthquakes rolled though and we survived.
Other wise it's been a quiet night.
Just an FYI, the vacuum pressure is affected by the temperature fluctuations inside the VEA, probably due to warm day(s), see attached plot. Noted on both Mids.
TITLE: 12/18 Eve Shift: 0030-0600 UTC (1630-2200 PST), all times posted in UTC
STATE of H1: Observing at 156Mpc
OUTGOING OPERATOR: TJ
CURRENT ENVIRONMENT:
SEI_ENV state: CALM
Wind: 6mph Gusts, 4mph 3min avg
Primary useism: 0.06 μm/s
Secondary useism: 0.38 μm/s
QUICK SUMMARY:
Locked And Observing for 8 minutes.
Notes about IFO config:
EY Ring heater is bumped up 0.1Watts/sec so we have a chance of surviving a a 10K PI ring up. Alog about this: https://alog.ligo-wa.caltech.edu/aLOG/index.php?callRep=81891
TITLE: 12/18 Day Shift: 1530-0030 UTC (0730-1630 PST), all times posted in UTC
STATE of H1: Observing at 155Mpc
INCOMING OPERATOR: Tony
SHIFT SUMMARY: Strong wind this morning with gusts into the 50s slowed down locking, but we made it up around the middle of the day. We are running with the EY ring heaters at 1.2W vs their usual 1.1W to avoid PIs. The LVEA was transitioned to laser hazard so Robert could go back out to the floor and check on some beam spots. Relocking was automatic, we've now been locked for 2 hours.
LOG:
Start Time | System | Name | Location | Lazer_Haz | Task | Time End |
---|---|---|---|---|---|---|
16:53 | SAF | LVEA | LVEA | YES | LVEA IS LASER HAZARD | 00:38 |
17:15 | PEM | Robert | LVEA | n | Moving test setup | 17:20 |
17:39 | SAF | Oli | LVEA | n->YES | LVEA laser hazard transition | 18:04 |
17:44 | PEM | Robert | LVEA | YES | Beam spot investigation | 19:47 |
18:06 | FAC | Tyler, Richard, MacMiller | MY, EY | n | Chiller inspections | 18:31 |
19:48 | PCAL | Francisco, Dripta | PCAL lab | local | PCAL meas | 22:36 |
The wind has calmed down and we were able to relock automatically.
We have a new ETMY ring heater setting, so we'll see if PI24 is a problem this time.
In alog_81849 Sheila and Camilla found a bug in the picomotor controller code, whereby if the motor to be controlled is changed while the controller is busy with the current move command, the motor change is not accepted resulting in the wrong motor being driven during subsequent commands.
As a quick work around until such time as the code can be fixed, I've made a change to the MEDMs which hides the motor selection buttons when the controller is busy.
Attached screenshots show a test case, left shows the normal situation where the controller is not busy and the selection buttons are all visible. The right screen shows a simulation of the controller being busy (INUSE=1), the selection buttons are replaced by rectangular blocks.
Sheila, TJ, Camilla
We've had 3 locklosses since 9th Dec from PI24 ringing up (10.4kHz on ETMY): last night 81883, Tuesday AM 81862 and the 9th Dec, plot of all.
We had locklosses like this in September after the vent, Oli has a timeline in 80299. We increased the ETMY RH on September 26th 80320 and didn't have any PI locklosses since.
We normally damp this PI during the start of thermalization and successfully damped this after a 13 hours locked on 10th Dec, plot.
We can see a 25Hz wiggle in DARM just before the lockloss, e.g. 81862. The lockloss tool isn't tagging these as DCPD Saturation so we should implement LLO's PI code: Locklost Issue #198
Plotted is the location of the arm higher order modes around 10kHz. They have moved so that the central frequency is the same as the spikes around 10.4kHz, this excites the PI's more.
Maybe an unrelated point is that since the start of October, the circulating arm power has drifted down ~4kW (~1%) from 389 to 285kW when thermalized, plot attached. It's hard to know what's caused this, the IM4 TRANS drifted ~2% but was misaligned so would see alignment shifts 81735, the POP also drifted ~1% before it was recentered 81329. Input power measured by IMC_PWR_IN remained constant.
You cannot just use L1's lockloss code for the tagging universally [should work for the 10kHz PI though].
Because of the way LHO changed their readouts for the OMC, digging into the simulink model will reveal the PI is reading in only the first 32kHz band, for the RMS calculations
You simply have no aliasing down of the full band to utilise it in the way we do; and it will never see 80kHz PI.
Also your scaling is using calibrated DARM units by the look of things; while we use a counts scale; so the numbers in the RMS readouts are different many orders of magnitude.
Very quick shot of the 10.4k homs 2 hours into the first lock with the EY ring heater bumped up to 1.2W from 1.1W. This will need to be checked again later, but it's promising so far.
Looked at the spectum of th 50W CO2 lasers on the fast VIGO PVM 10.6 ISS detectors when the CO2 is locked (using the laser's PZT) and unlocked/ free running: time series attached. Small differences <6Hz, see spectrum attached.
Gabriele, Camilla.
We are not sure if this measurement makes sense.
Attached is the same spectrum with the CO2X laser turned off to see the dark noise. It appears that measurement is limited to dark noise of the diode above 40Hz. The ITMX_CO2_ISS_IN_AC channel dark noise is actually above the level when the laser is on, this doesn't make sense to me.
Gabriele and I checked that the H1:TCS-ITM{X,Y}_CO2_ISS_{IN/OUT}_AC filter: de-whiten zpk([20], [0.01], 0.011322, "n"), is as expected from the PD electronics D1201111, undoing the gain of 105dB with the turning point around 20Hz, foton bode plot attached.
This means that both the AC and DC outputs should be the voltage out of the photodetector before the electronics, where the PD shunt resistance was measured to be 66 Ohms.
This alog presents the first steps I am taking into answering the question: "what is the calibrated residual test mass motion from the ASC?"
As a reminder, the arm alignment control is run in the common/differential, hard/soft basis, so we have eight total loops governing the angular motion of the test masses: pitch and yaw for differential hard/soft and common hard/soft. These degrees of freedom are diagonalized in actuation via the ASC drive matrix. The signals from each of these ASC degrees of freedom are then sent to each of the four test masses, where the signal is fed "up" from the input of the TST ISC filter banks through the PUM/UIM/TOP locking filters banks (I annotated this screenshot of the ITM suspension medm for visualization). No pitch or yaw actuation is sent to the TST or UIM stages at Hanford. The ASC drive to the pum is filtered through some notches/bandstops for various suspension modes. The ASC drive to the TOP acquires all of these notches and bandstops and an additional integrator and low pass filter, meaning that the top mass actuates in angle at very low frequency only (sub 0.5 Hz).
Taking this all into account involves a lot of work, so to just get something off the ground, I am only thinking about ASC drive to the PUM in this post. With a little more time, I can incorporate the drive to the top mass stage as well. Thinking only about the PUM makes this a "simple" problem:
I have done just this to achieve the four plots I have attached to this alog. These plots show the ITM and ETM test mass motion in rad/rtHz from each degree of freedom and the overall radian RMS value. That is, each trace is showing you exactly how much radians of motion each ASC degree of freedom is sending to the test mass through the PUM drive. The drive matrix value is the same in magnitude for each ITM and each ETM, meaning that the "ITM" plot is true for both ITMX and ITMY (the drives might differ by an overall sign though).
Since I am just looking at the PUM, I also didn't include the drive notches. Once I add in the top mass drive, I will make sure I capture the various drive filters properly.
Some commentary: These plots make it very evident how different the drive is from each ASC degree of freedom. This is confusing because in principle we know that the "HARD" and "SOFT" plants are the same for common and differential, and could use the same control design. However, we know that the sensor noise at the REFL WFS, which controls CHARD, is different than the sensor noise at the AS WFS that control DHARD, so even with exact same controller, we would see different overall drives. We also know that we don't use the same control design for each DOF, due to the sensor noise limitations and also the randomness of commissioning that has us updating each ASC controller at different times for different reasons. For example, the soft loops both run on the TMS QPDs, but still have different drive levels.
Some action items: besides continuing the process of getting all the drives from all stages properly calibrated, we can start thinking again about our ASC design and how to improve it. I think two standout items are the SOFT P and CHARD Y noise above 10 Hz on these plots. Also, the fact that the overall RMS from each loop varies is something that warrants more investigation. I think this is probably related to the differing control designs, sensor noise, and noise from things like HAM1 motion or PR3 bosems. So, one thing I can do is project the PR3 damping noise that we think dominates the REFL WFS RMS into test mass motion.
I have just realized I mixed up the DACs and ADCs (again) and the correct count-to-torque calibration should be:
So these plots are wrong by a factor of 2. I will correct this in my code and post the corrected plots shortly.
The attached plots are corrected by the erroneous factor of two mentioned above, which has an overall effect of reducing the motion by 2.
Ansel reported that a peak in DARM that interfered with the sensitivity of the Crab pulsar followed a similar time frequency path as a peak in the beam splitter microphone signal. I found that this was also the case on a shorter time scale and took advantage of the long down times last weekend to use a movable microphone to find the source of the peak. Microphone signals don’t usually show coherence with DARM even when they are causing noise, probably because the coherence length of the sound is smaller than the spacing between the coupling sites and the microphones, hence the importance of precise time-frequency paths.
Figure 1 shows DARM and the problematic peak in microphone signals. The second page of Figure 1 shows the portable microphone signal at a location by the staging building and a location near the TCS chillers. I used accelerometers to confirm the microphone identification of the TCS chillers, and to distinguish between the two chillers (Figure 2).
I was surprised that the acoustic signal was so strong that I could see it at the staging building - when I found the signal outside, I assumed it was coming from some external HVAC component and spent quite a bit of time searching outside. I think that this may be because the suspended mezzanine (see photos on second page of Figure 2) acts as a sort of soundboard, helping couple the chiller vibrations to the air.
Any direct vibrational coupling can be solved by vibrationally isolating the chillers. This may even help with acoustic coupling if the soundboard theory is correct. We might try this first. However, the safest solution is to either try to change the load to move the peaks to a different frequency, or put the chillers on vibration isolation in the hallway of the cinder-block HVAC housing so that the stiff room blocks the low-frequency sound.
Reducing the coupling is another mitigation route. Vibrational coupling has apparently increased, so I think we should check jitter coupling at the DCPDs in case recent damage has made them more sensitive to beam spot position.
For next generation detectors, it might be a good idea to make the mechanical room of cinder blocks or equivalent to reduce acoustic coupling of the low frequency sources.
This afternoon TJ and I placed pieces of damping and elastic foam under the wheels of both CO2X and CO2Y TCS chillers. We placed thicker foam under CO2Y but this did make the chiller wobbly so we placed thinner foam under CO2X.
Unfortunately, I'm not seeing any improvement of the Crab contamination in the strain spectra this week, following the foam insertion. Attached are ASD zoom-ins (daily and cumulative) from Nov 24, 25, 26 and 27.
This morning at 17:00UTC we turned the CO2X and CO2Y TCS chiller off and then on again, hoping this might change the frequency they are injecting into DARM. We do not expect it to effect it much we had the chillers off for a ling period 25th October 80882 when we flushed the chiller line and the issue was seen before this date.
Opened FRS 32812.
There were no expilcit changes to the TCS chillers bettween O4a and O4b although we swapped a chiller for a spare chiller in October 2023 73704.
Between 19:11 and 19:21 UTC, Robert and I swapped the foam from under CO2Y chiller (it was flattened and not providing any damping now) to new, thicker foam and 4 layers of rubber. Photo's attached.
Thanks for the interventions, but I'm still not seeing improvement in the Crab region. Attached are daily snapshots from UTC Monday to Friday (Dec 2-6).
I changed the flow of the TCSY chiller from 4.0gpm to 3.7gpm.
These Thermoflex1400 chillers have their flow rate adjusted by opening or closing a 3 way valve at the back of the chiller. for both X and Y chillers, these have been in the full open position, with the lever pointed straight up. The Y chiller has been running with 4.0gpm, so our only change was a lower flow rate. The X chiller has been at 3.7gpm already, and the manual states that these chillers shouldn't be ran below 3.8gpm. Though this was a small note in the manual and could be easily missed. Since the flow couldn't be increased via the 3 way valve on back, I didn't want to lower it further and left it as is.
Two questions came from this:
The flow rate has been consistent for the last year+, so I don't suspect that the pumps are getting worn out. As far back as I can trend they have been around 4.0 and 3.7, with some brief periods above or below.
Thanks for the latest intervention. It does appear to have shifted the frequency up just enough to clear the Crab band. Can it be nudged any farther, to reduce spectral leakage into the Crab? Attached are sample spectra from before the intervention (Dec 7 and 10) and afterward (Dec 11 and 12). Spectra from Dec 8-9 are too noisy to be helpful here.
TJ touched the CO2 flow on Dec 12th around 19:45UTC 81791 so the flowrate further reduced to 3.55 GPM. Plot attached.
The flow of the TCSY chiller was further reduced to 3.3gpm. This should push the chiller peak lower in frequency and further away from the crab nebula.
The further reduced flow rate seems to have given the Crab band more isolation from nearby peaks, although I'm not sure I understand the improvement in detail. Attached is a spectrum from yesterday's data in the usual form. Since the zoomed-in plots suggest (unexpectedly) that lowering flow rate moves an offending peak up in frequency, I tried broadening the band and looking at data from December 7 (before 1st flow reduction), December 16 (before most recent flow reduction) and December 18 (after most recent flow reduction). If I look at one of the accelerometer channels Robert highlighted, I do see a large peak indeed move to lower frequencies, as expected. Attachments: 1) Usual daily h(t) spectral zoom near Crab band - December 18 2) Zoom-out for December 7, 16 and 18 overlain 3) Zoom-out for December 7, 16 and 18 overlain but with vertical offsets 4) Accelerometer spectrum for December 7 (sample starting at 18:00 UTC) 5) Accelerometer spectrum for December 16 6) Accelerometer spectrum for December 18