TITLE: 05/22 Day Shift: 1430-2330 UTC (0730-1630 PST), all times posted in UTC
STATE of H1: Observing at 153Mpc
INCOMING OPERATOR: Ryan S
SHIFT SUMMARY: 3 locklosses today, relocking was straightforward, we've been locked for ~4 hours.
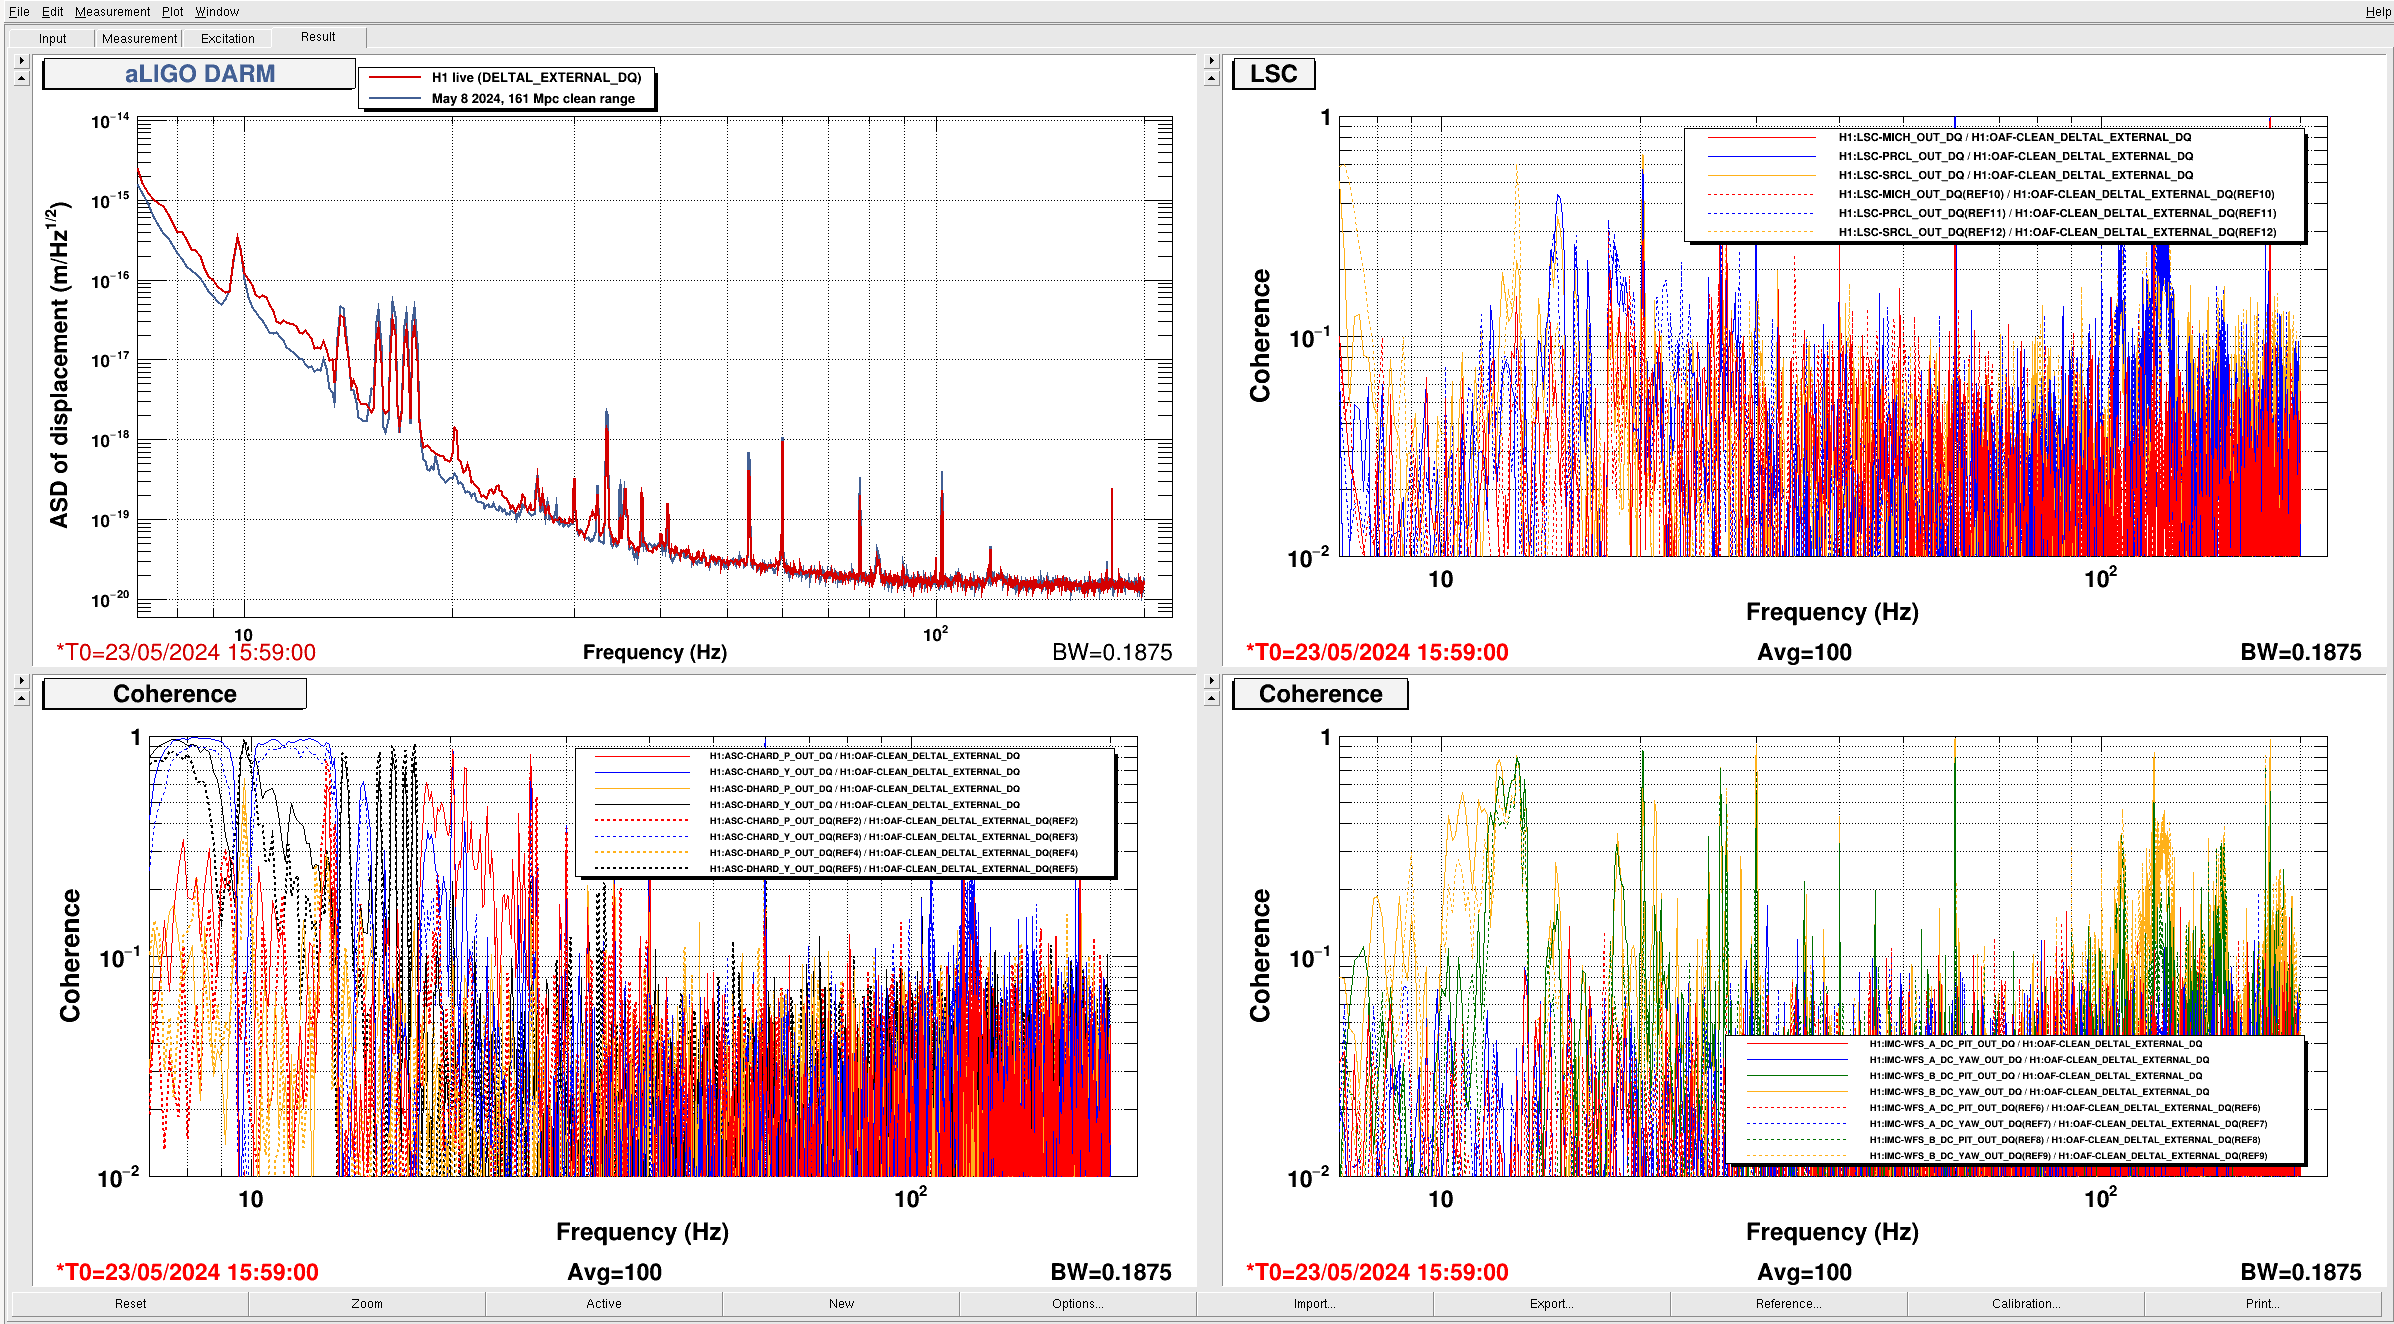
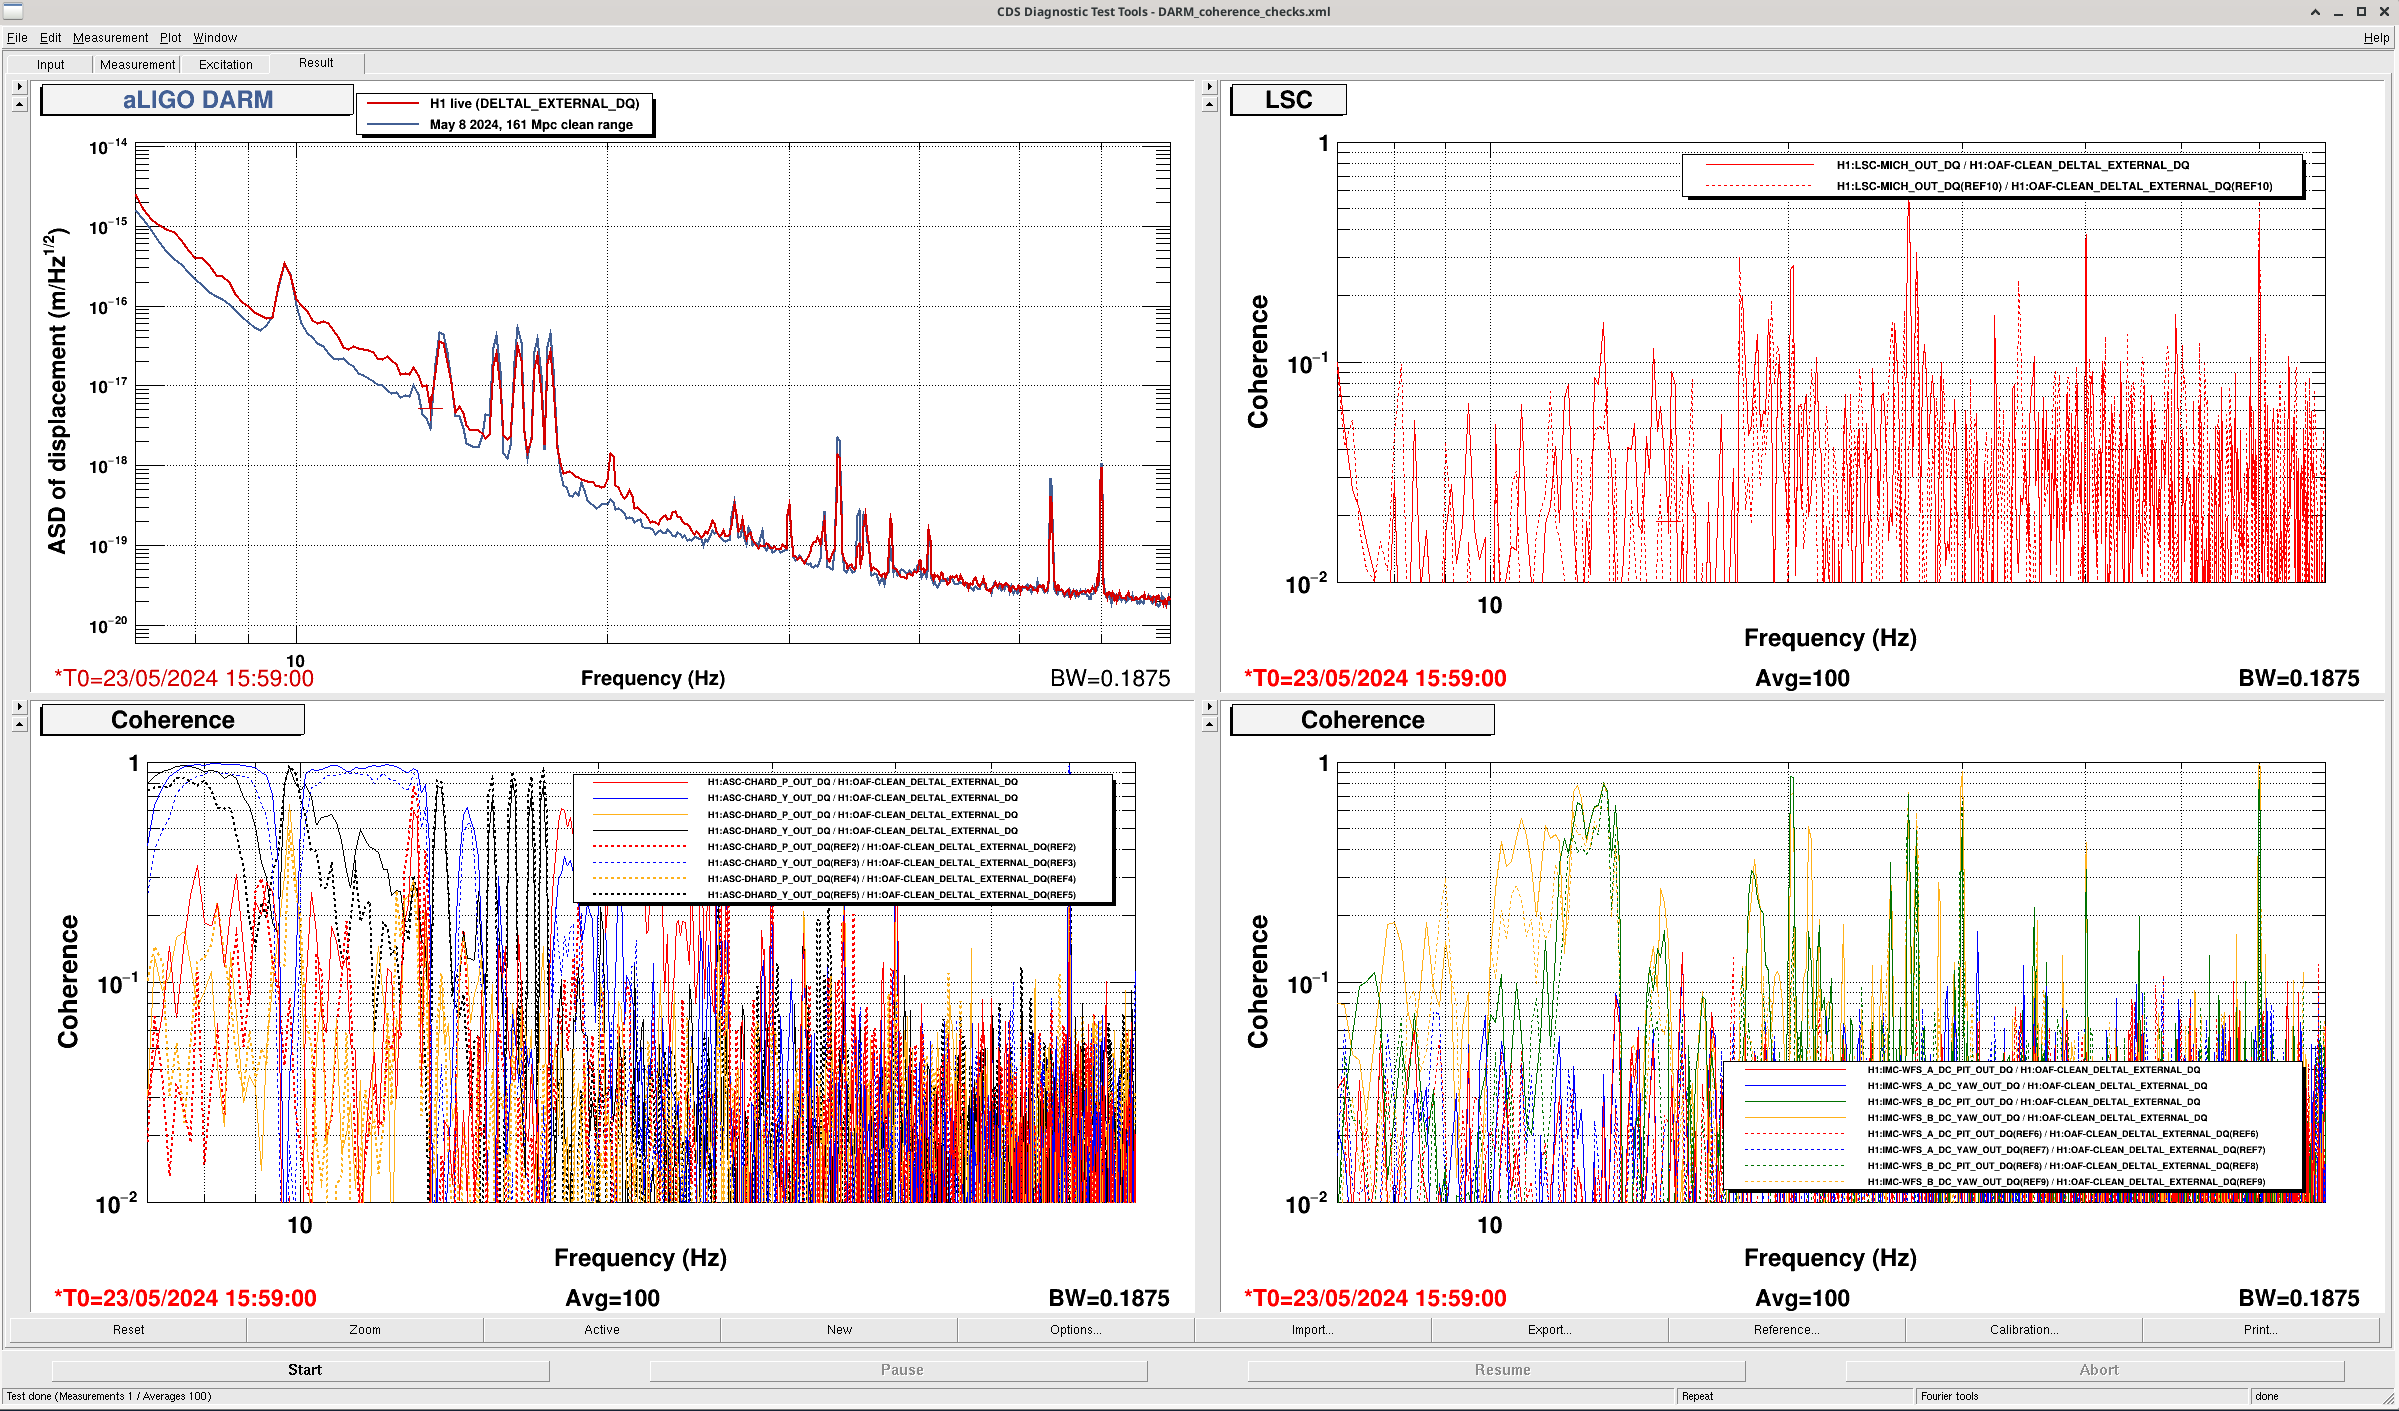
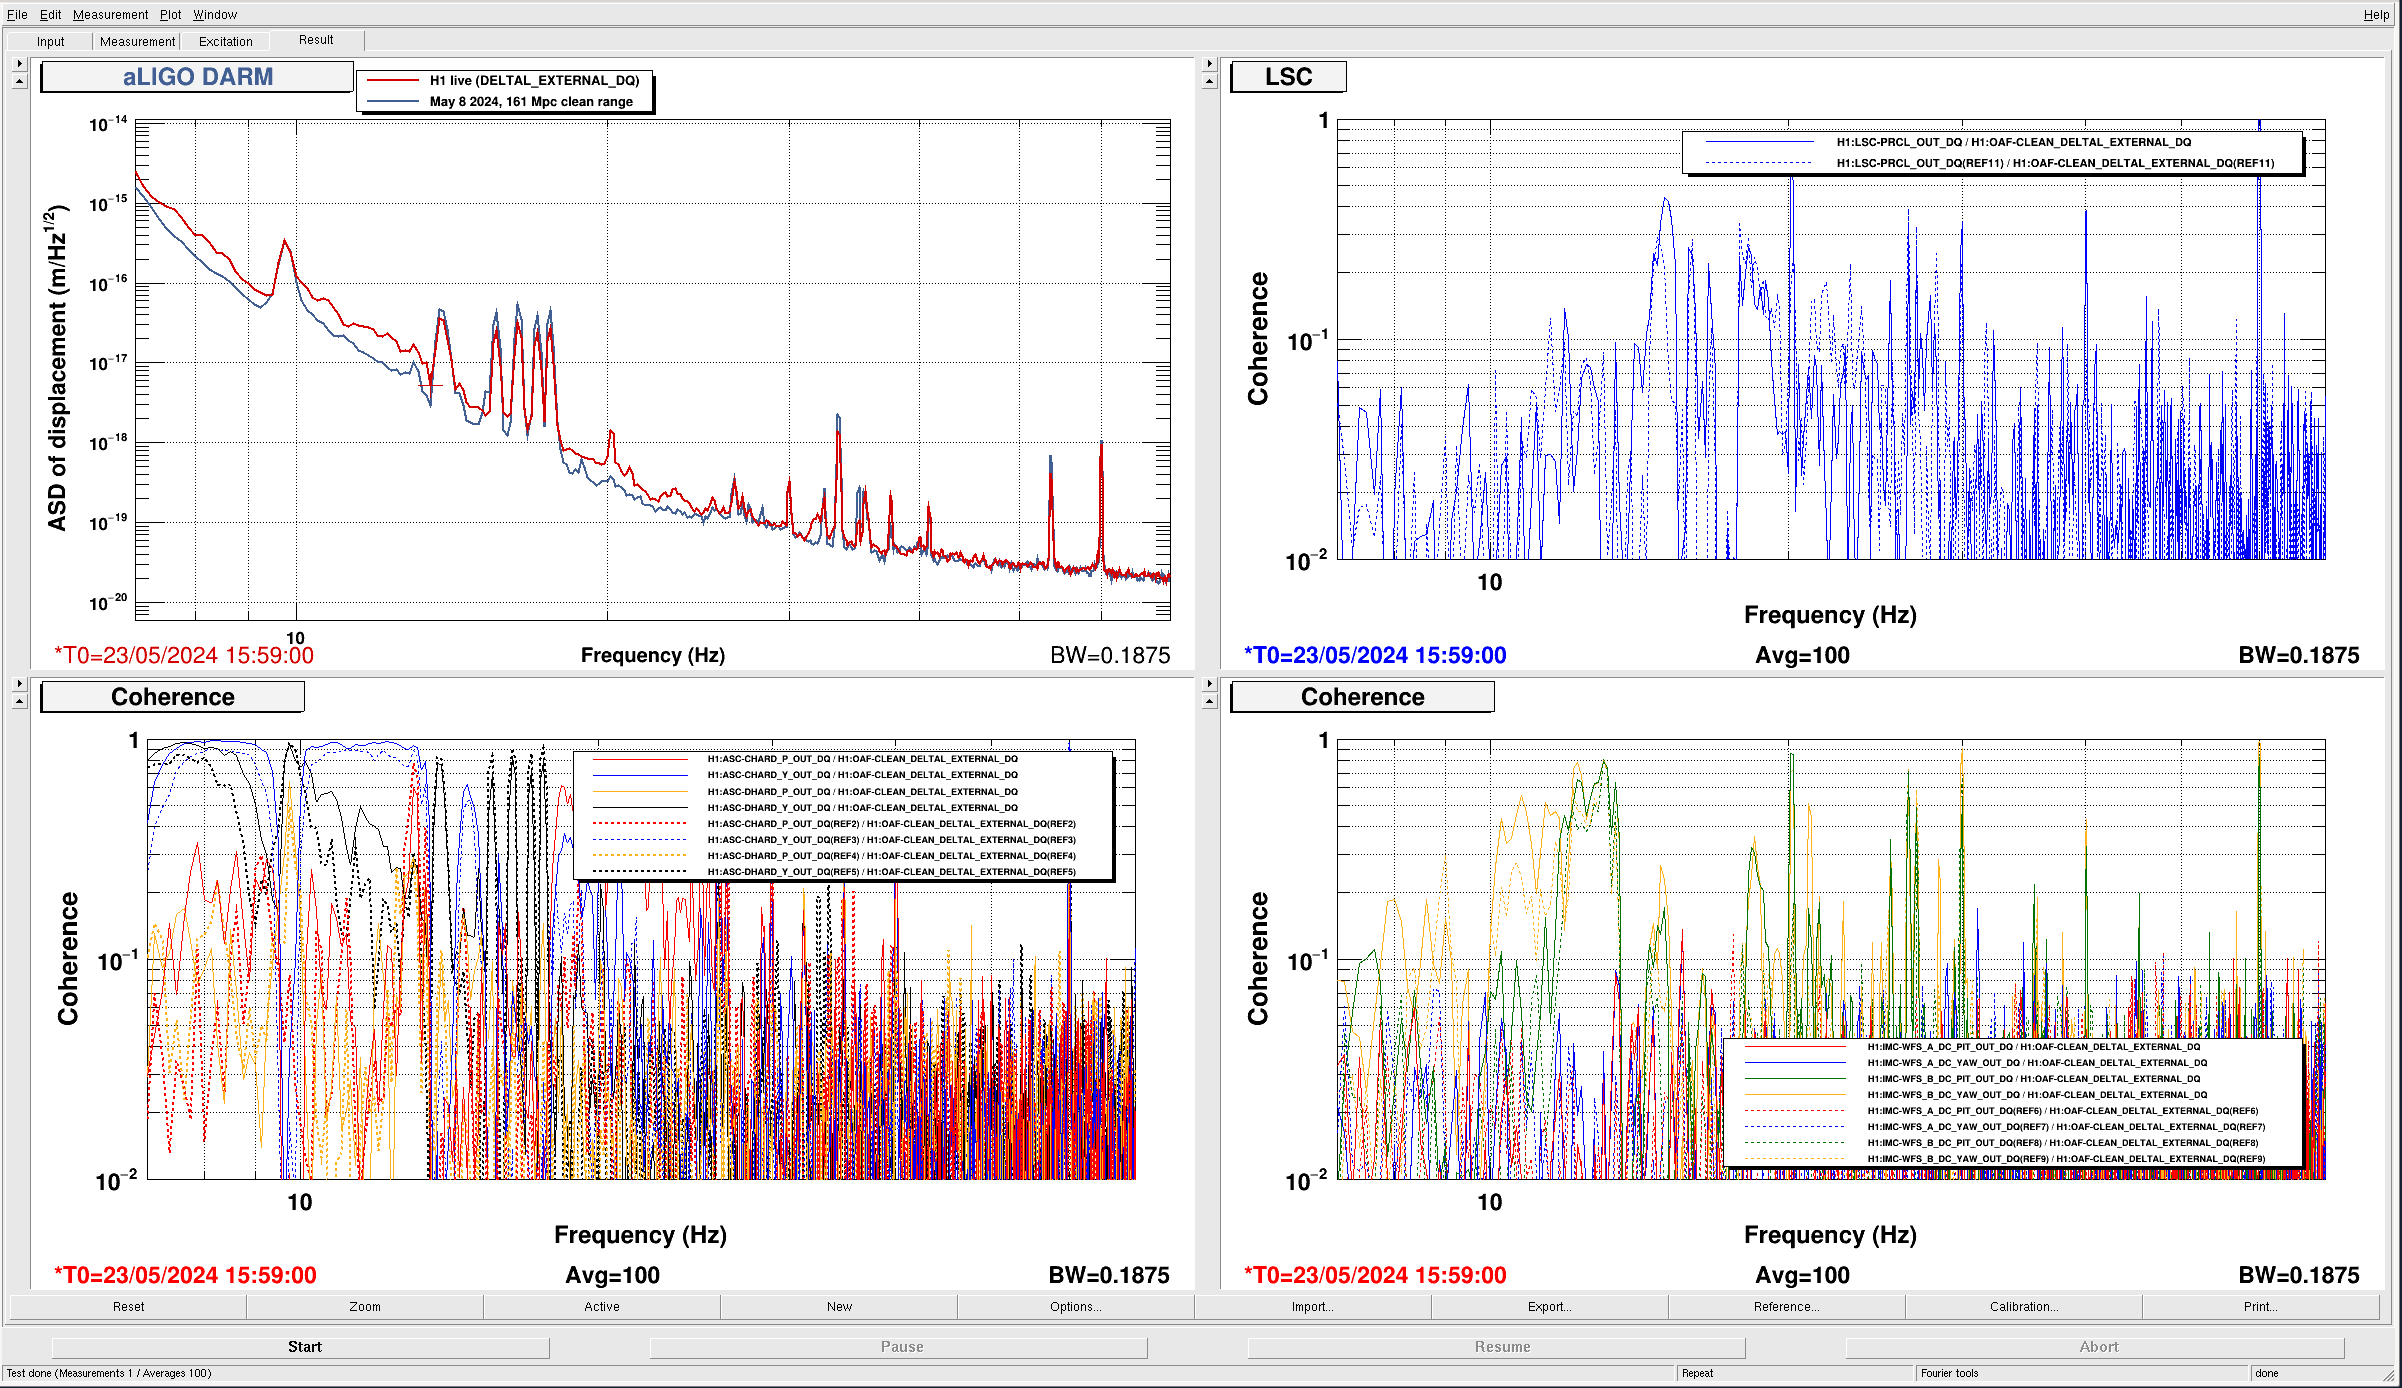
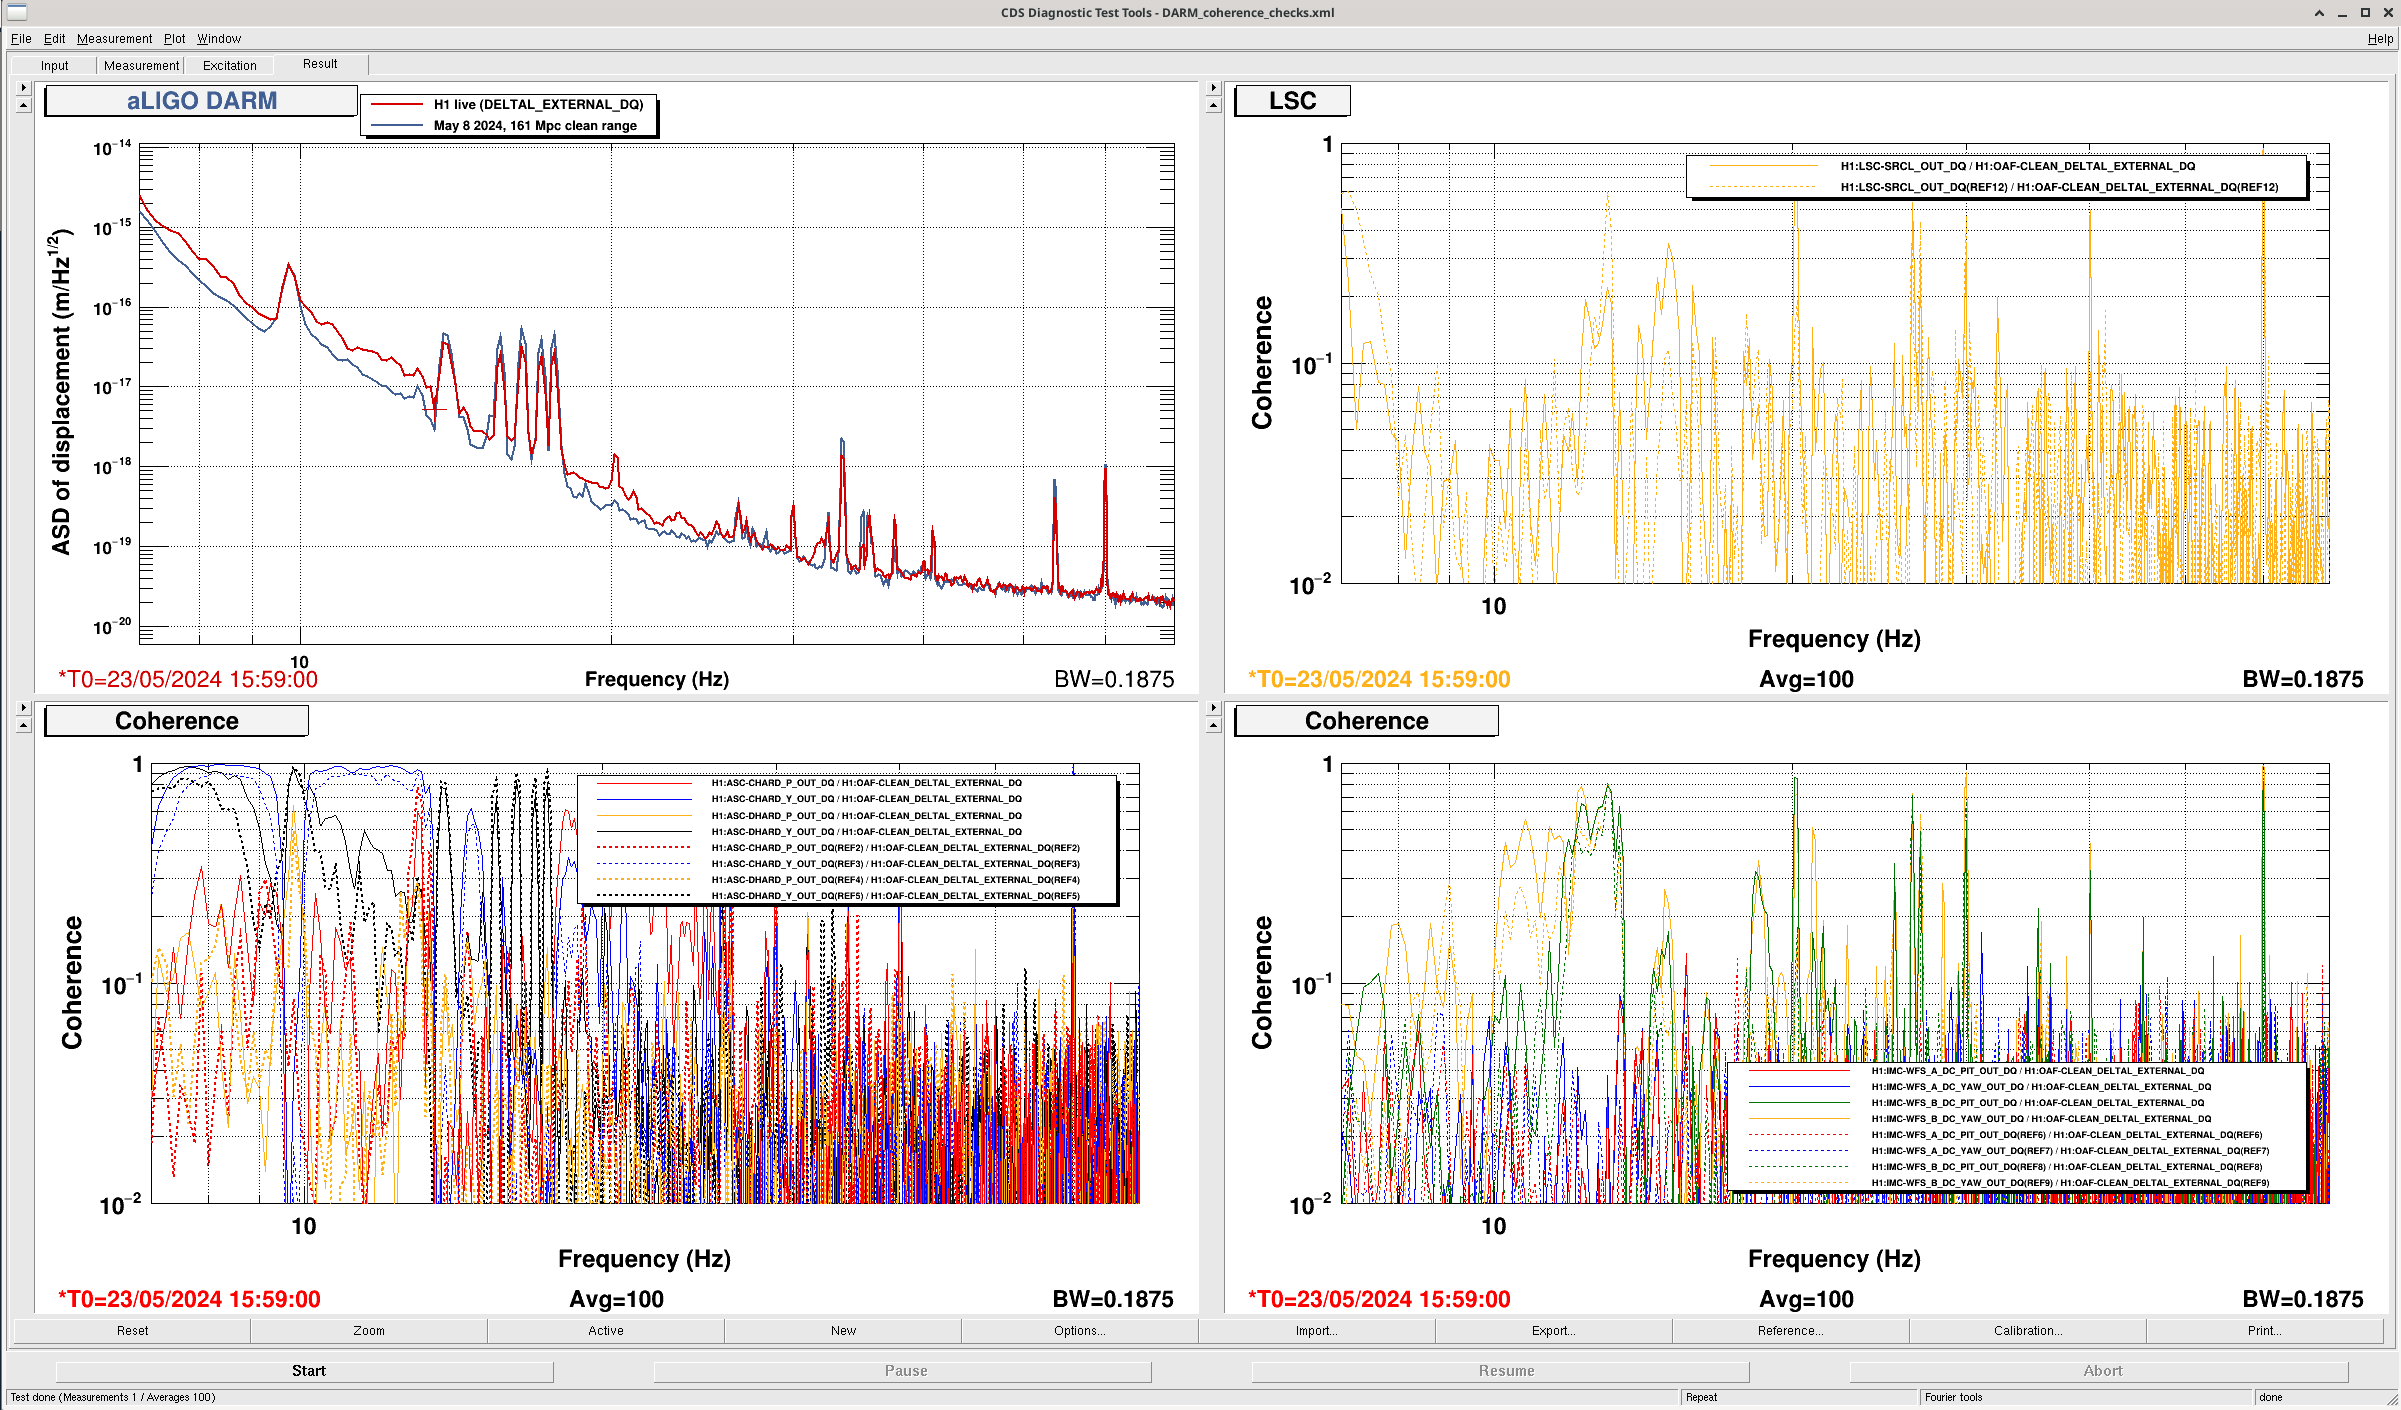
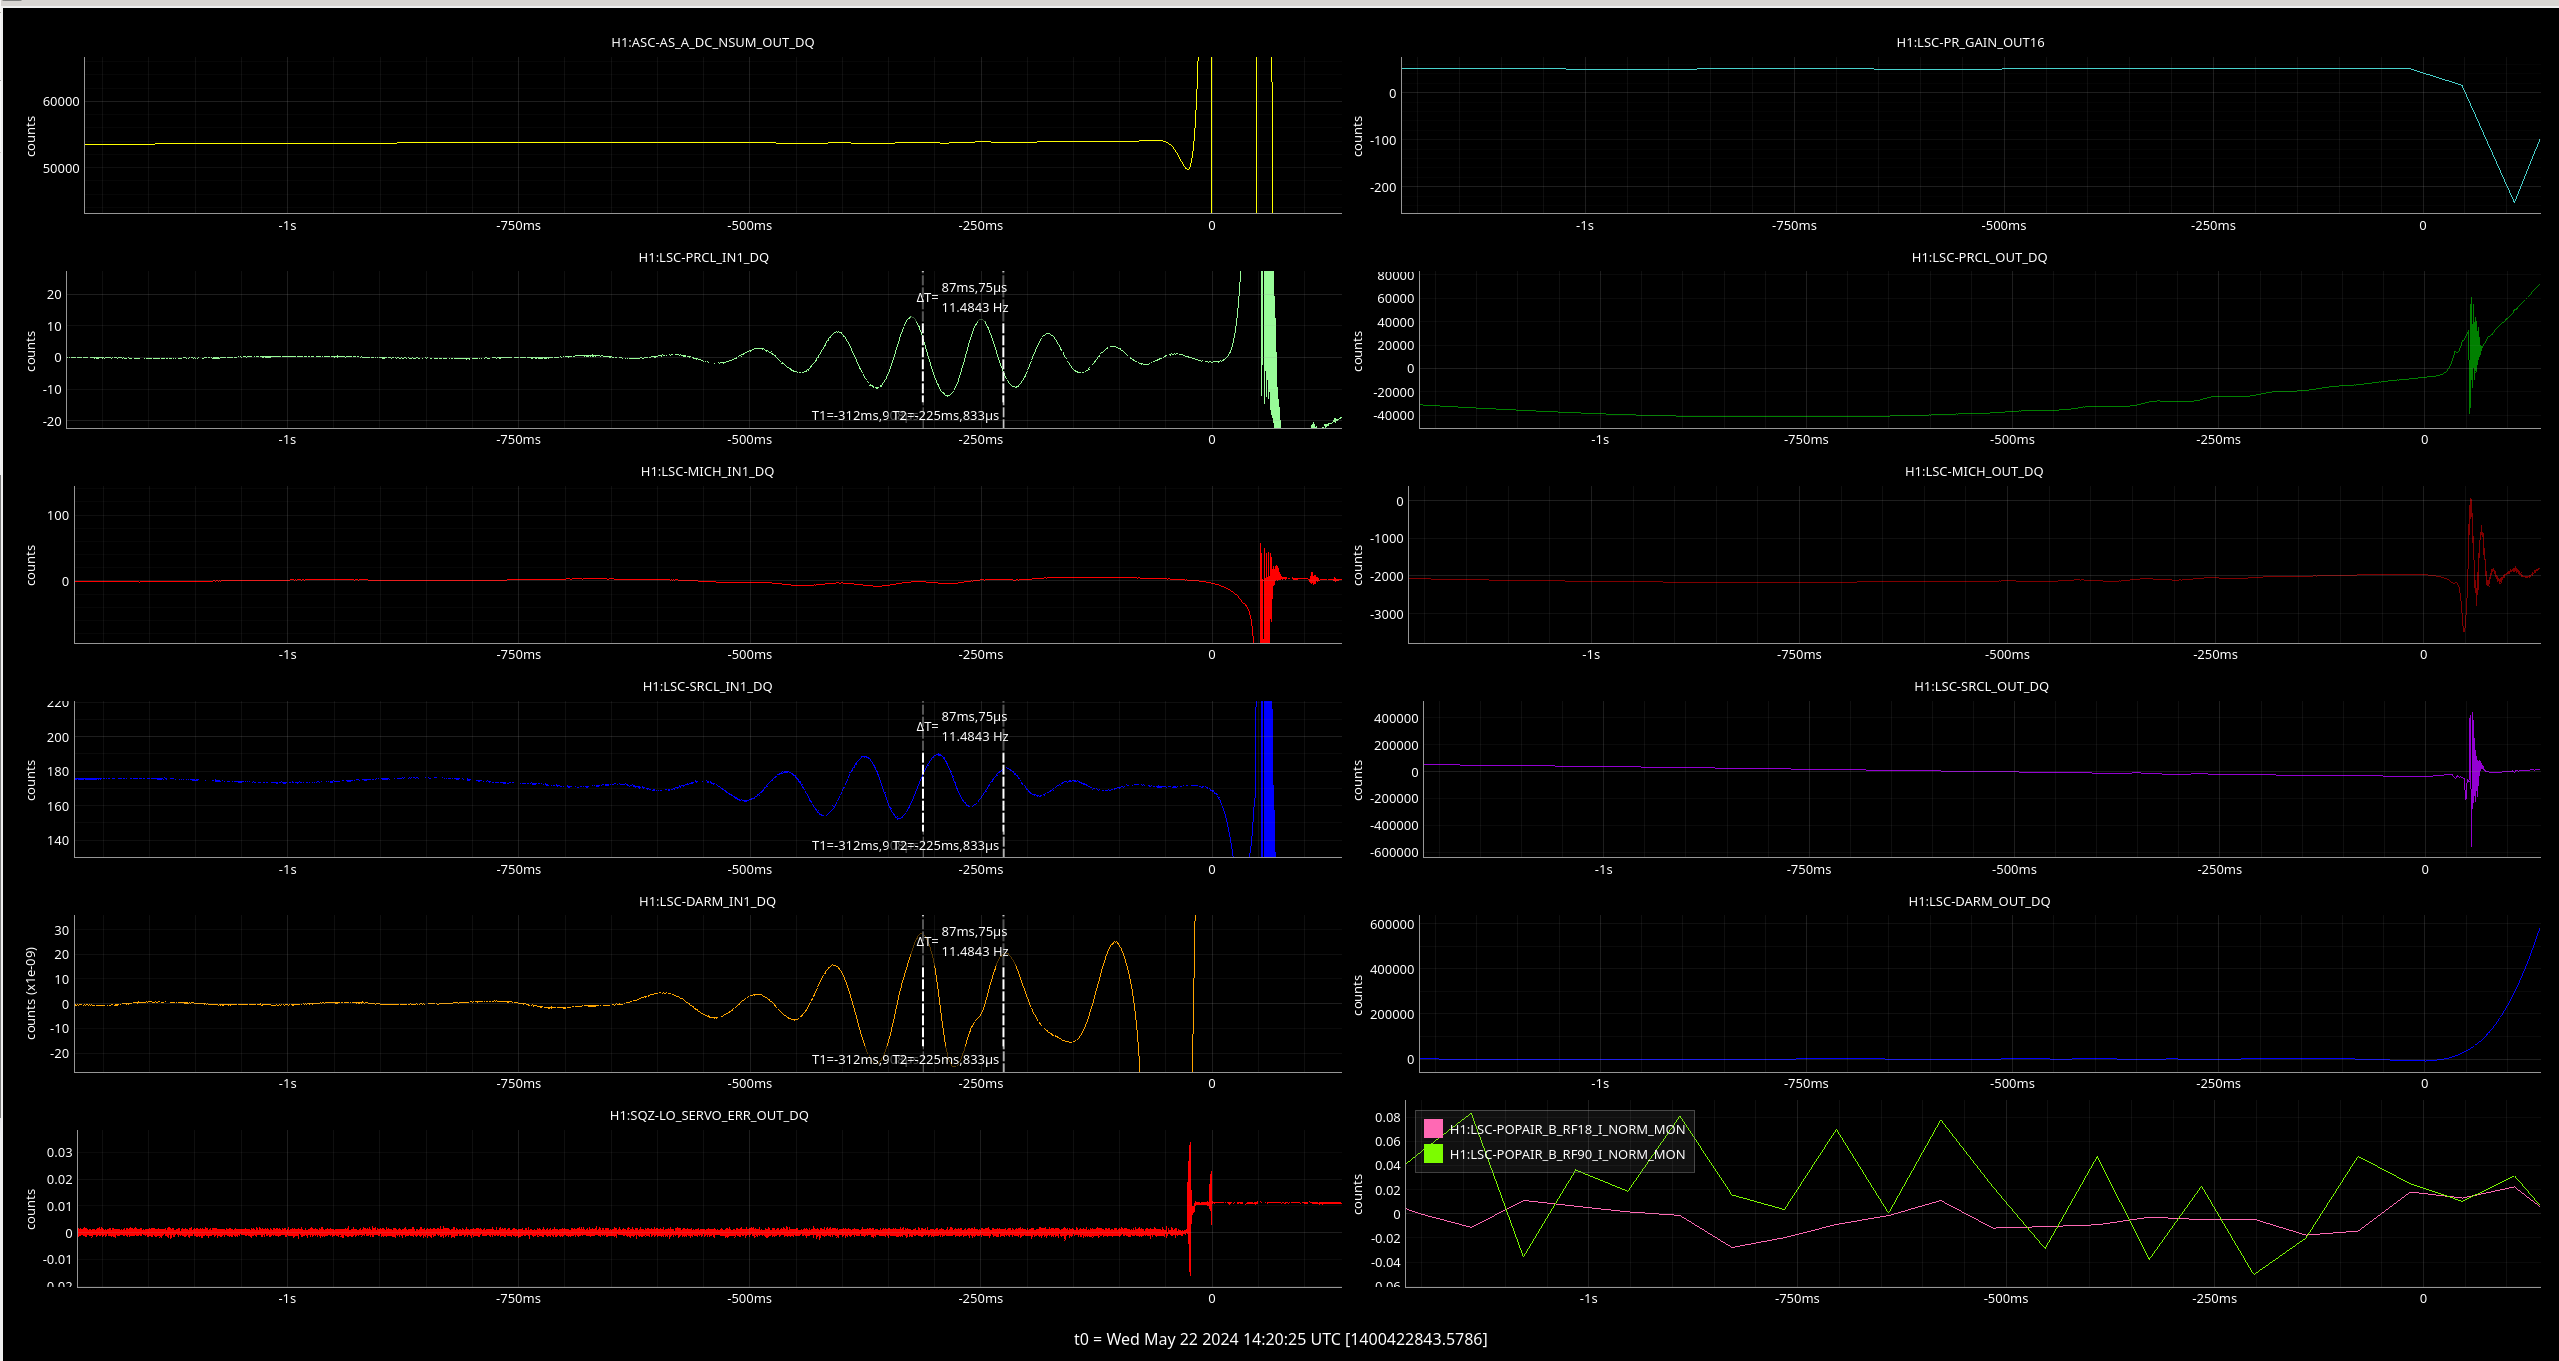
14:20 UTC lockloss, there was a ~13 Hz oscillation in SRCL, PRCL, and DARM
16:02 UTC back to Observing after some SQZer aligning
16:16 UTC lockloss, similar as earlier, ~13 Hz oscillation right before LL
Sheila removed a DARM filter alog77983
17:20 UTC back to Observing
18:37 UTC lockloss
The alignment seems to be degrading after each LL, DRMI/PRMI flashes are worse each time. I had to move PRM 15 microradians in pitch to help PRMI seeing AS AIR camera clearly pitched. On to DRMI AS AIR looks yawed now but the flashes are much better post ASC
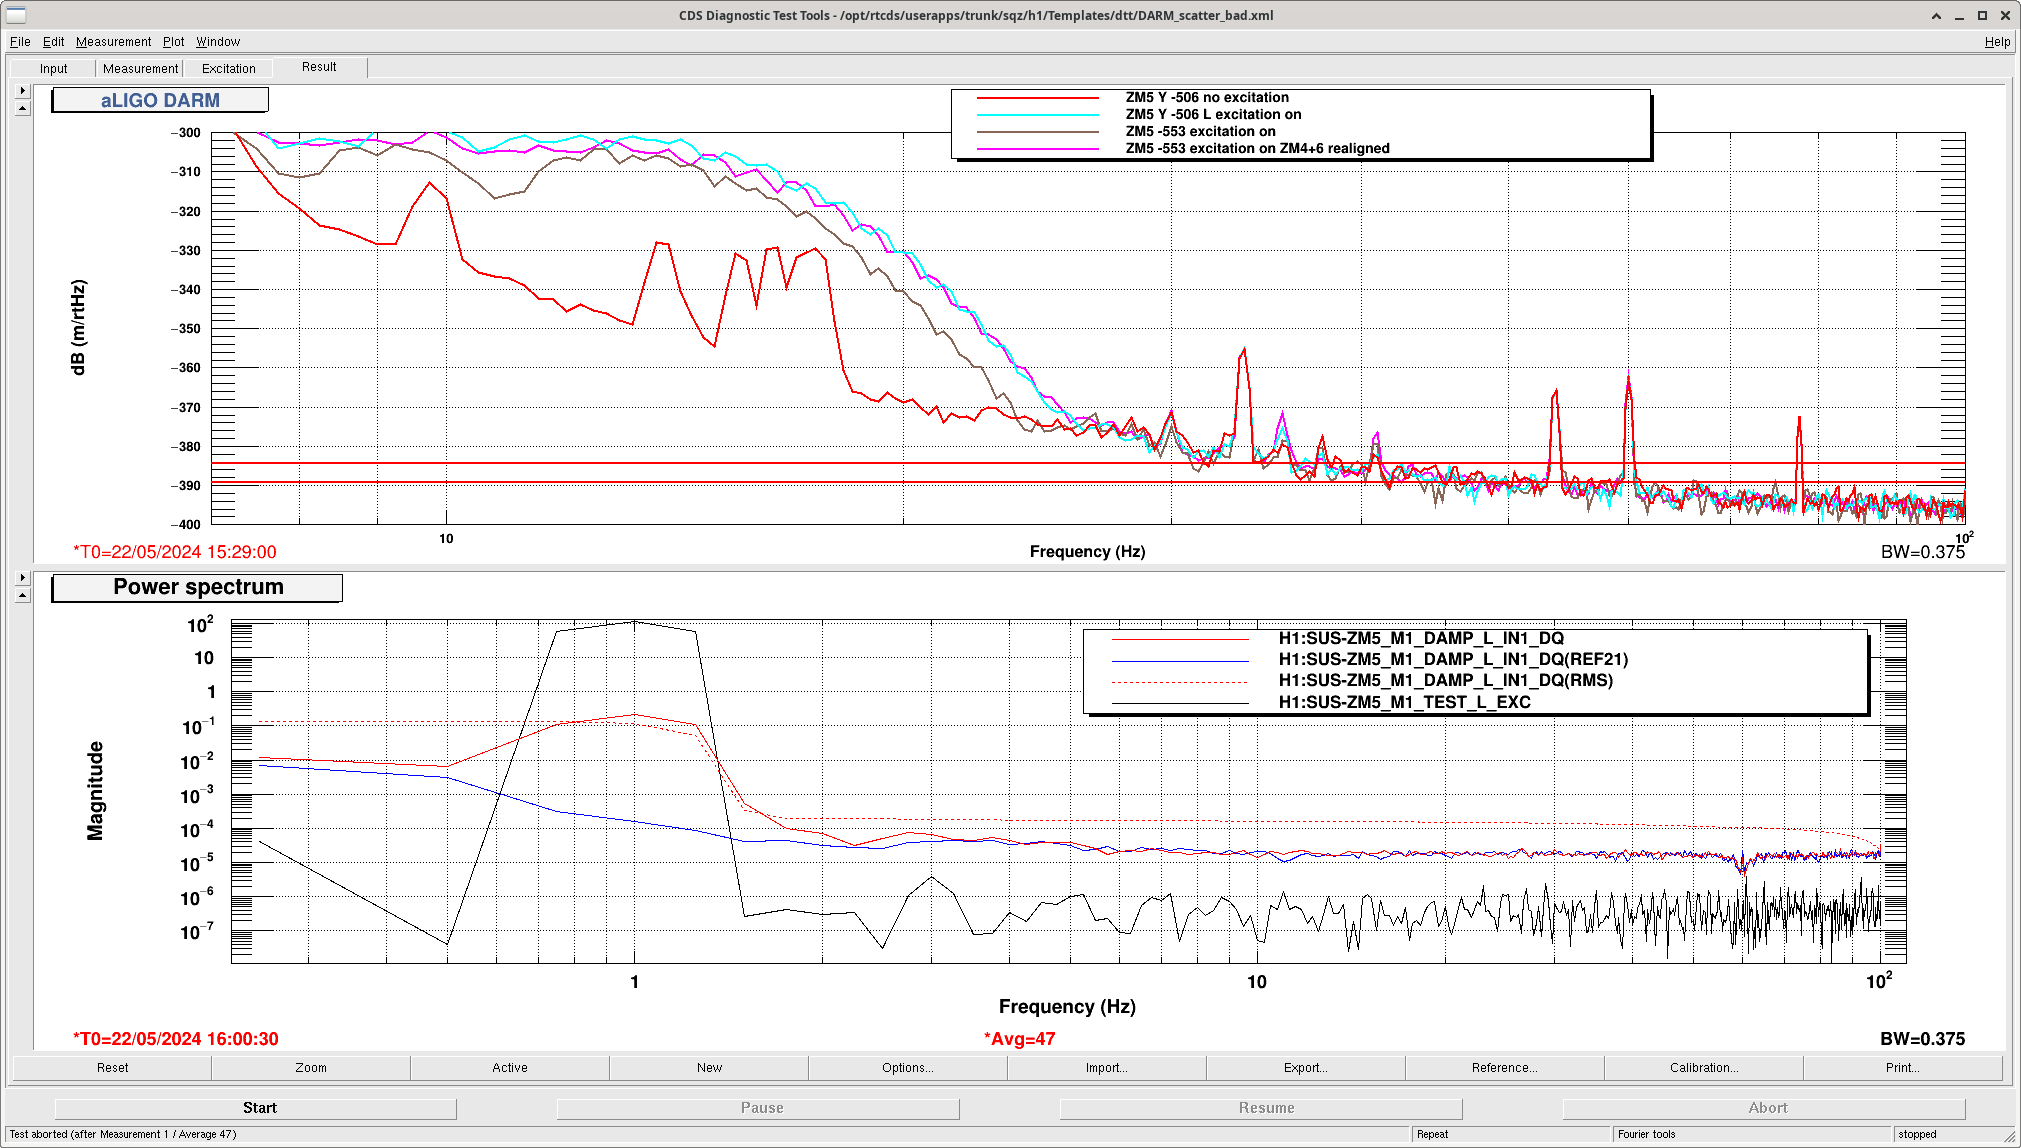
Sheila measured the PR2 spot once we got close to NLN alog77988
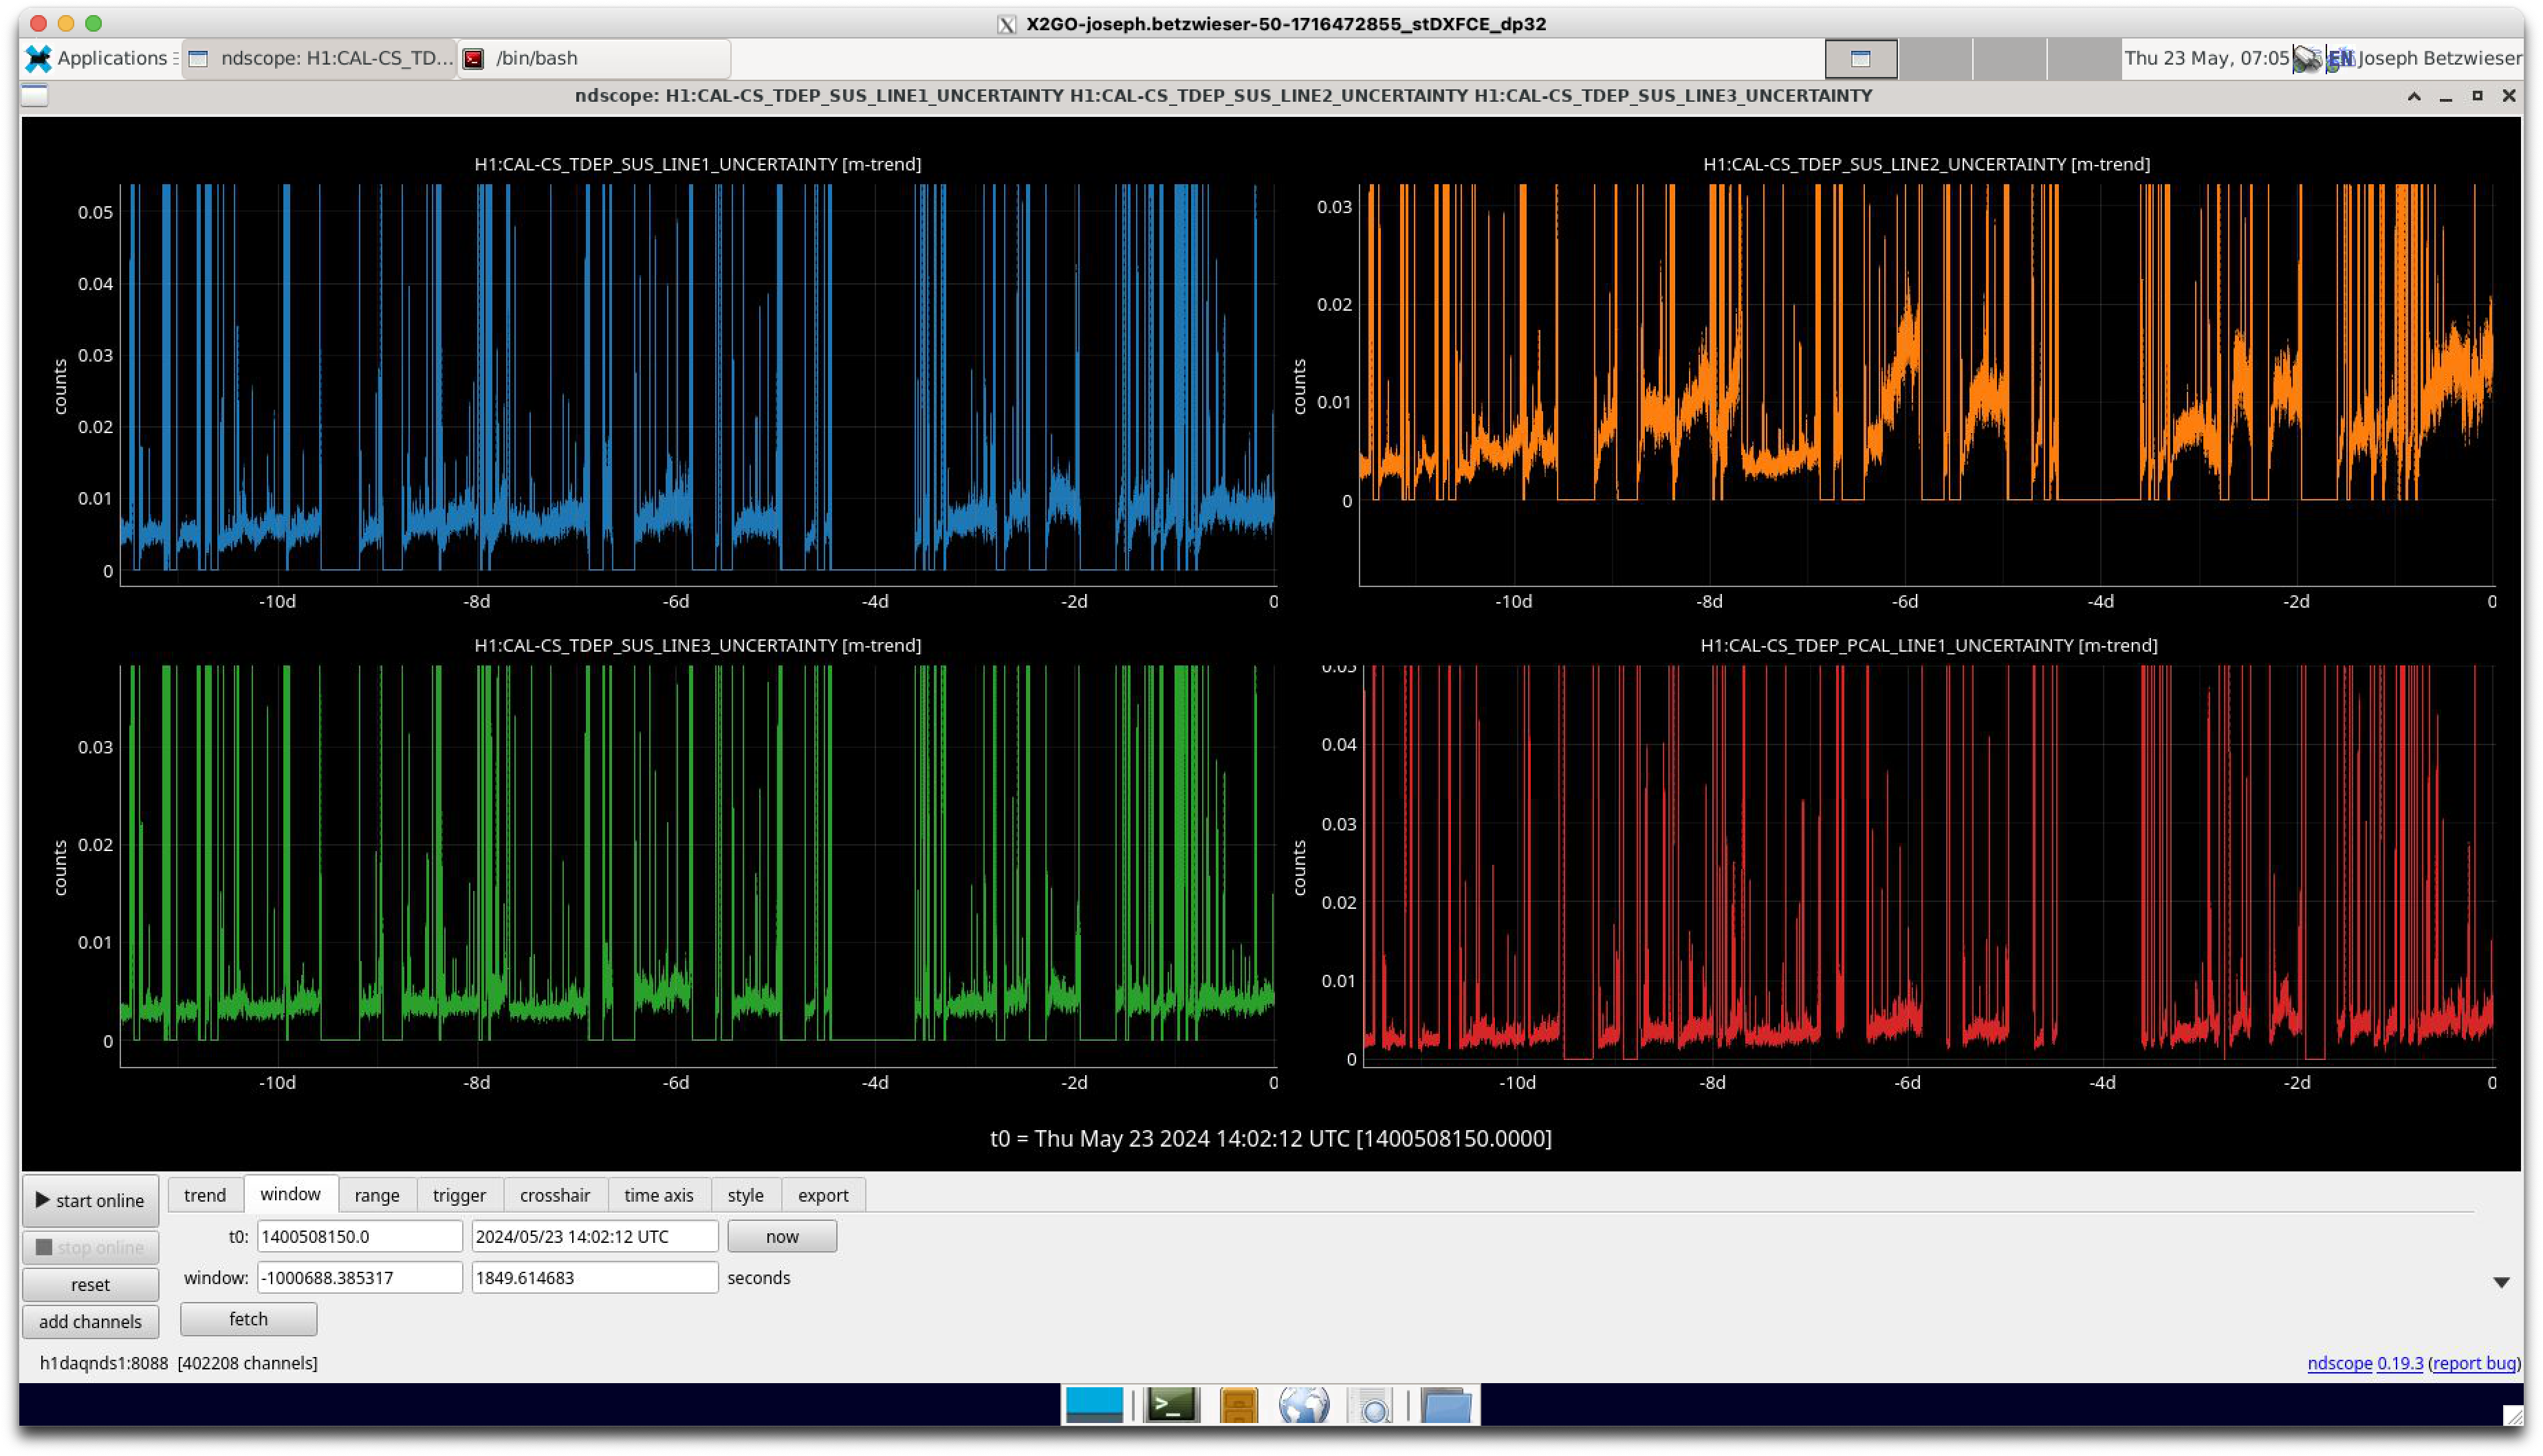
22:19 I saw a DIAG_MAIN message "PMC PZT volts high" and shortly after the SQZer lost lock and dropped us out of Observing
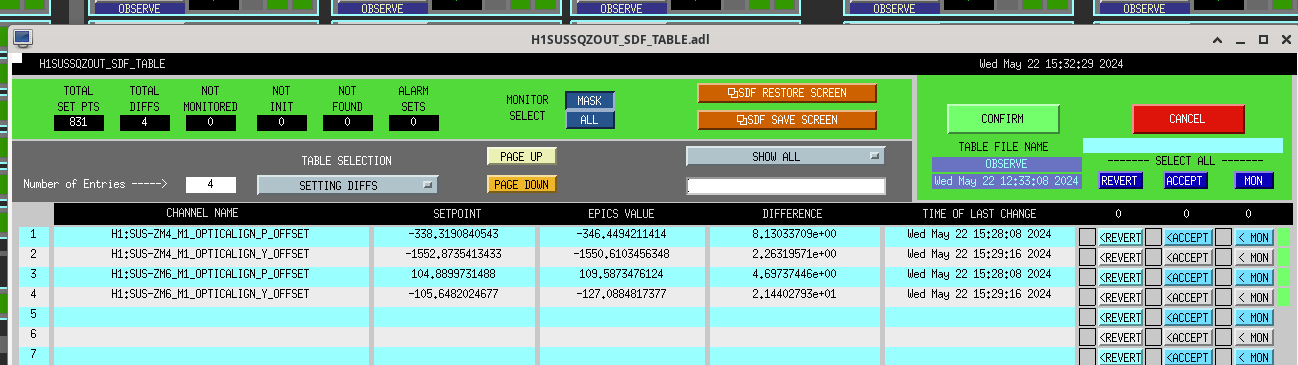
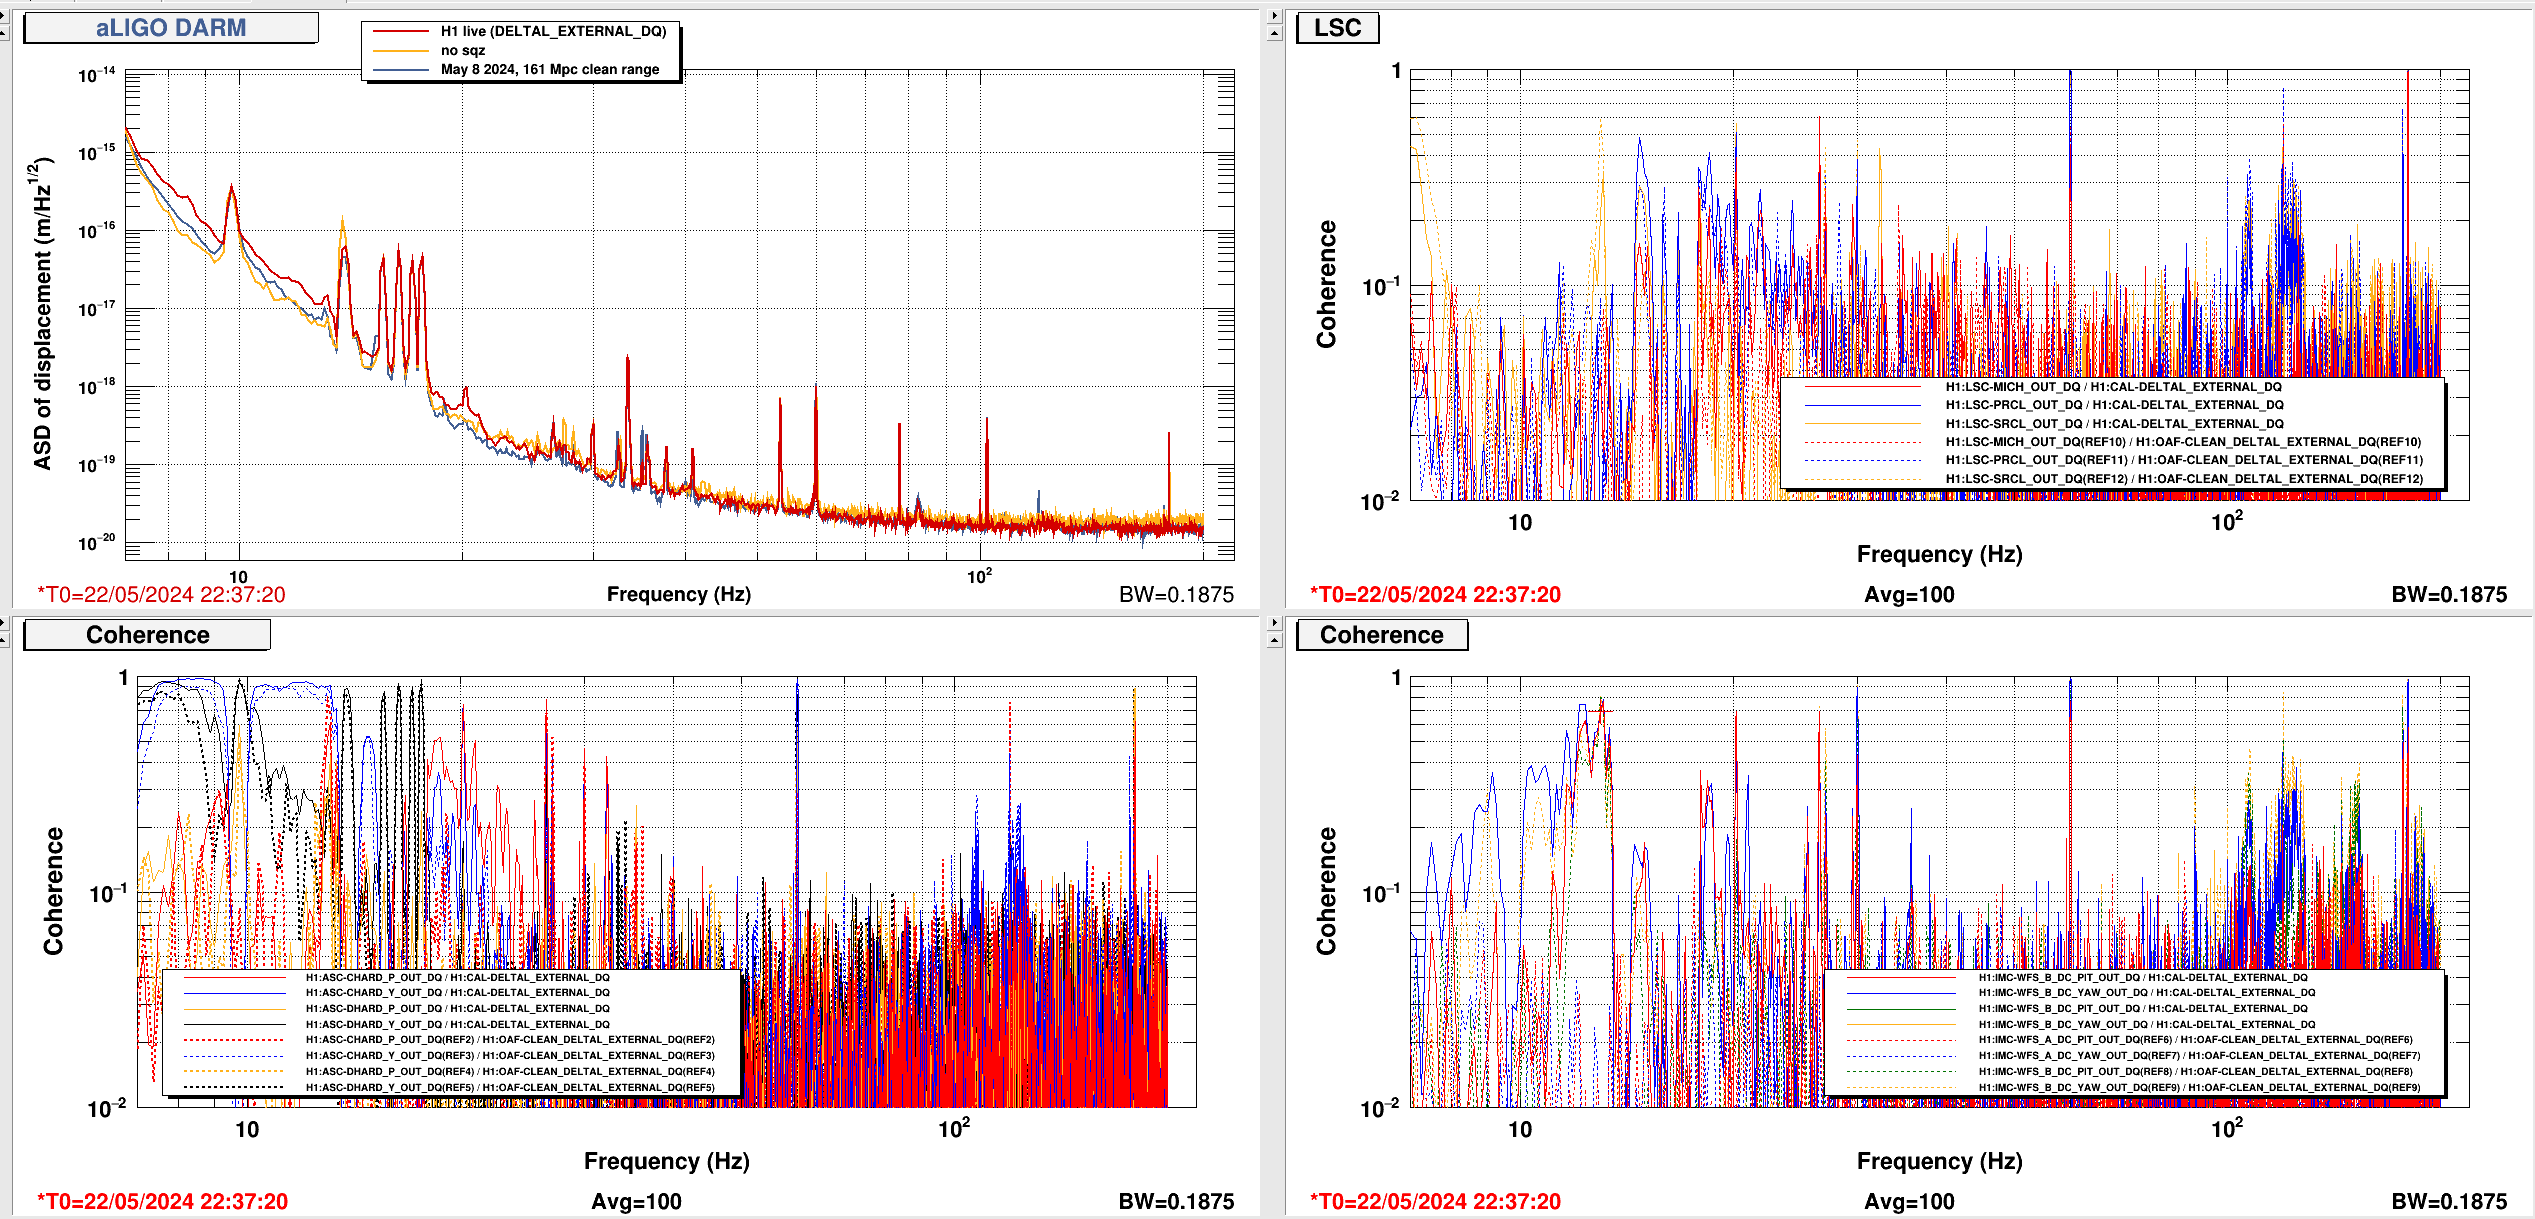
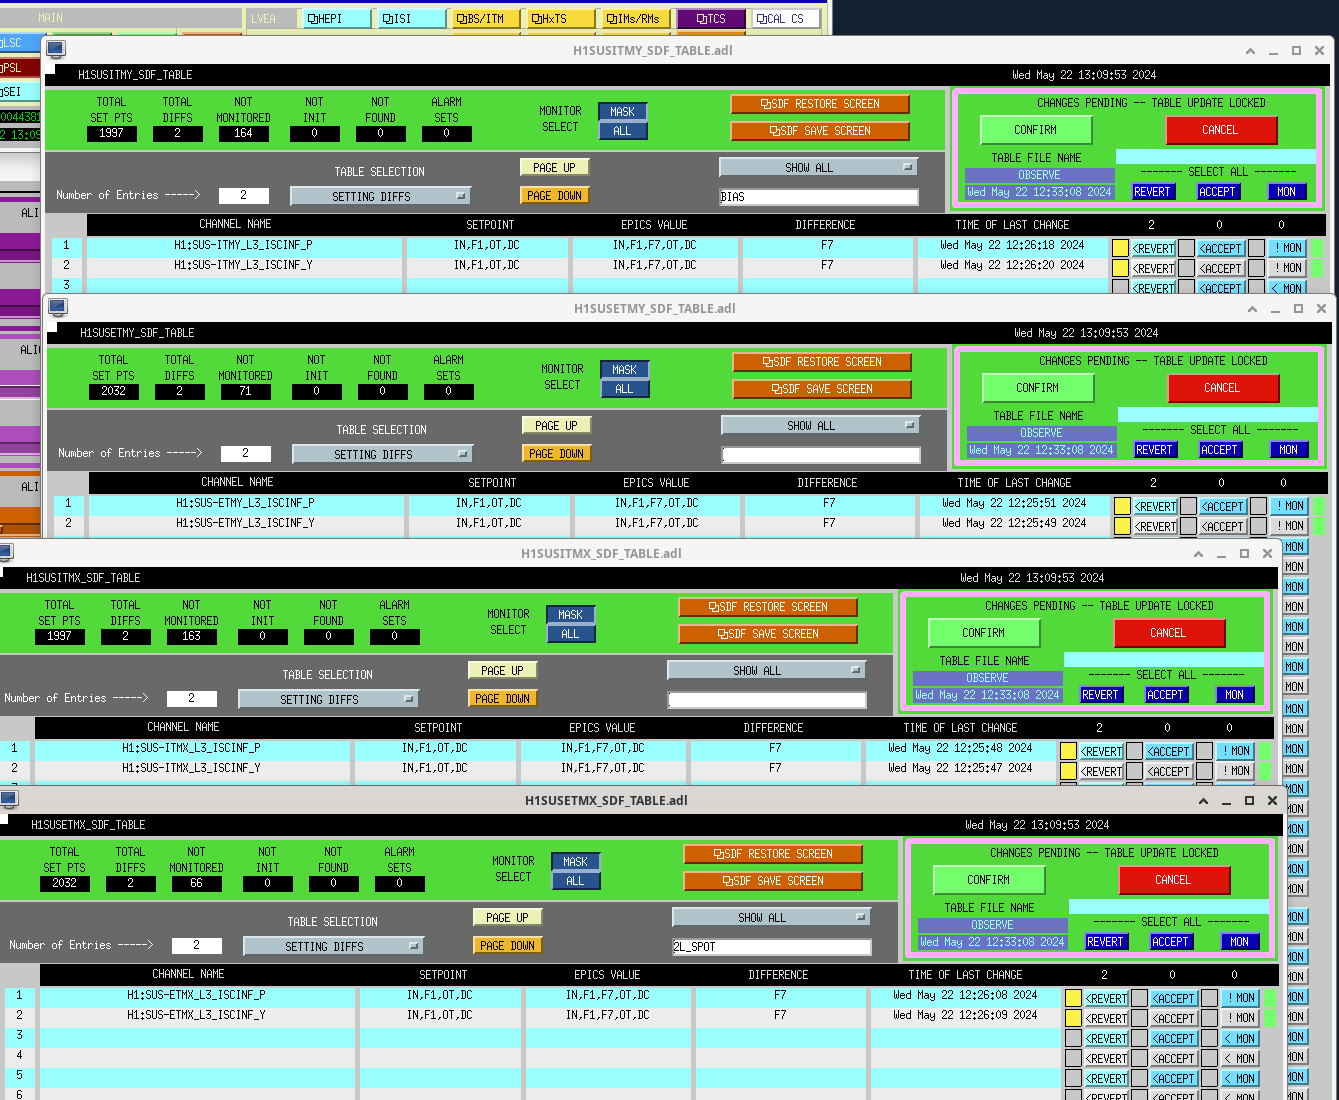
I ran an alignment and angle scan to optimize squeezing after it relocked itself (SDF diffs) since we were already out of observing and I was just thinking that SQZing wasn't looking great at high frequency, the trace on nuc33 didn't look much different after finishing and DARMs noise still looks elevated at high and low frequencies but the range seems to have increased by a few Mpcs.
22:32 UTC back to Observing
LOG:
| Start Time |
System |
Name |
Location |
Lazer_Haz |
Task |
Time End |
| 15:18 |
FAC |
Karen |
Optics & VPW |
N |
Tech clean |
15:48 |
| 18:05 |
FAC |
Karen |
Woodshop/Firepump |
N |
Tech clean |
18:19 |