TITLE: 05/18 Day Shift: 1430-2330 UTC (0730-1630 PST), all times posted in UTC
STATE of H1: Observing at 152Mpc
INCOMING OPERATOR: Tony
SHIFT SUMMARY: Lost lock at the end of the shift, DRMI alignment issues and PRMI was plagued by a ~20Hz buzz that kept killing it after 2 seconds, the mode cleaner was slow to lock in each attempt today. After the 3rd IA DRMI was finally in the mood to lock and I didn't have to go through PRMI and I returned to Observing at 21:15UTC. I was not able to take the calibration measurement this afternoon as planned.
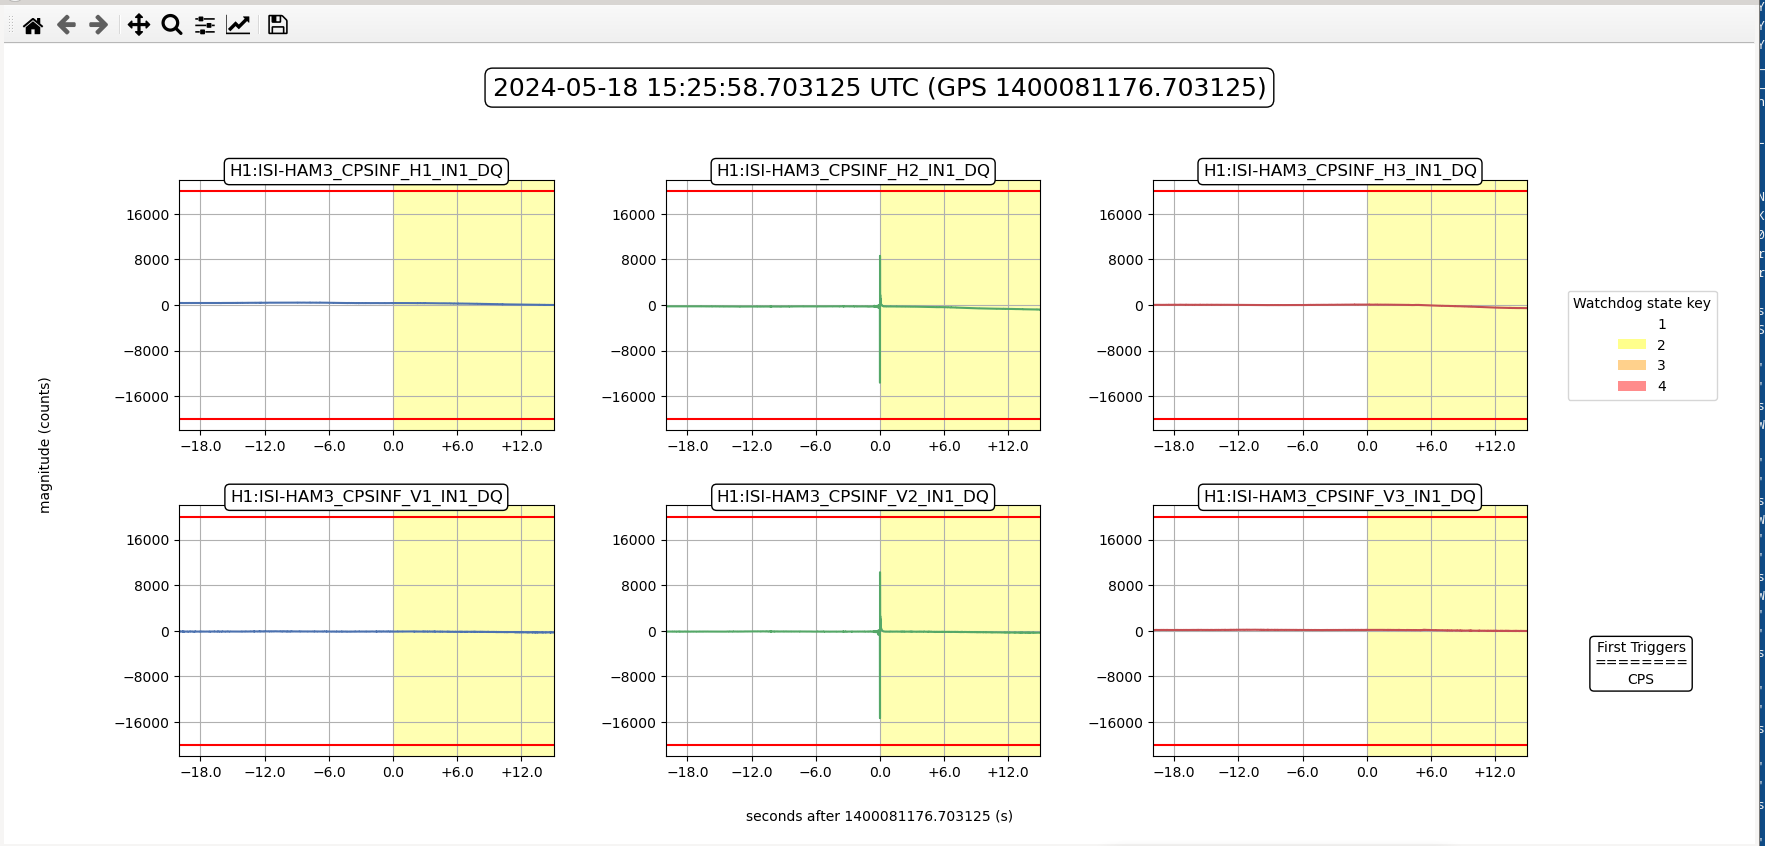
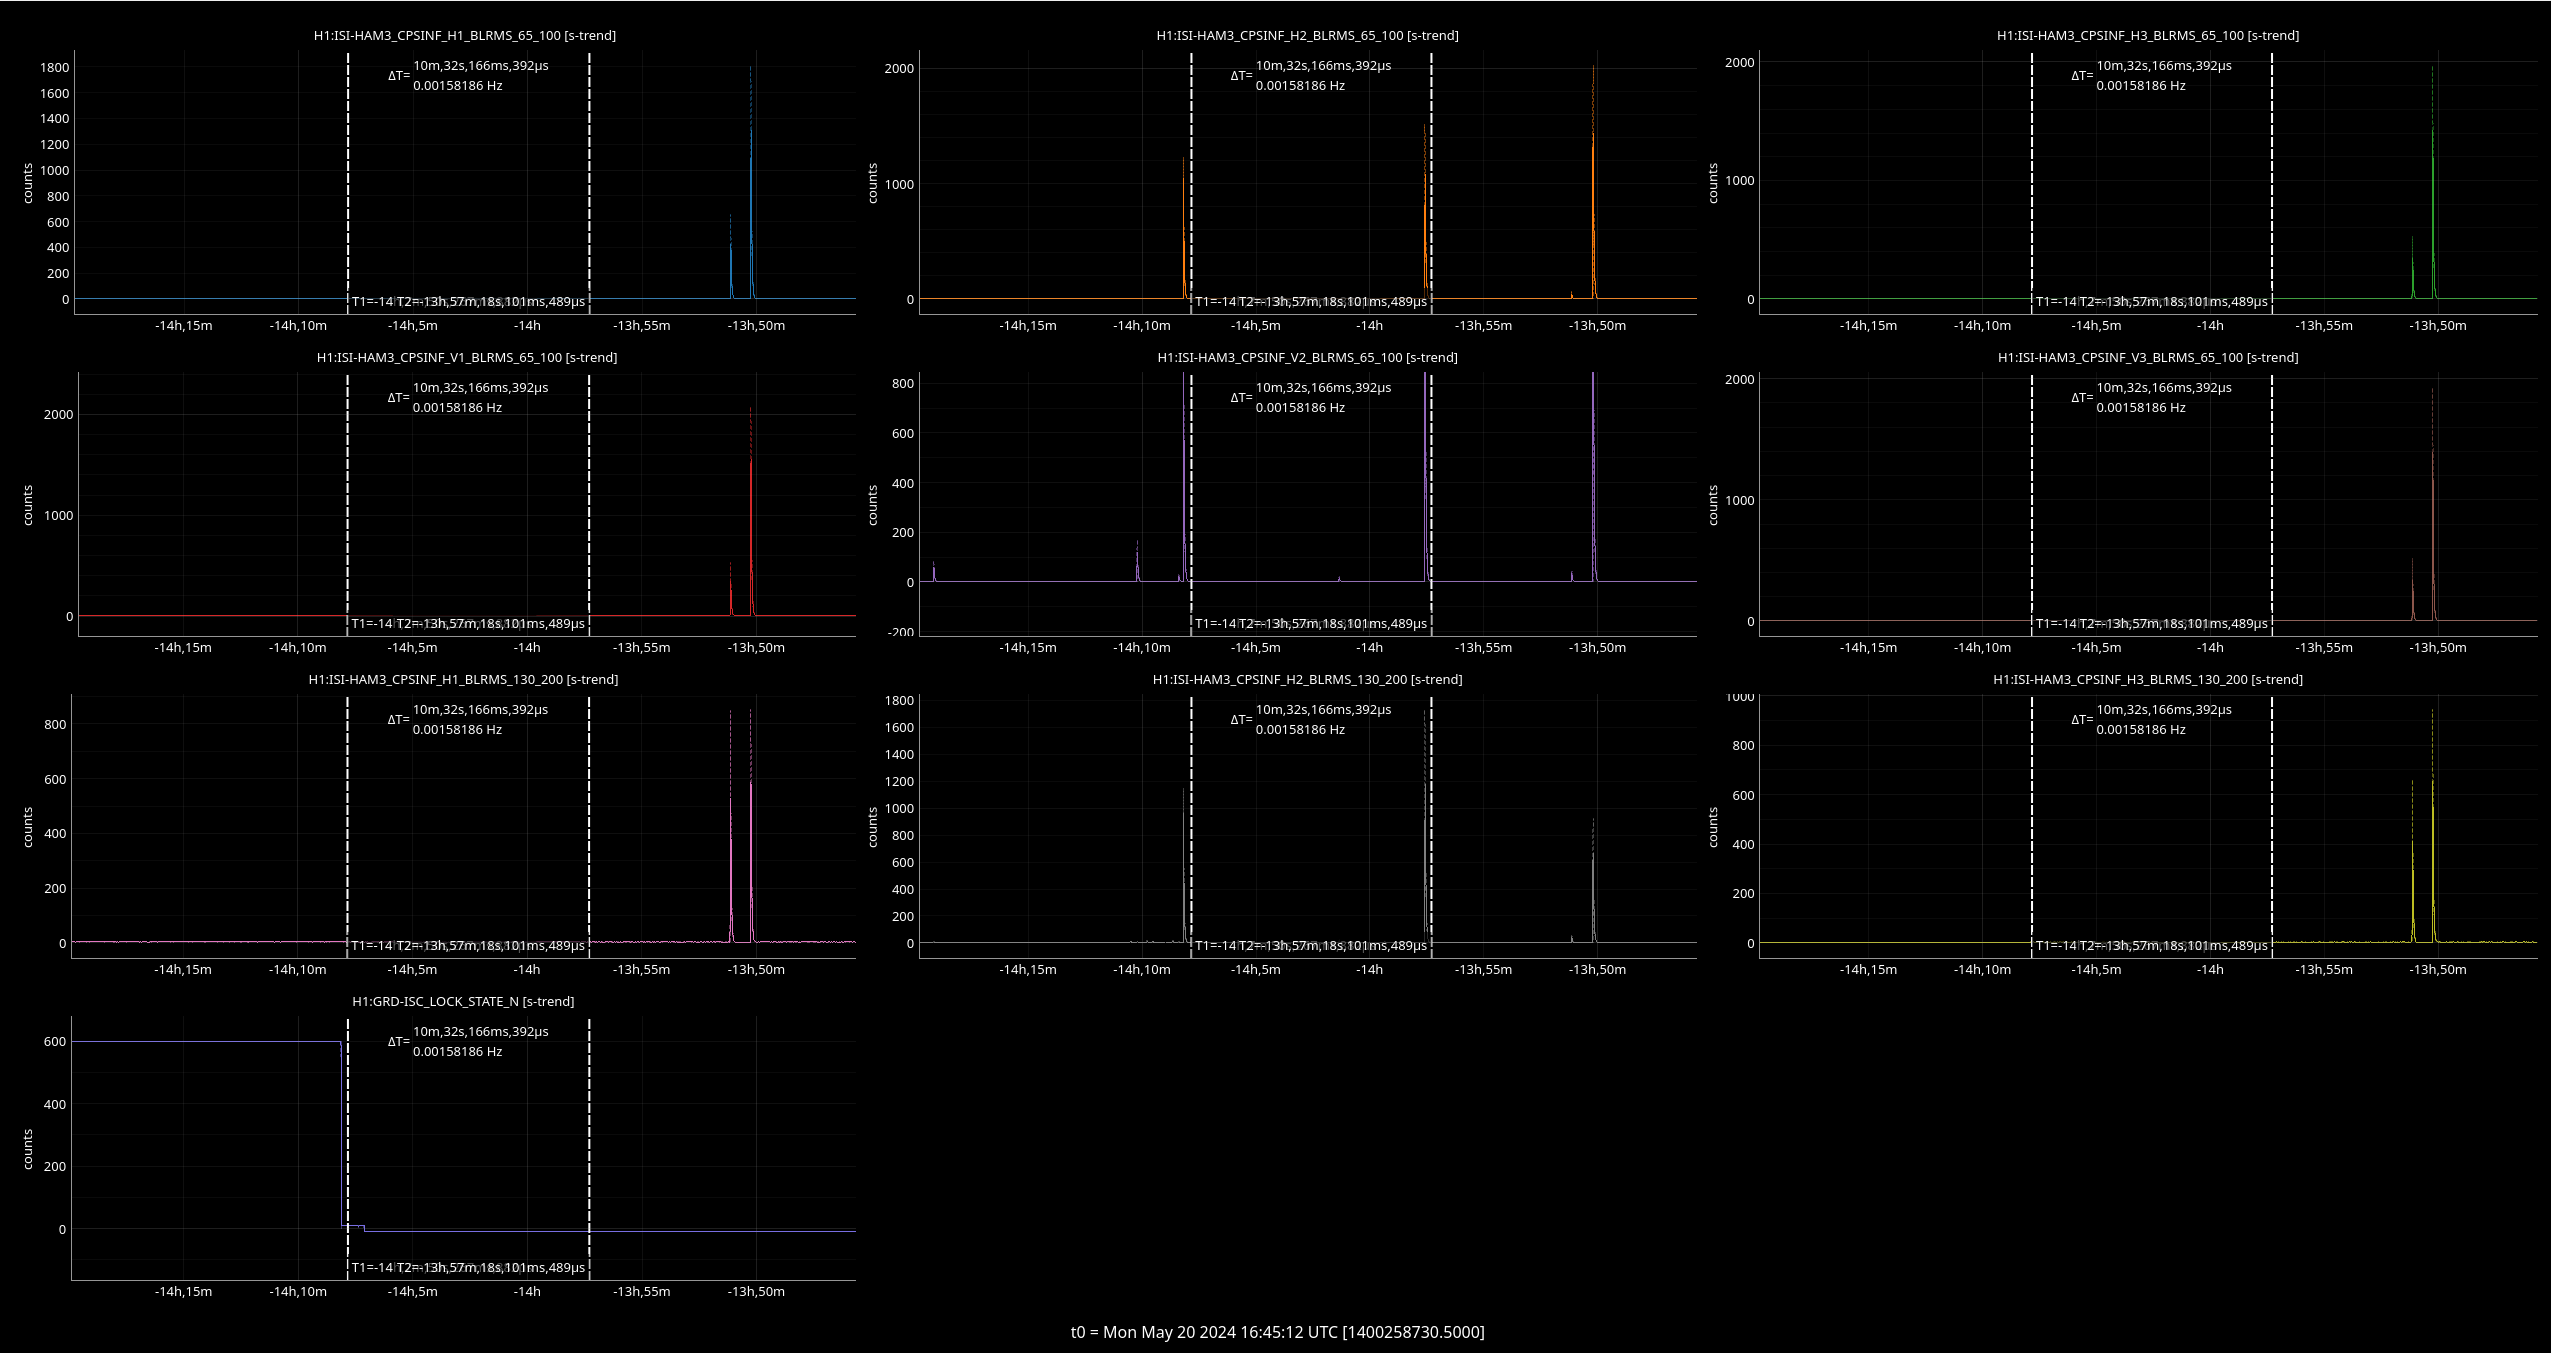
15:25 UTC HAM3 ISI CPS trip while doing green arms in IA. I could not finish SRC align, as SRM was continually saturating. There was also a couple of IY saturations, and there was an earthquake shaking everything at the time.
16:02 UTC HAM3 ISI CPS trip during FIND_IR? I couldn't get PRMI to stay locked for more than 2 seconds.
17:00 UTC I restored the alignments to 05/18/24 03:00 UTC which was right before we locked last night for the 11 hour lock. After locking ALS I could immediately see the beatnotes were better, but DRMI only had small flashes. A few rounds of CHECK_MICH and still bad flashes, 13:31 I started a 2nd IA skipping GREEN_ARMs, there were no saturations during this IA and I was able to finish SRC_ALIGN.
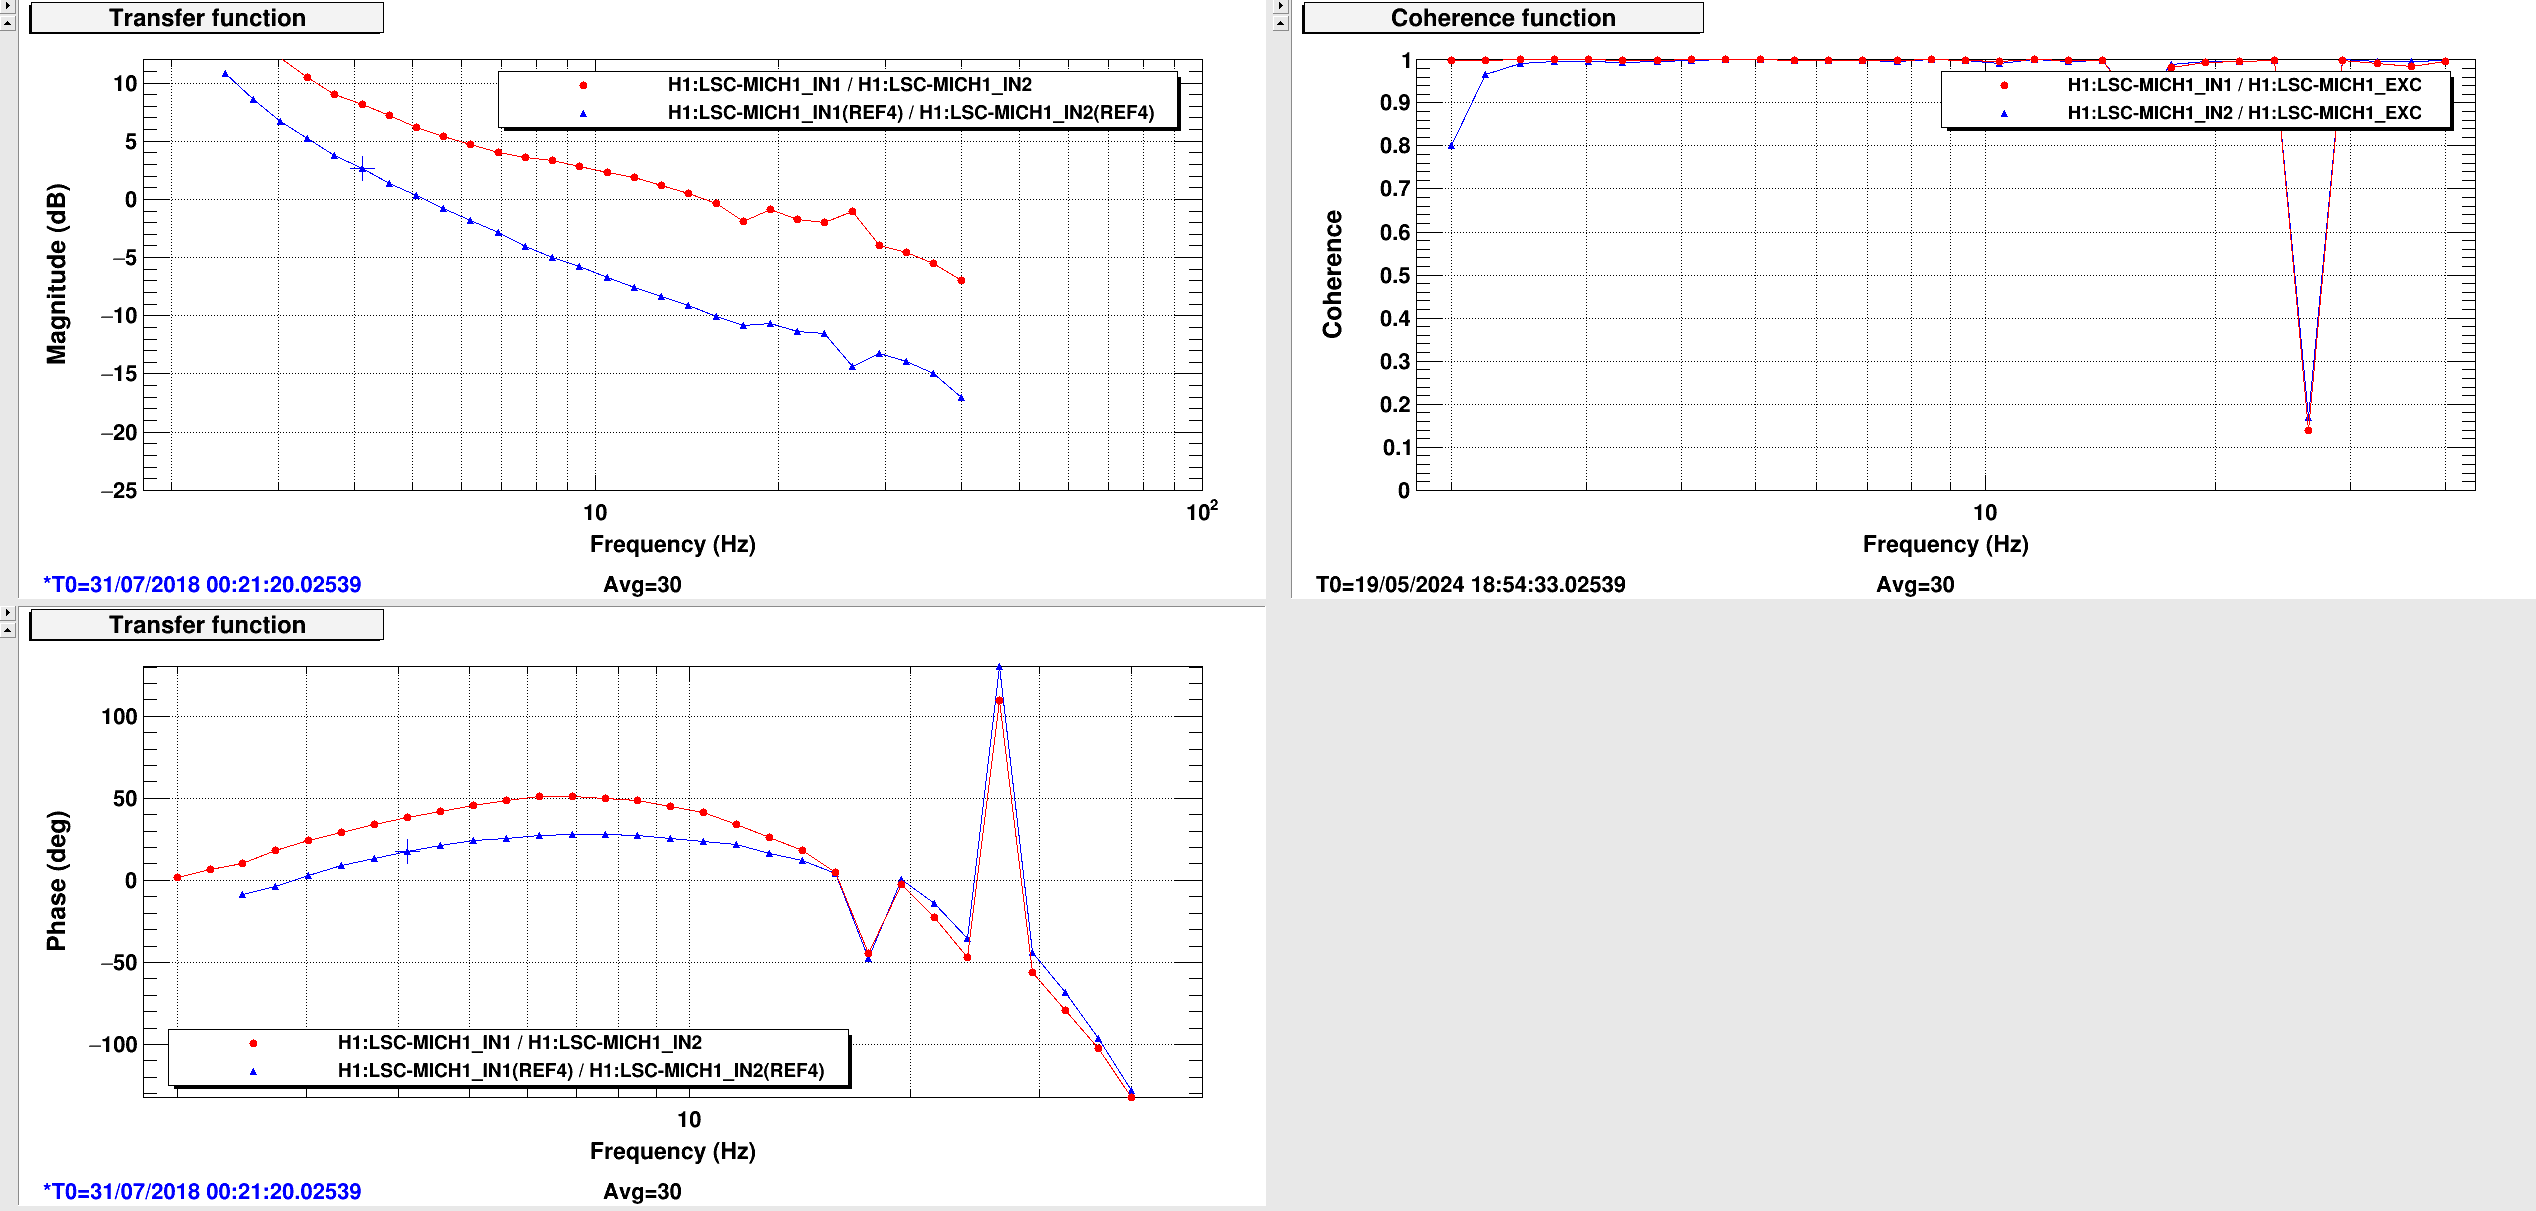
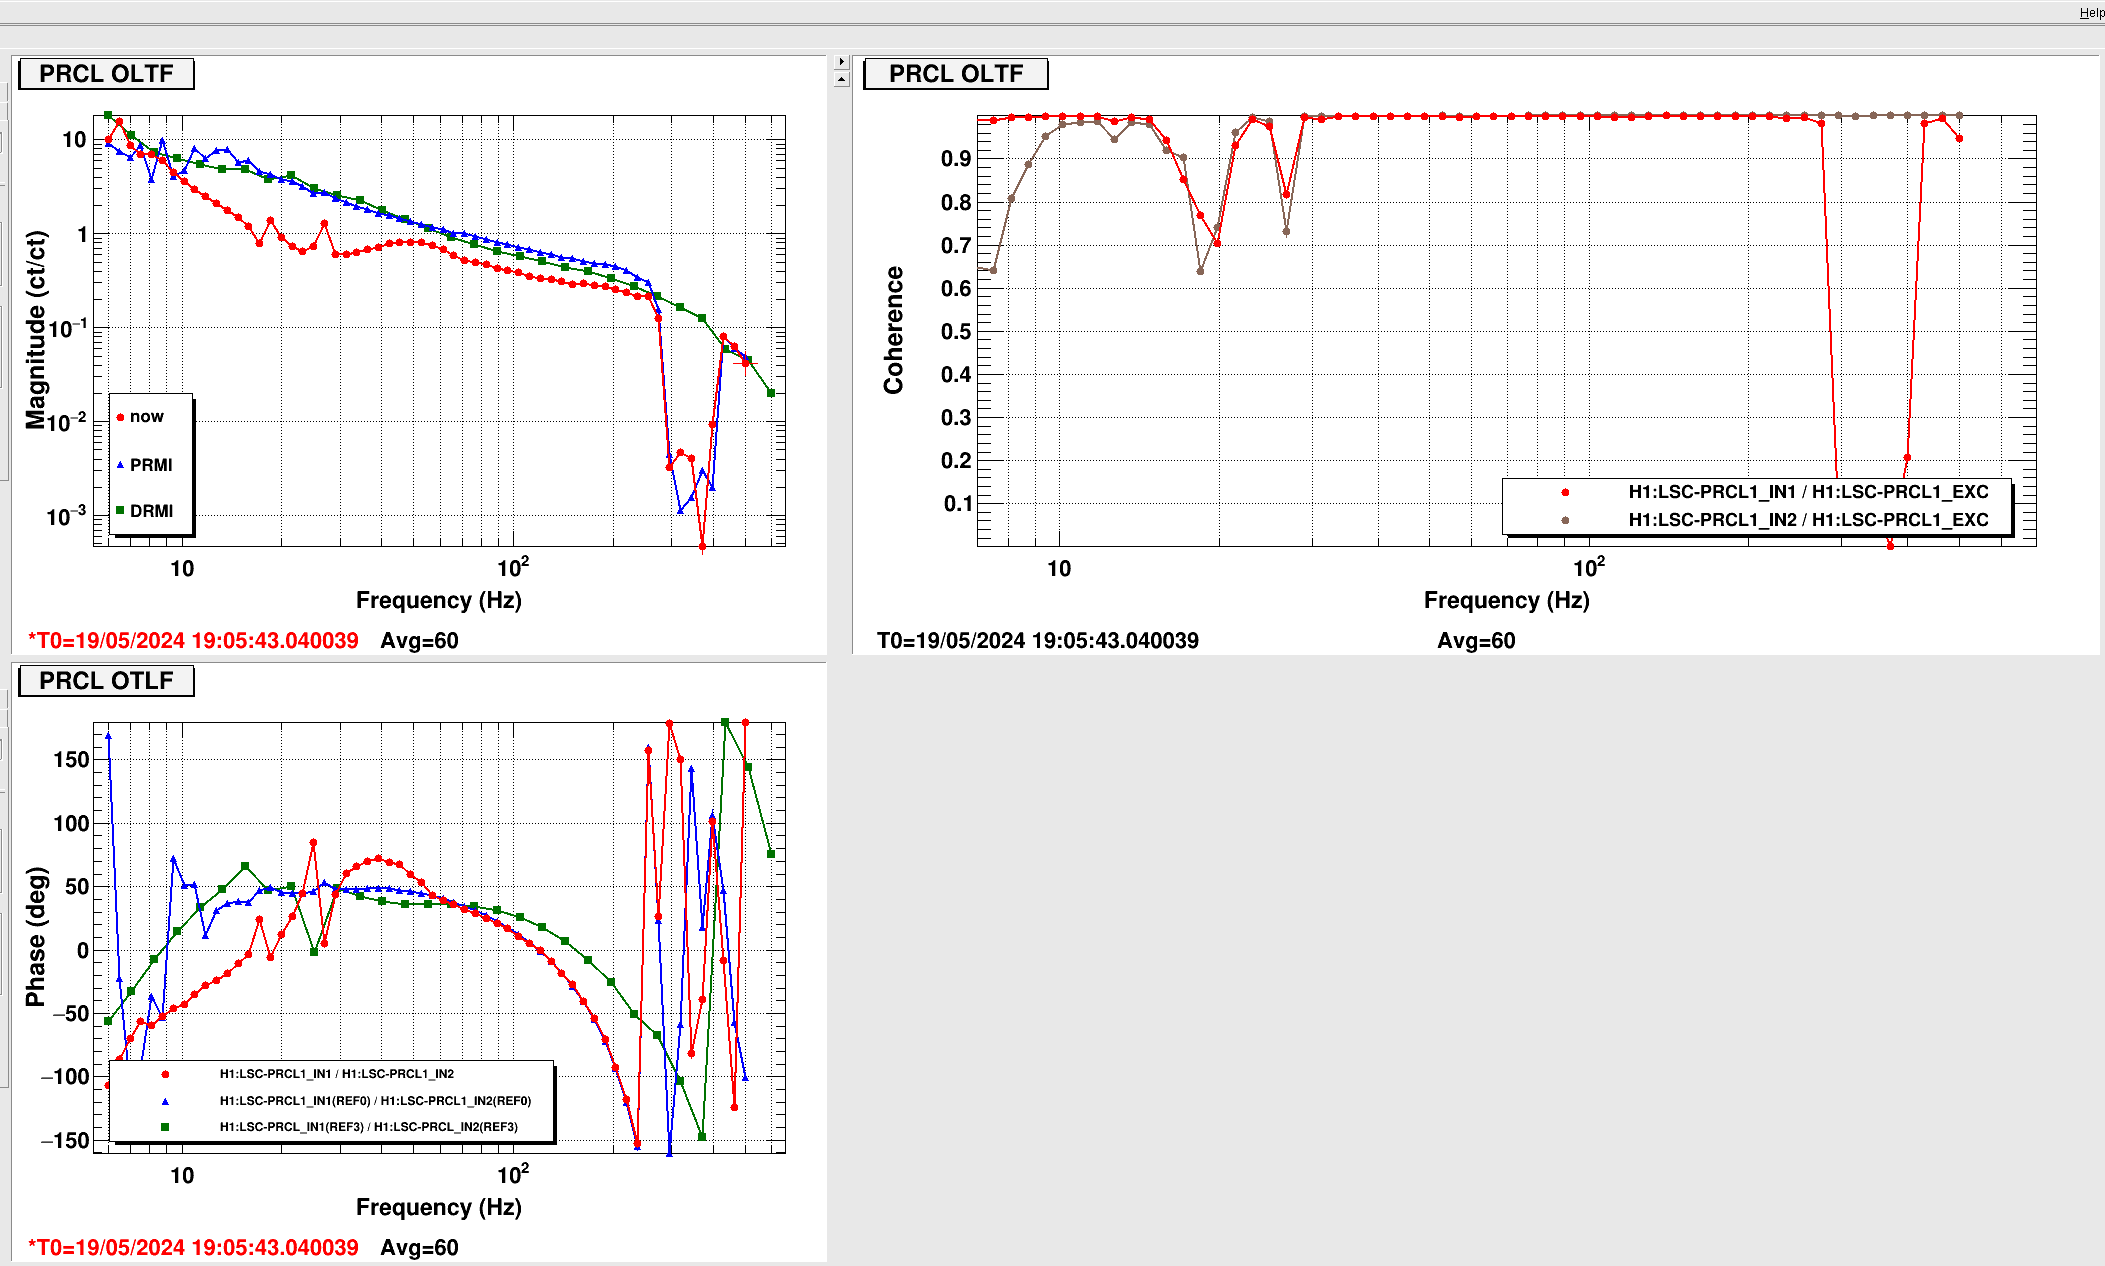
I'm still not able to get PRMI to stay locked for more than 2 seconds, theres a 20ish Hz oscillation that kills it when the MICH1 filter is ramped on? I tried lowering the PRMI-MICH gain from 3.2 to 2.8 in lscparams as Sheila suggested the other day. It lasted longer but was still ultimately killed by the 20Hz buzzing, I lowered it more to 2.6 and it lasted even longer but was killed when PRCL1 turned on? AS AIR was still clearly misaligned so I went through CHECK_MICH which made things worse? I now had worse PRMI flashes and still a clearly misaligned AS AIR. During this I was also trying to help adjust PRM/BS while in PRMI to fix AS AIR.
19:37UTC After some more seemingly fruitless adjusting of PRM and BS I started a 3rd IA... it looks centered on AS-AS_C during SRC and PRC alignment?
Same behavior as before, bad DRMI then PRMI gets killed after a few seconds from the 20Hz, its also always right after the BS_M1_L filter is turned on. Lockloss after a few rounds of PRMI.
For the next attempt I tried turning down the PRMI-PRCL gain from 6 to 4 but then it was able to lock DRMI all of a sudden and we didn't even go through PRMI... so I'll revert these changes. I have no idea whats different this attempt from the last or why it decided now it wants to work but I'll take it. The alignment was just finally good enough, even though it wasn't on the first attempt after the IA finished?
21:15 UTC back to Observing
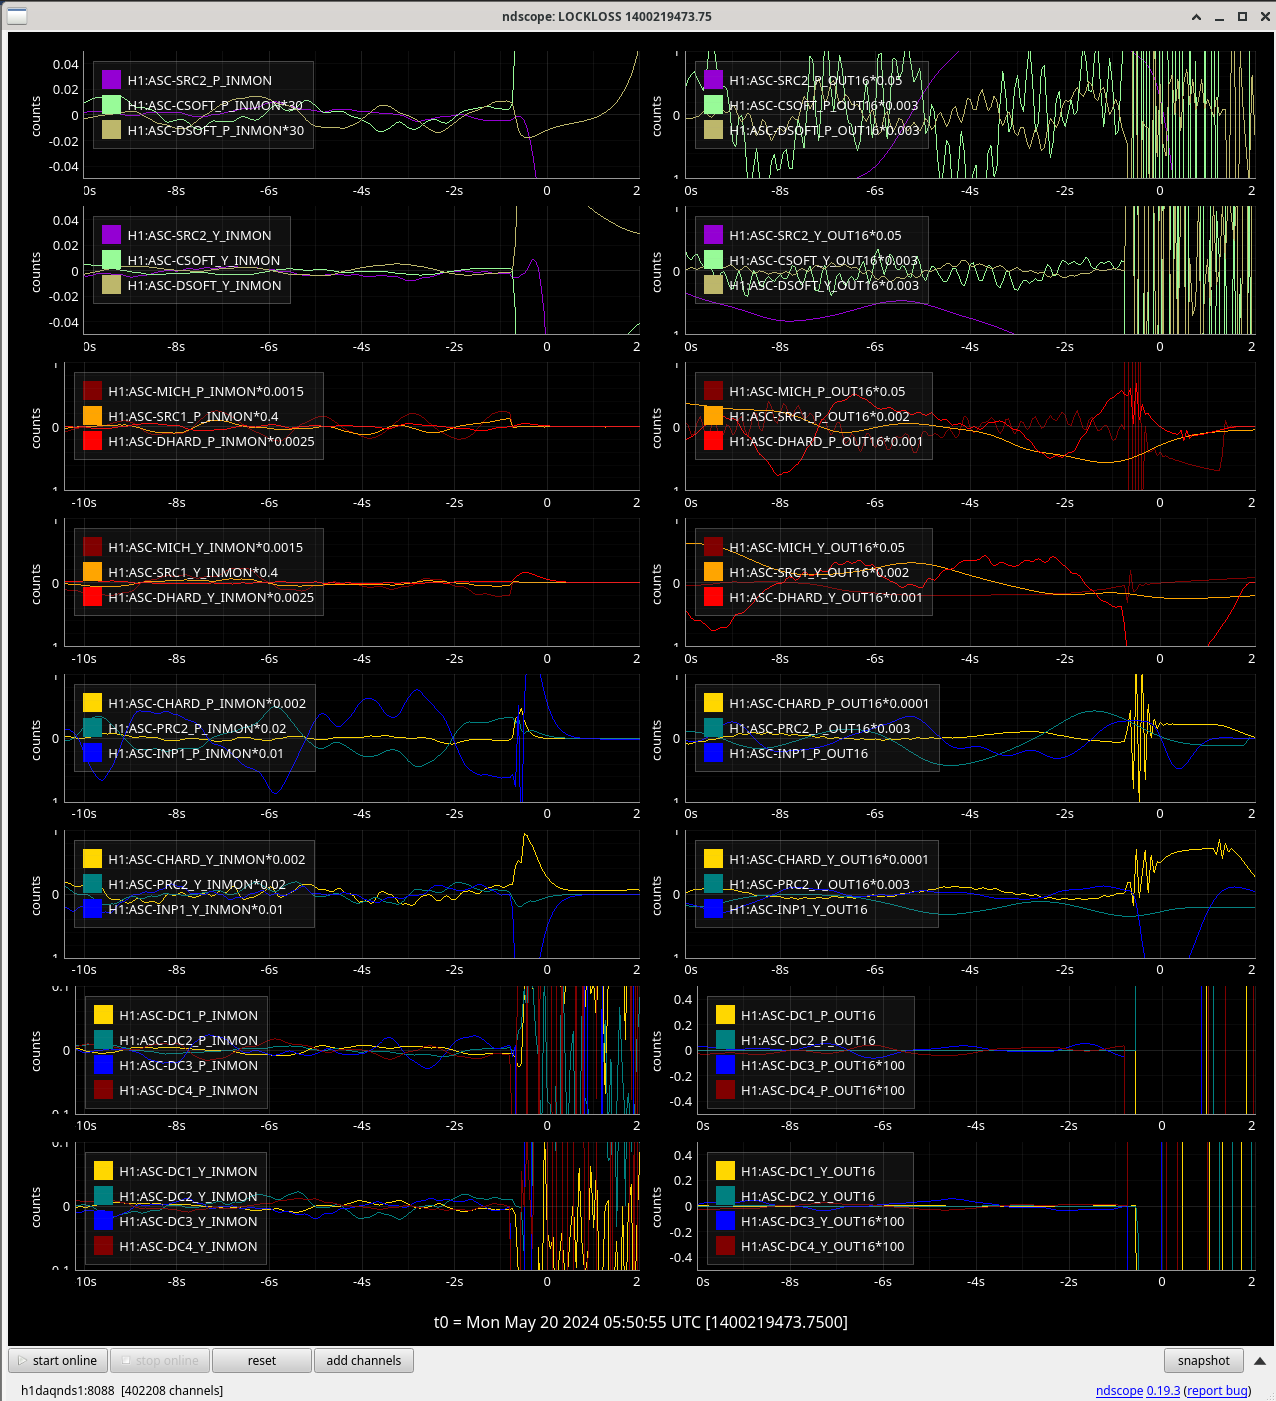
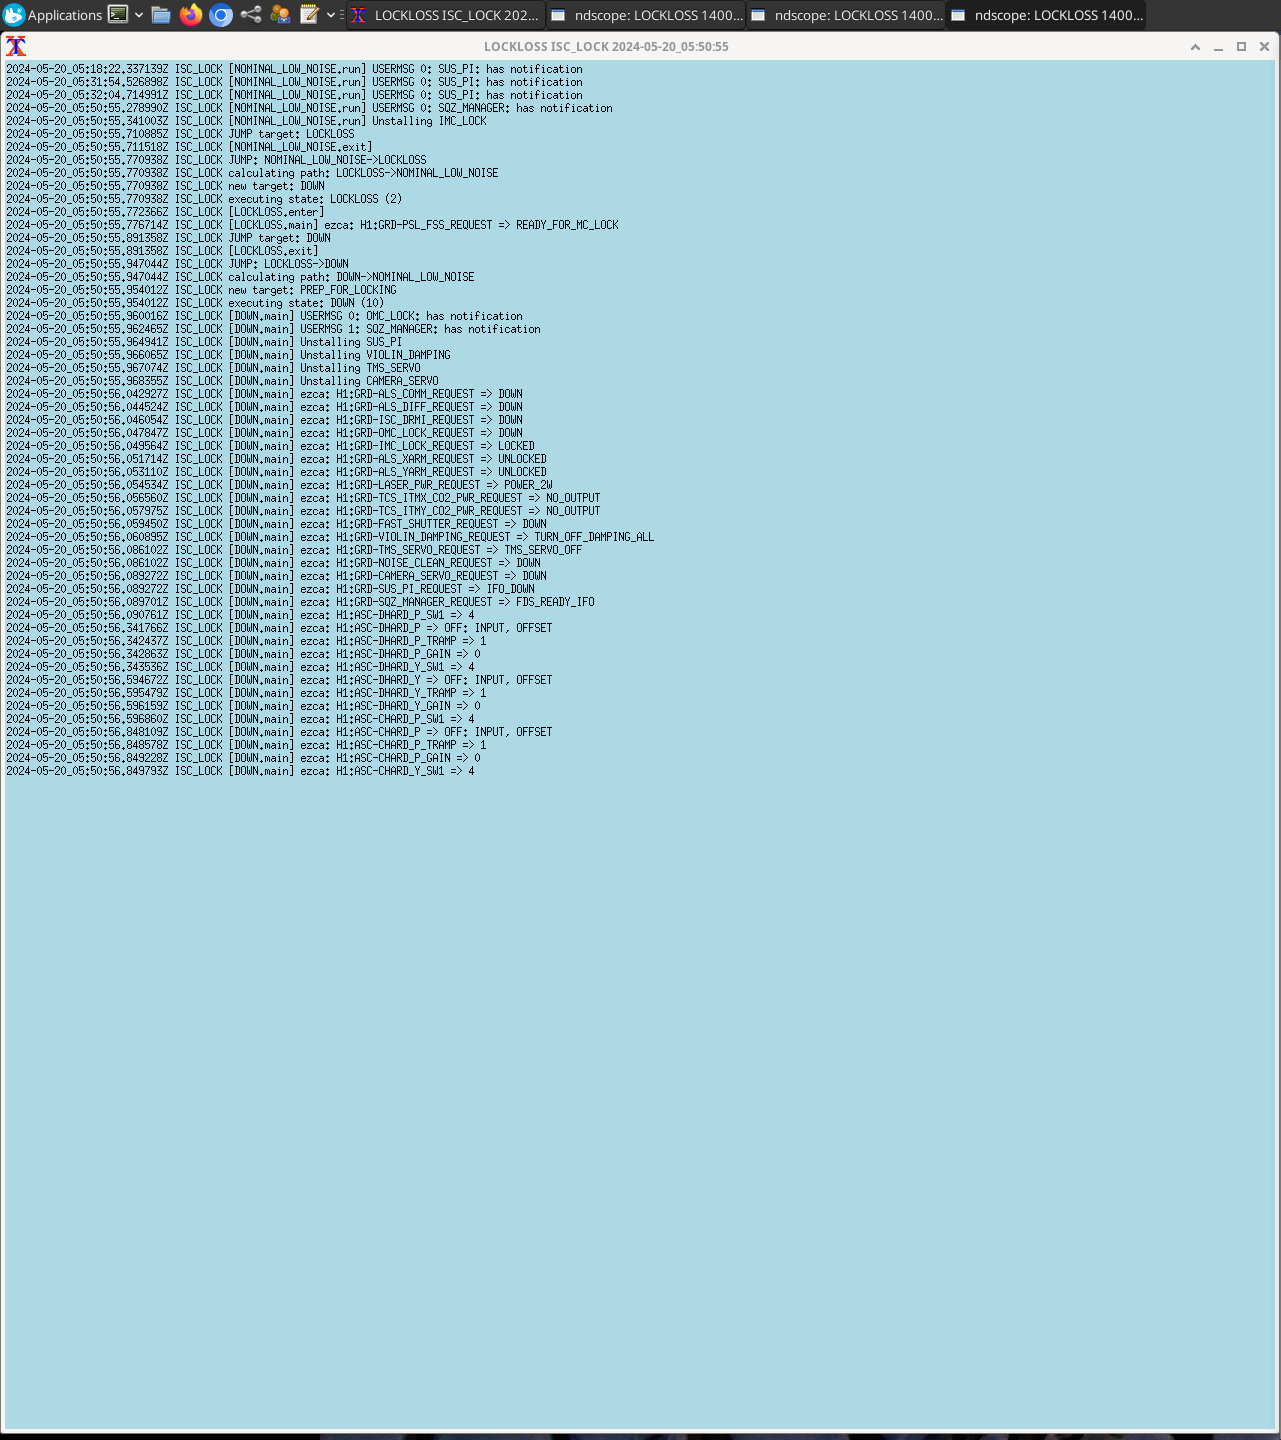
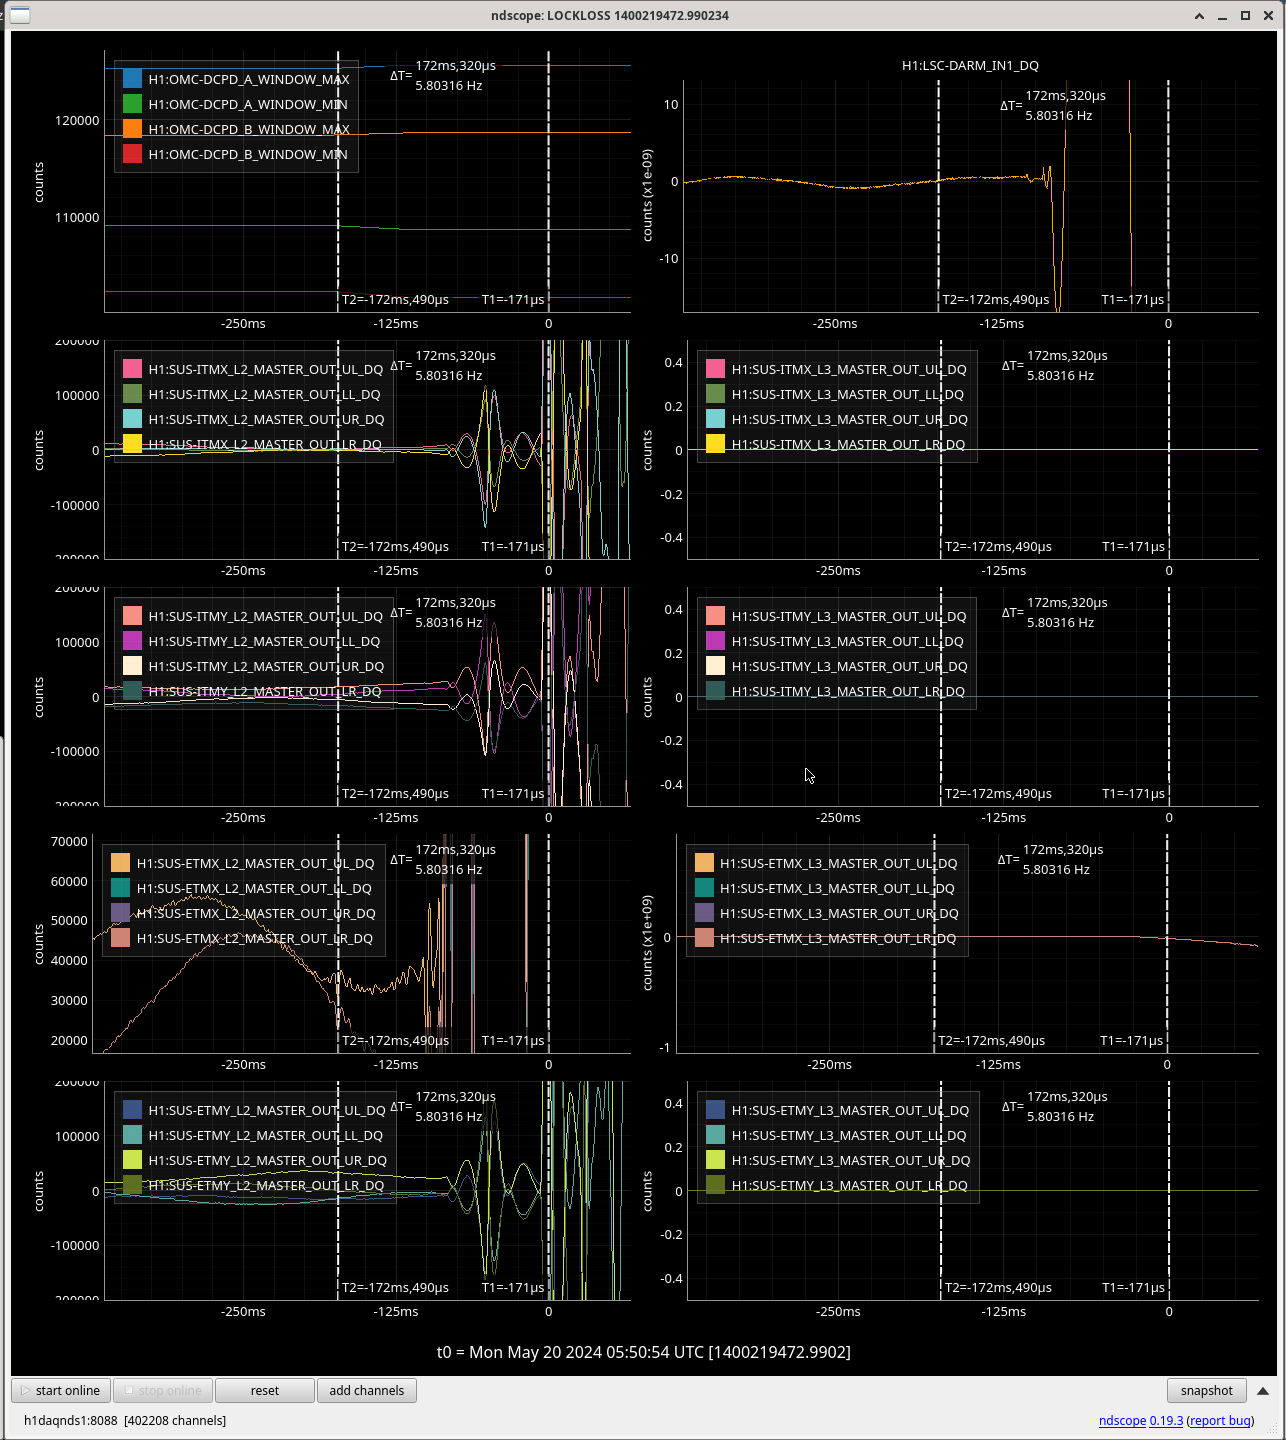
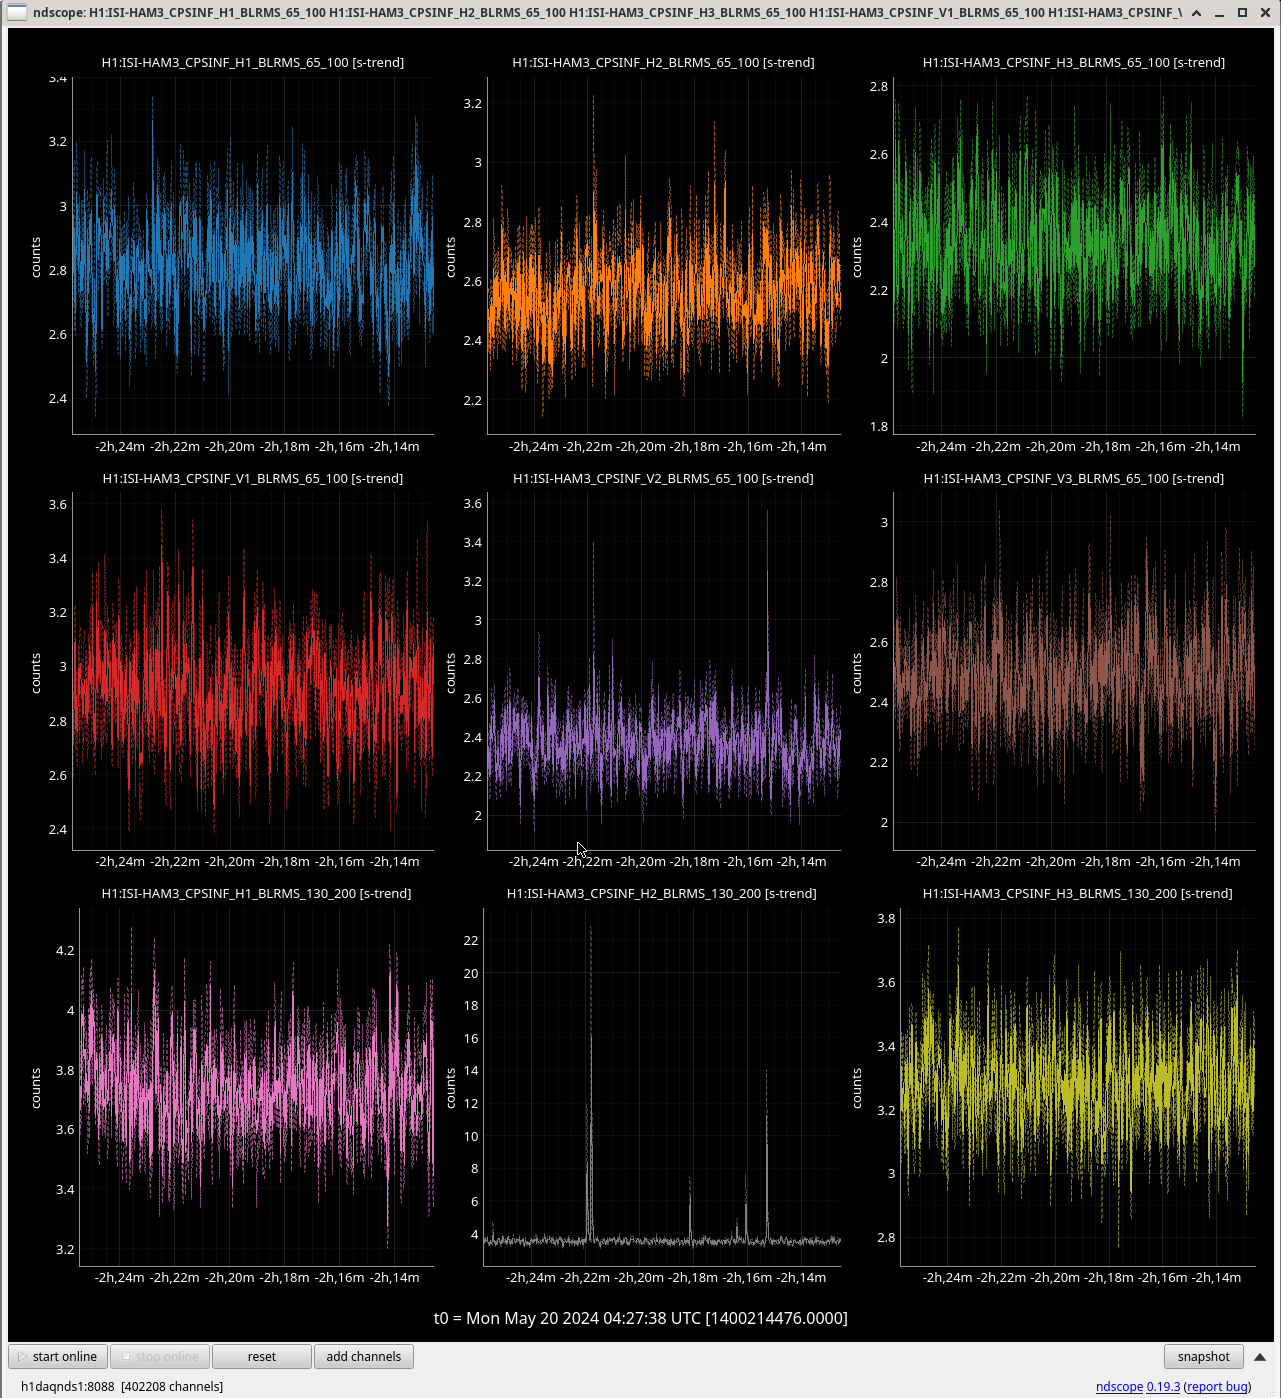
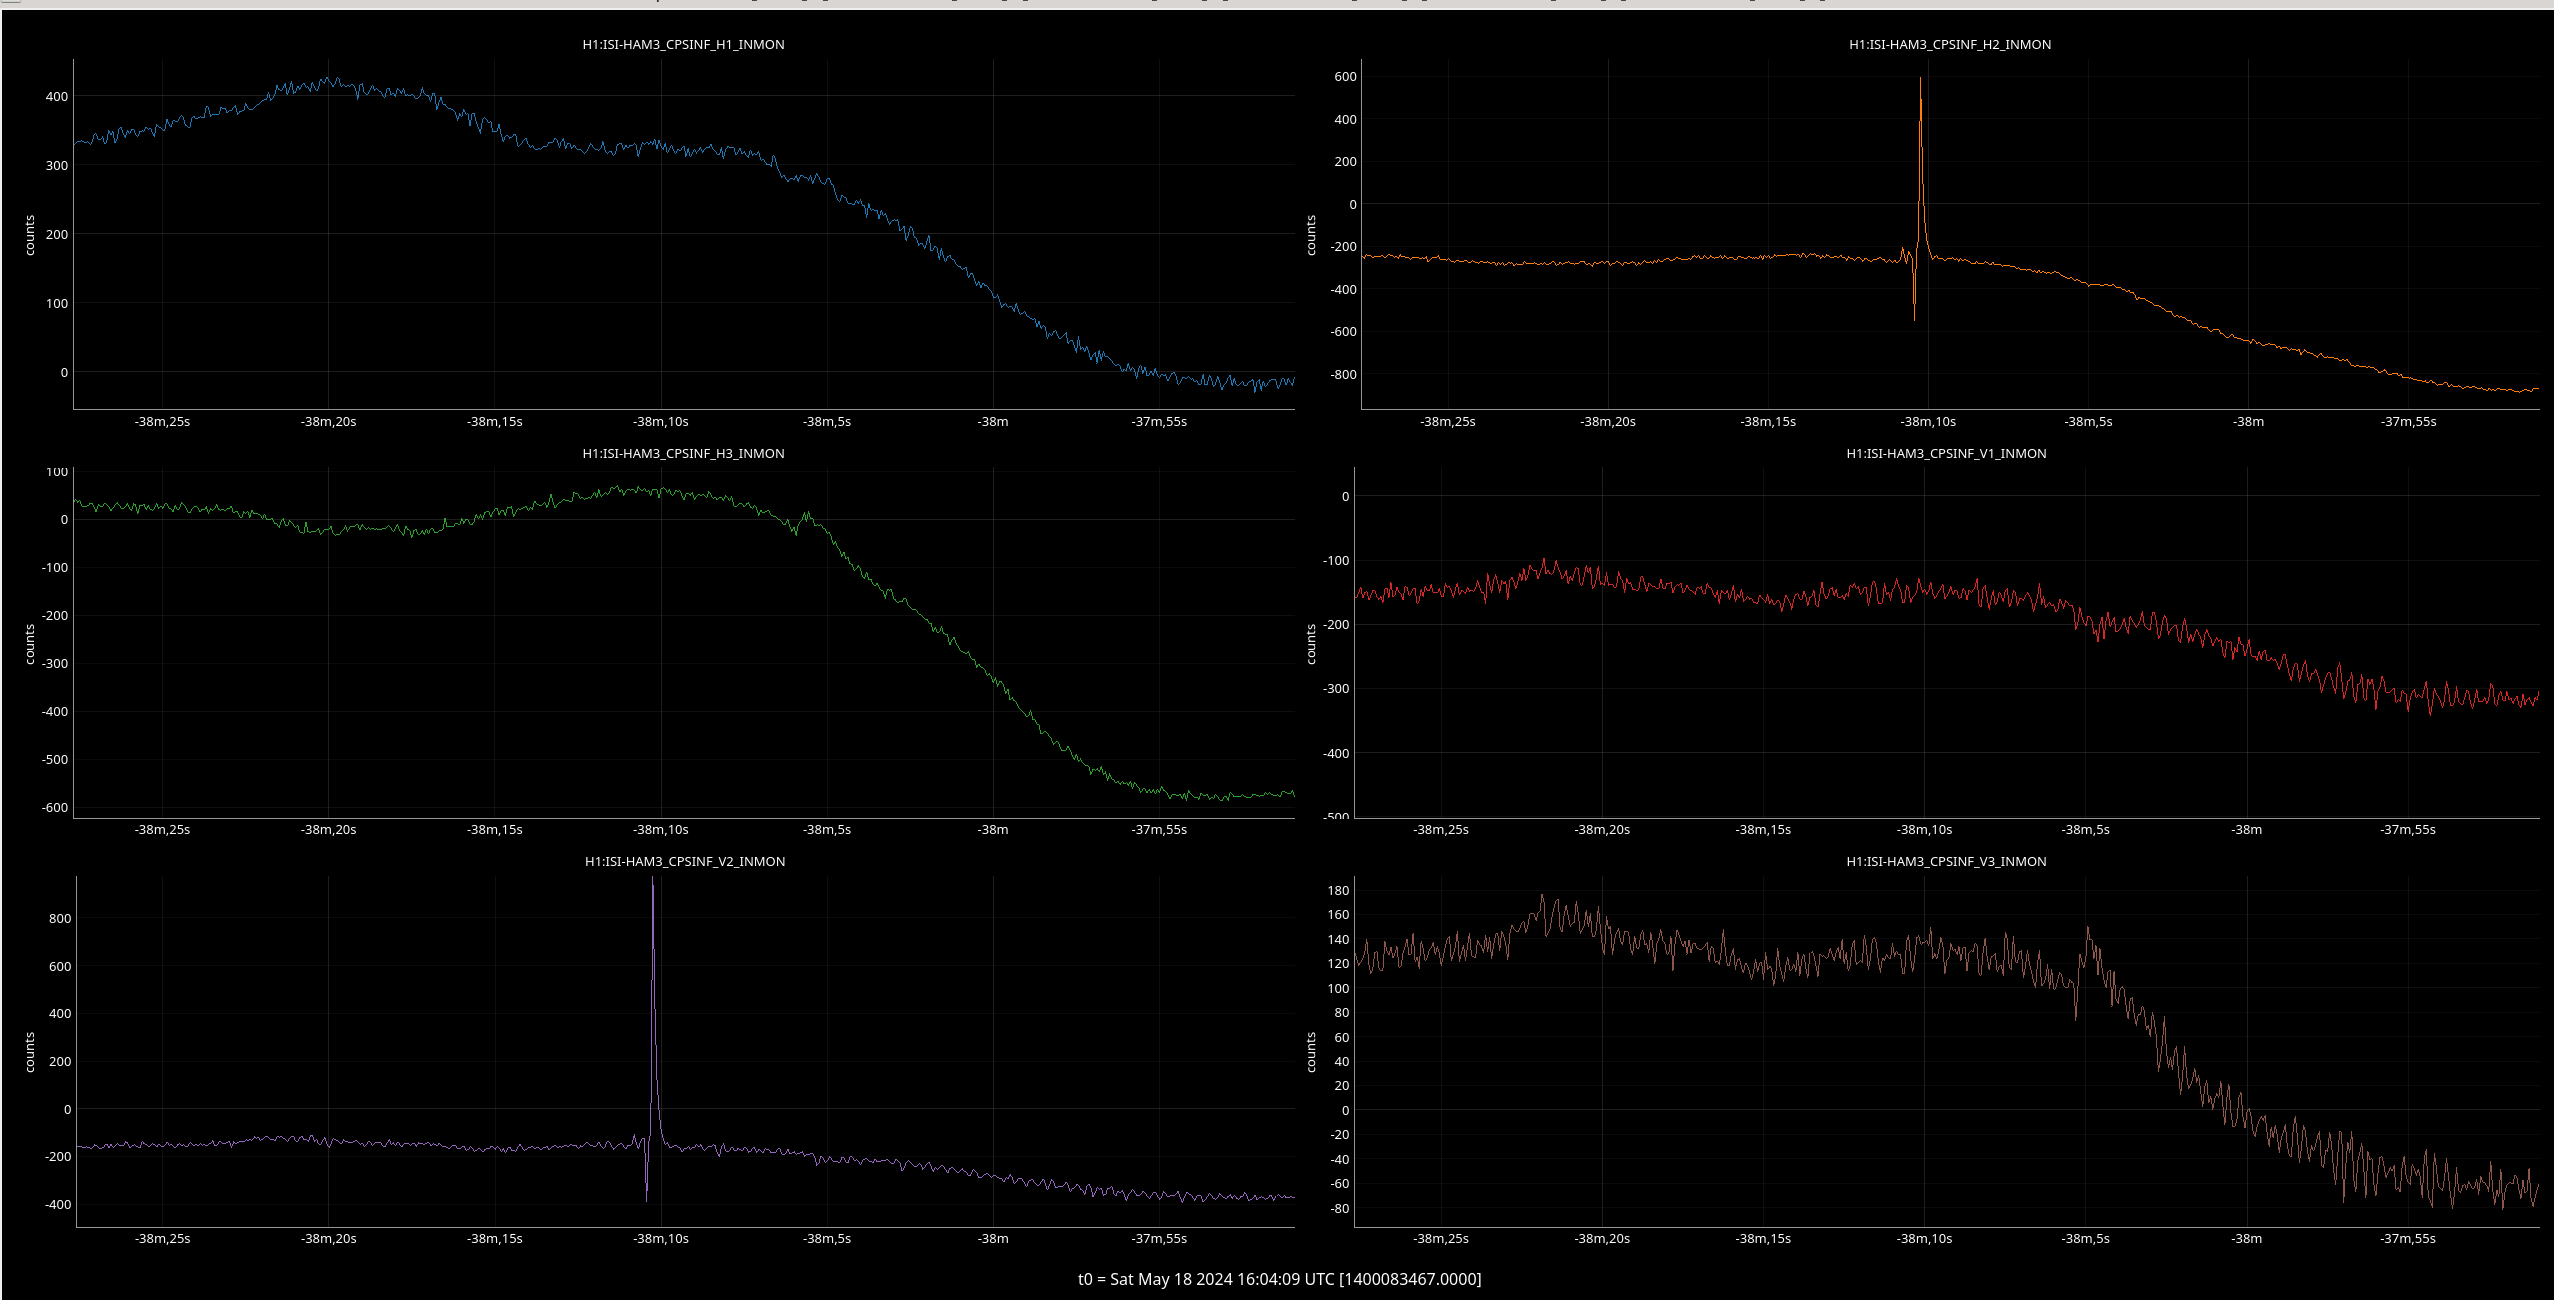
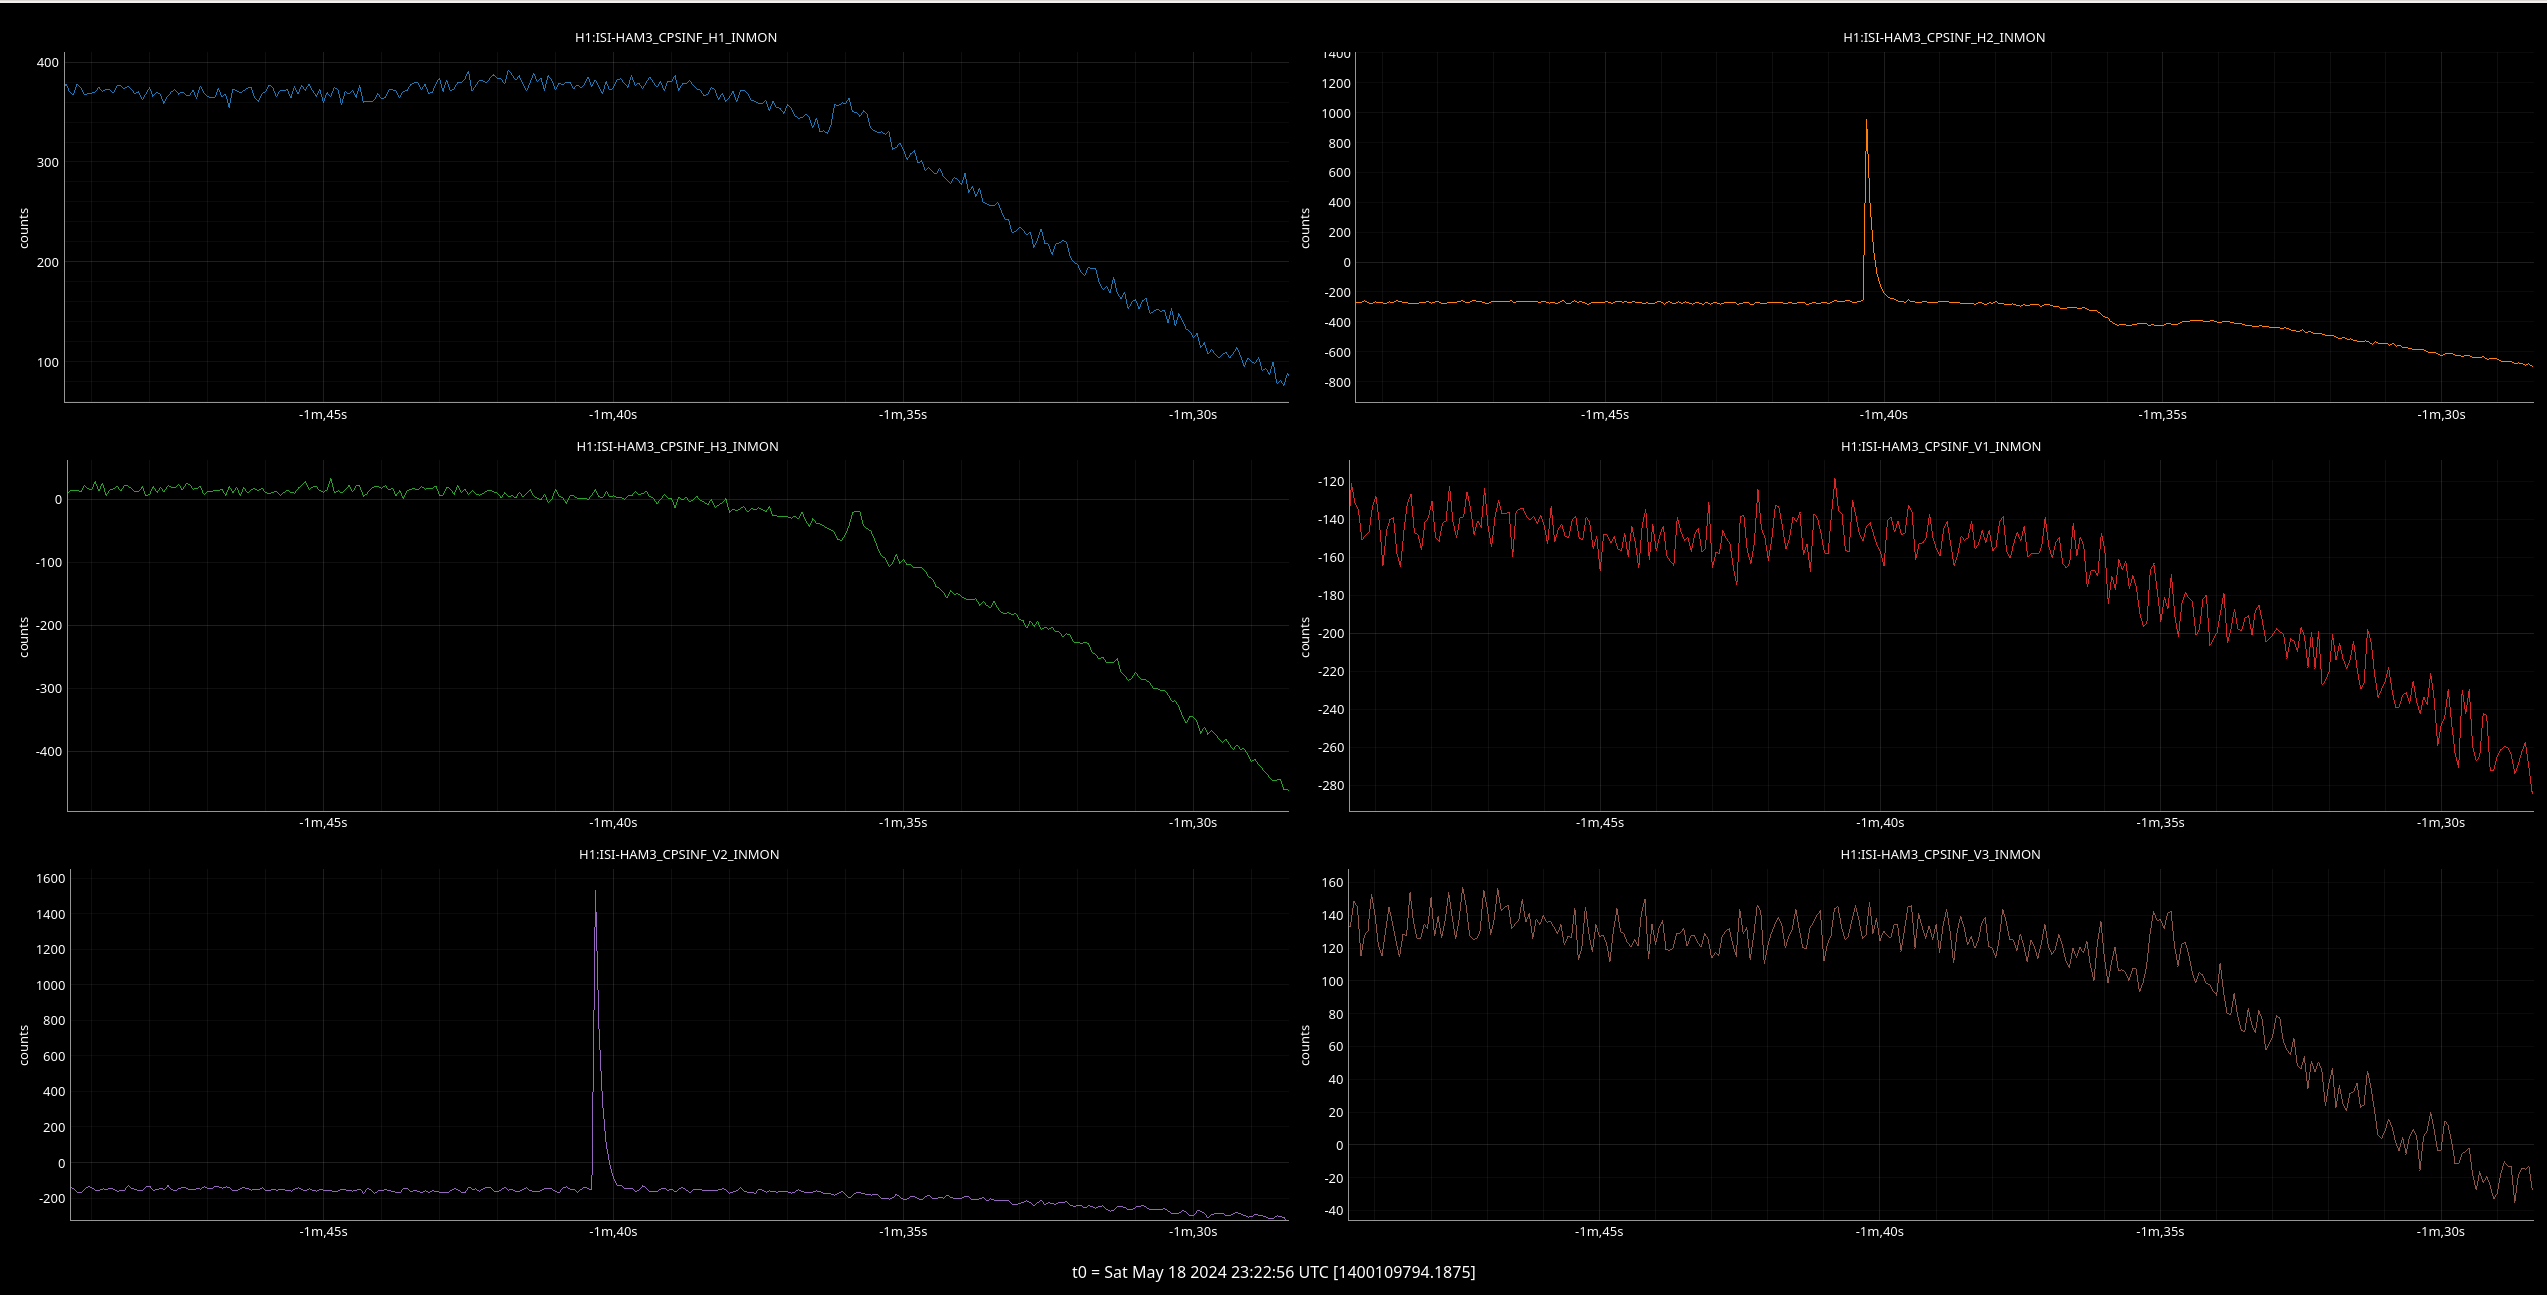
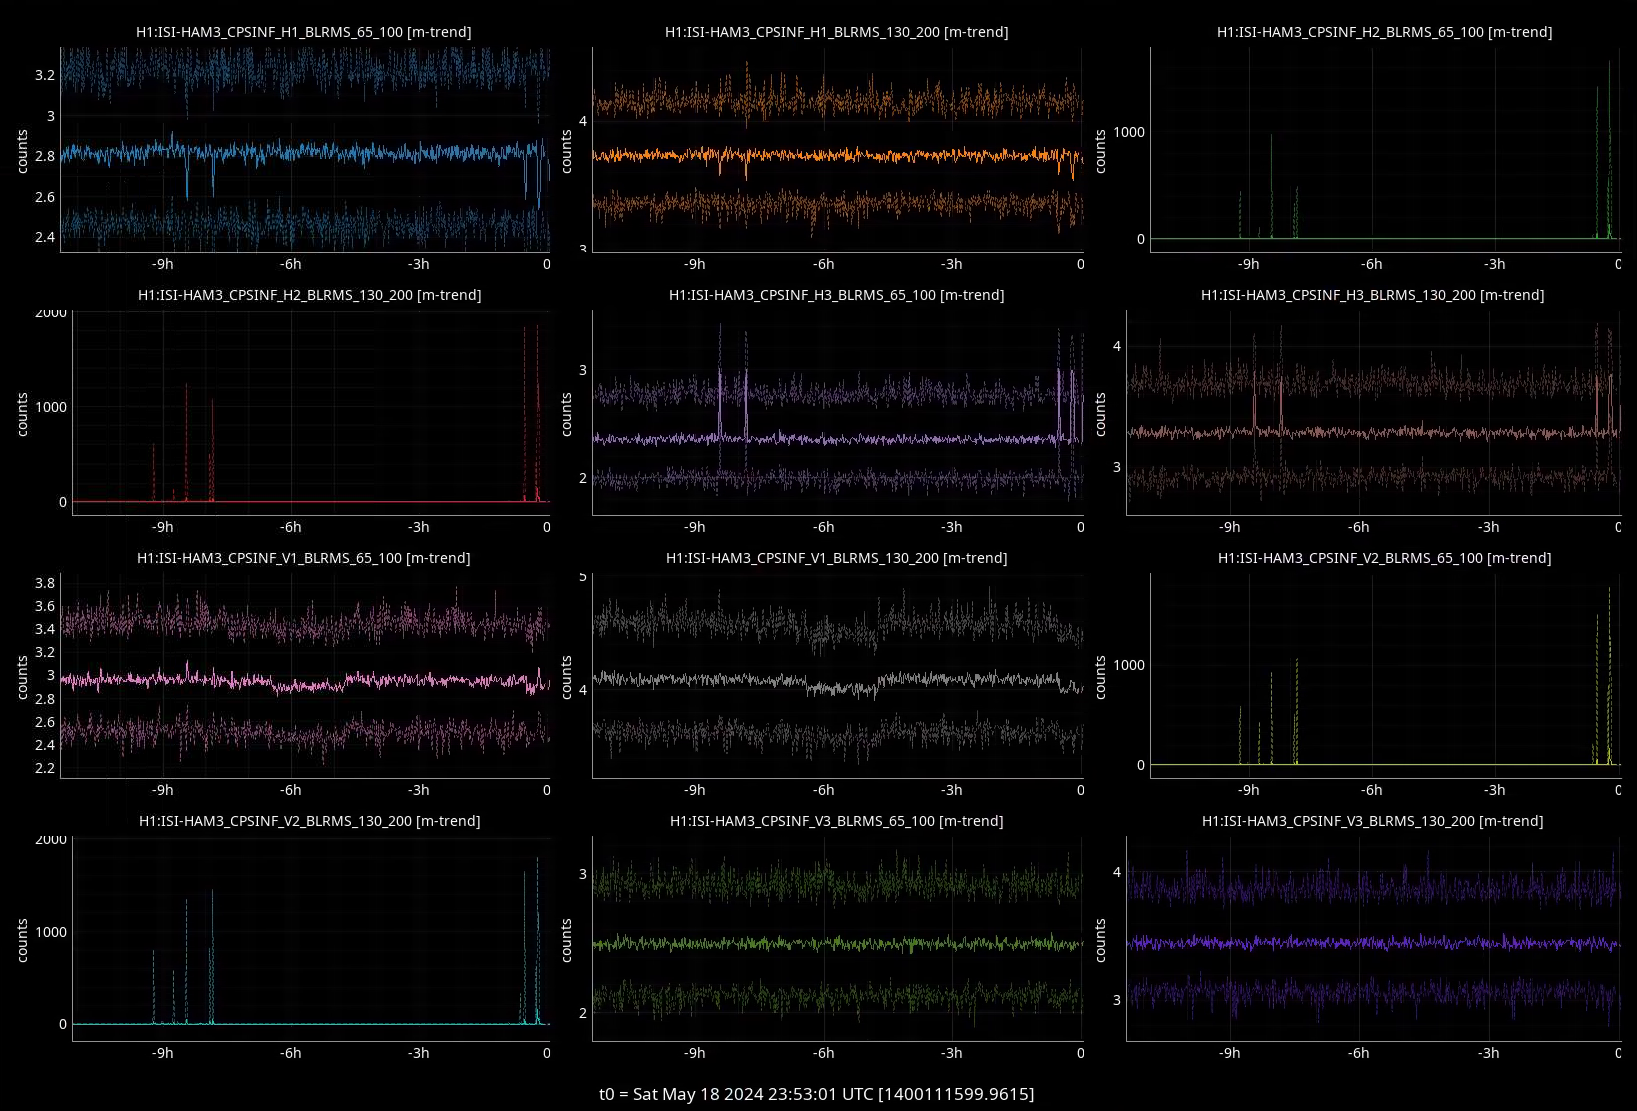
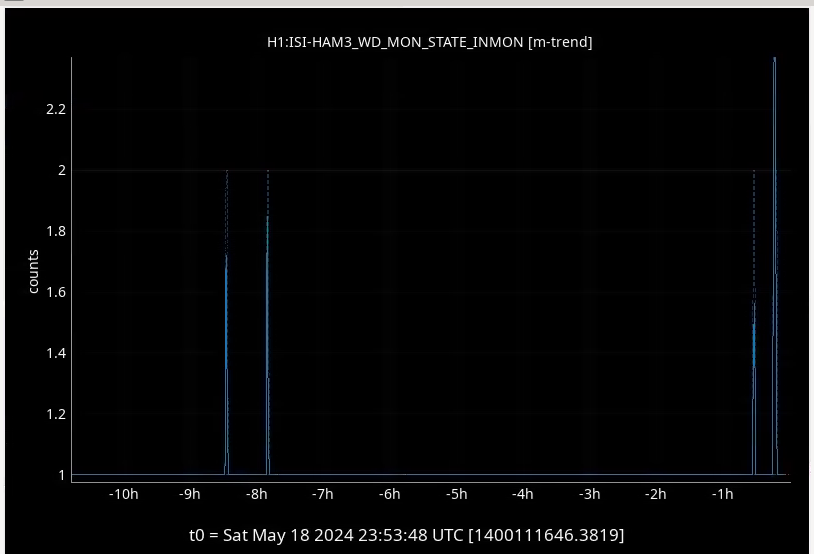
23:21 UTC lockloss from a HAM3 ISI trip, same as before, CPS sensor tagging SEI