Sheila, Camilla.
We decided to pause on looking for the FC alignment and look at SQZ alignment into the IFO. To check our irises and possibly look for scattering shelves.
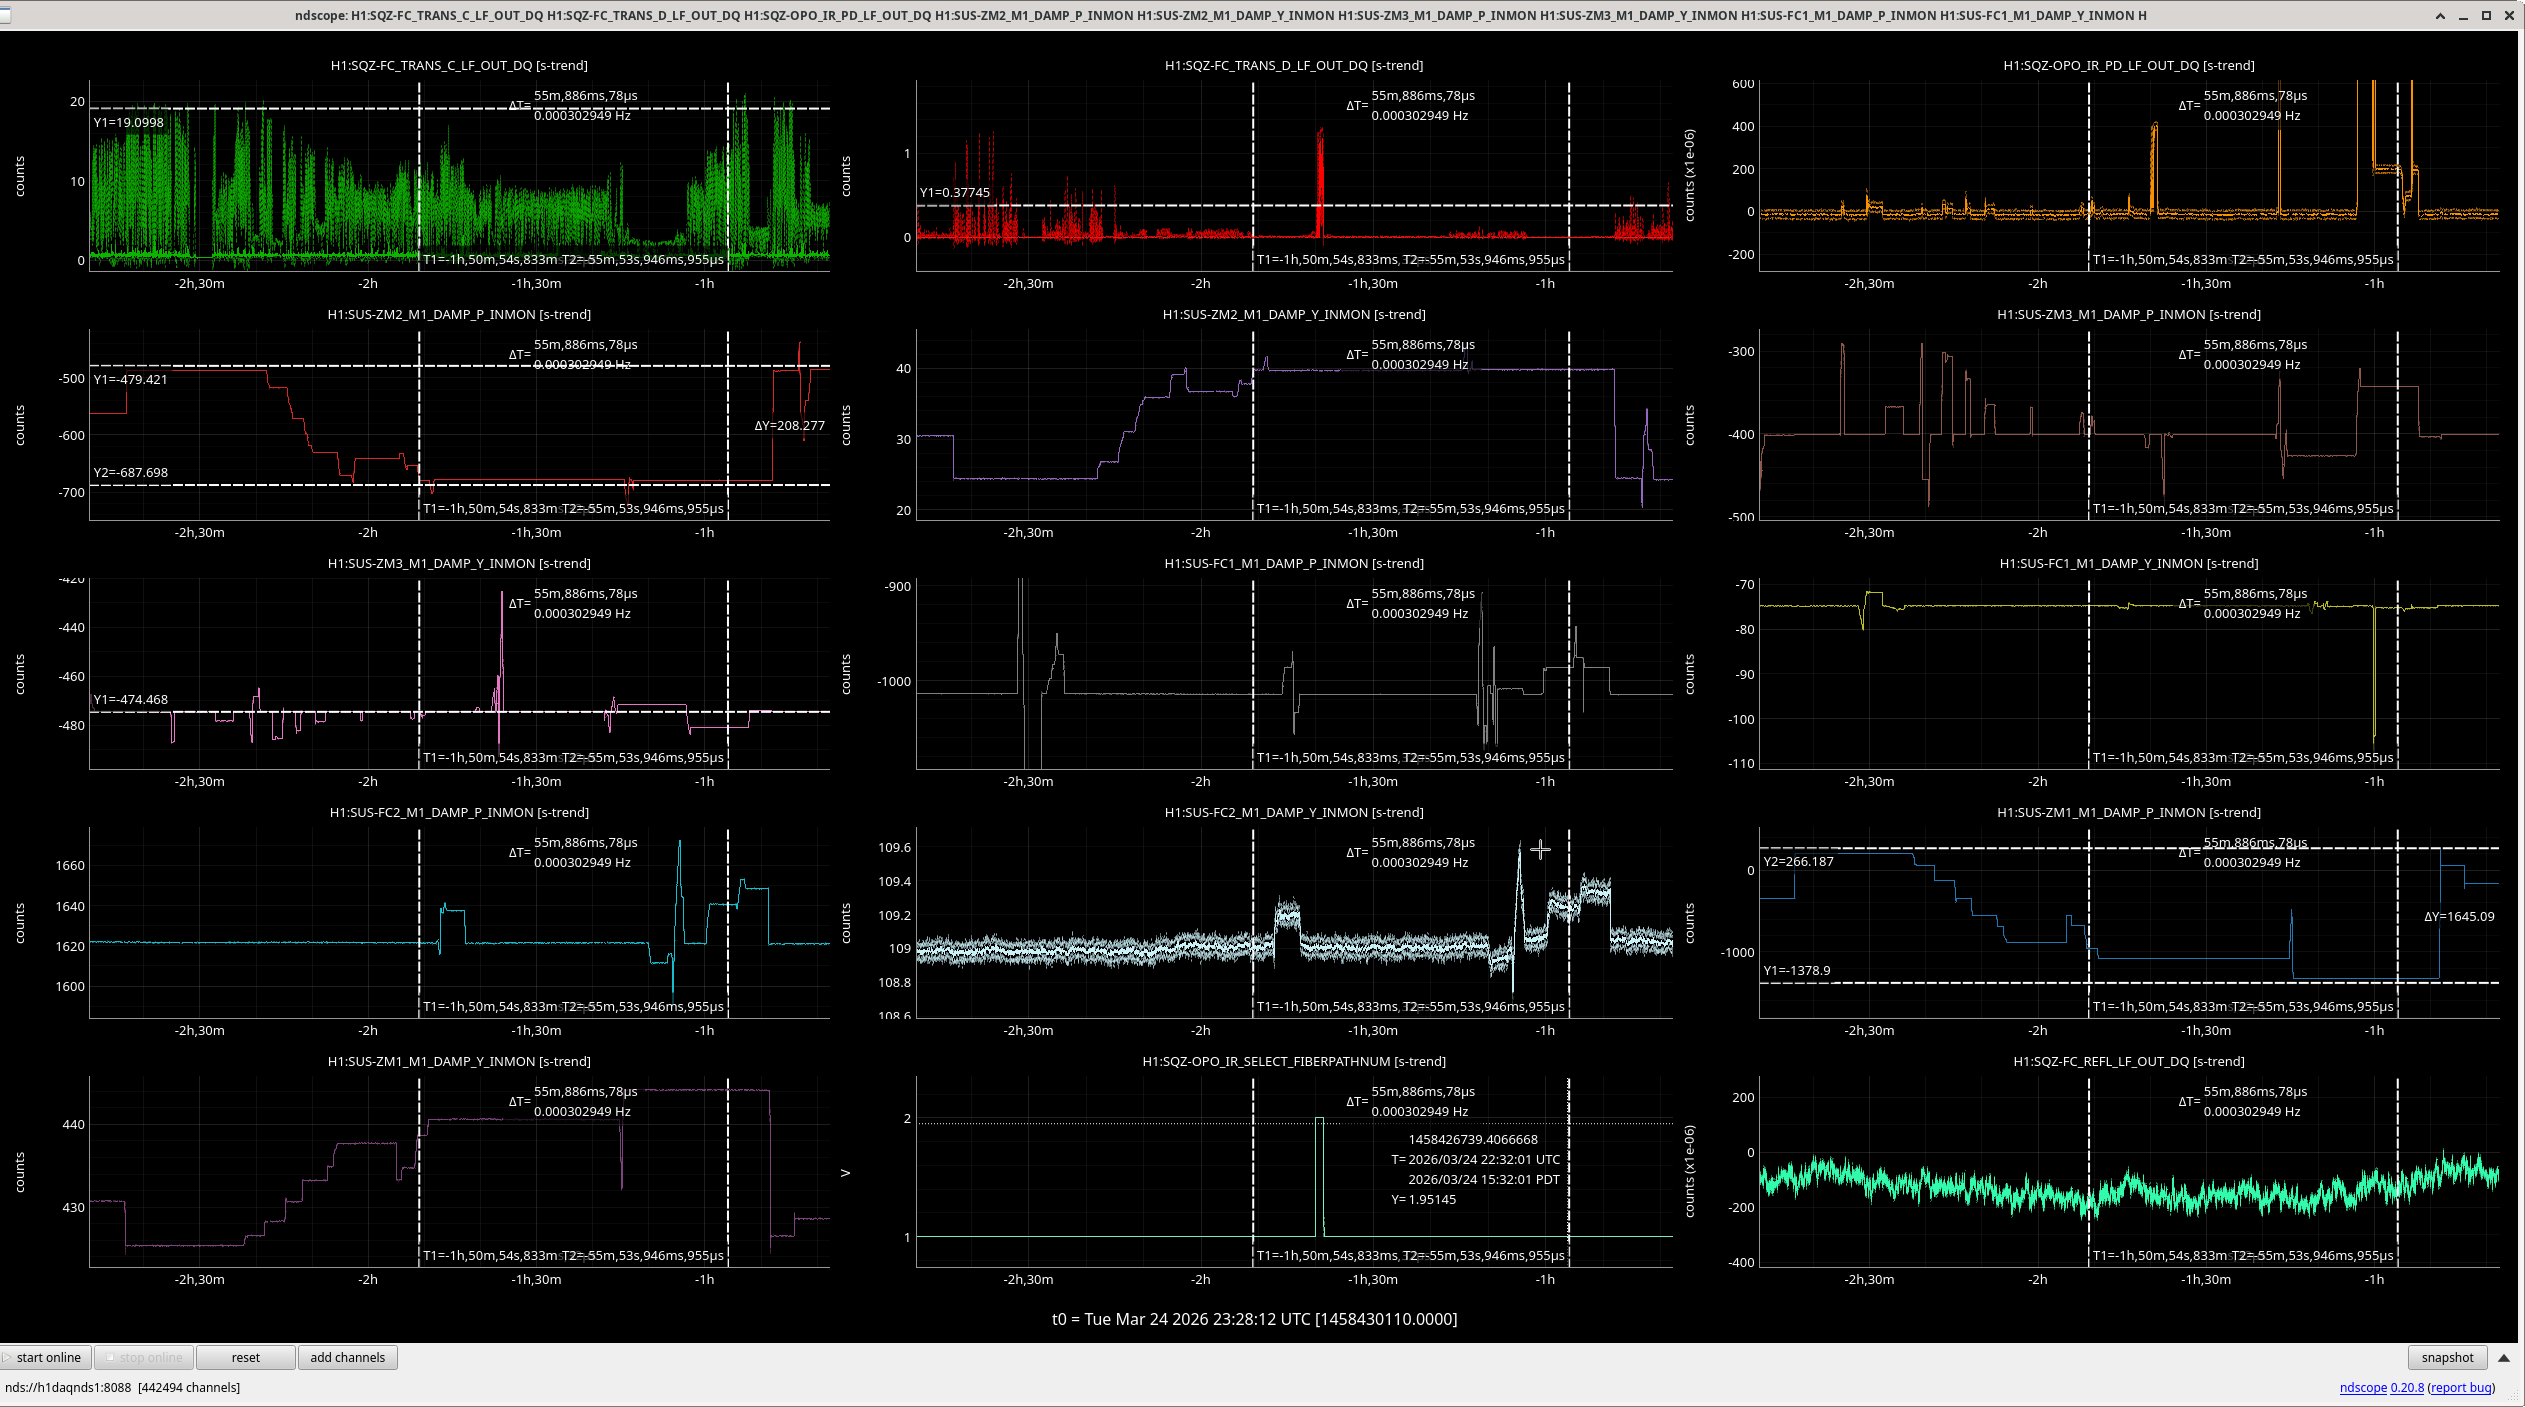
Locked SEED_DITHER with 75mW into fiber. Moved ZM3 to get OPO_IR PD up to max 0.9mW. Opened BeamDiv and after aligning SRM, mis-aligning SR2, could see beams on AS_A,B and C. AS_A and B had a similar size ~60 to reported before (e.g. 86965), but there was less power on AS_C: 4e-4 rather than the previous 7e-4.
We used Ryan's DRMI time from 89573 to put OM1, OM2 and SRM back. The with the SQZ SEED injected, we tried to use SQZ centering loops to center on AS_A and AS_B, this didn't work quite as expected. ZM4 kept saturating although these loops had worked Janaury 19th, before moves were done on the VOPO to help with clipping e.g. 88966.
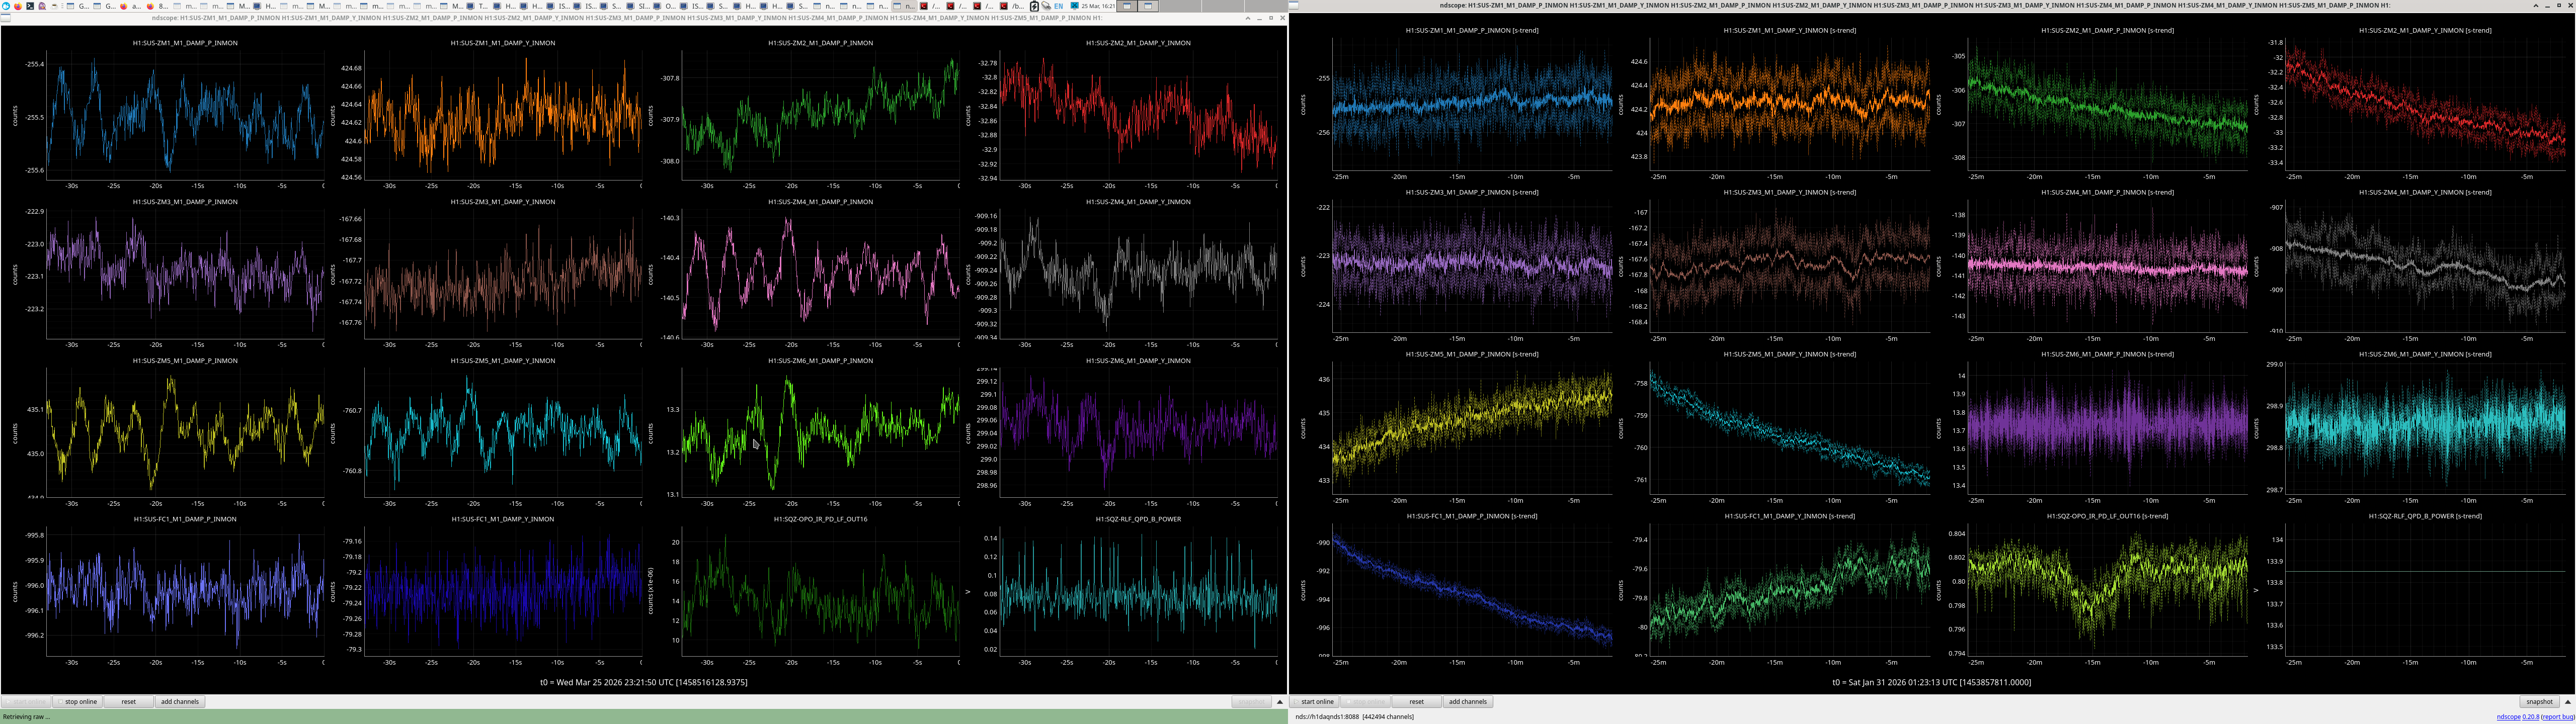
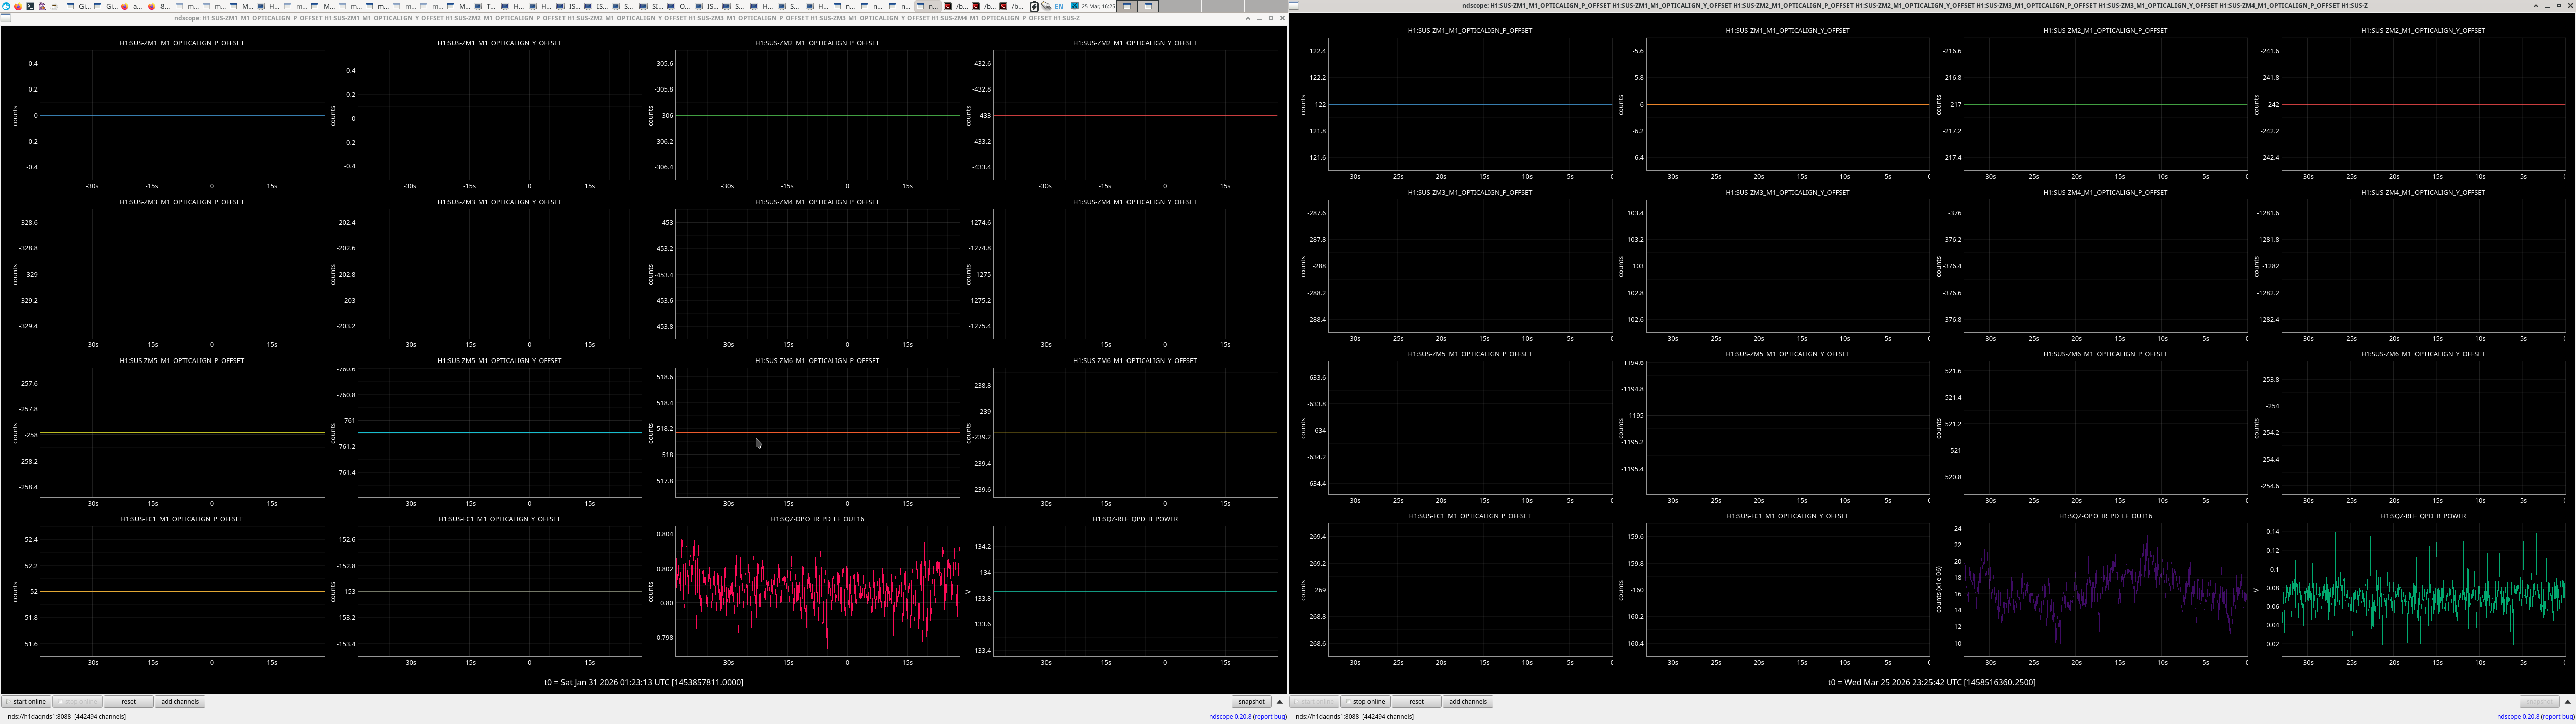
Then went back to alignment on Jan 31st with 88976 with ZM1,2,3, 4,5,6 FC1. And took OM1,2,SRM to the January 19th positions. However here we saw no light on SQZT7 OPO IR PD, HAM7 WFs or in HAM6 on the AS_A,B,C diodes. This was done at 23:10 UTC. Comparisons of osems attached. The sliders to get these osems values are fairly different, see attached, so I also tried going to these slider values, that gave me some light on SQZT7 IR PD, HAM7 WFS and FCES with SEED injected, see attached. HAM6 AS diodes saw nothing.