Elenna, Oli
Summary: OMCB has its DCPDs installed and most of its stoppers (barring one that needs to be retapped + helicoiled). OMCA has been aligned according to the OMCA / OMCB install template and is ready for laser alignment. Cabling for both OMCs should be good to go.
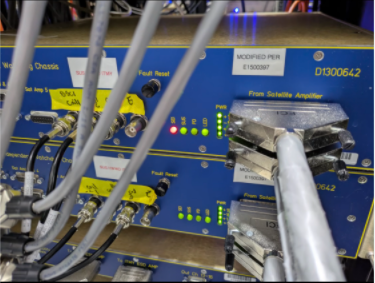
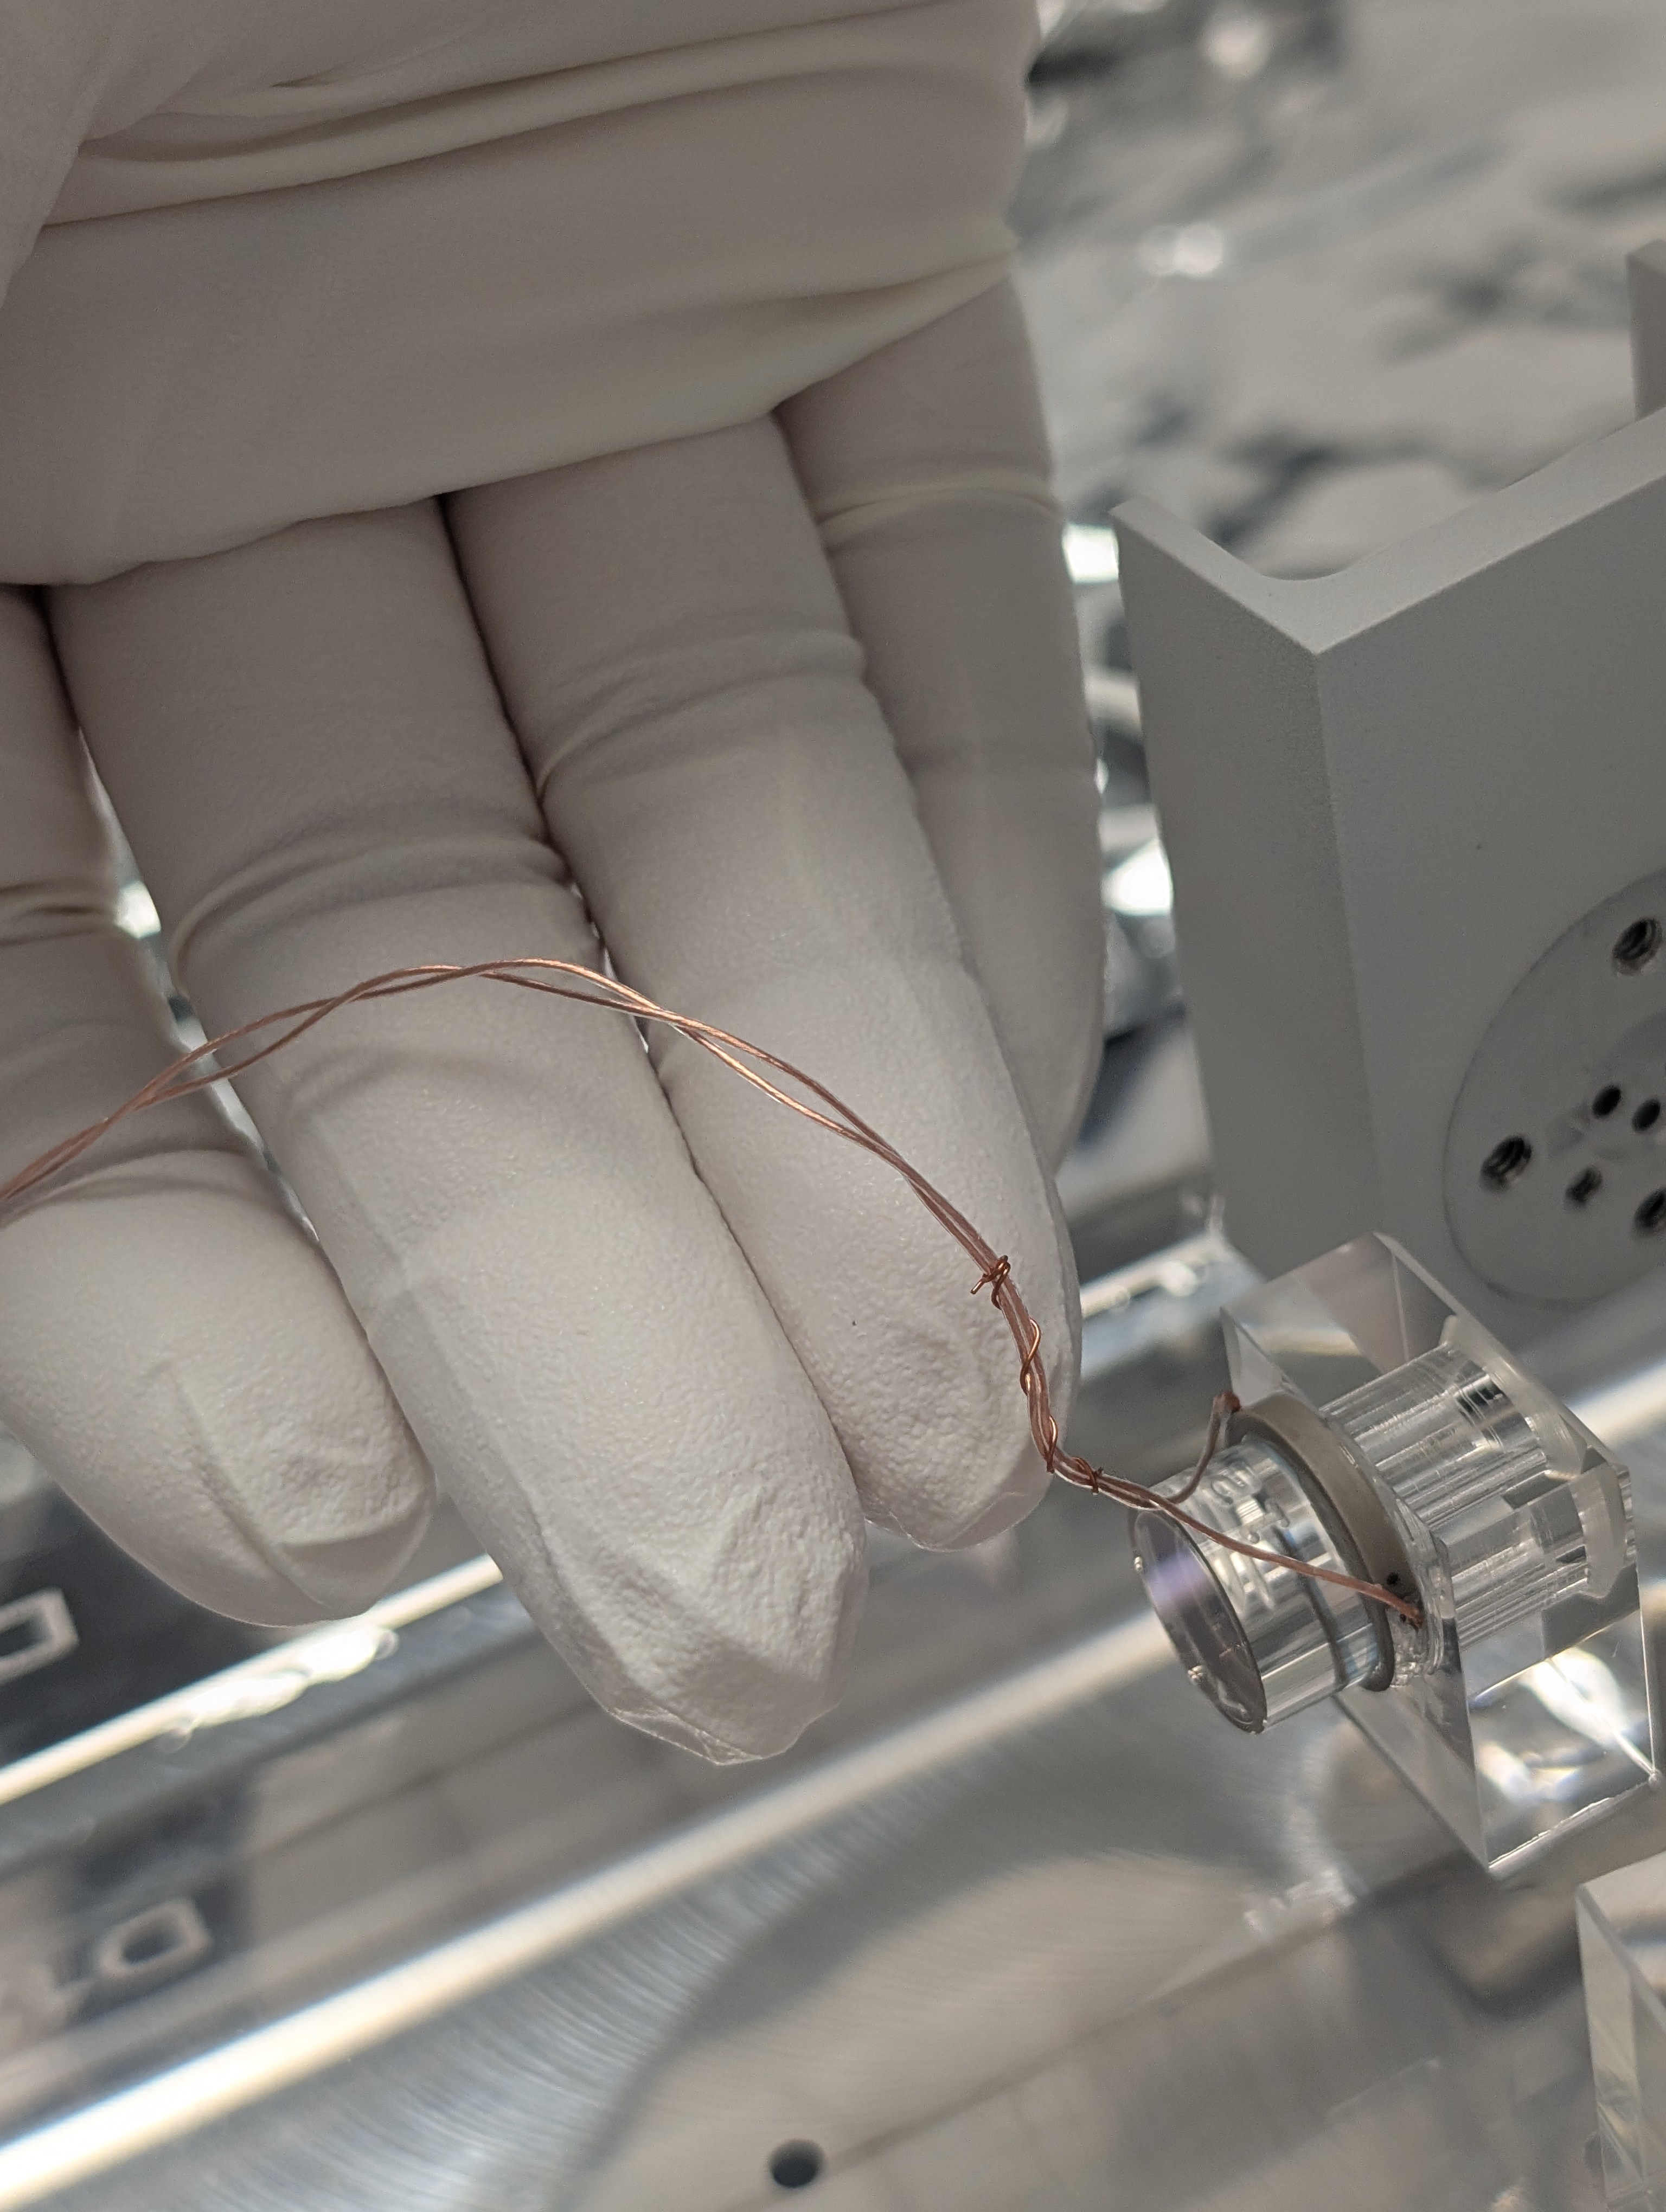
After last week's issue of the OMCB DCPD A (TRANS) missing a diode hole (89583), we were able to clear up the issue and fix it (89606). Elenna then installed the DCPD B (REFL) diode. Note that once again there were tiny metal shavings below where the DCPD's were installed, which we picked up with a qtip that we wet with iso. Once we had both installed (pic), we installed the rest of the stoppers around OMCB. The only one we didn't install is one of the vertical stops. This is because there was an issue with the helicoil last week, and we ended up having to remove it. We think this might be due to an issue with the threads, so we are waiting on a 3/8"-24 tap to retap the hole before installing a new helicoil. Because we don't have this stop yet, it doesn't really make sense to fasten on the butter dish, but we might just sit it on today to hinder dust accumulation.
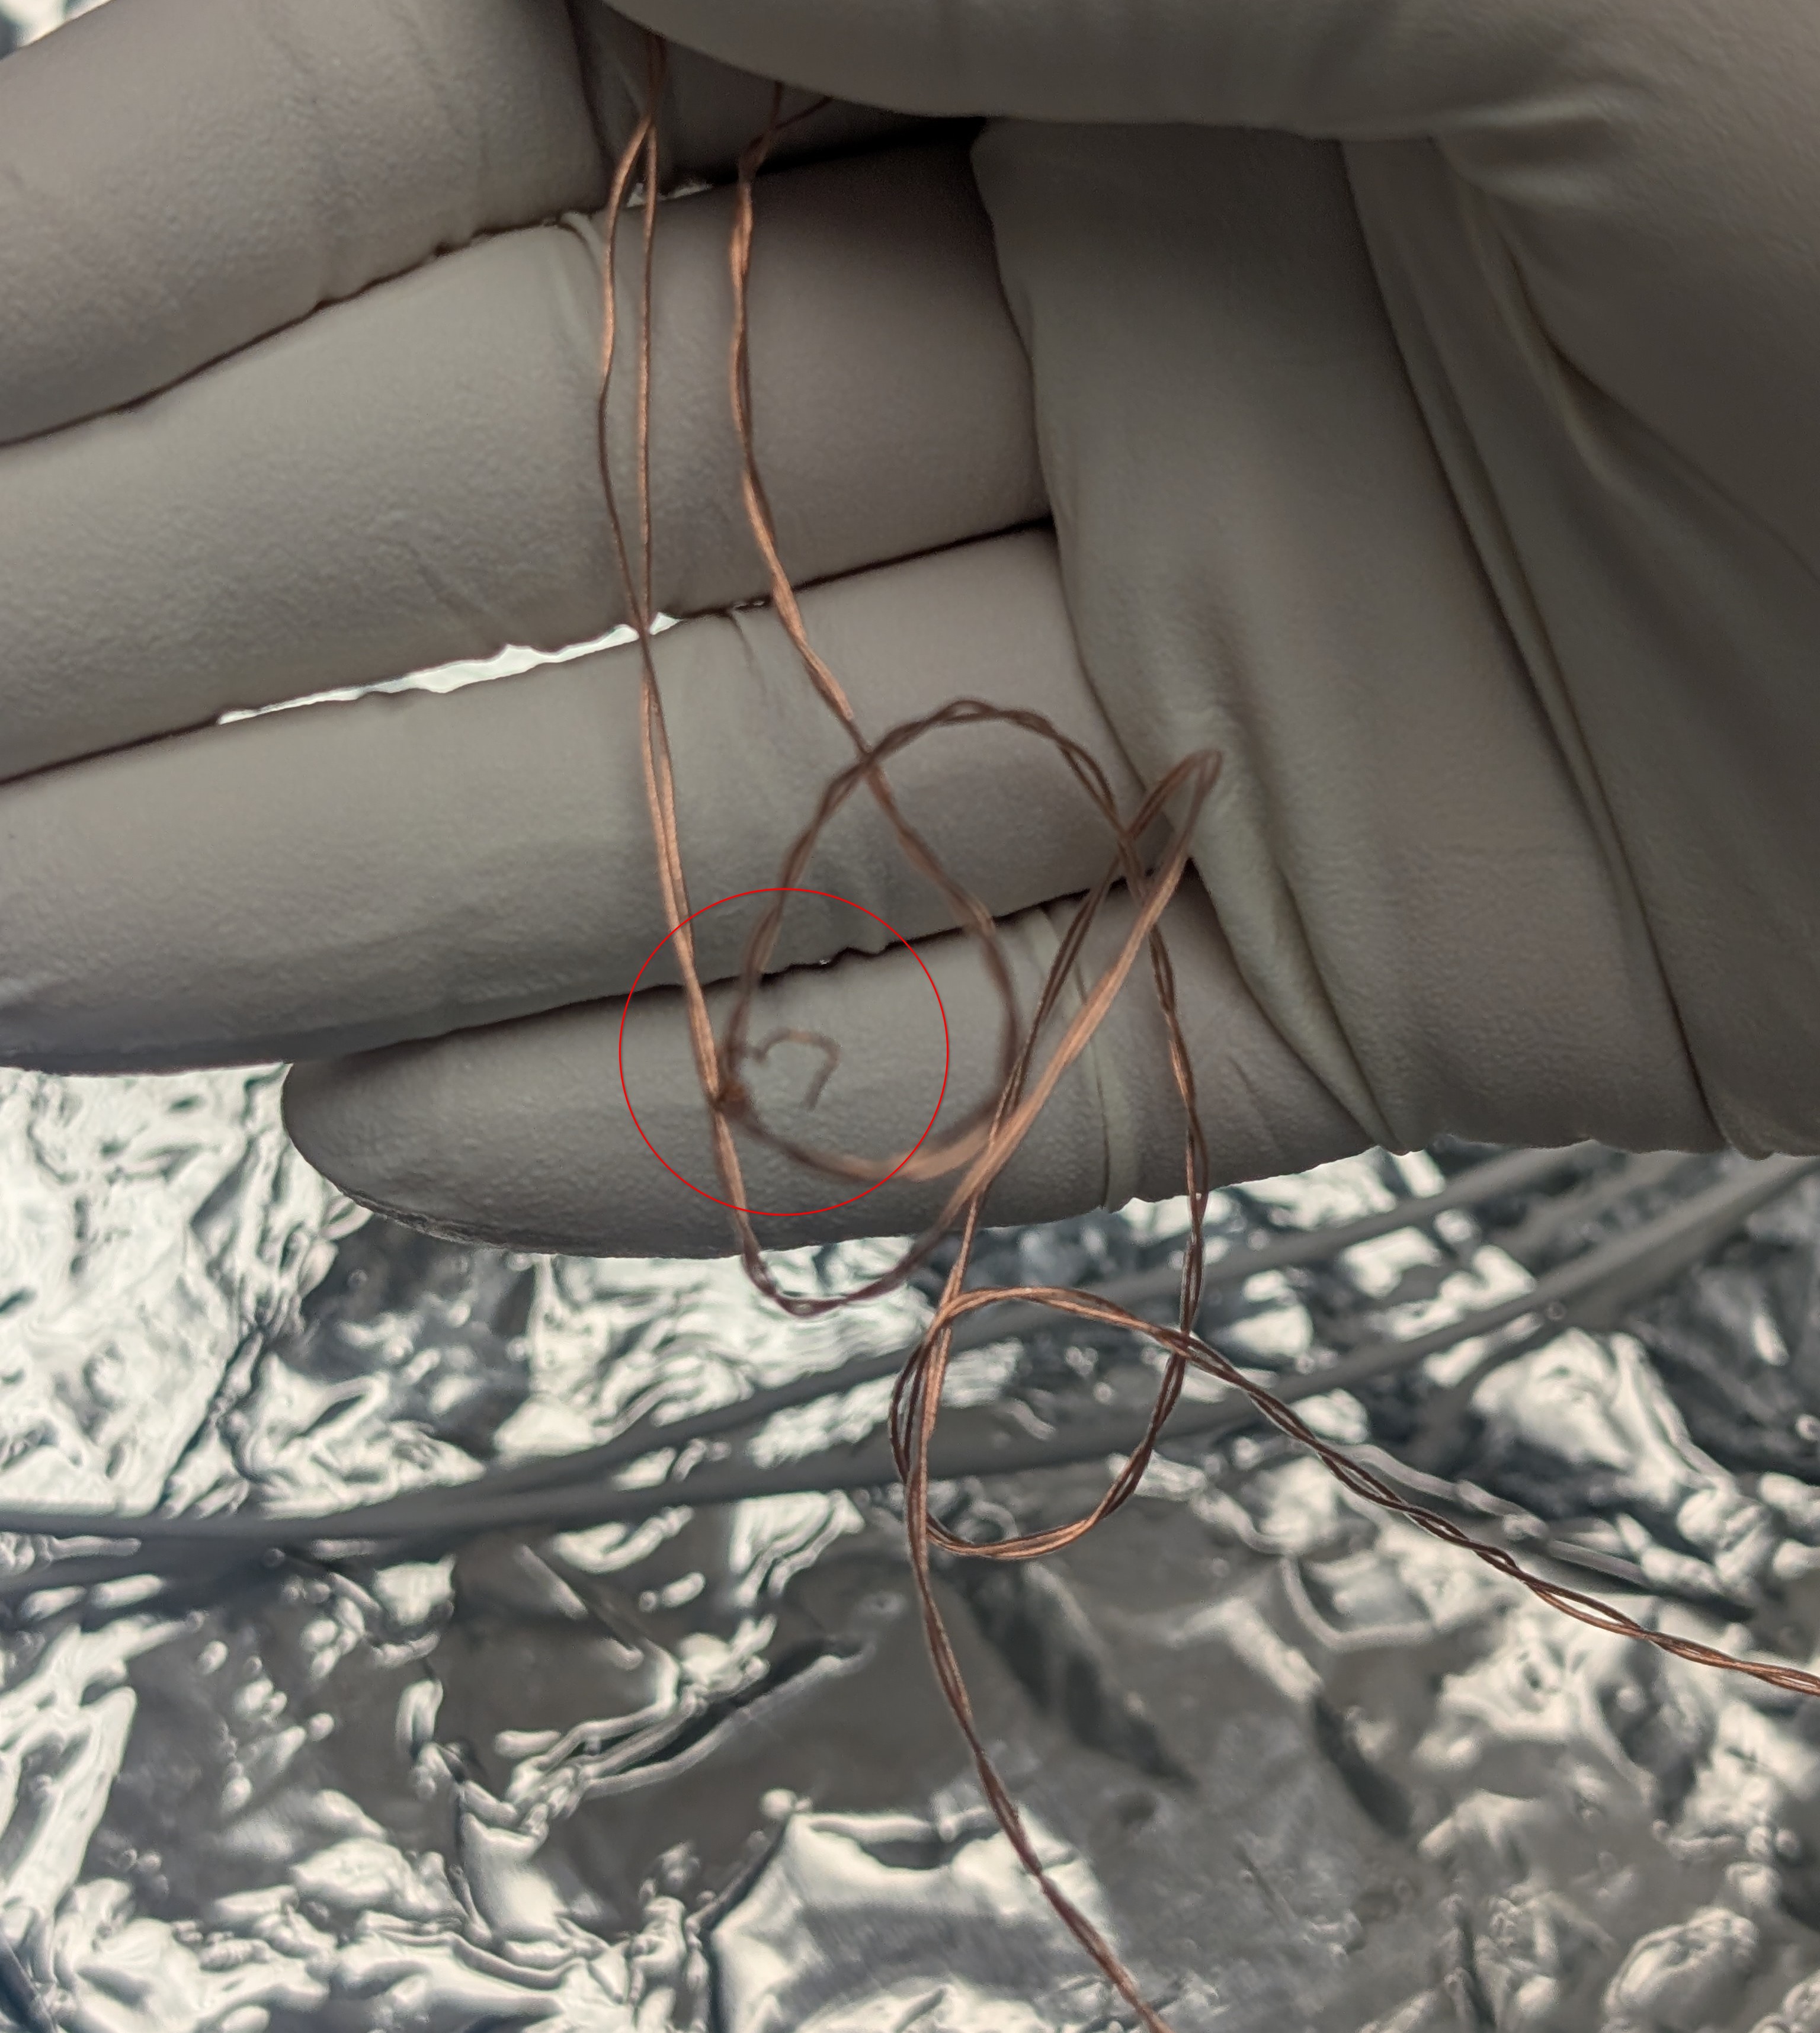
We also realized that the PZT cables were going to be way too short to reach the cable pylons for both OMCA and OMCB, so we very carefully opened the peak cable wraps on the OMCs and took out what we think should be enough. On OMCB we noticed that the little copper wrap for one of the PZTs was not right above the PZT as it should be, but instead was on the other side of the peak cable wrap and was only wrapped loosly around one of the cables. Because of this we just removed the wrap. The cables right above the PZT are looking fine and don't look like they need anything to hold them together.
I had been confused about the OMCA / OMCB install template for the past few days, since installing it was putting OMCB further back in its slot than OMCA, but I was able to confirm yesterday in eDrawings that OMCB is actually supposed to be an extra 1 mm away from the front of its slot as compared to OMCA, so we moved OMCA into position and bolted it down.
I also went in and installed the magnet mounts for the OSEM magnets (without the magnets), as well as the big mass on the back of the BHSS.
Installed serial numbers:
OMCB (SN 105)
- DCPD A (TRANS)
- DCPD: 1C-14
- Housing: SN 002
- DCPD B (REFL)
- DCPD: 1C-10
- Housing: SN 008


Tagging For EPO photos.
The naming convention listed above is incorrect. Please refer to alog 89669 for correct information.