ryan.short@LIGO.ORG - posted 16:04, Tuesday 25 June 2024 (78656)
Ops Eve Shift Start
TITLE: 06/25 Eve Shift: 2300-0800 UTC (1600-0100 PST), all times posted in UTC
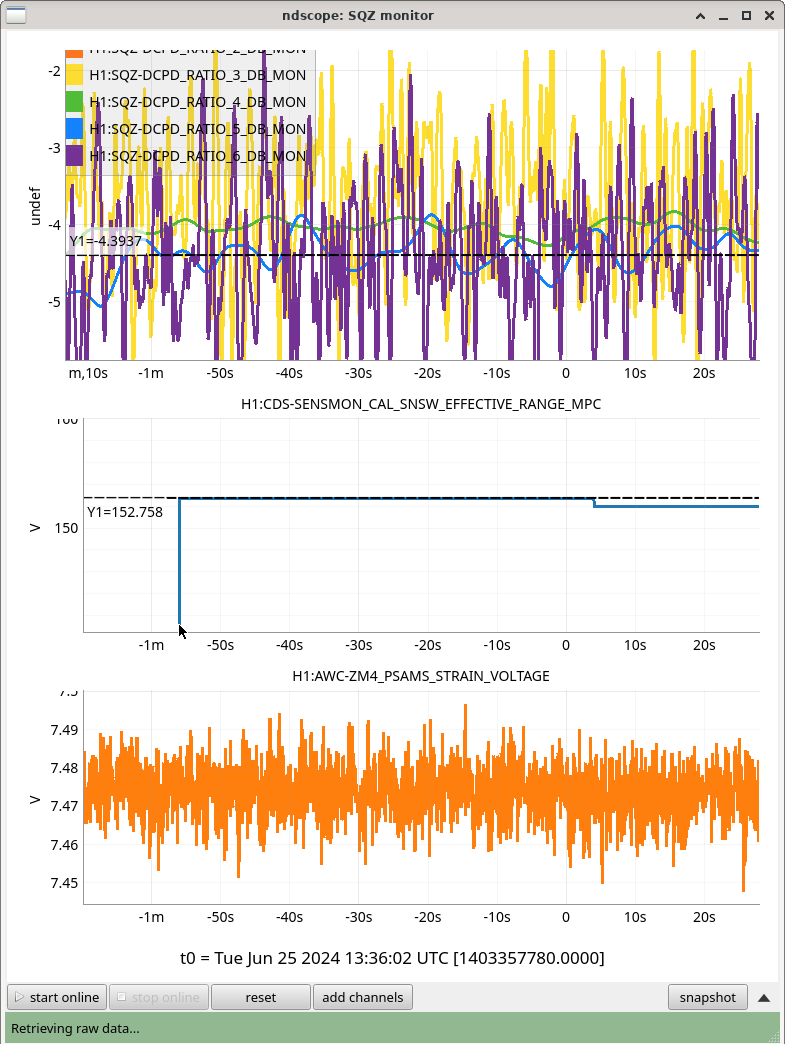
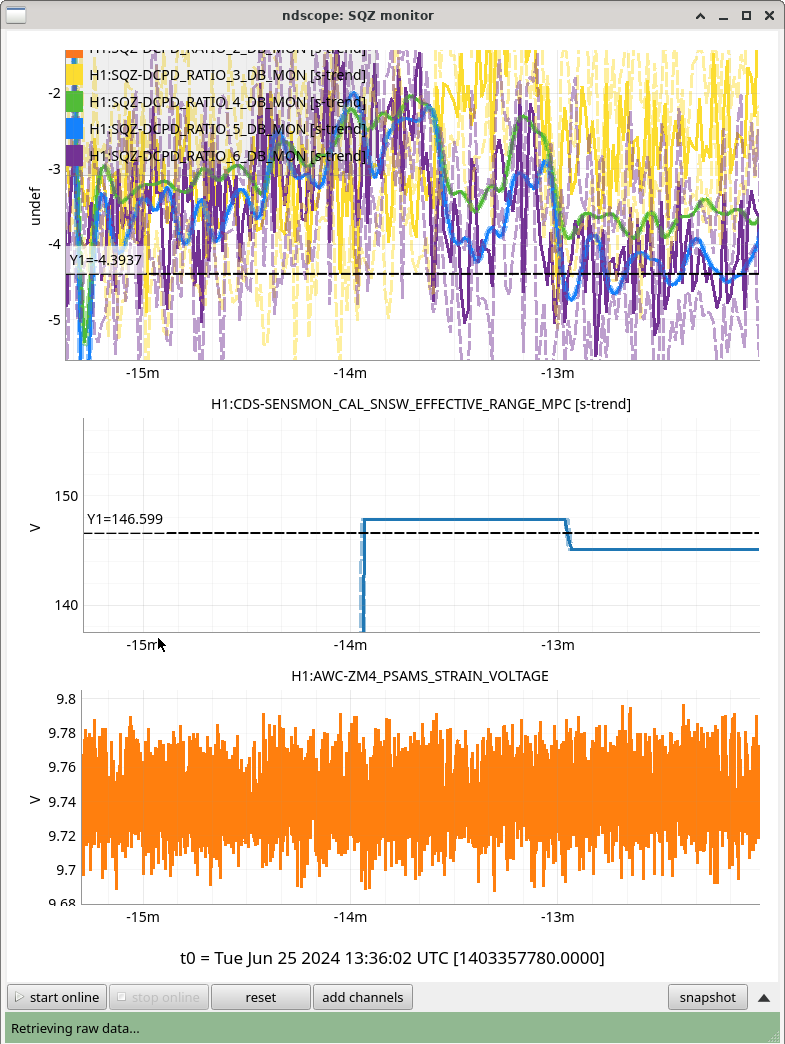
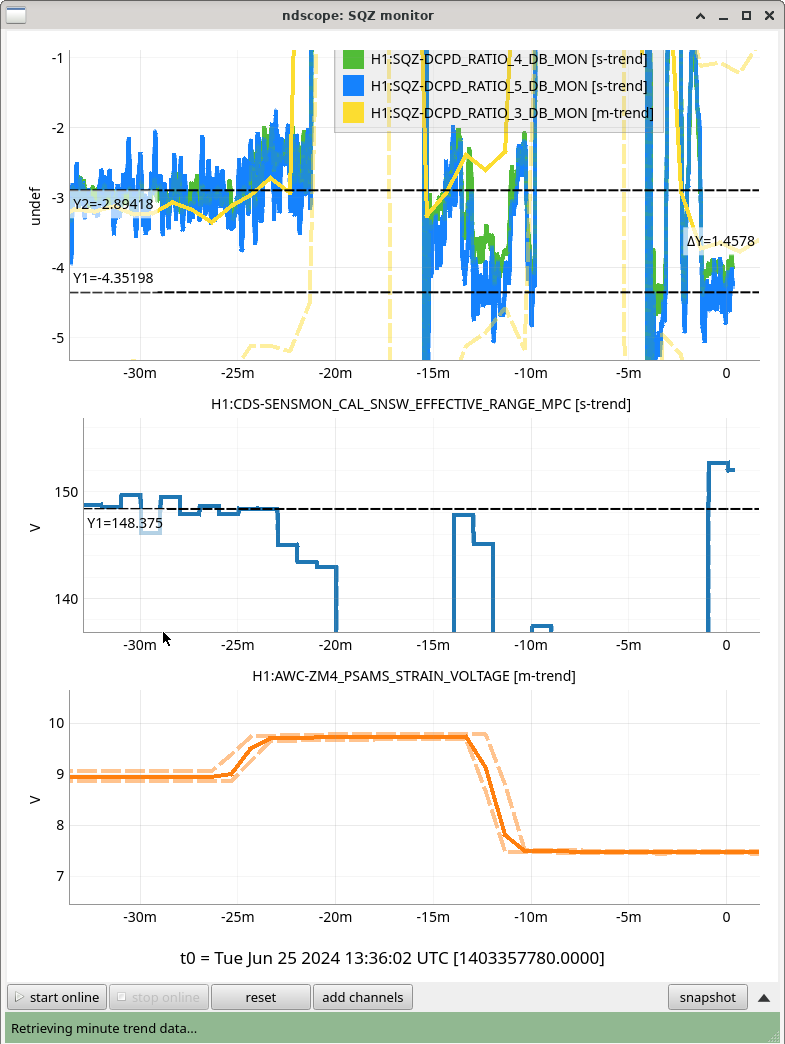
STATE of H1: Observing at 146Mpc
OUTGOING OPERATOR: Oli
CURRENT ENVIRONMENT:
SEI_ENV state: CALM
Wind: 14mph Gusts, 9mph 5min avg
Primary useism: 0.01 μm/s
Secondary useism: 0.07 μm/s
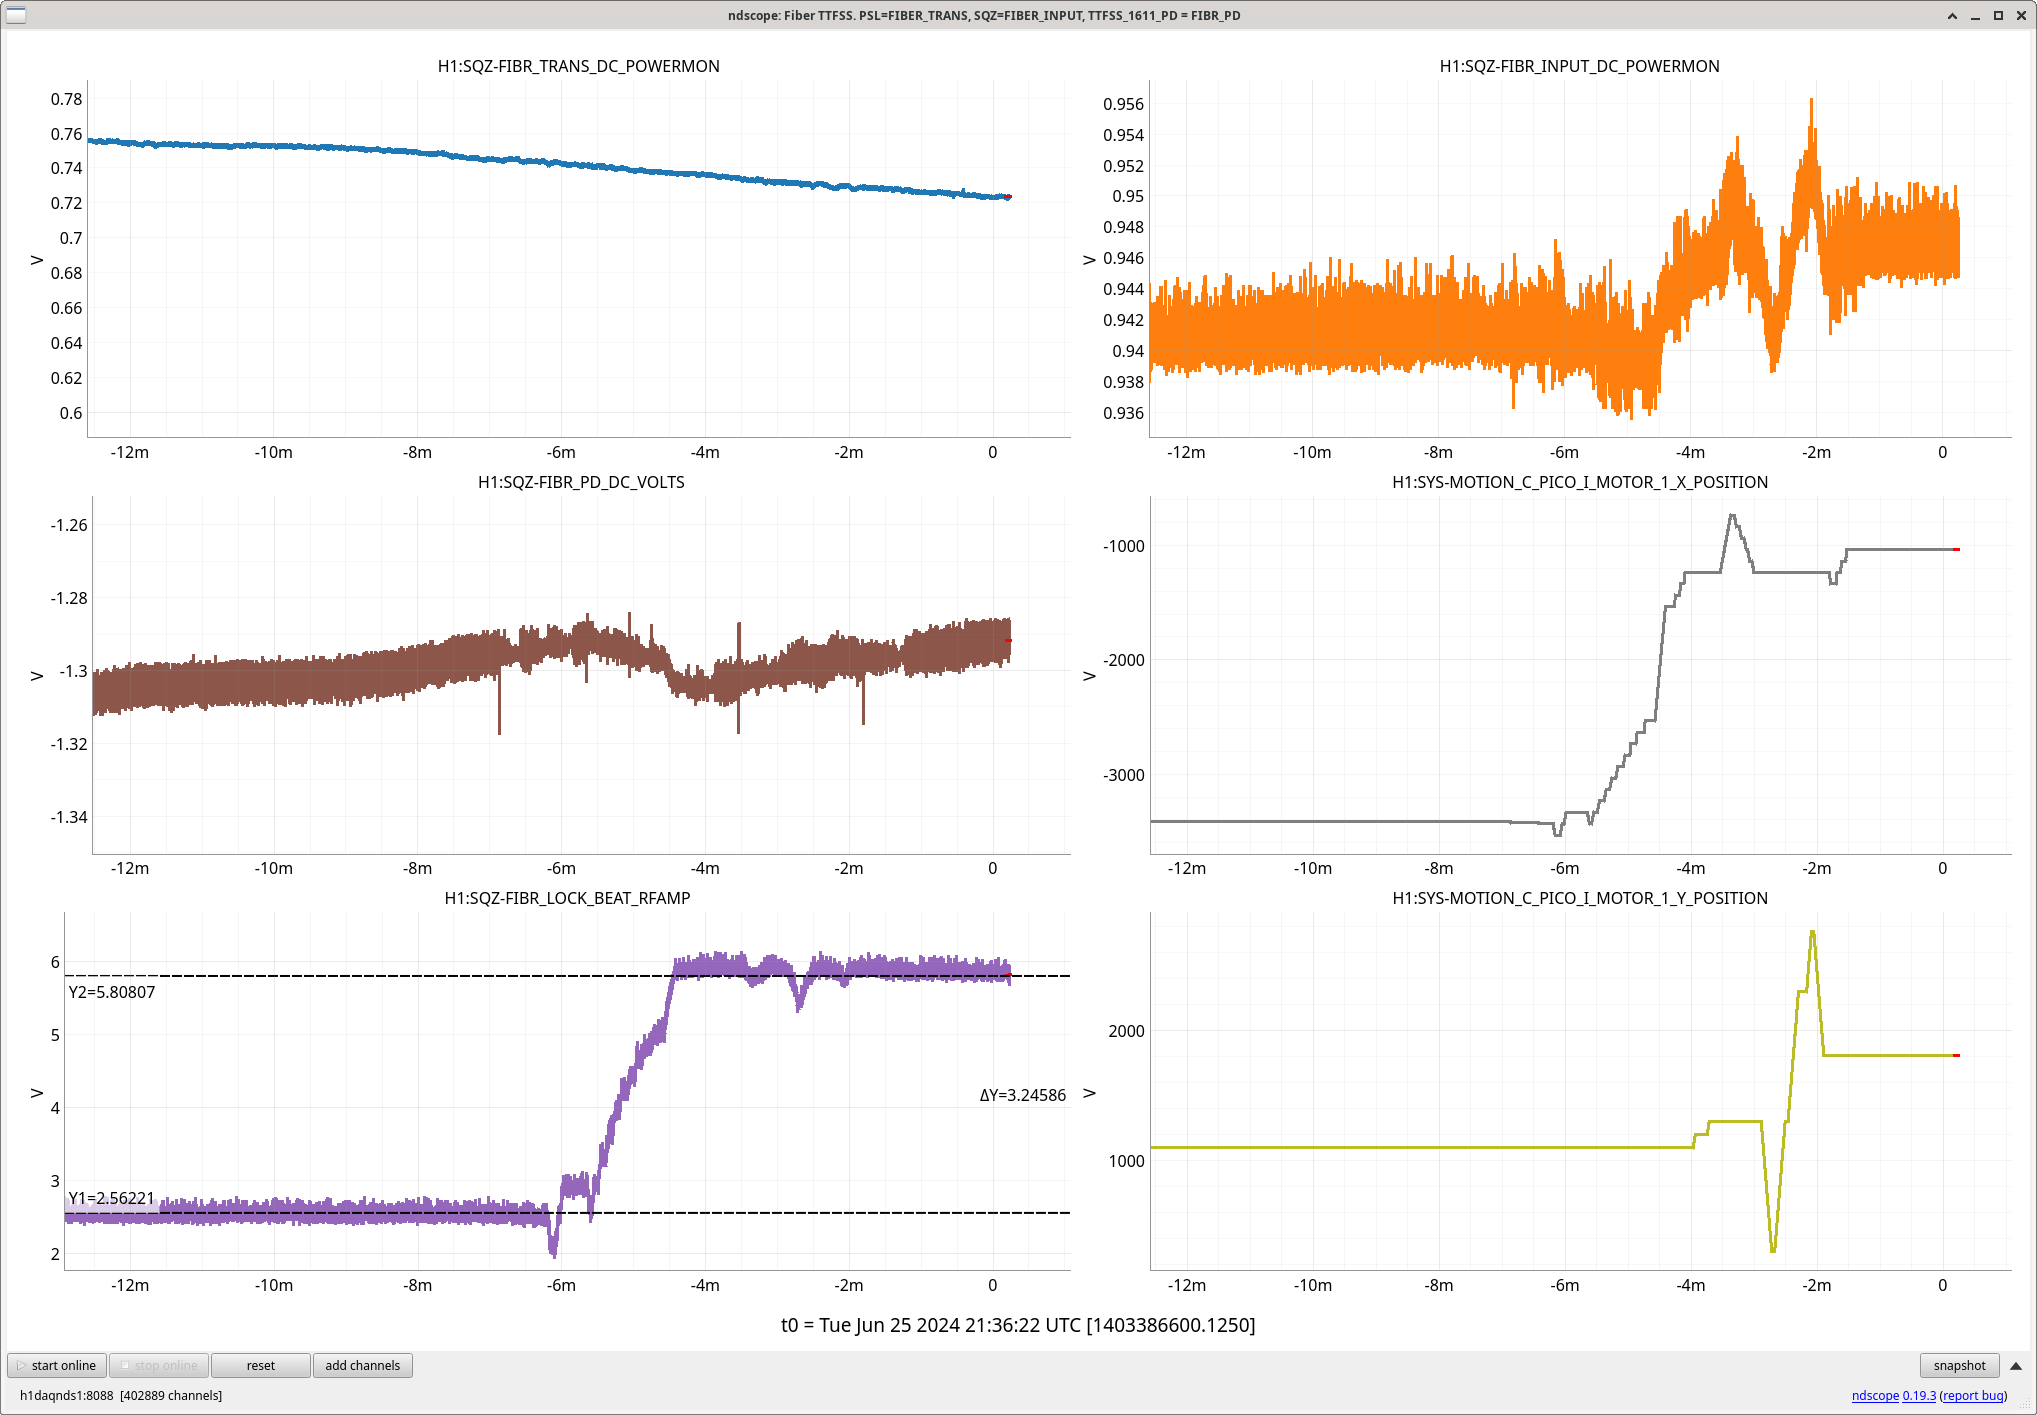
QUICK SUMMARY: H1 has been locked and observing for 1.5 hours. Sounds like relocking after maintenance went smoothly.
- Norco truck is still at MX
- Wind and microseism are low
- All other systems nominal