jenne.driggers@LIGO.ORG - posted 17:52, Thursday 12 March 2026 - last comment - 21:19, Thursday 12 March 2026(89492)
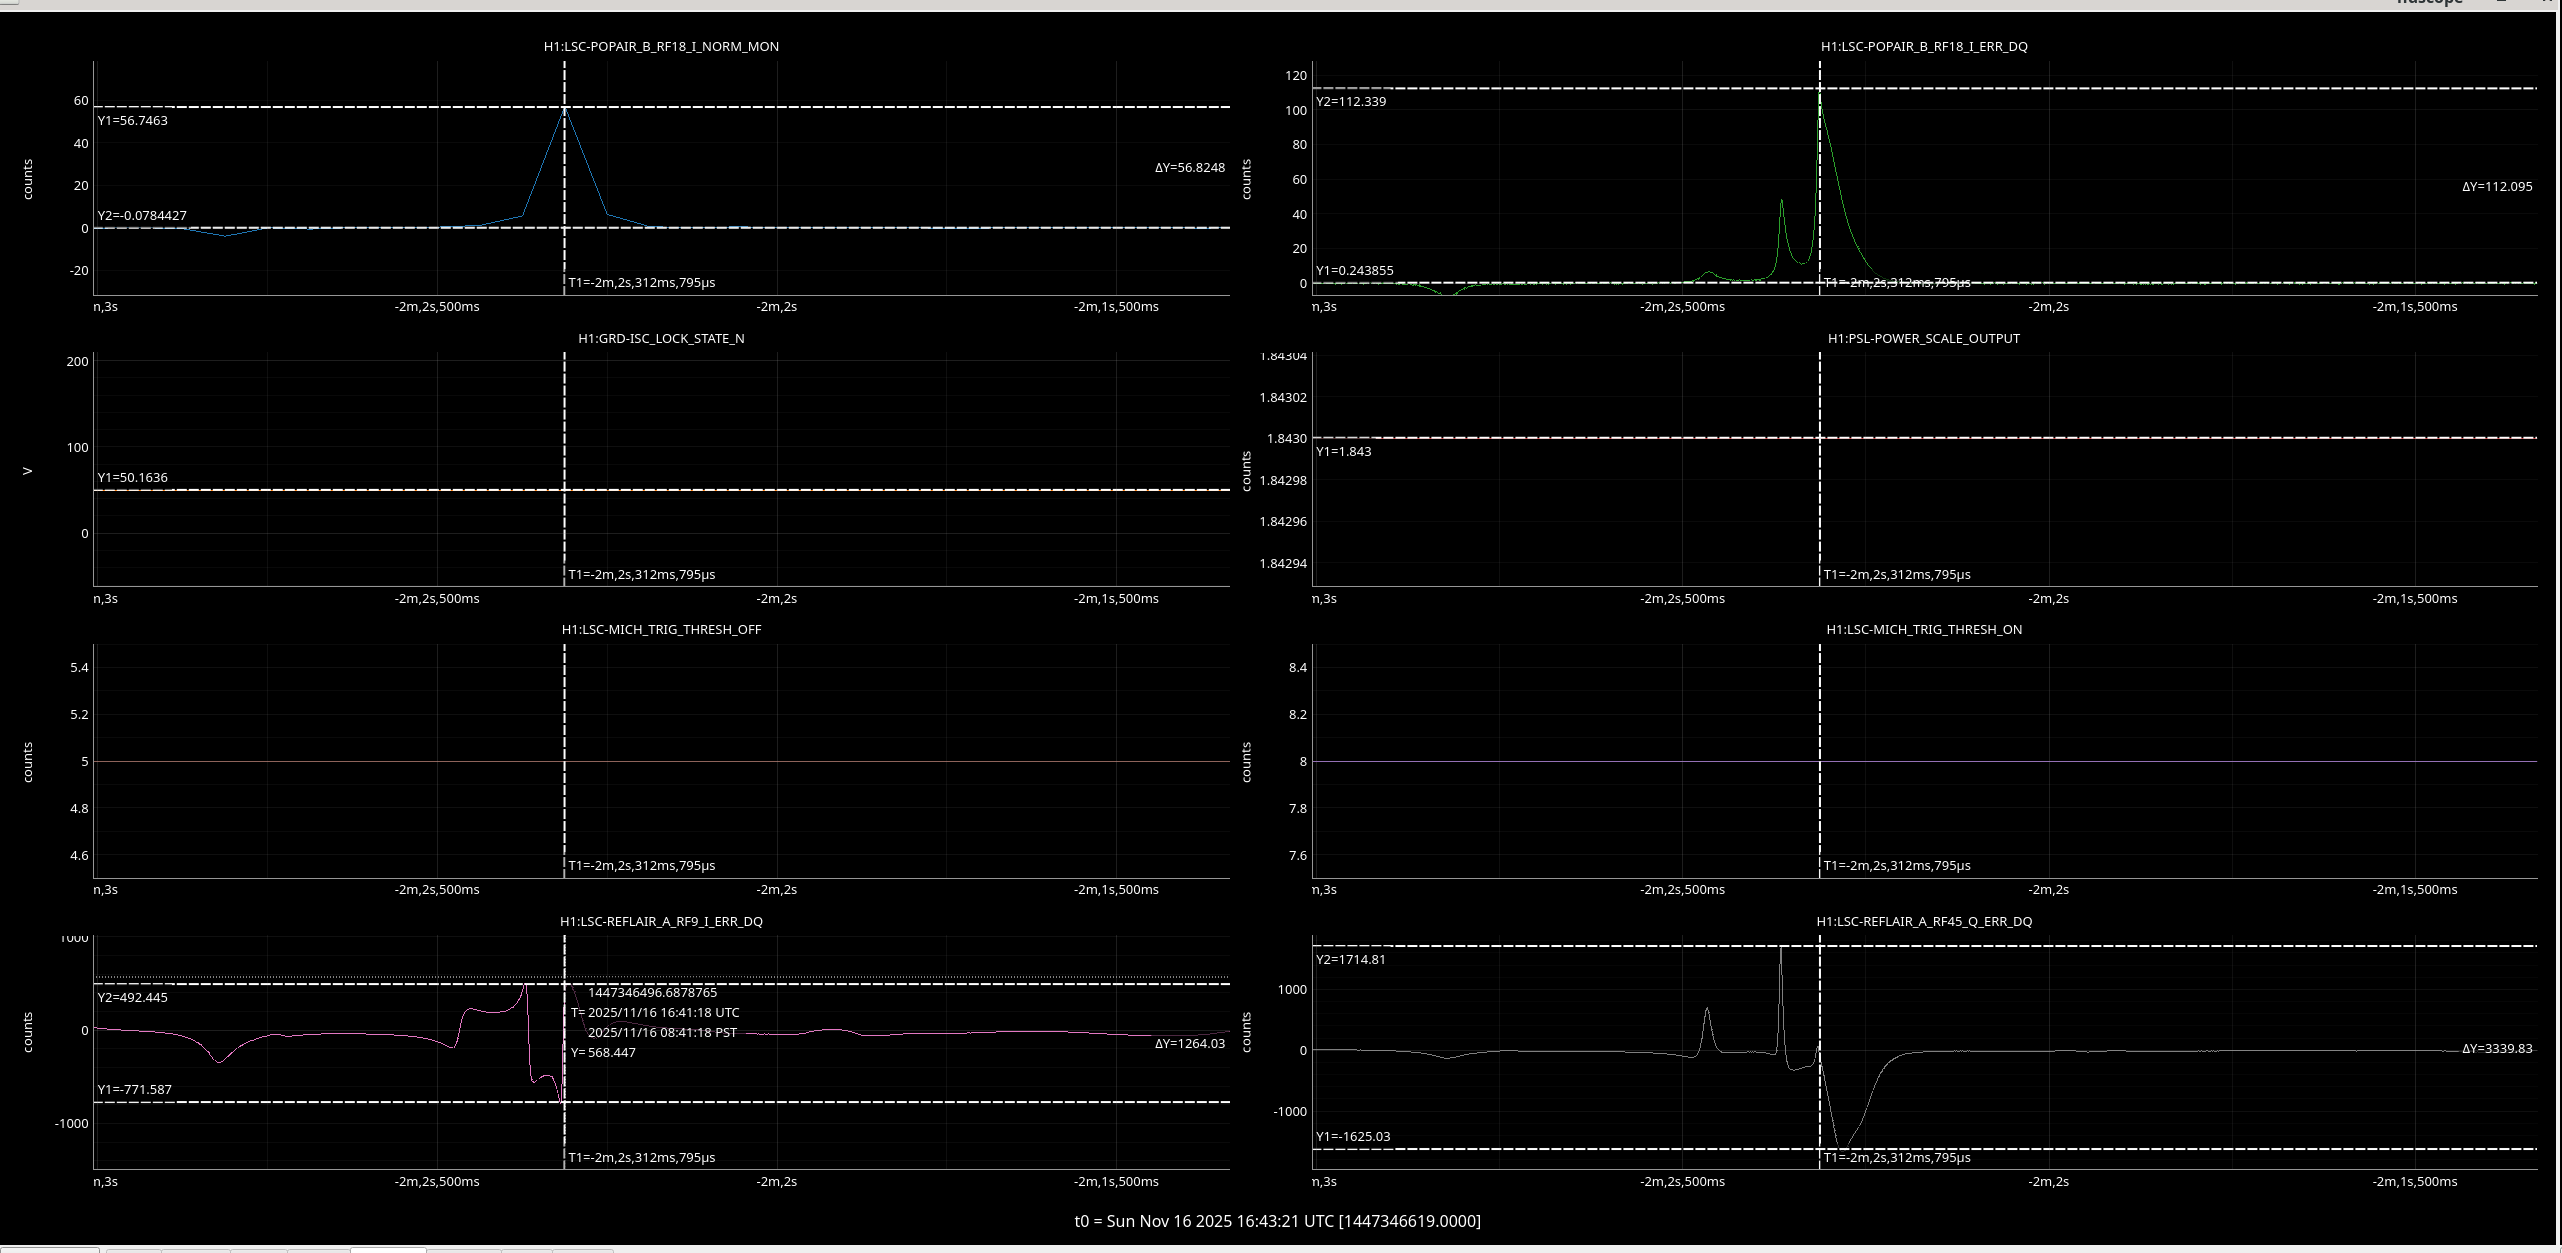
Time of PRMI locked from Nov 16 2025
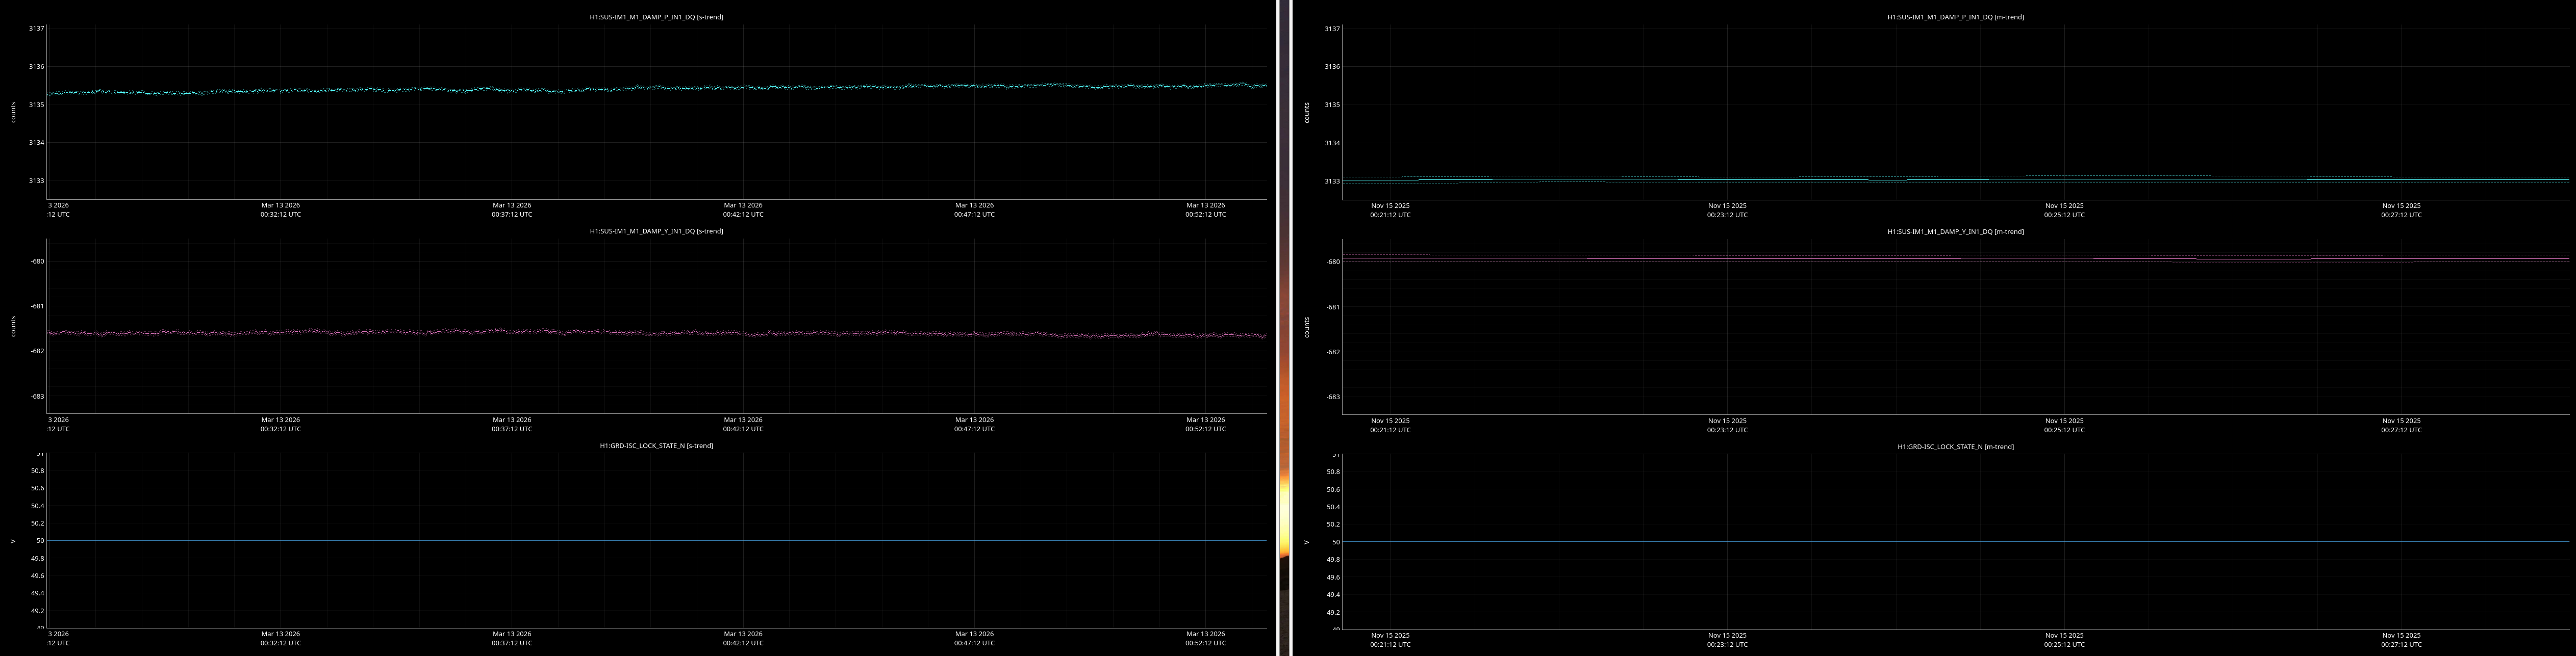
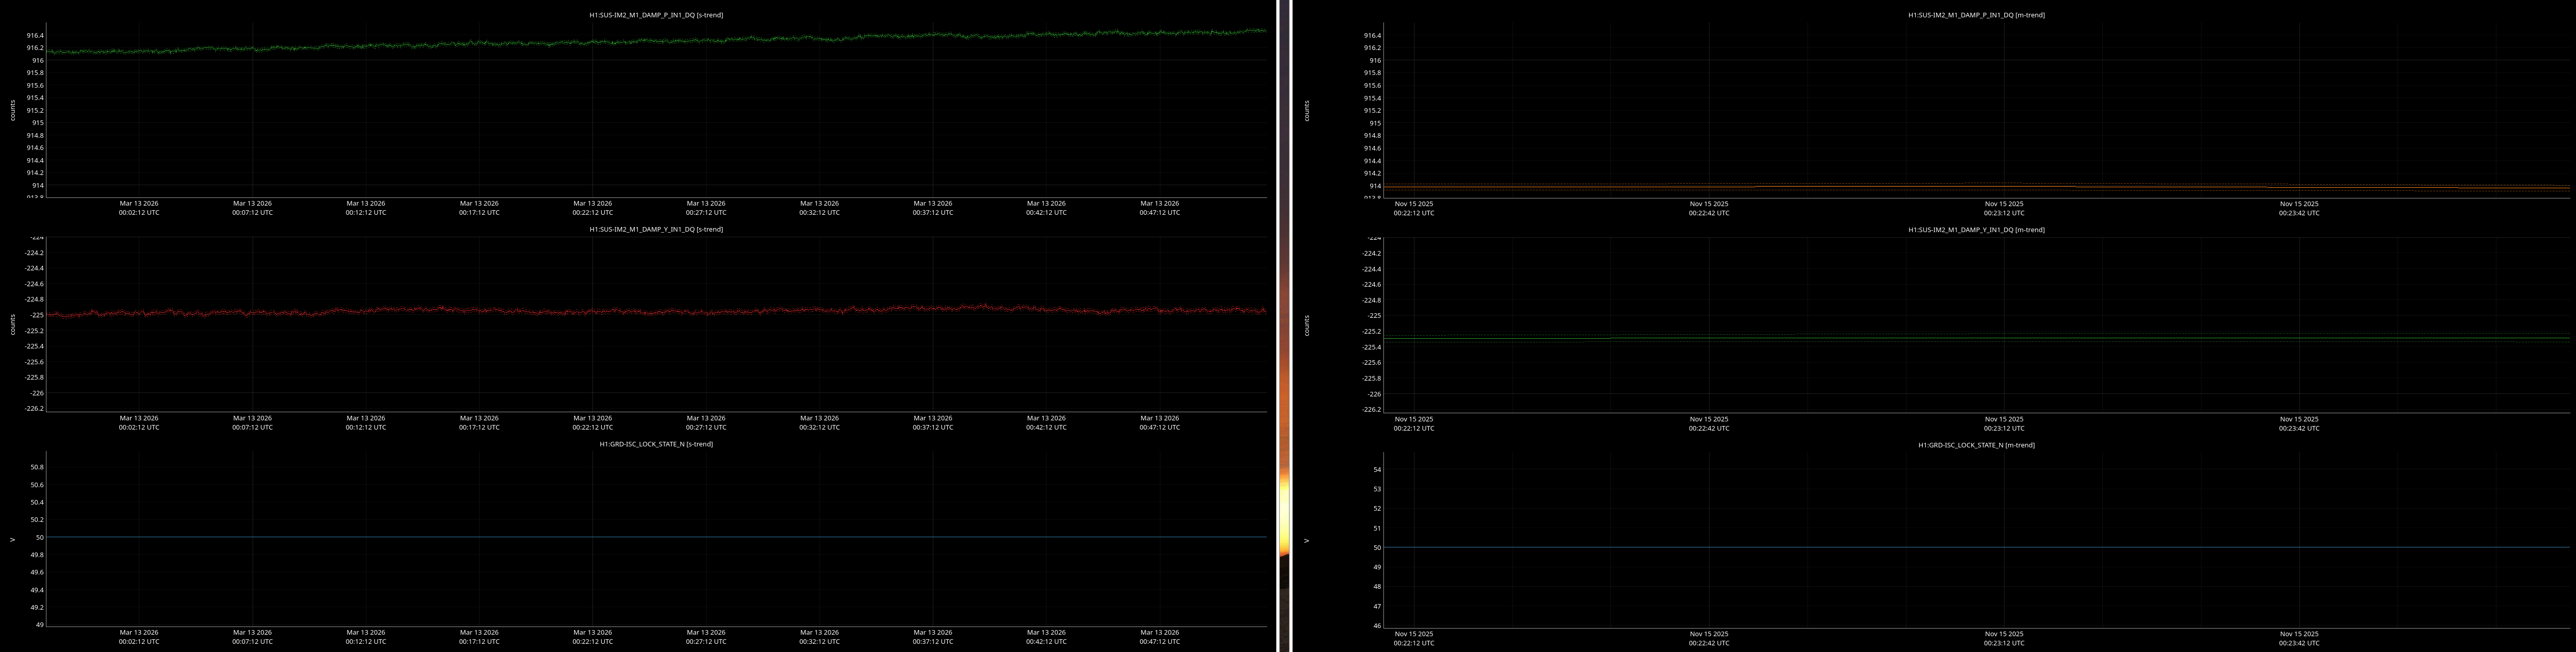
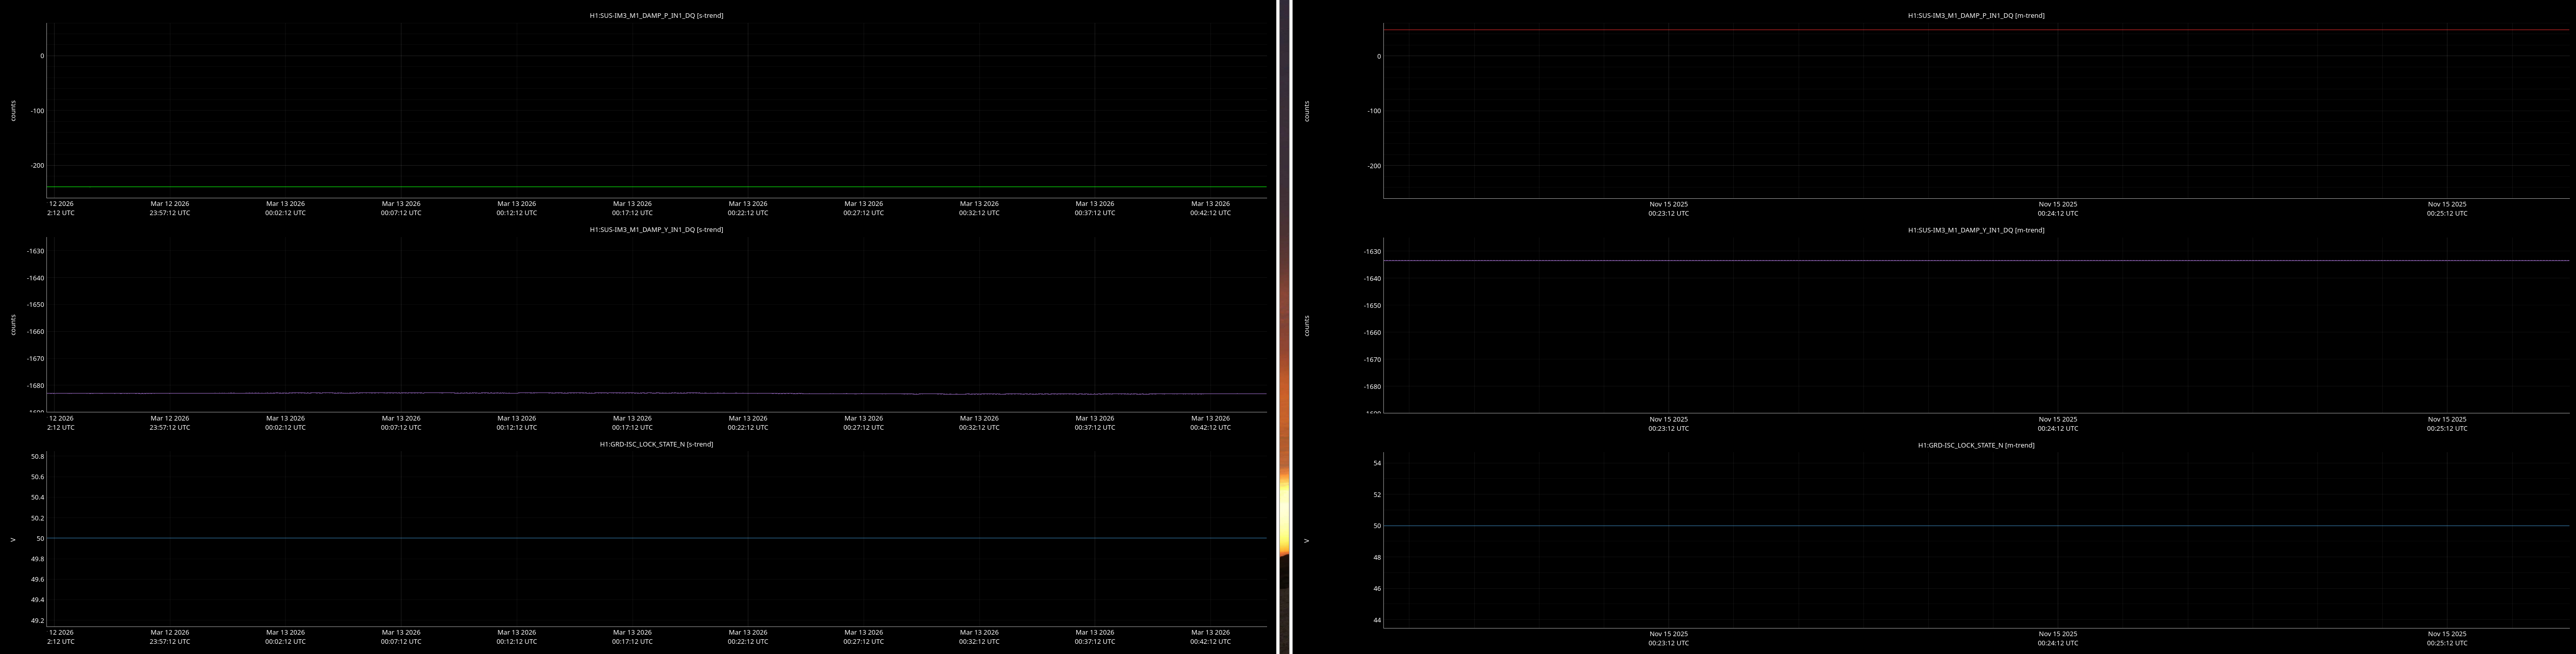
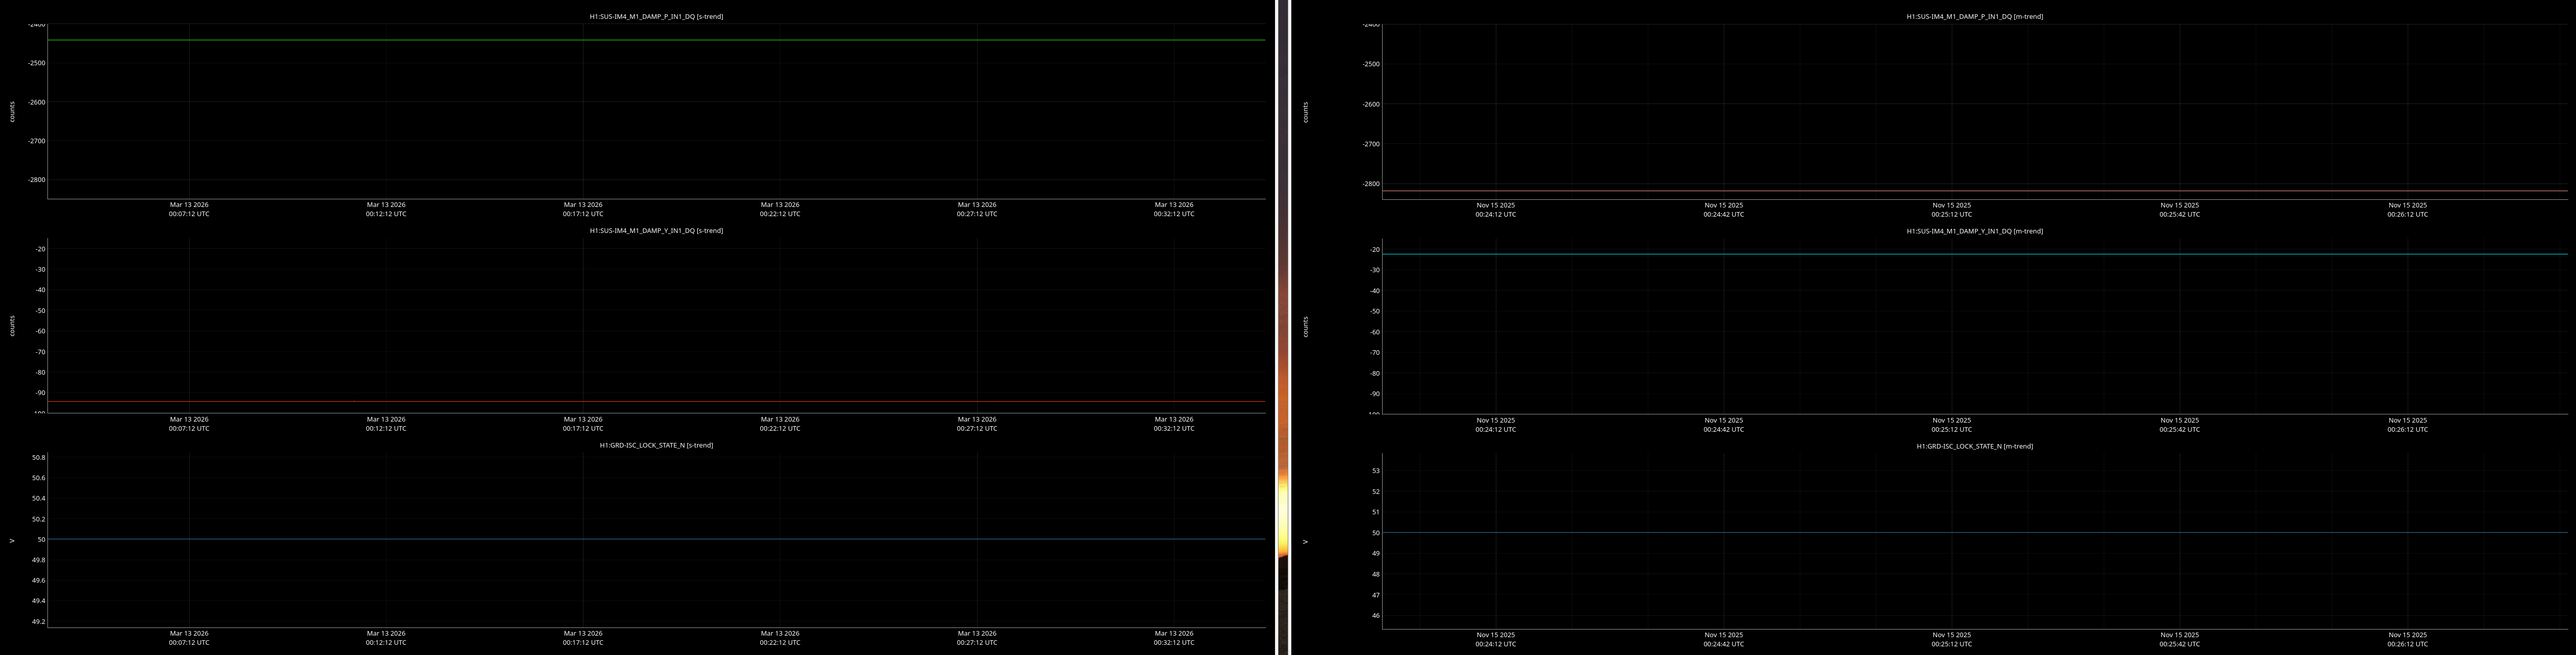
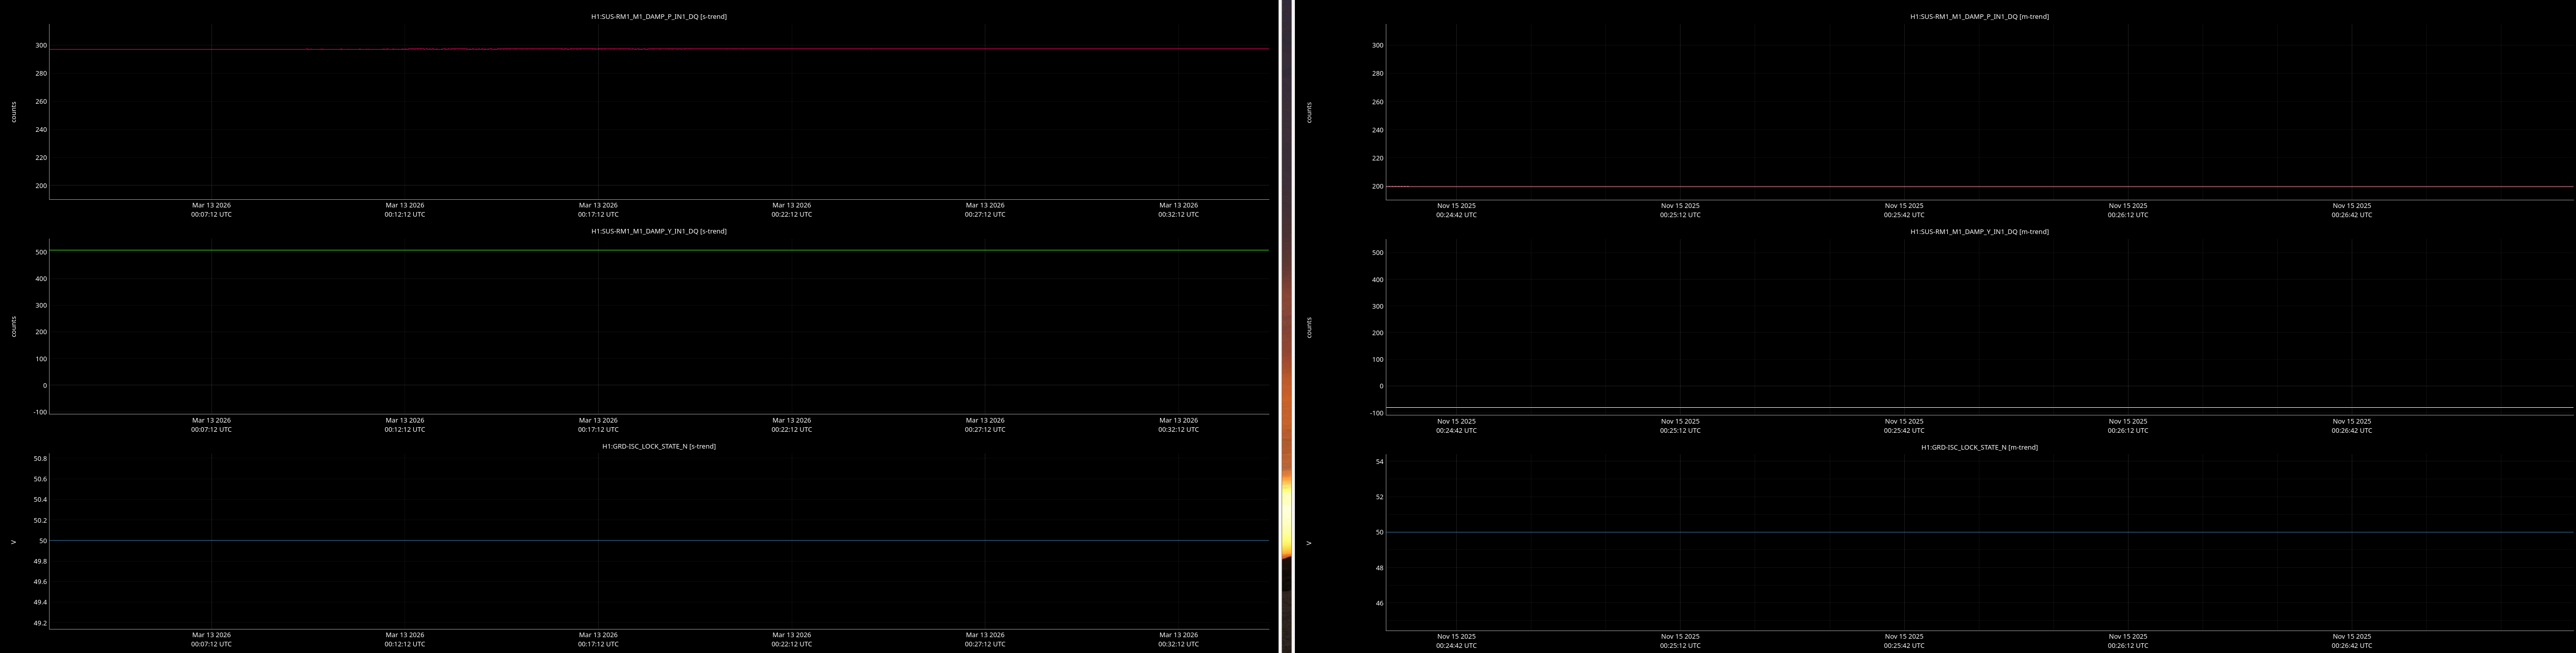
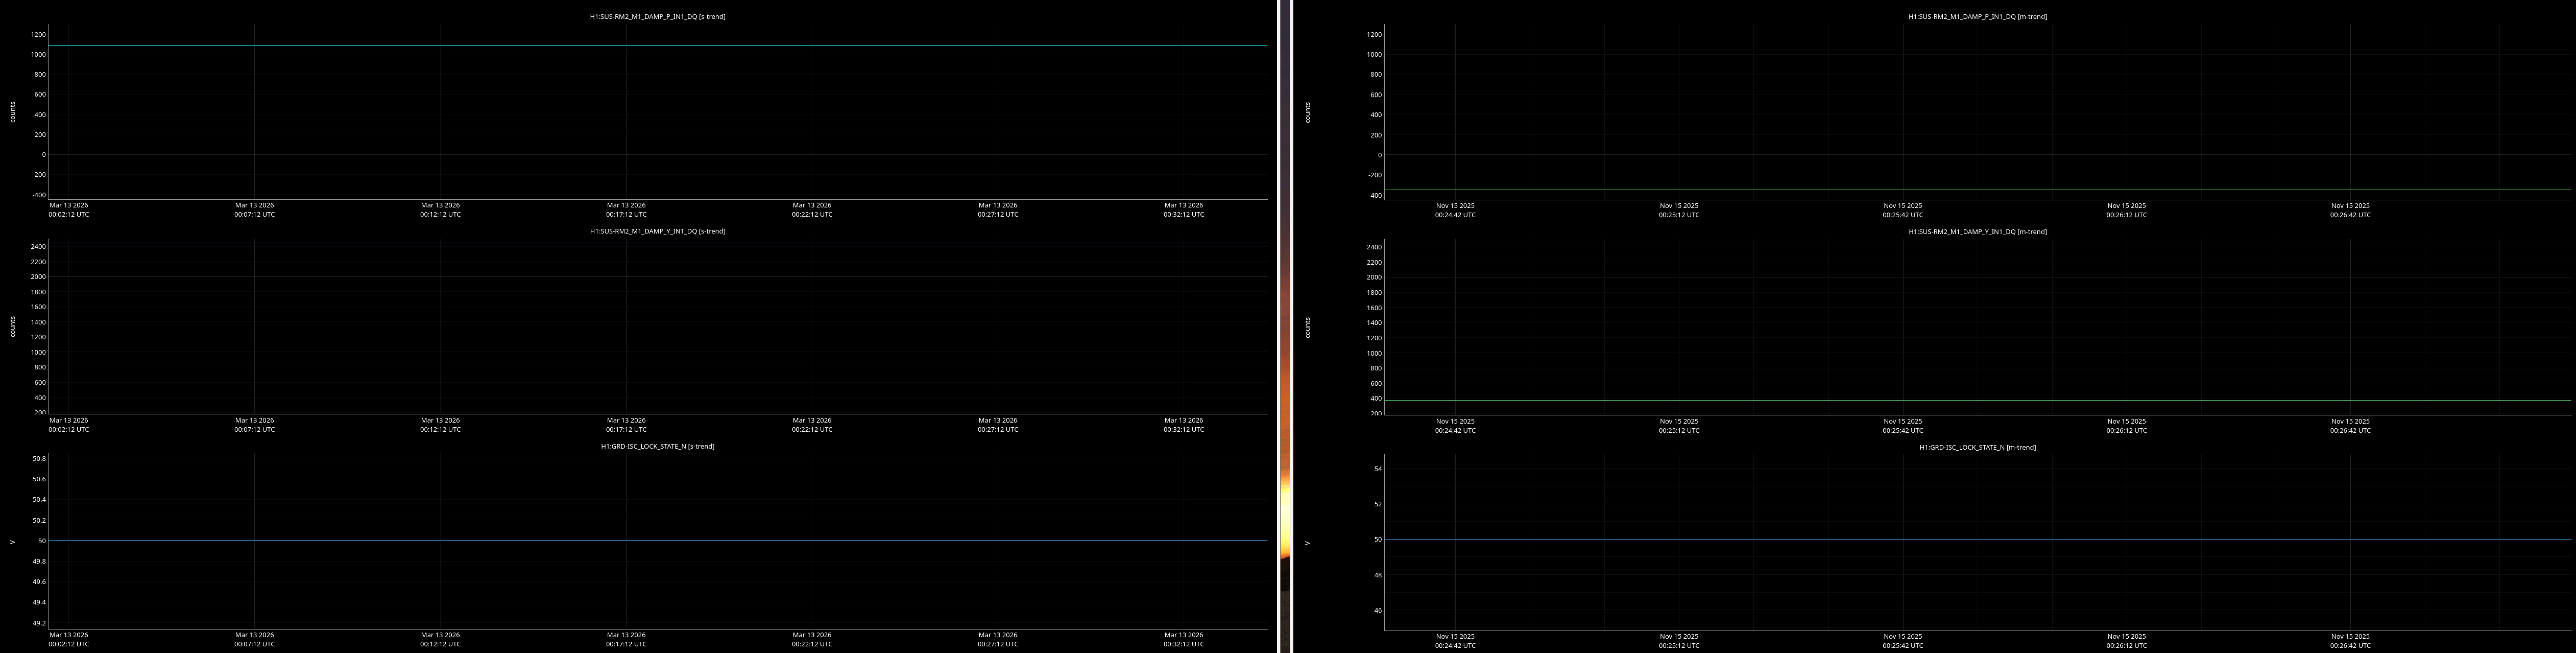
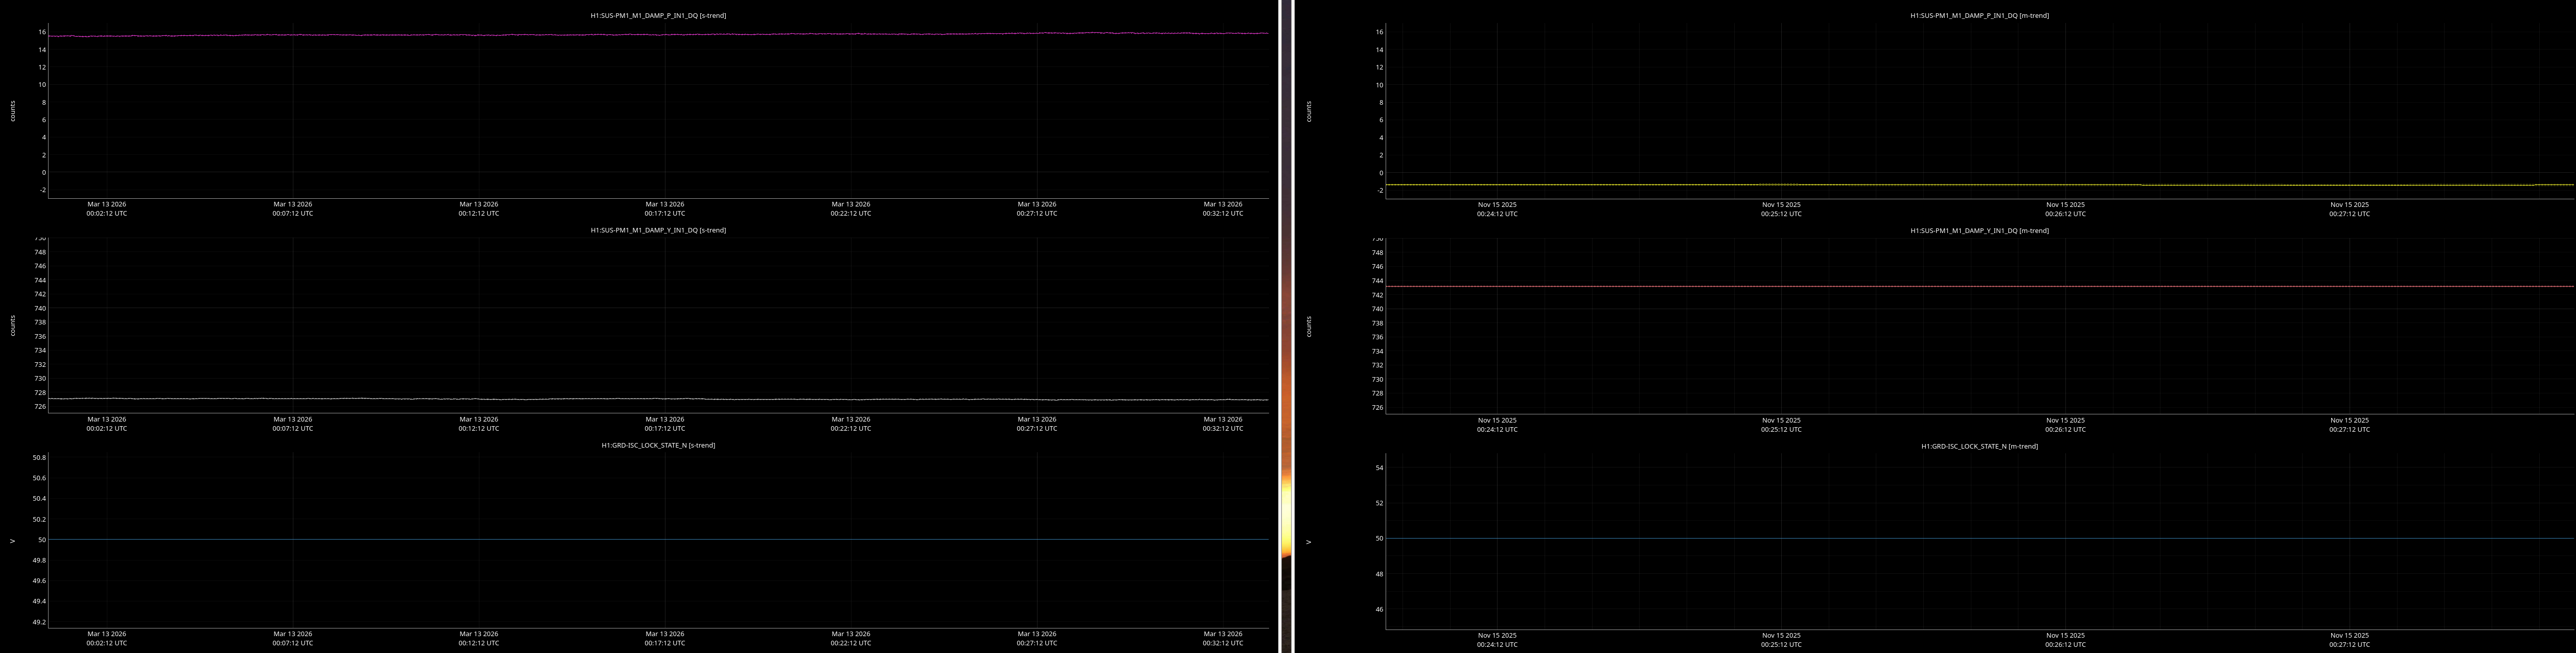
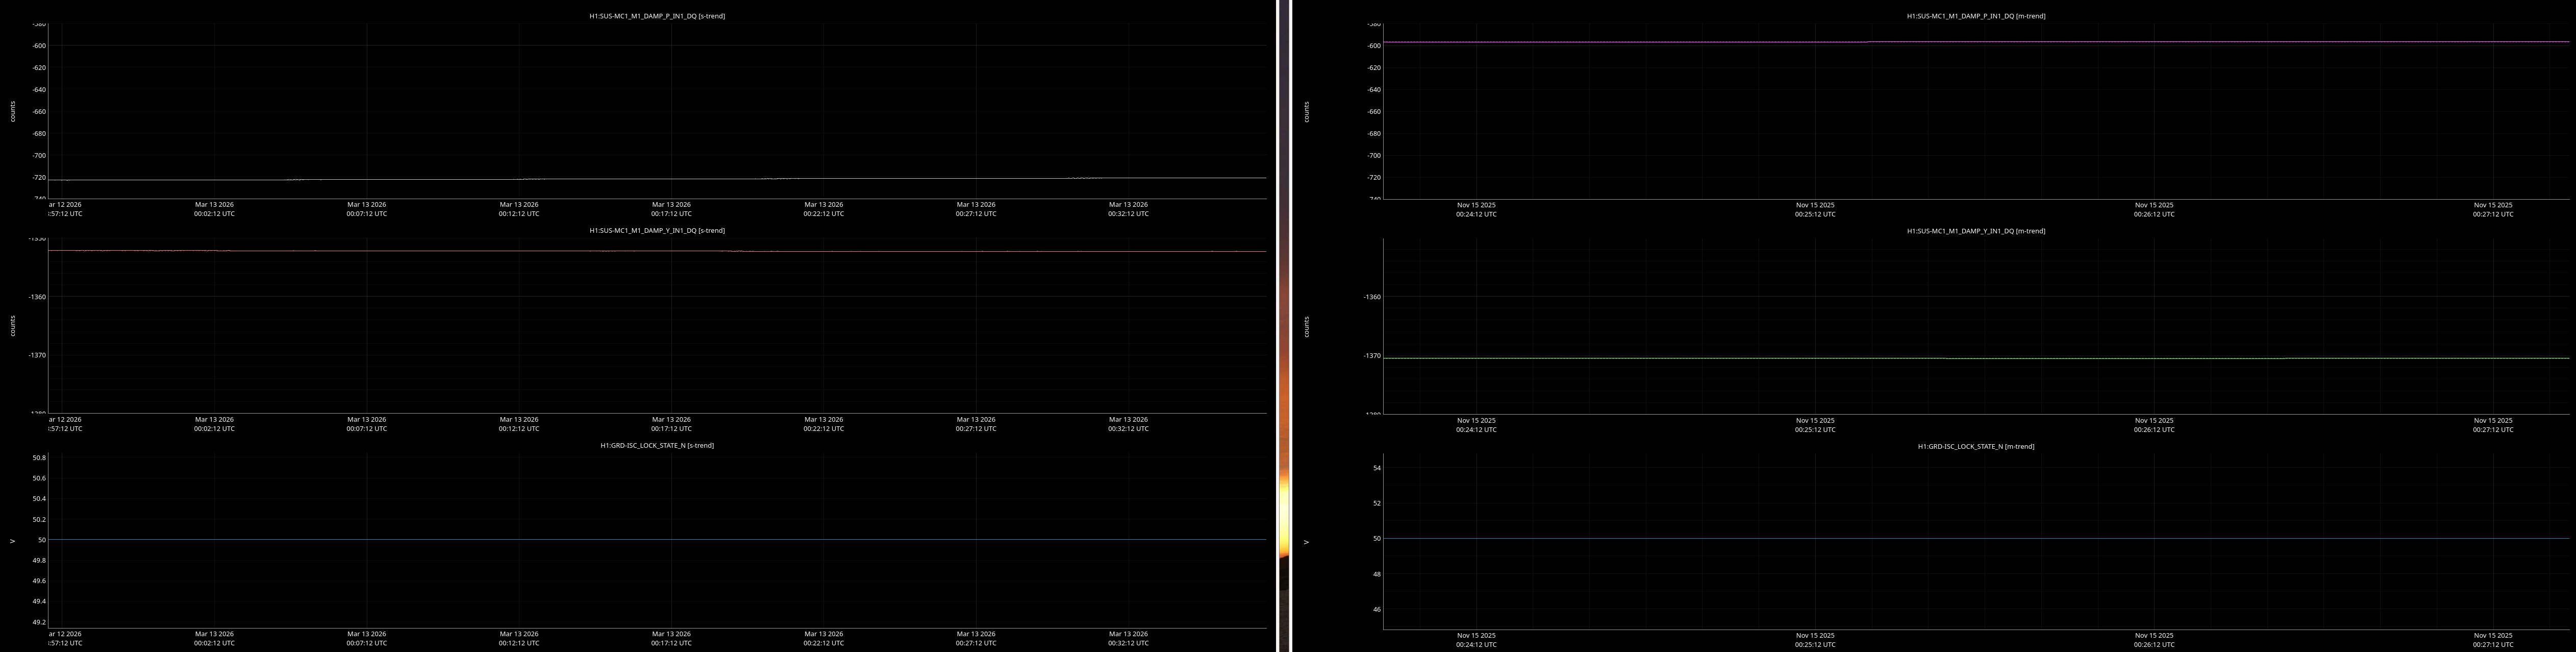
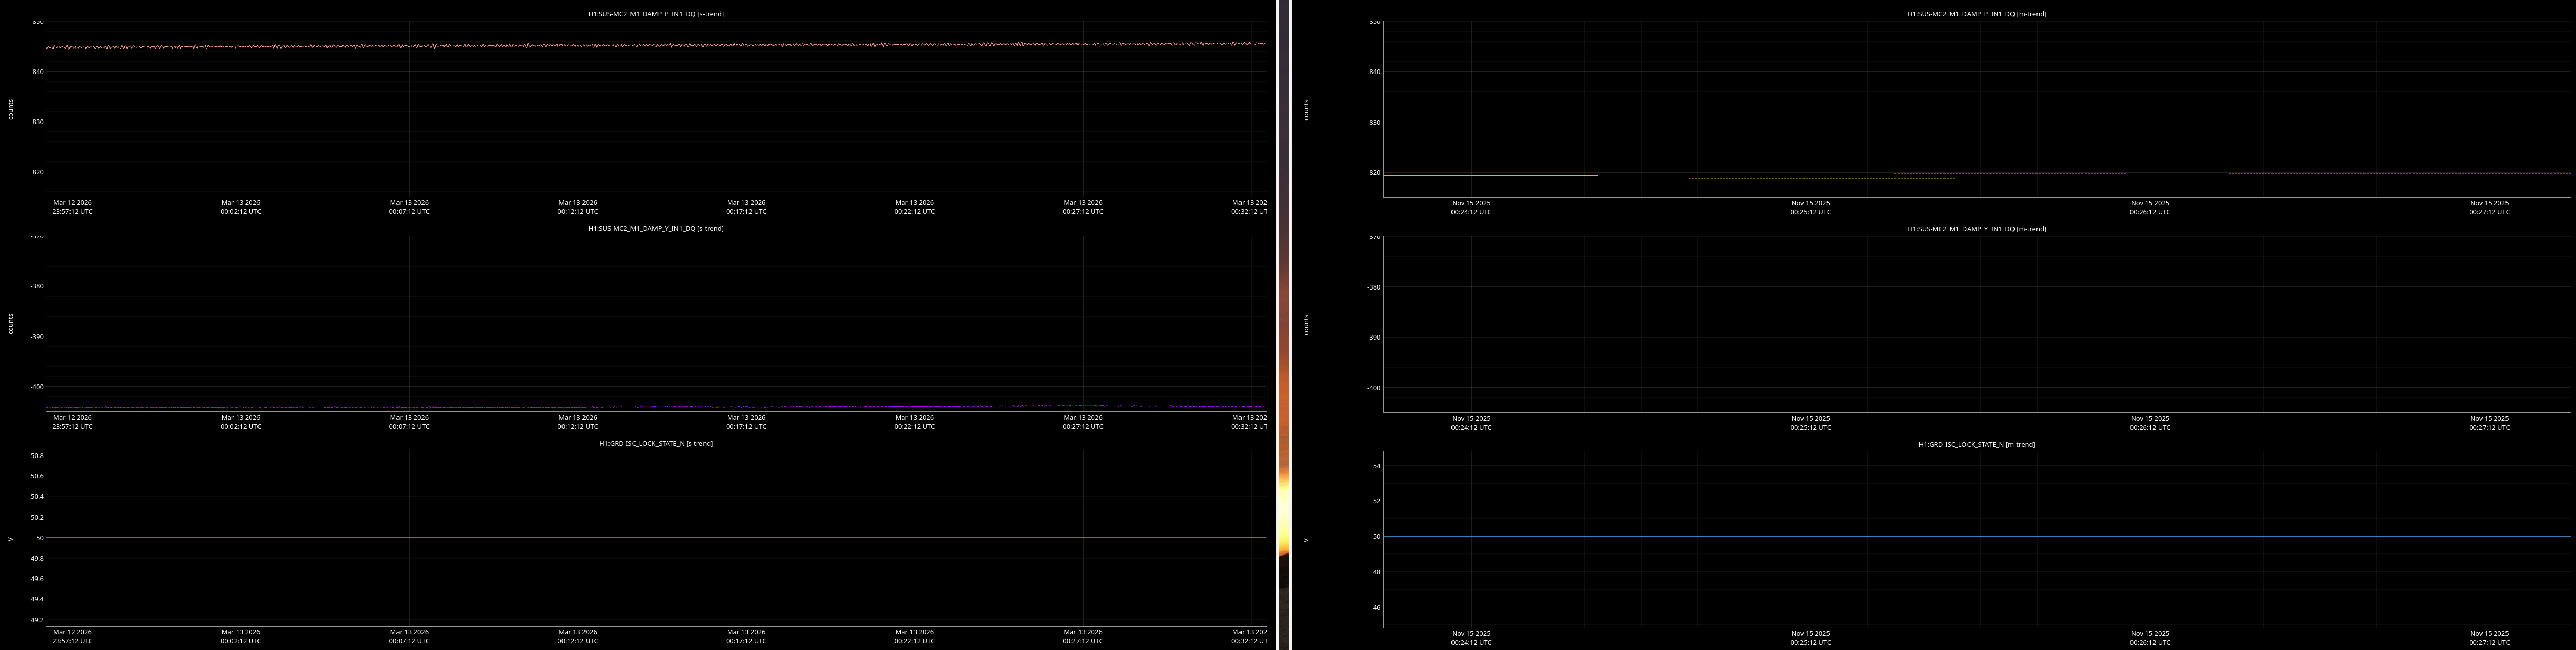
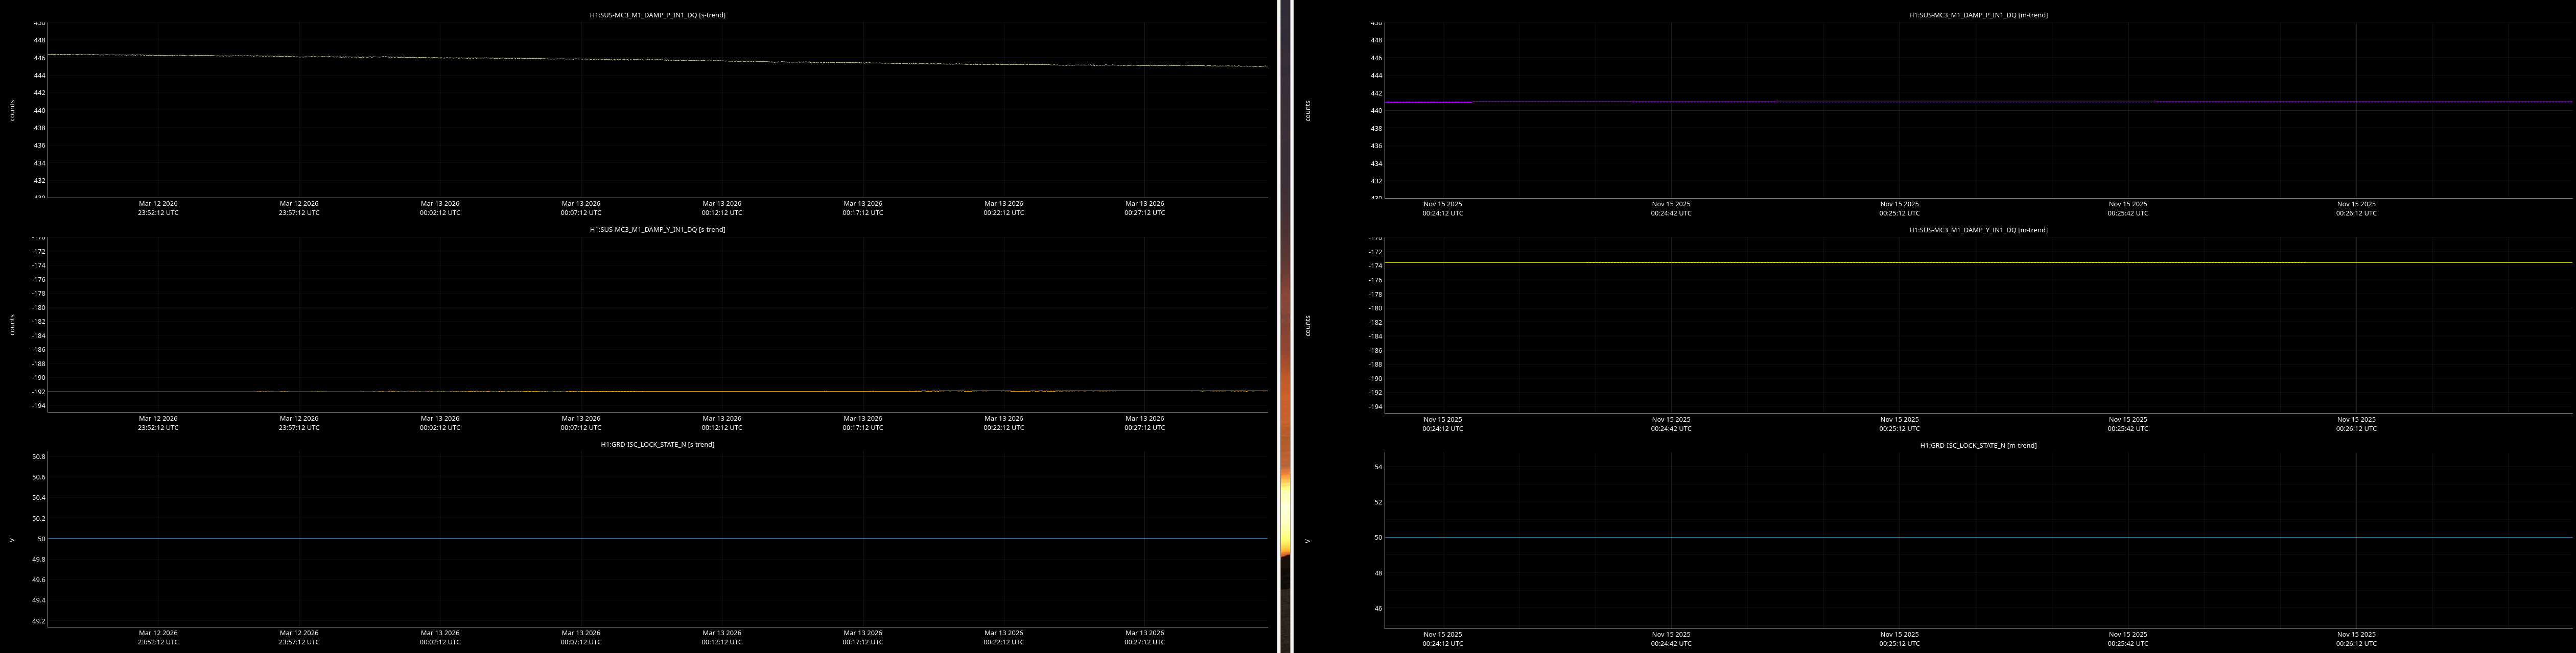
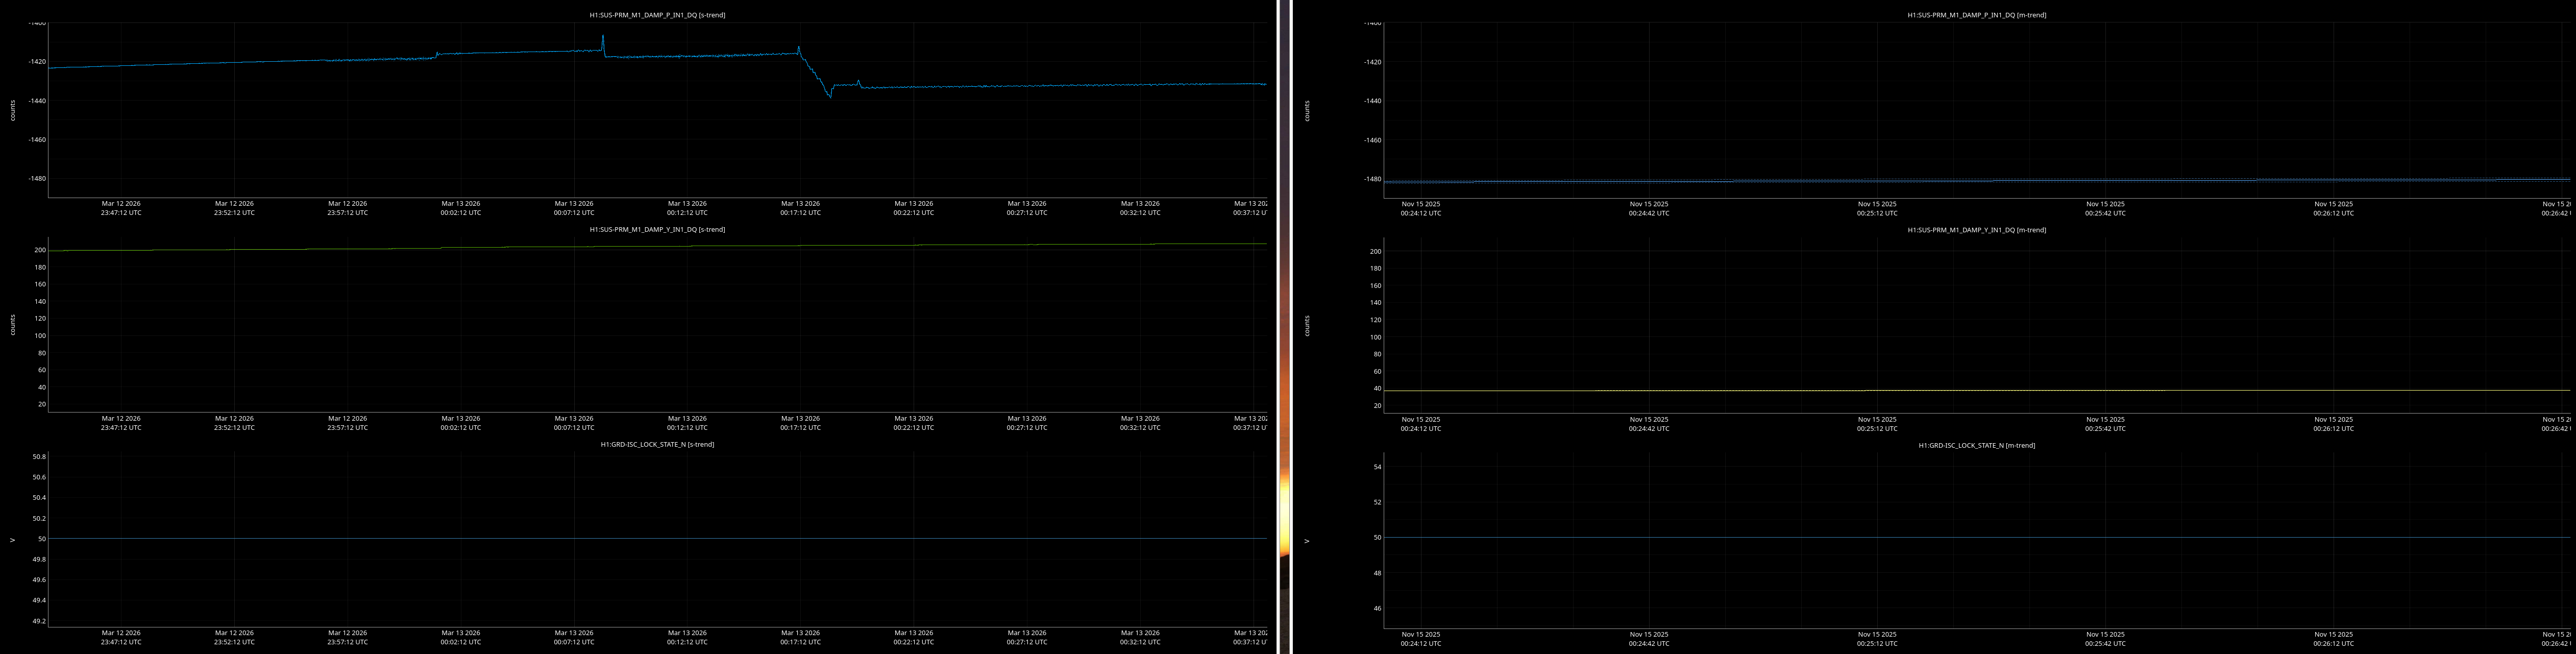
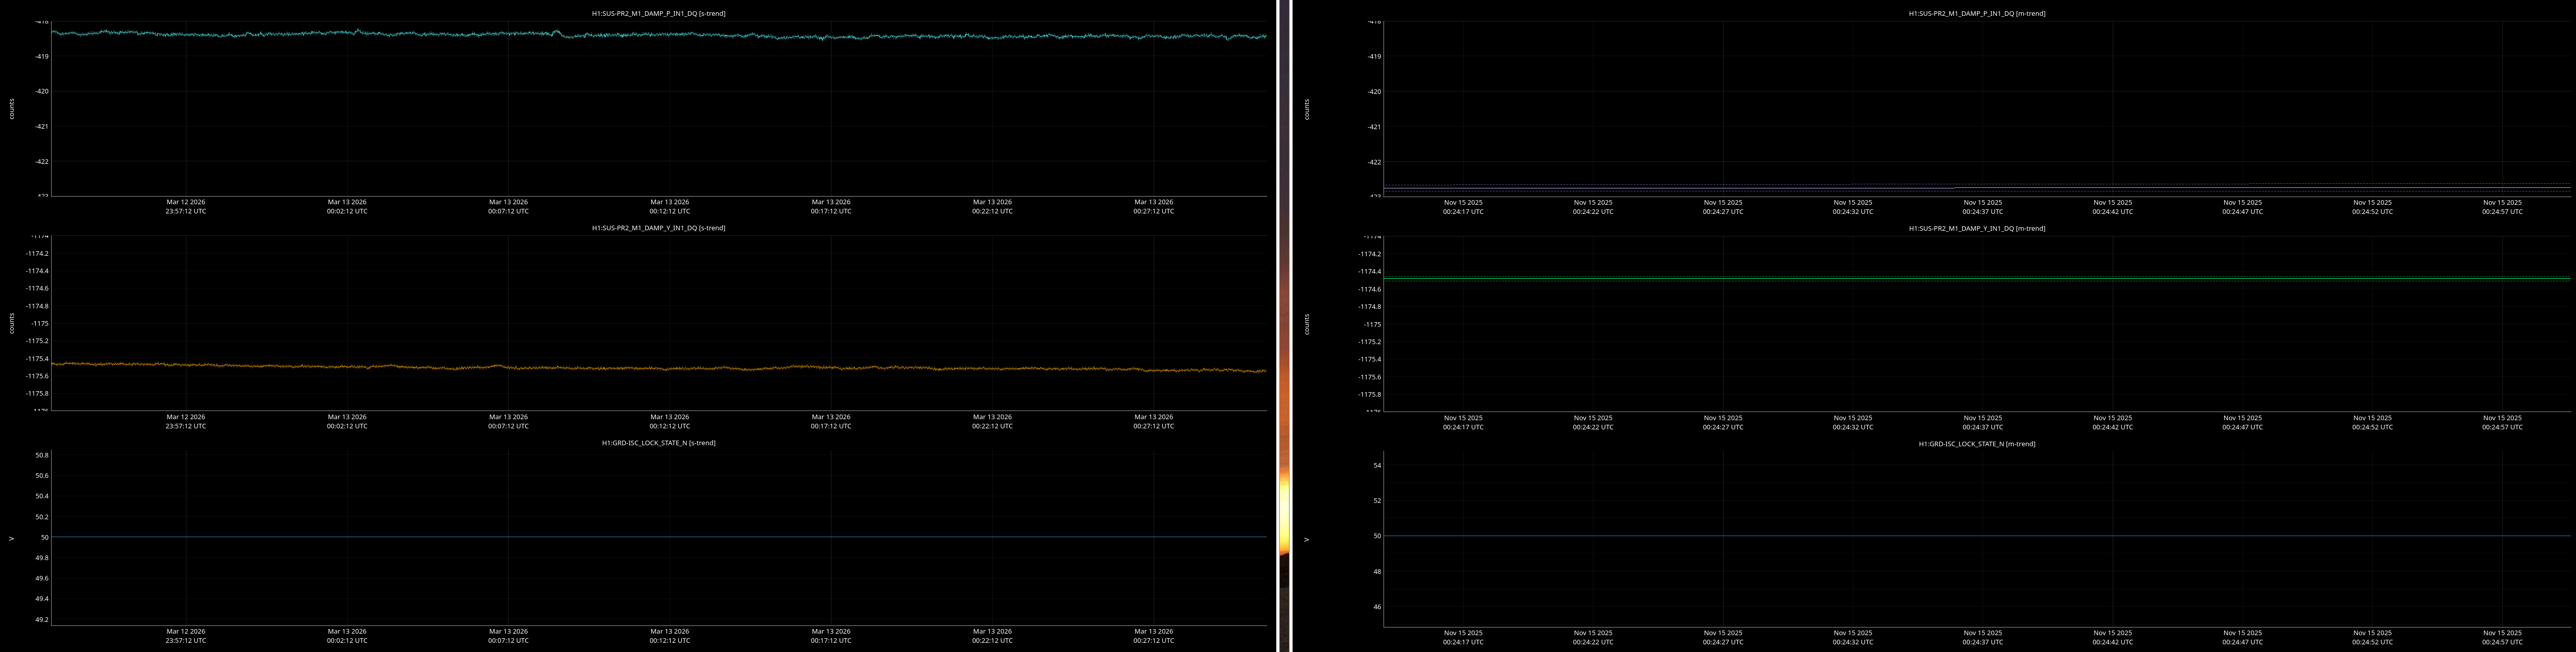
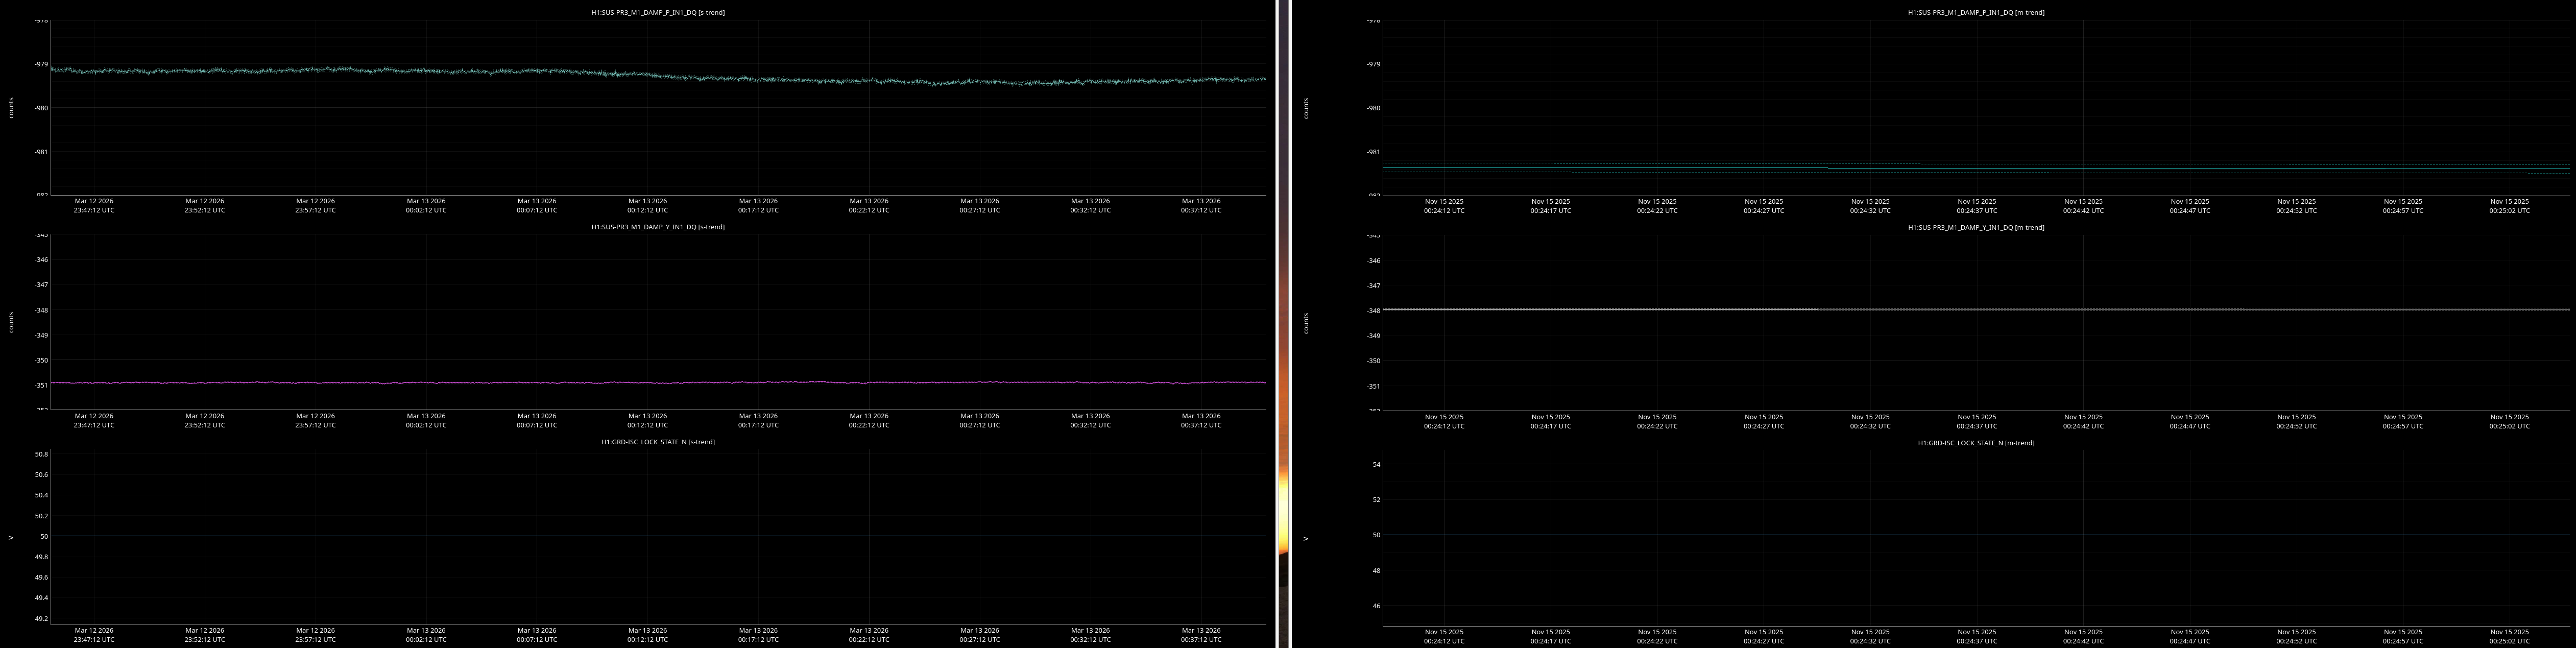
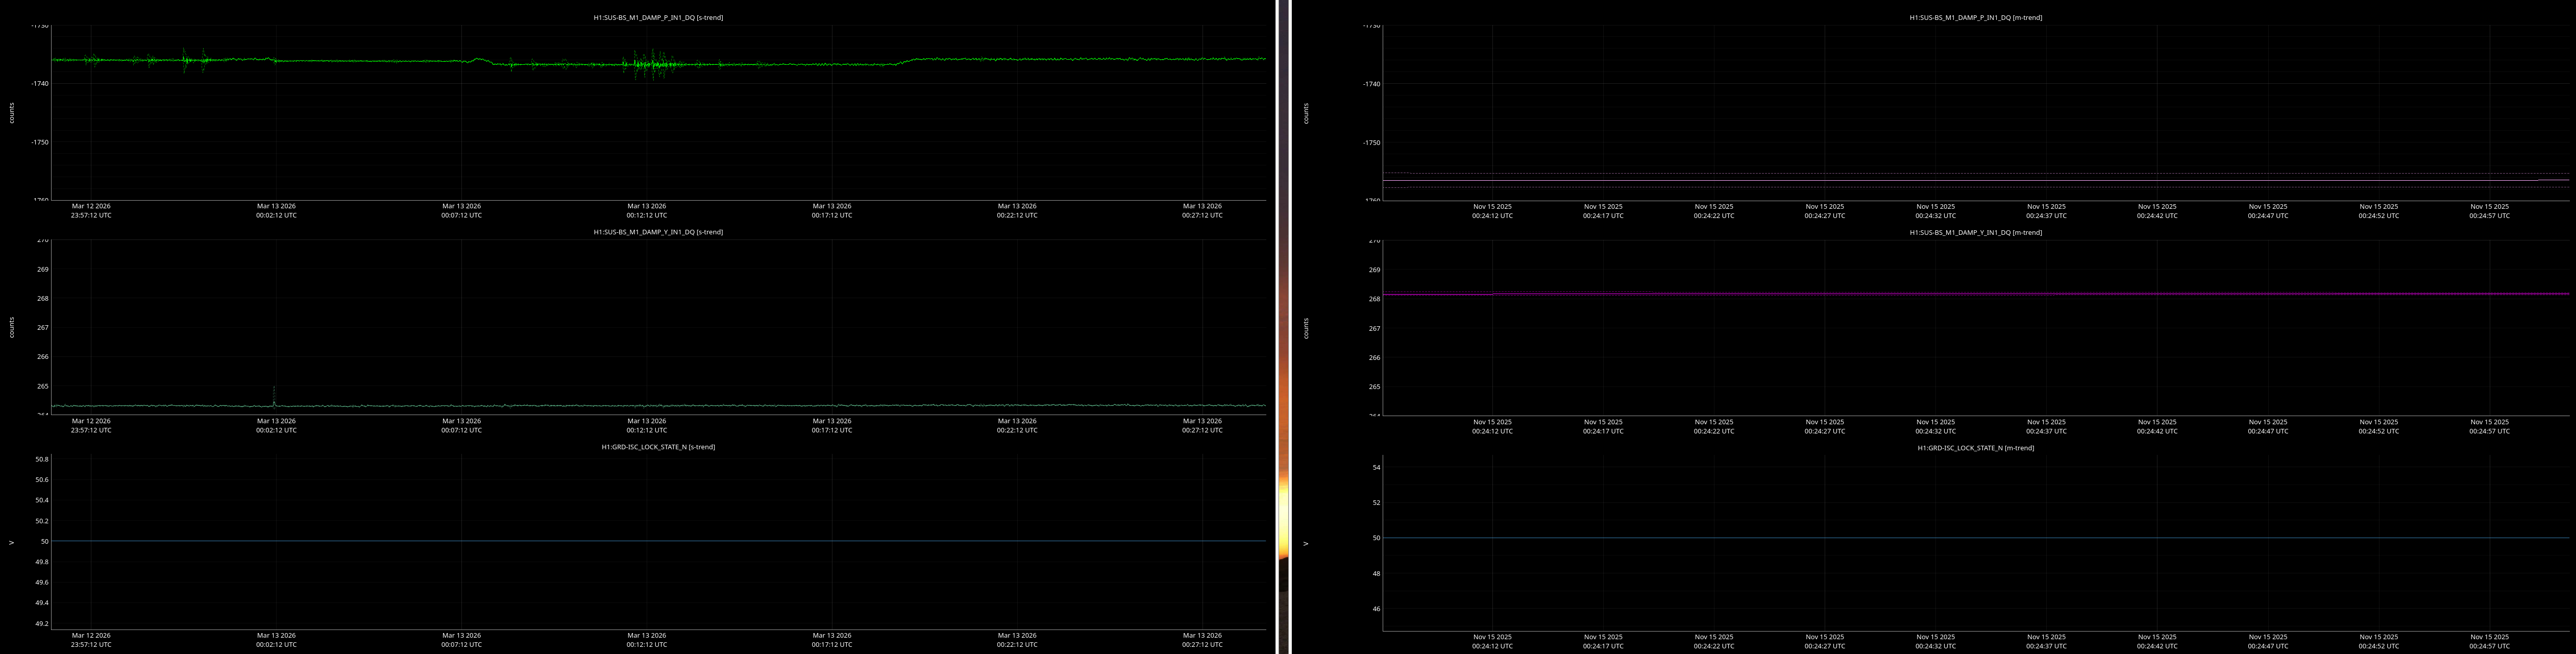
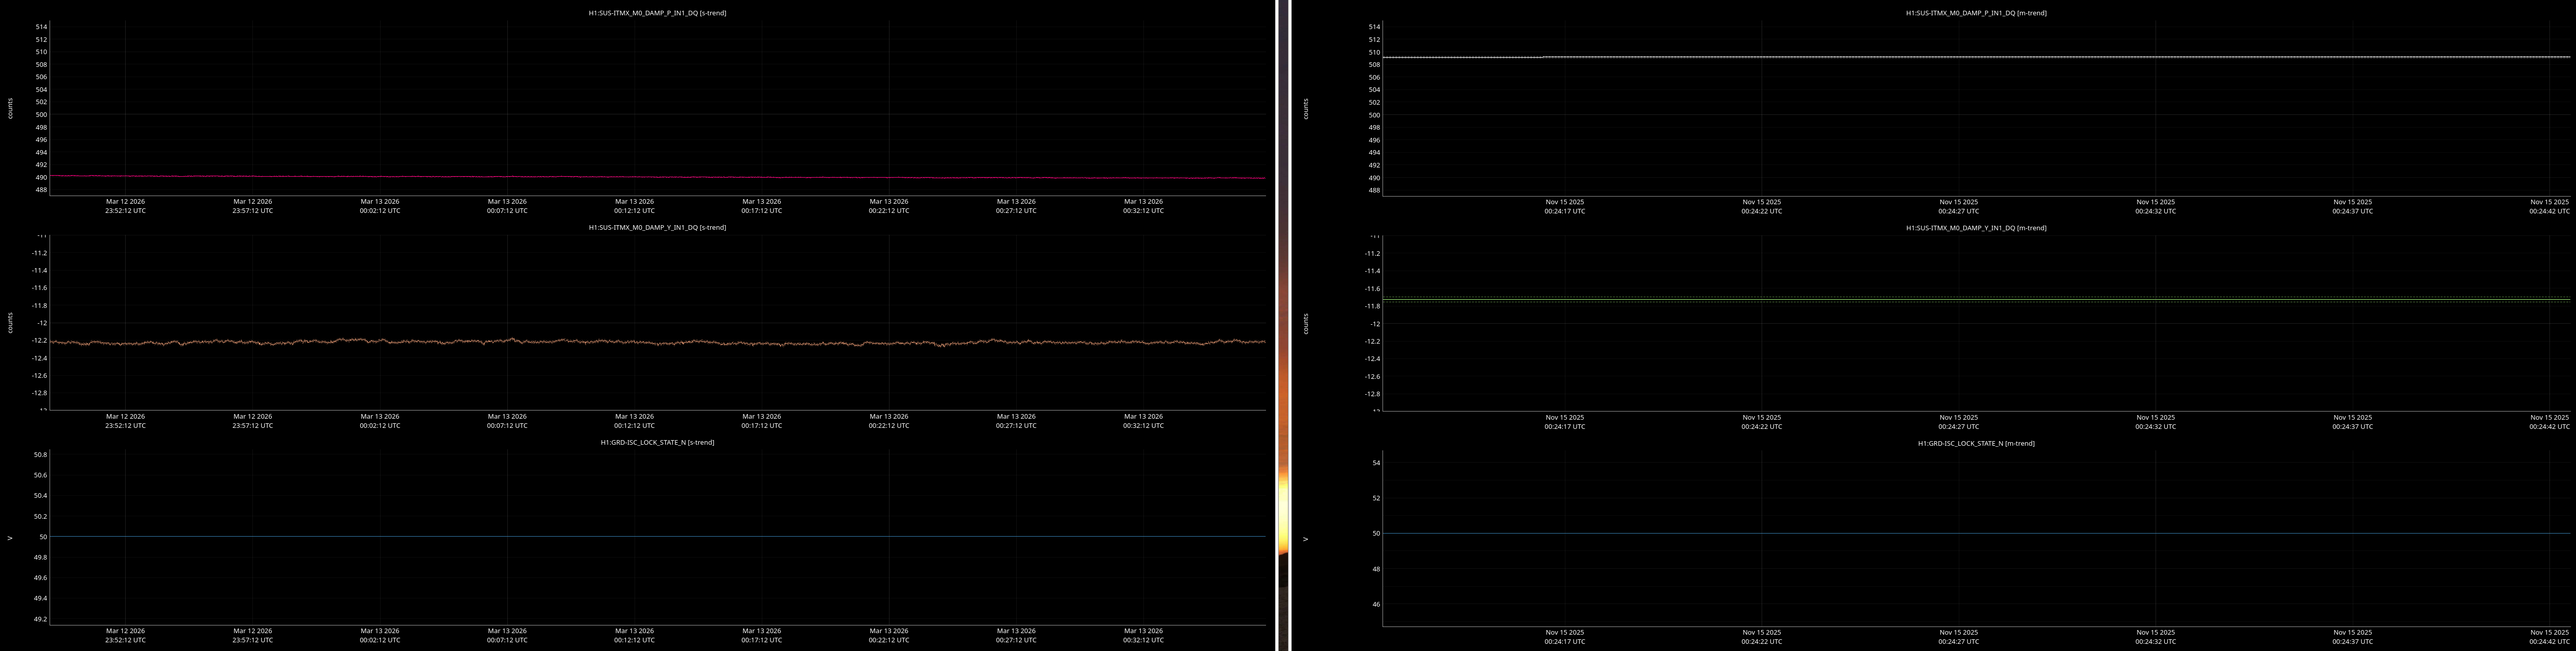
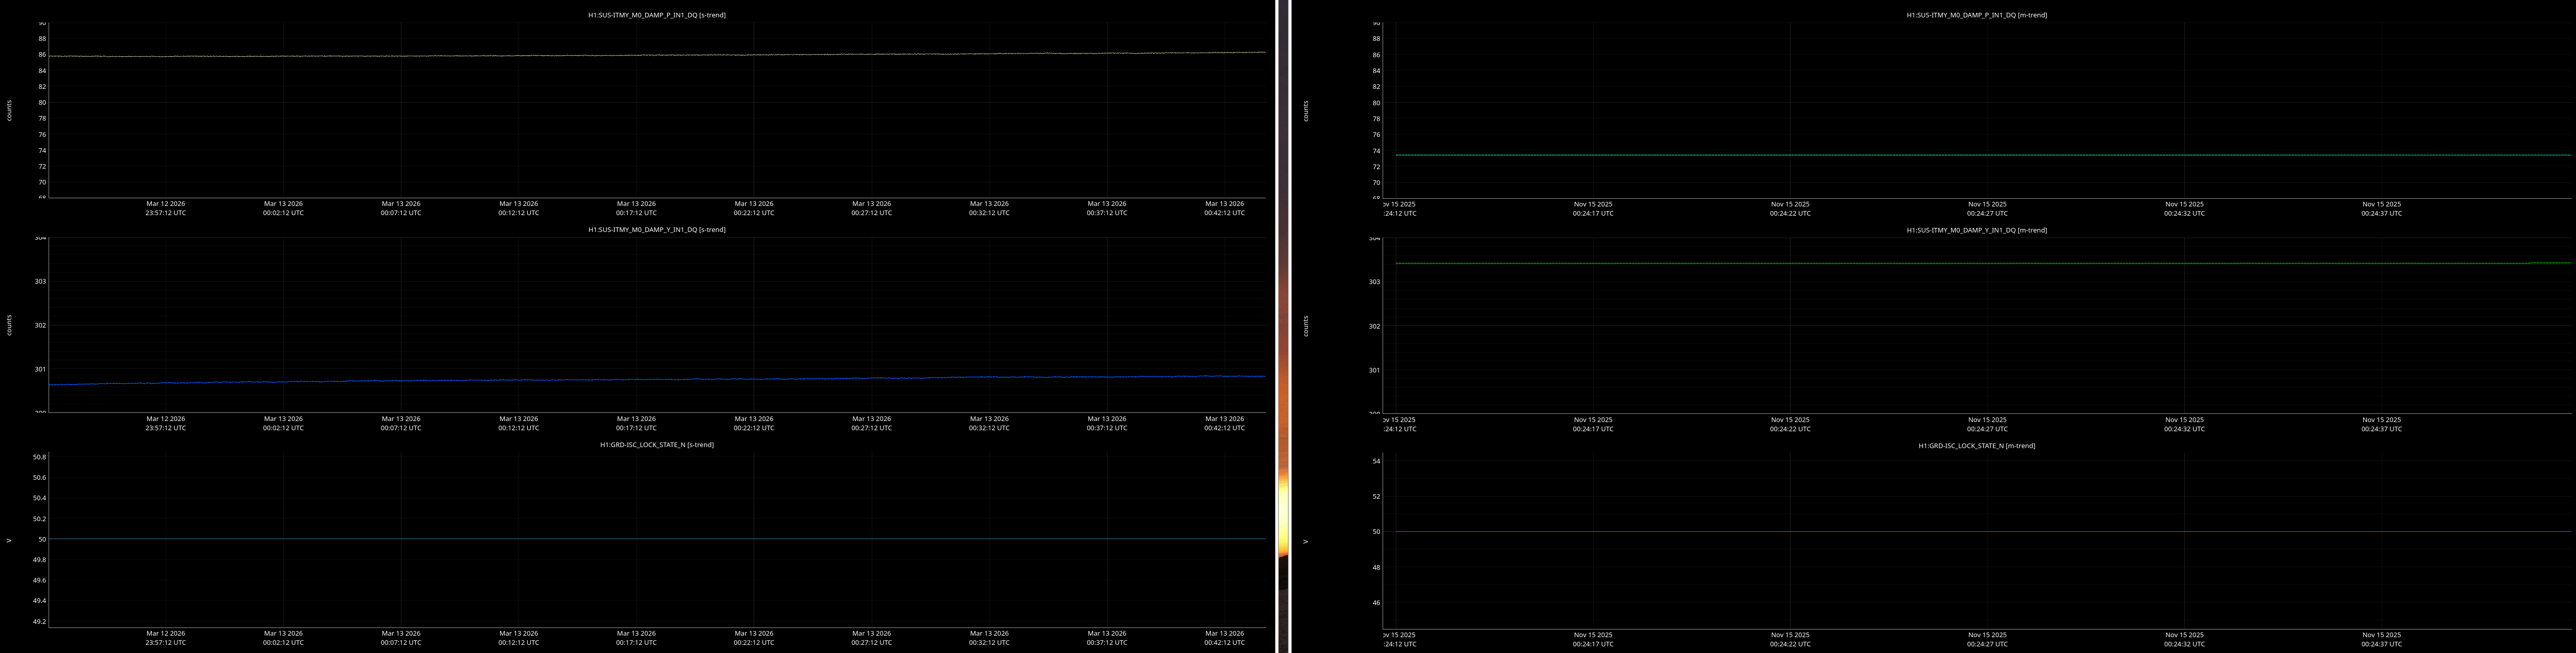
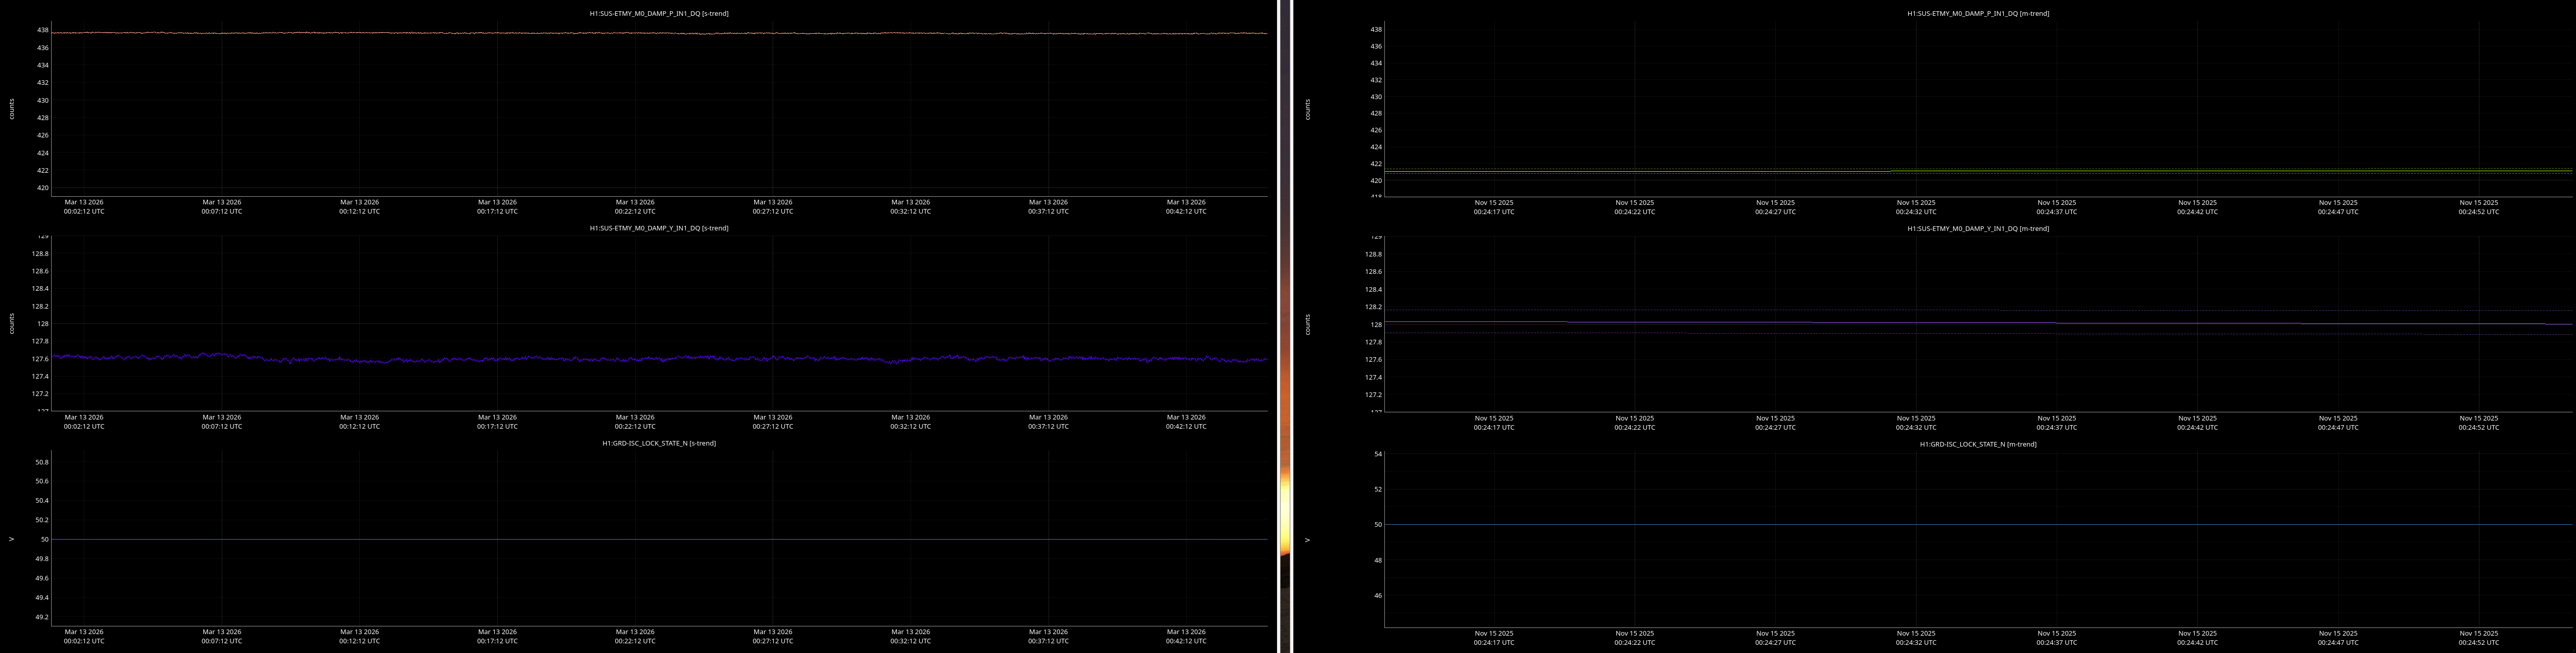
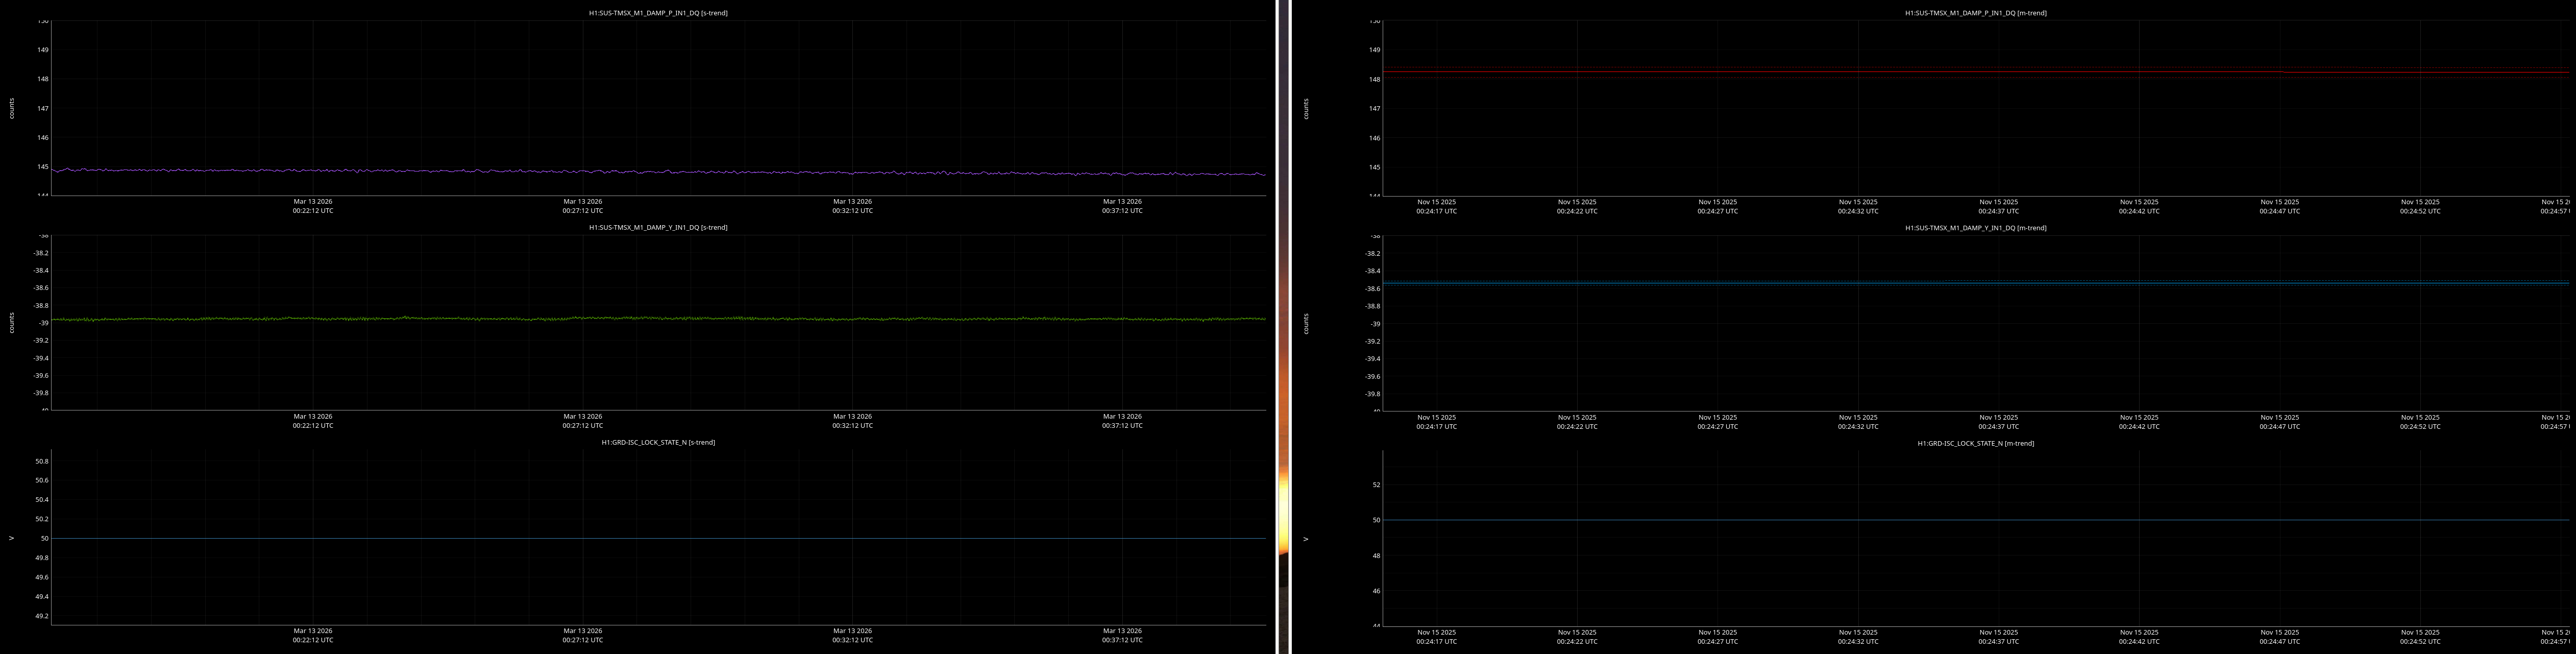
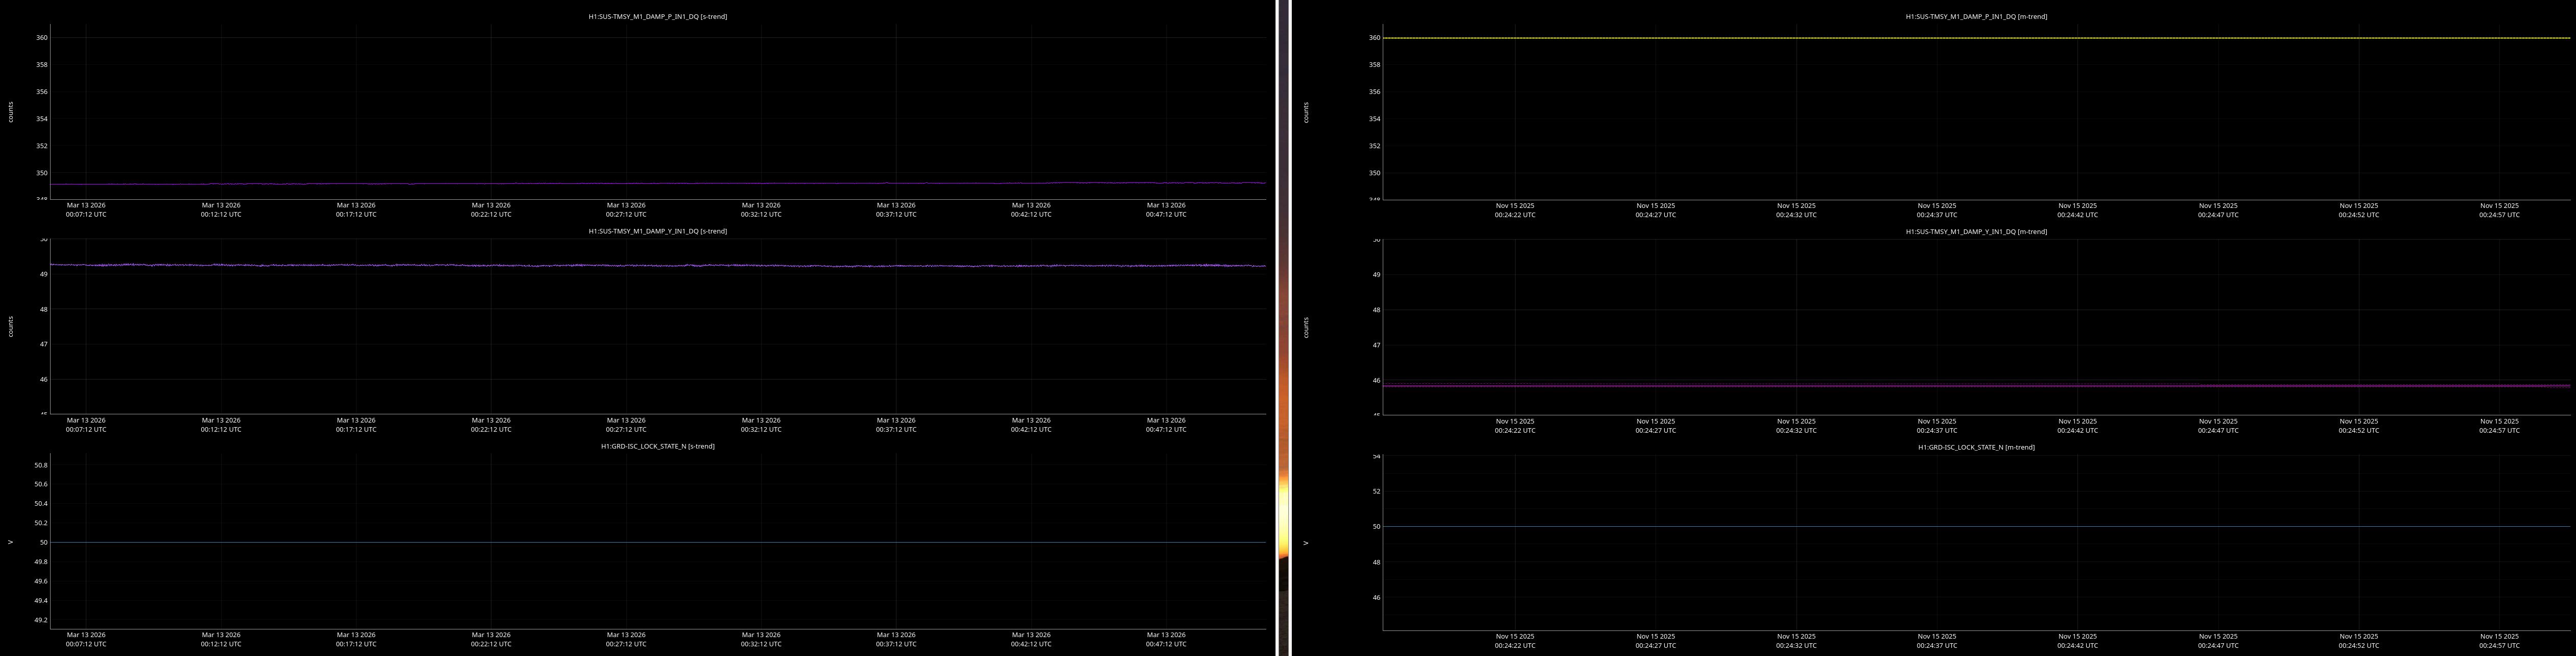
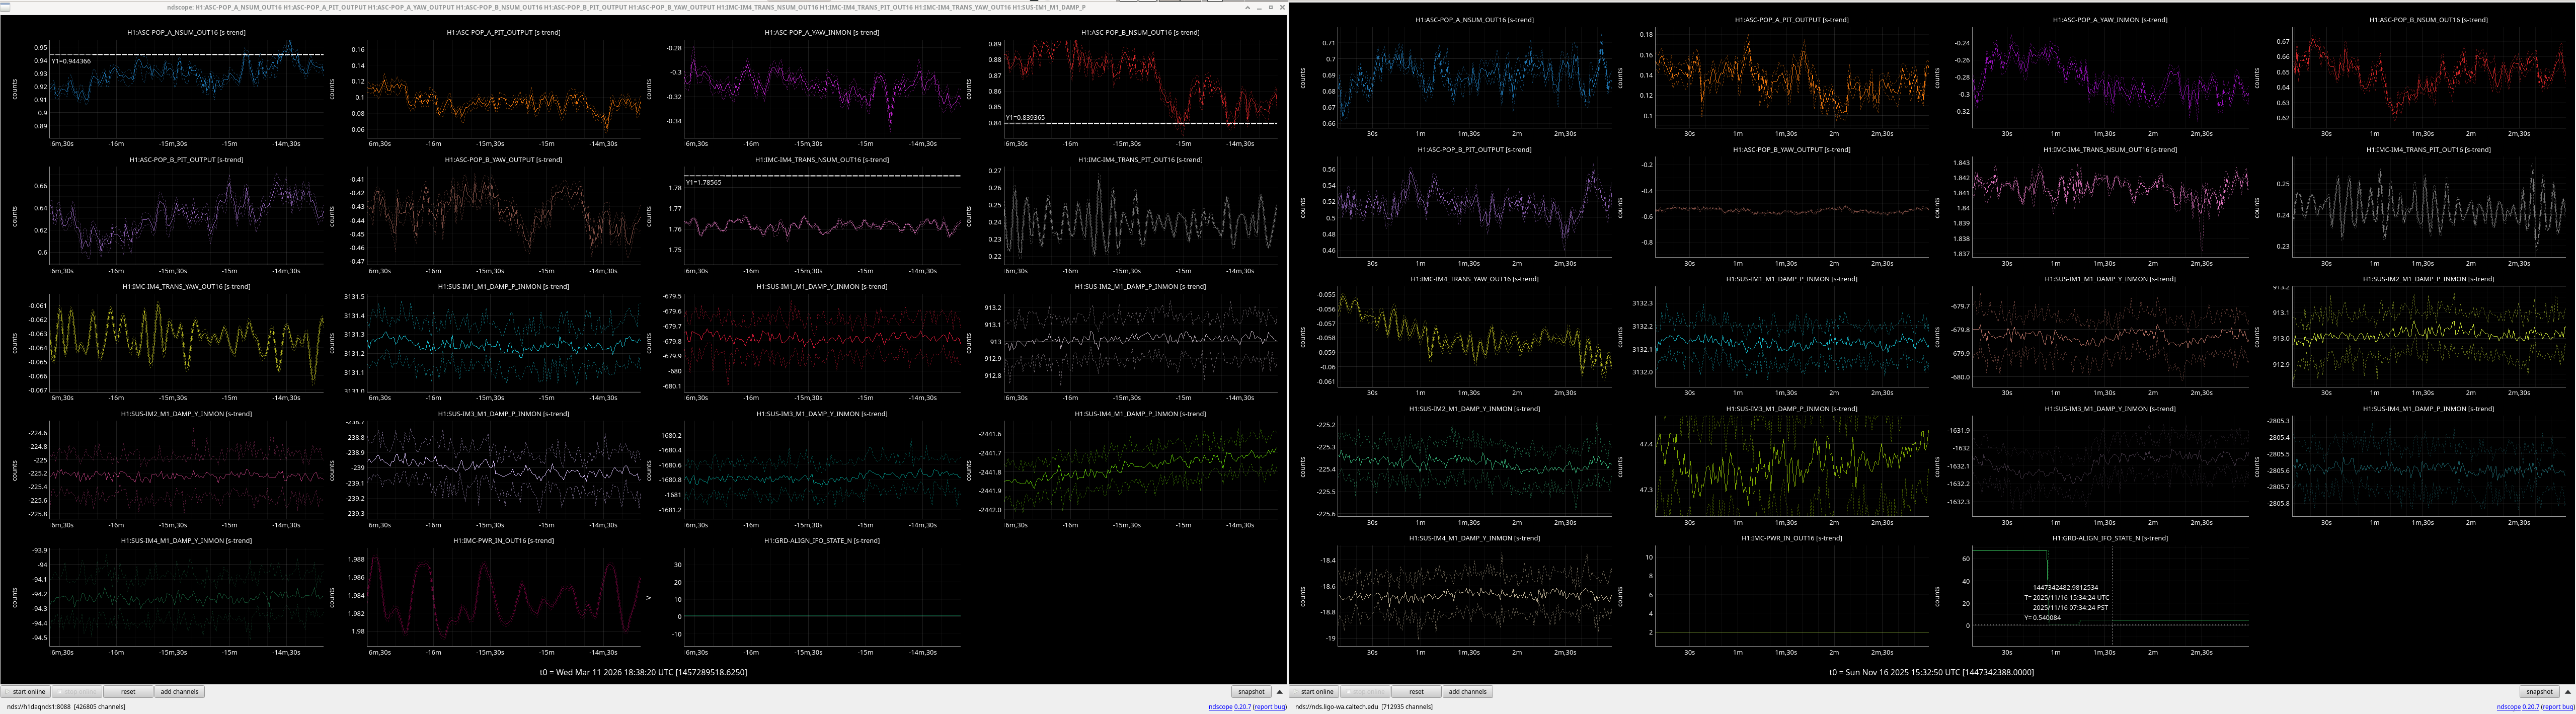
It would be helpful to have a comparison of the top mass osem readbacks for optics, comparing this time in the attachment from Nov 15 2025, to tonight. In both of these times PRMI is locked with arms held off resonance with ALS (ISC_LOCK state 50).
Past time for comparison: 15 Nov 2025 00:26:00 UTC, plus or minus 1 minute (but check that ISC_LOCK_STATE_N was 50, and we want closer to the end time of that state 50 time).
Now time to compare: 2026-03-13 00:40:16.264360 UTC, plus or minus 10 mins.
Optics to trend:
- IMs 1-4
- RMs 1-2
- PM1
- MC1-3
- PRM, PR2, PR3
- BS
- ITMs, ETMs, TMSs
- others optional, like SR2, SR3, OMs1-3.
Images attached to this report
Comments related to this report
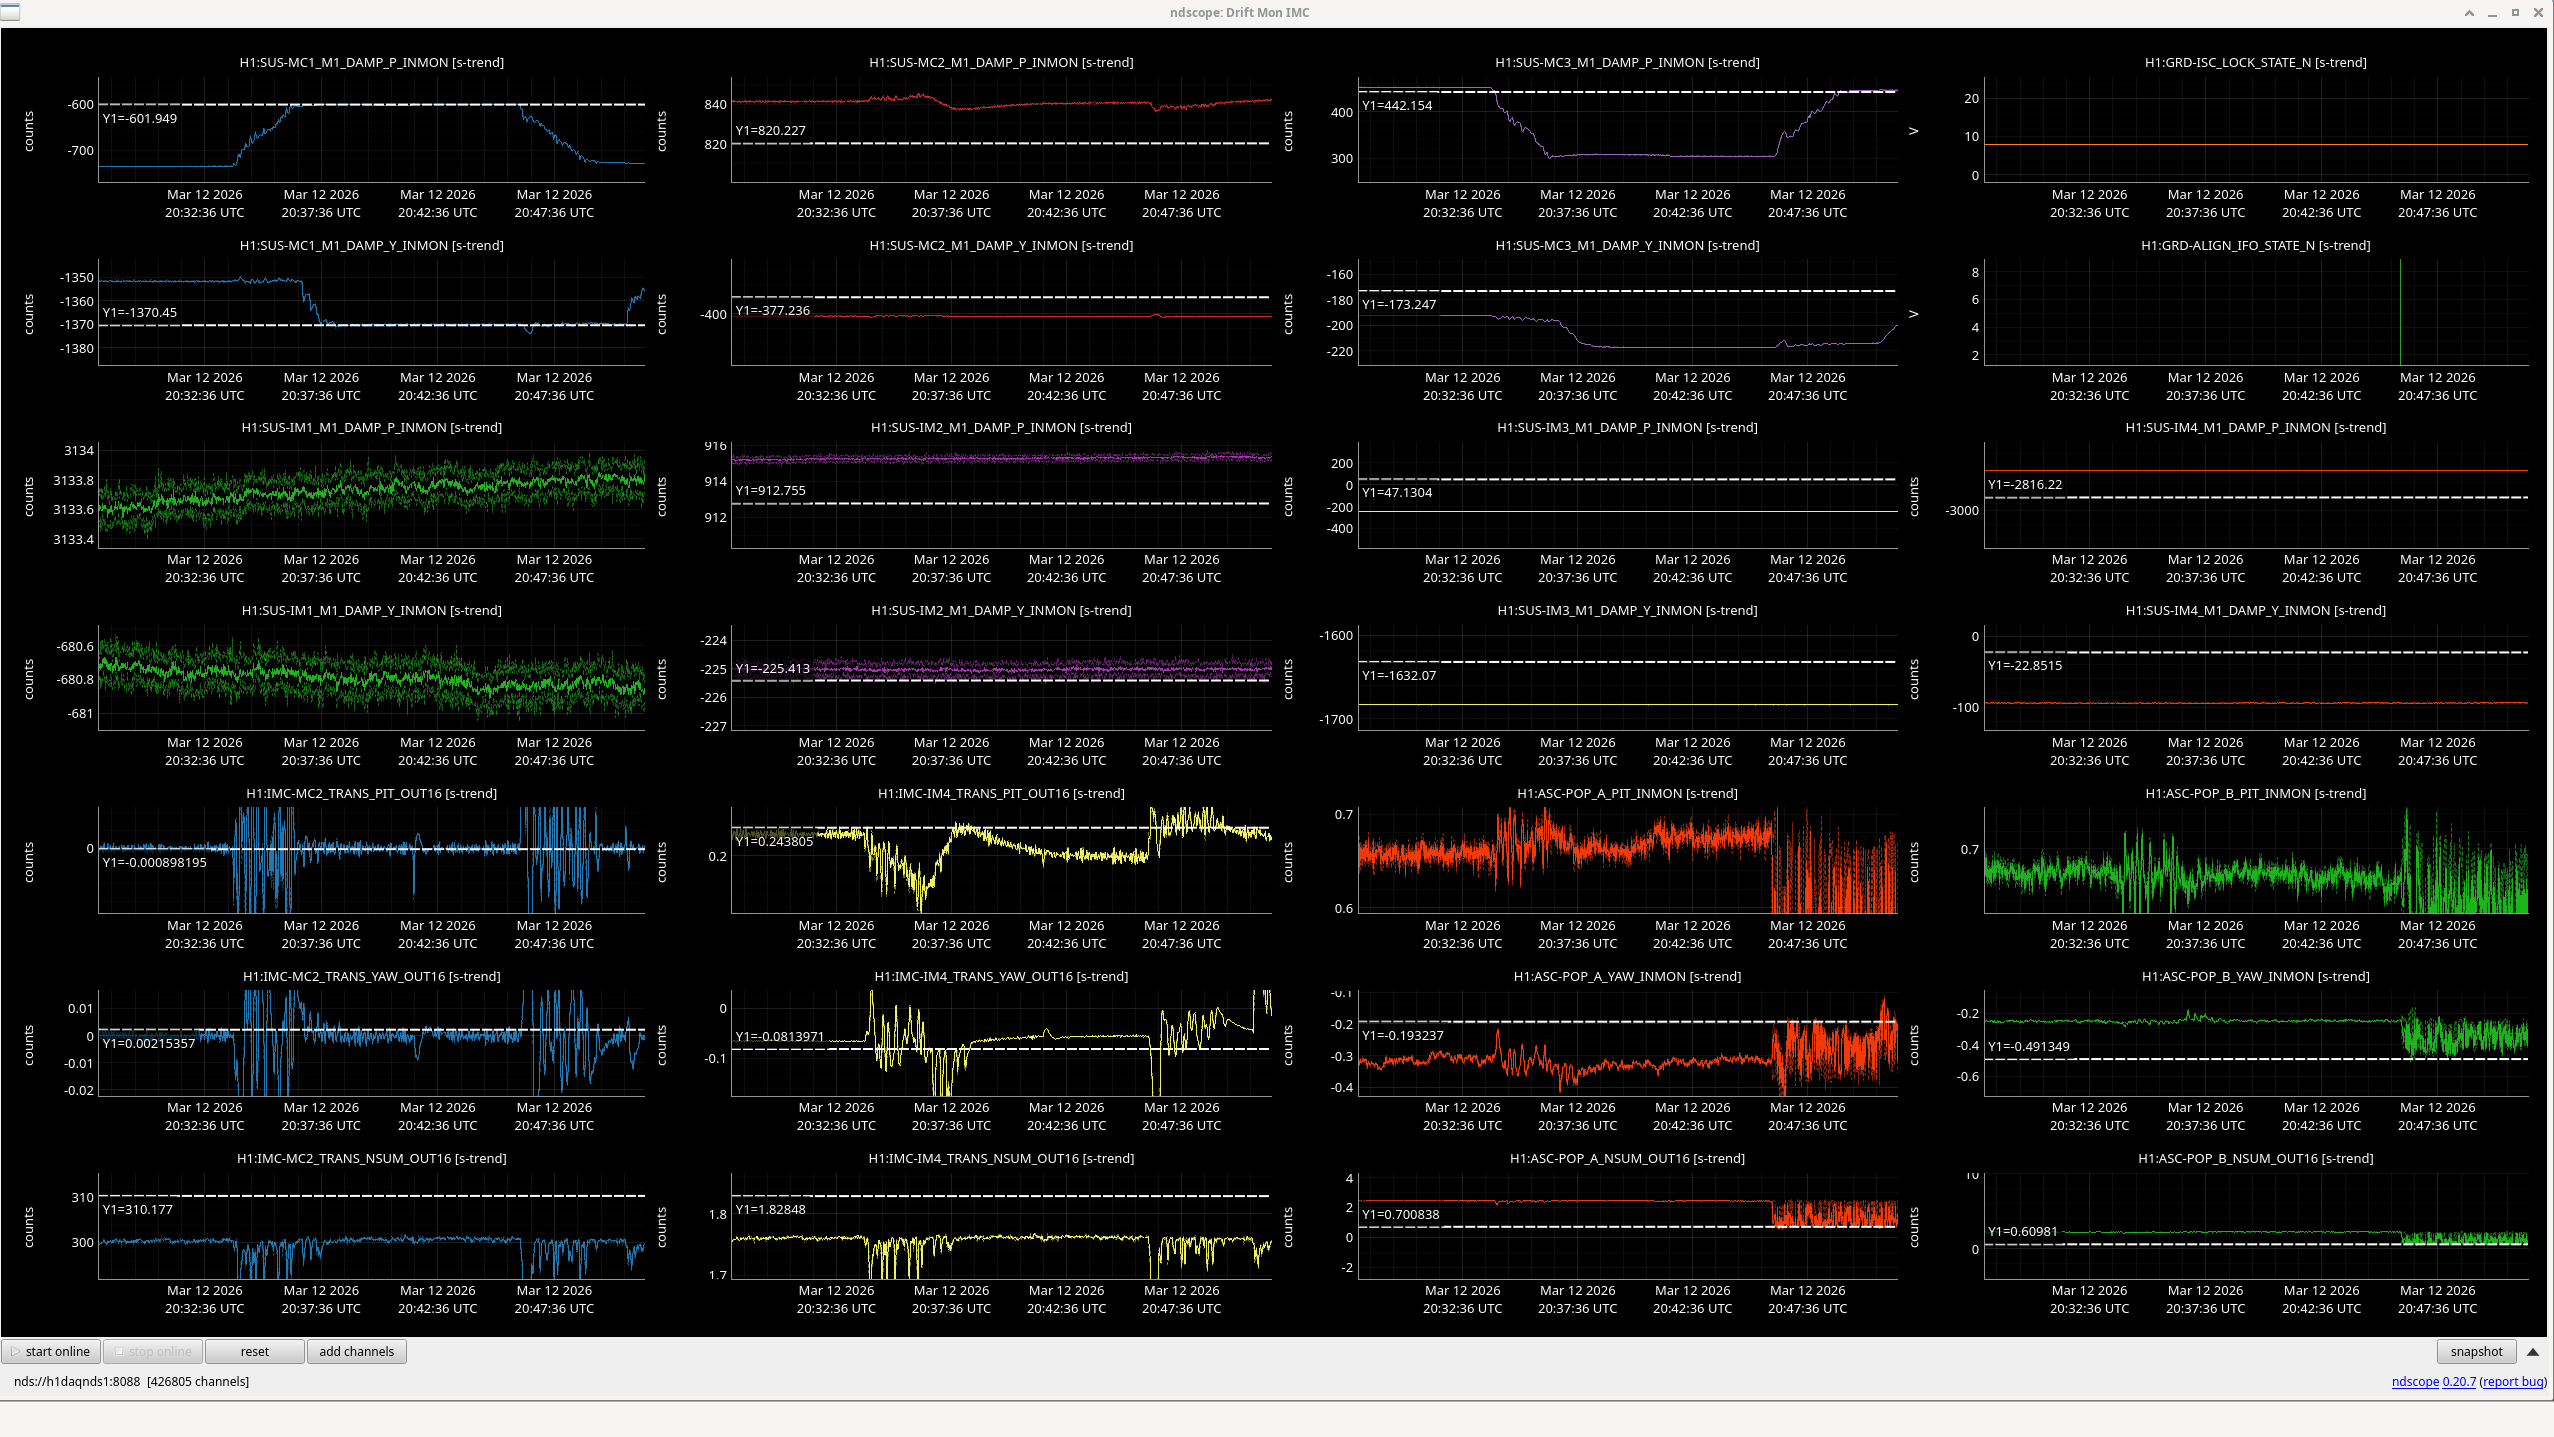
Here are comarison screenshots for the SUS Jenne mentions (skipped optional ones) between PRMI-locked-with-arms-held-off-resonance-state today and back in Nov2025. Comparisons are of upper mass OSEM's pit & yaw IN1 channels.
Images attached to this comment