[Jenne, Sheila]
We did a quick check of how much SR2 needs to move in order to reduce the amount of power on AS_C_NSUM by 50%, in hopes that this will help us and Alena check the calibration of the SR2 sliders, for use in Alena's model.
I left the PSL power at 2W. Both ETMs are in use, but the yarm is misaligned enough that it was fine to use ITMY as my single-bounce optic without getting IR flashes. So, I misaligned ITMX and indeed see no IR arm flashes that would confuse my measurement.
I by-hand moved SR2 to center on AS_C so that I had a known starting place (the rest of the IFO hasn't been aligned in the last few hours, and seismic sensor correction is off for maintenance day, which is probably why I needed to move a very small amount to get AS_C centered).
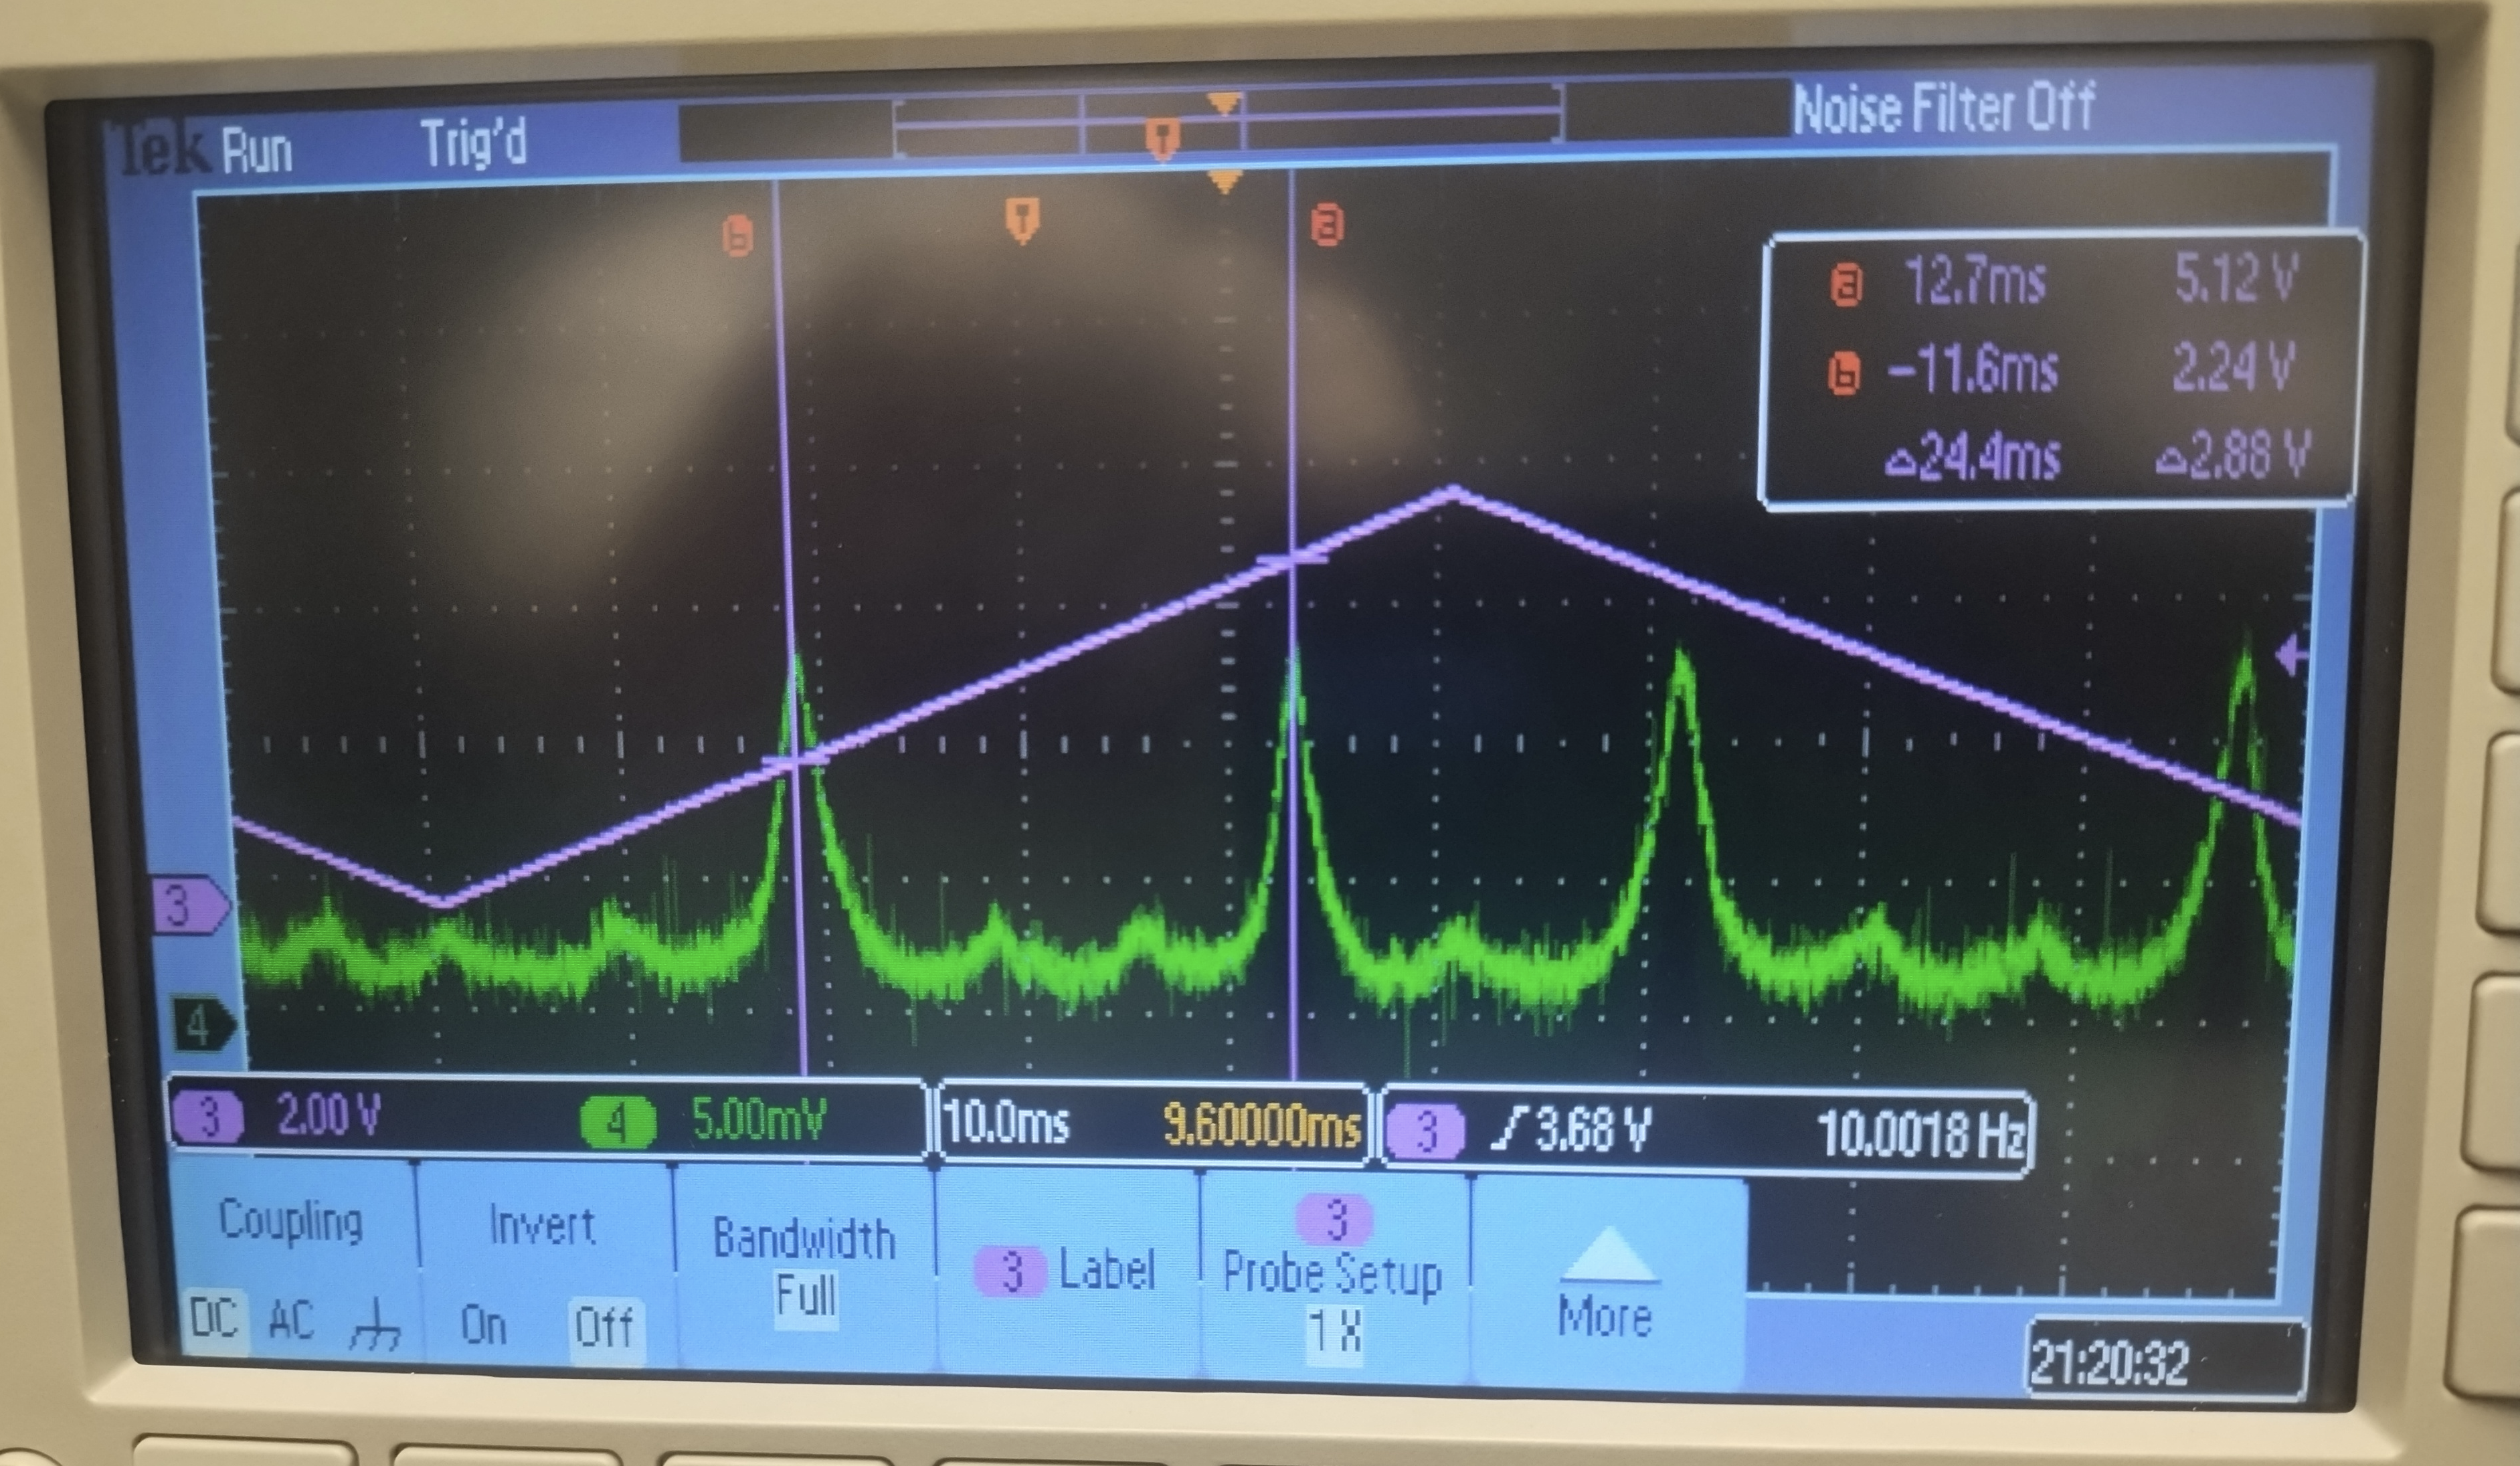
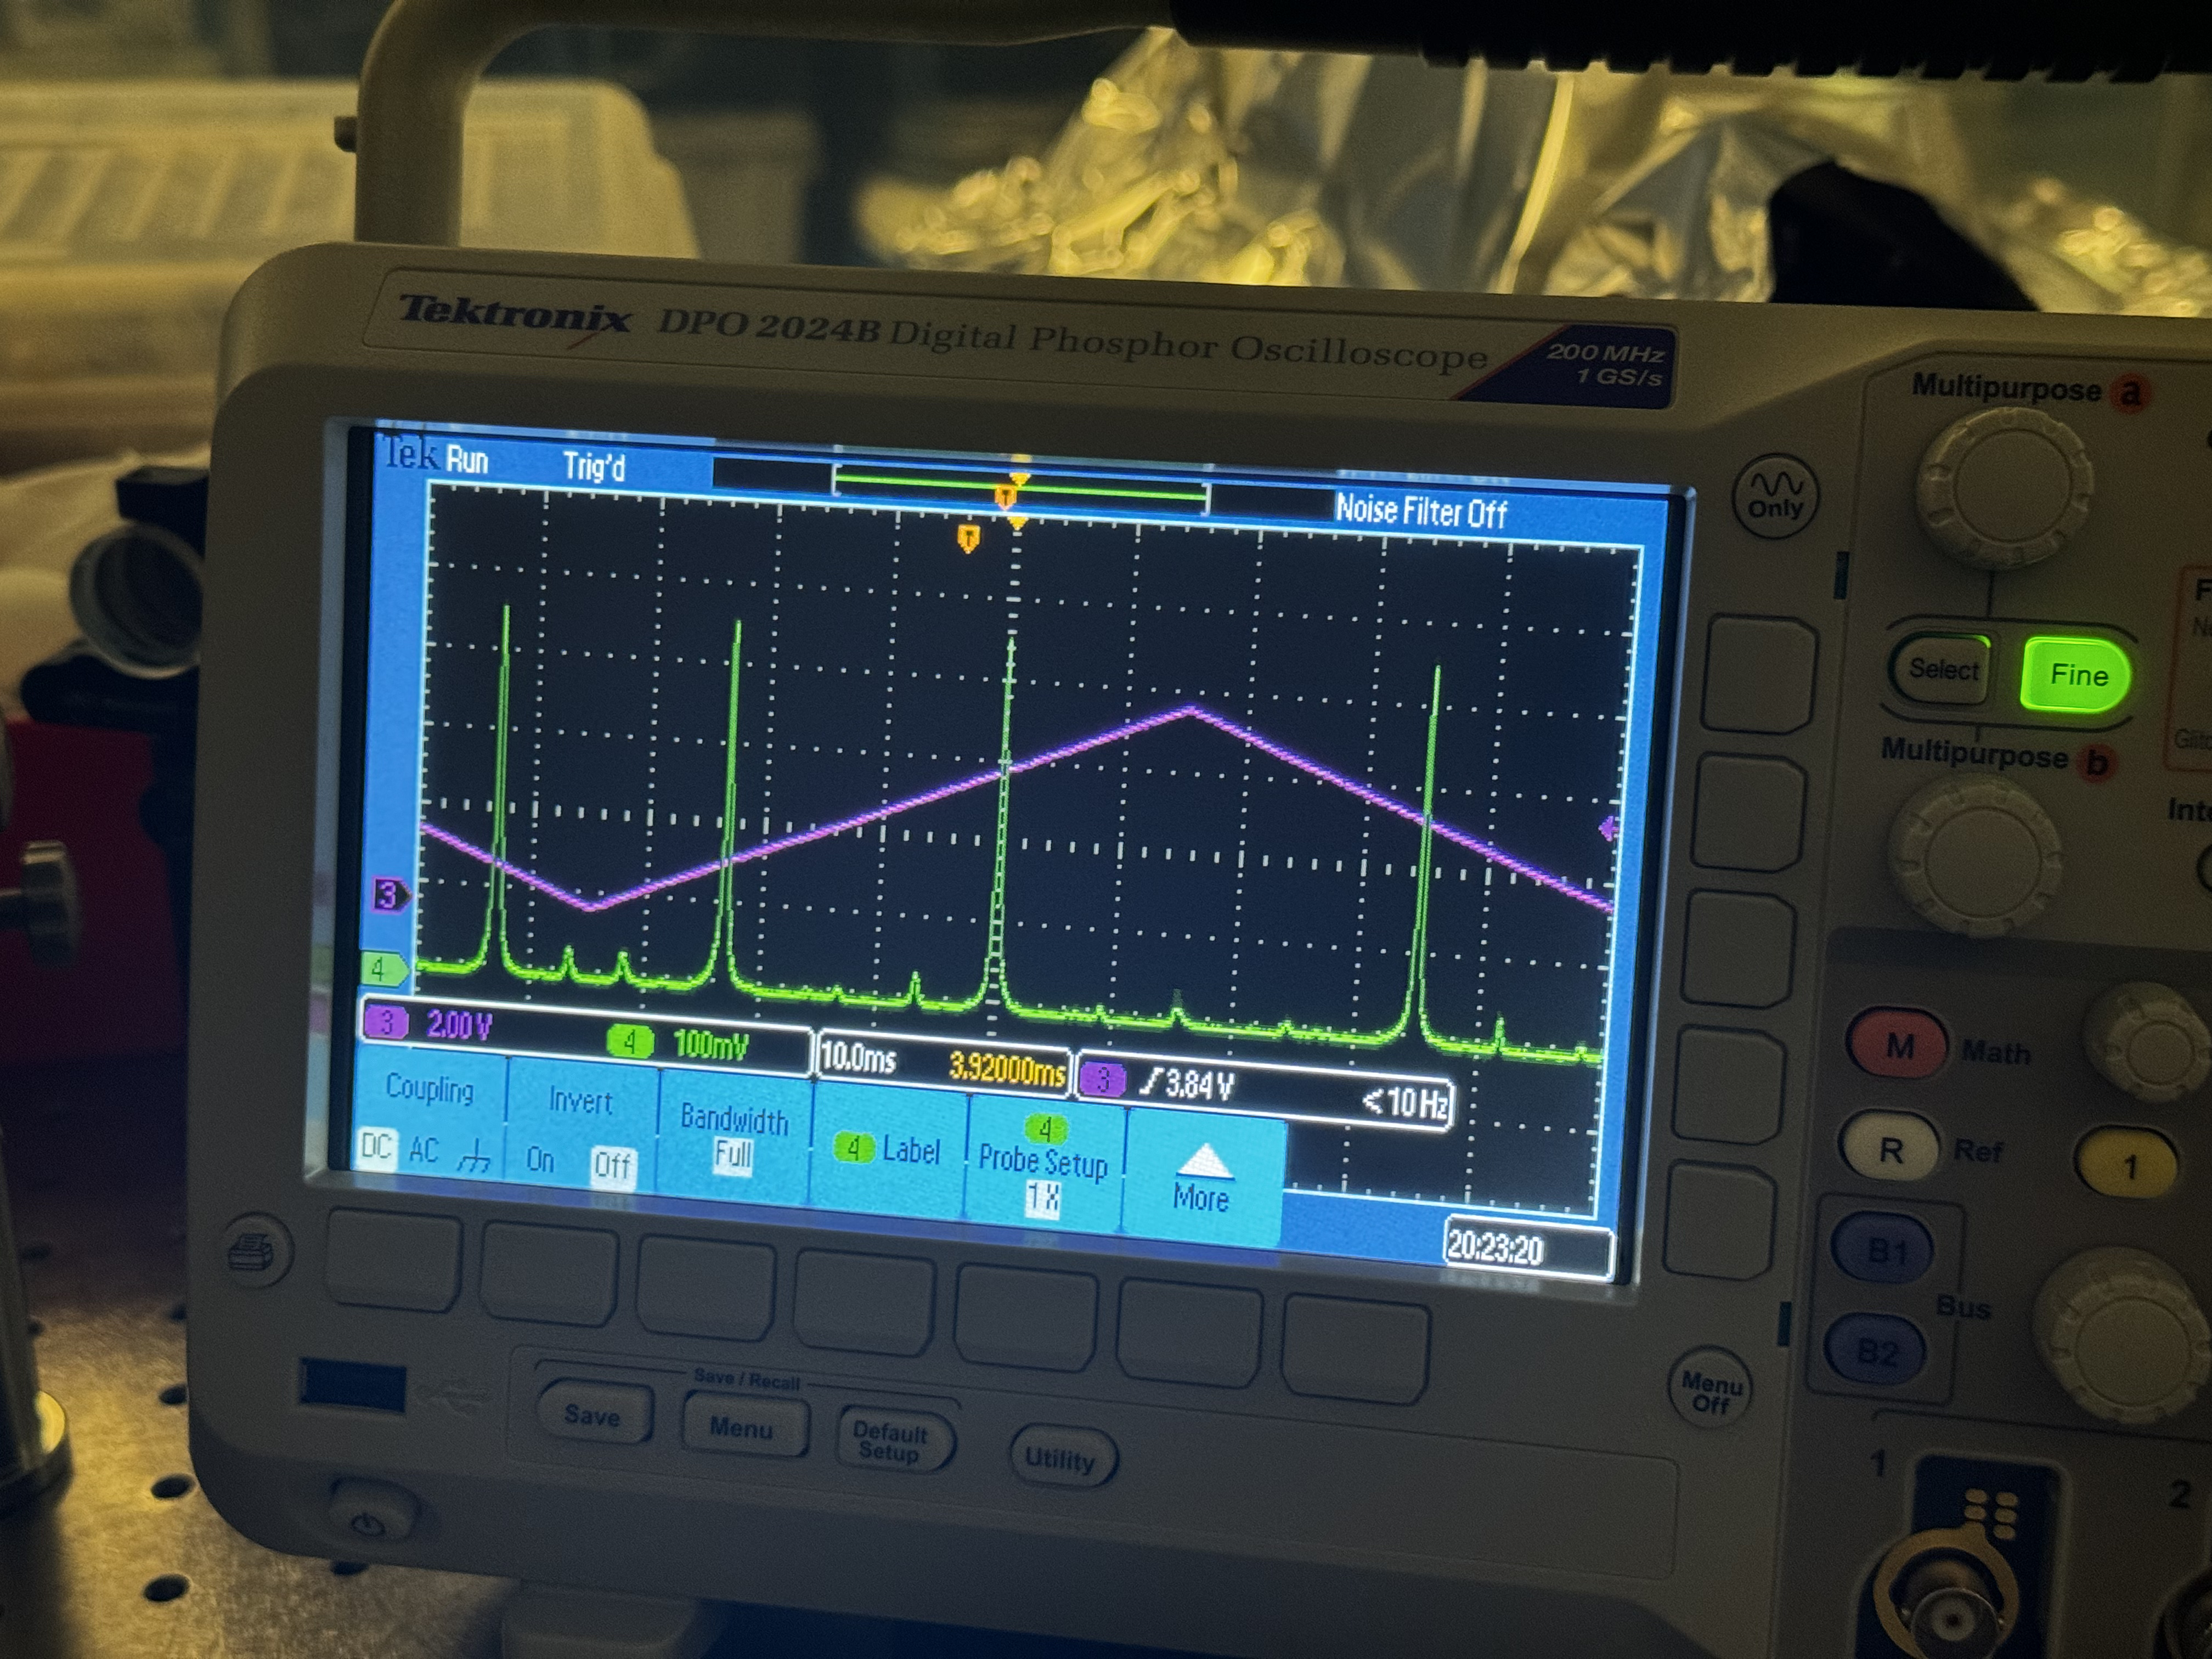
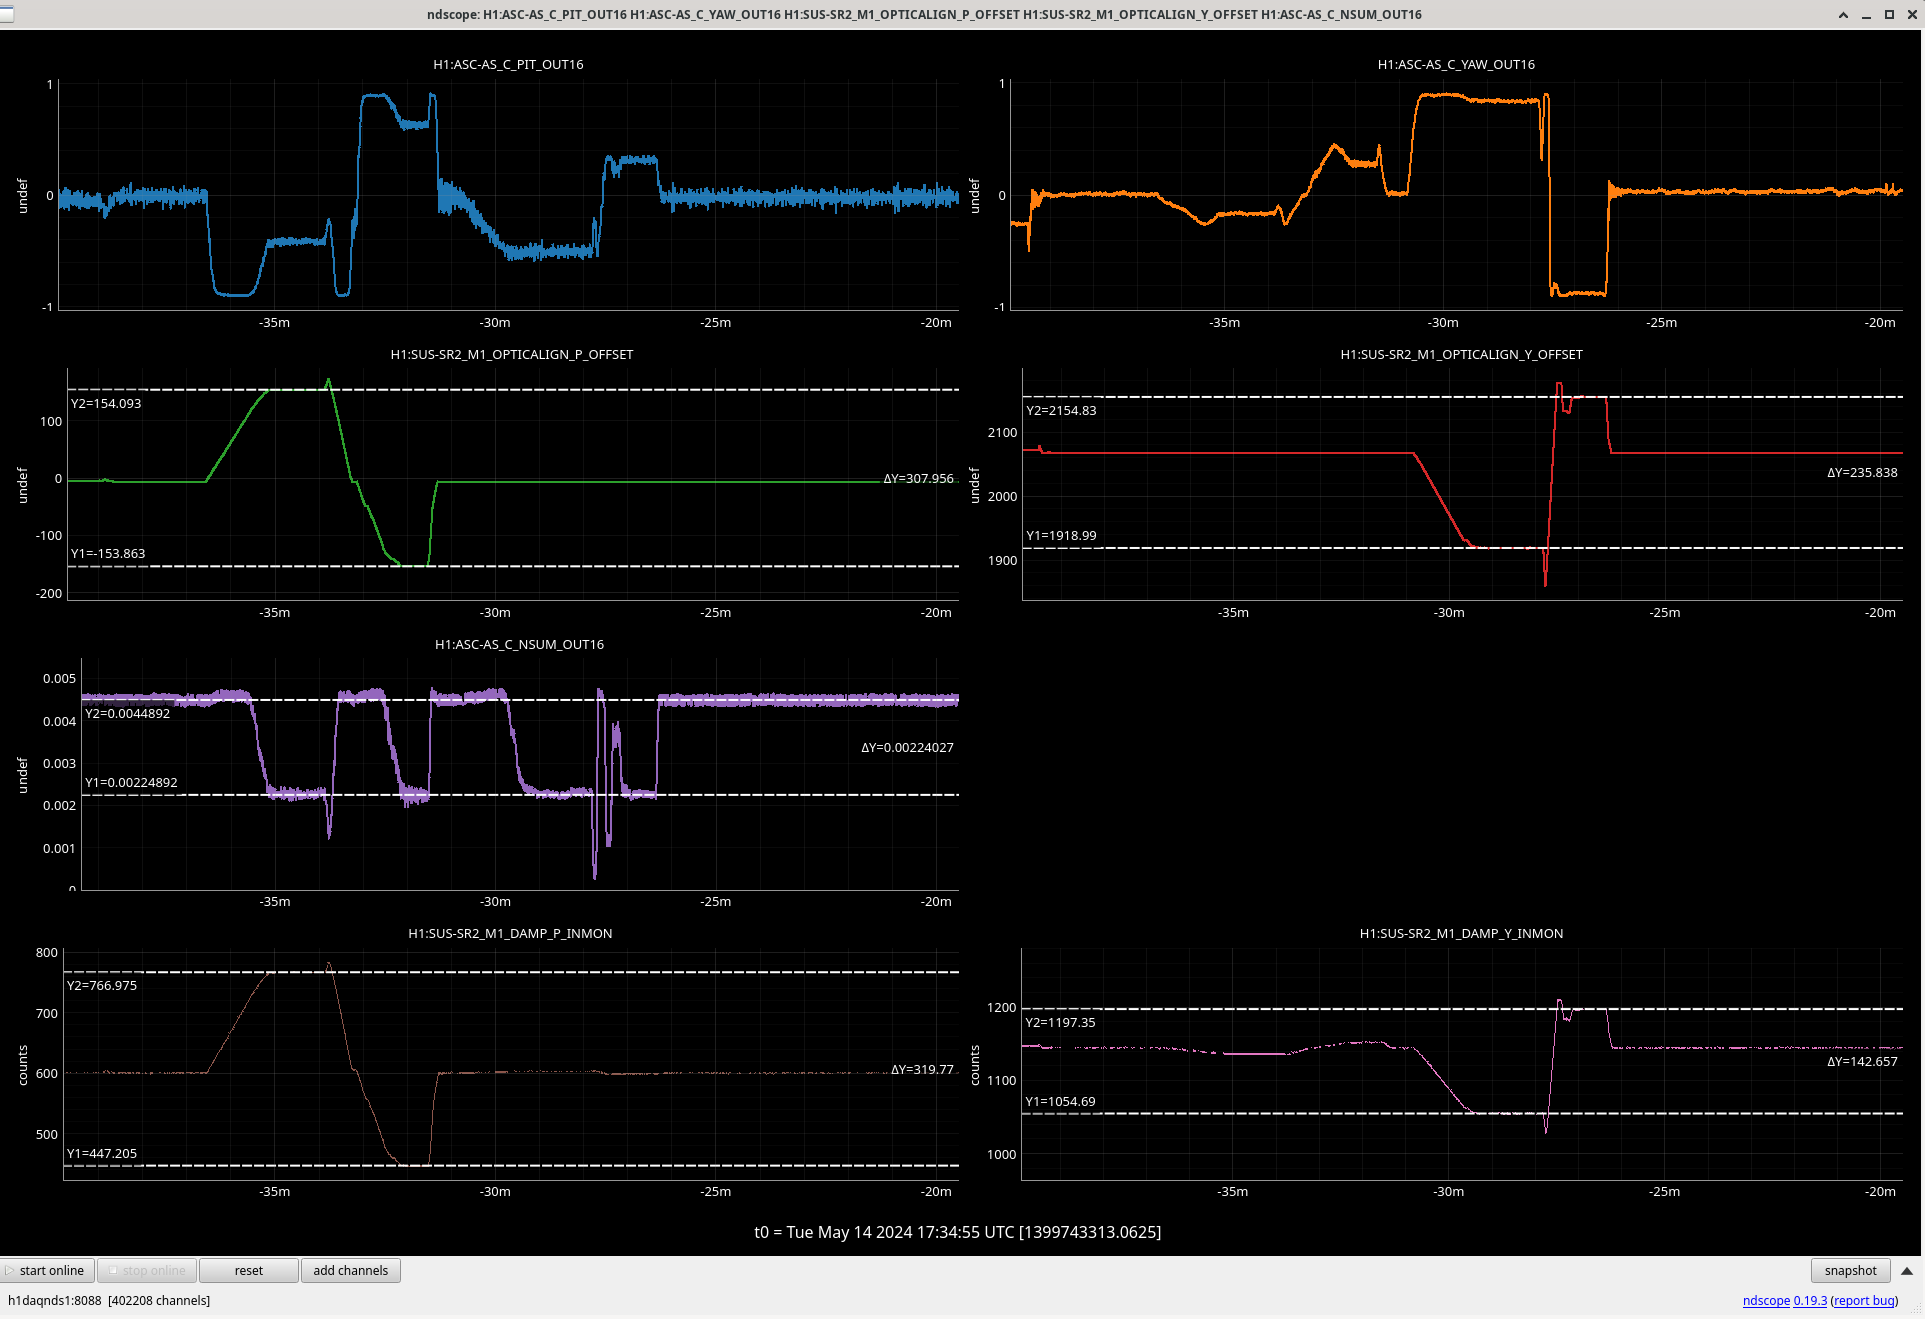
I then moved SR2 up in pitch until the AS_C_NSUM was reduced by 50%, from 0.0045 to 0.00225 (the y-axis cursors on the _NSUM plot attached). I went back to center, repeated for the opposite direction in pitch, then again back to center and checked the two yaw directions.
With these slider and OSEM values, along with Alena's model and Minhyo's finding that the AS_C QPD is 3mm wide, we should be able to check the slider calibration. The thought is that since we've found the slider values at which the NSUM value drops by 50%, that's roughly similar to being able to say that the center of the gaussian beam is at the very edge of the diode.
| |
SR2 P slider |
SR2 Y slider |
Slider change |
| AS_C centered |
-5.9 |
2066.9 |
N/A starting position |
| AS_C Nsum 50% +pitch |
154.1 |
2066.9 |
+160 in pitch |
| AS_C Nsum 50% -pitch |
-153.9 |
2066.9 |
-148 in pitch |
| AS_C Nsum 50% -yaw |
-5.9 |
1918.9 |
-148 in yaw |
| AS_C Nsum 50% +yaw |
-5.9 |
2154.9 |
+88 in yaw |
I'll note that the +yaw slider change is dramatically different from the other 3, so we must be hitting something different. I did double-check, and I get the same answer of 50% reduction in AS_C_NSUM when the SR2 yaw slider goes to 2154.9, so it's not a typo. The beam is starting to fall off of the AS_C camera for that position, so I can't really say if things are qualitatively different in the beam shape between the two yaw extrema. I didn't check what the beam shape looked like for the pitch extrema either.
EDIT: I forgot to add my screenshot. The Y-cursors for the purple AS_C plot in the 3rd row to be the nominal AS_C_NSUM value, and the 50% value. The y-cursors for the other plots are the slider values at the 50% NSUM points.
EDIT EDIT: Anamaria reminds me that it's possible that we could also be clipping somewhere in the path behind OM1 on the way to AS_C. That's a little hard to check, and I think the beam motion back there should be fairly small, but it's something to be mindful of.