Supply Fan 1 at EX had faulty bearing(s) which was causing excessive noise. Macdonald Miller was on site this week to carry out the repairs. The work began Monday (5/6) and was completed Tuesday (5/7). The duration of the work was approximately the same on both days (8am-4:30pm) with brief lunch breaks around noon. All of the work was contained to the mechanical space of the end station. T. Guidry
Lockloss @ 18:35 UTC - link to online lockloss tool
No immediately obvious cause; ETMX saw the first erratic movement as usual.
Fri May 10 10:10:49 2024 INFO: Fill completed in 10min 45secs
Travis confirmed a good fill curbside. Note we are now in "summer mode" with TC-mins railing at -200C.
I made a quick plot of low noise % vs wind speed for O4a and thought it was interesting enough to share. This is by no means an analysis, just a quick look. Someone should probably do something similar to what Laurence and Sheila made for O3 for O4a (alog49682), but that someone is not me at the moment. Unlike on Figure 6 of Sheila's similar ER7 plot (T1500368), there isn't a clear drop off at a particular speed. This could be due to directional impacts and the wind fence, or a plethora of other factors. Figure 19 on this paper (<a href="https://dcc.ligo.org/DocDB/0150/P1800038/005/BRSLIGOCQG.pdf">P1800038</a> is again similar with O1 and O2 data, but in m/s. I'm very curious about looking around times of lock losses or failed acquisitions, but I'm not making promises if I'll ever get to those.
This is minute trends of the max wind, binned in integers, then taking the percent of time we were in ISC_LOCK states of >=600.
FAMIS 26243
Laser Status:
NPRO output power is 1.819W (nominal ~2W)
AMP1 output power is 66.92W (nominal ~70W)
AMP2 output power is 138.6W (nominal 135-140W)
NPRO watchdog is GREEN
AMP1 watchdog is GREEN
AMP2 watchdog is GREEN
PDWD watchdog is GREEN
PMC:
It has been locked 37 days, 21 hr 50 minutes
Reflected power = 18.77W
Transmitted power = 108.1W
PowerSum = 126.8W
FSS:
It has been locked for 0 days 7 hr and 12 min
TPD[V] = 0.8582V
ISS:
The diffracted power is around 2.3%
Last saturation event was 0 days 7 hours and 12 minutes ago
Possible Issues:
PMC reflected power is high (this is known, pending further alignment plans)
H1 was out of observing from 14:53 to 15:36 UTC to fix some issues with the SQZ system as we were seeing last night.
After Sheila adjusted the fiber polarization (alog77754), I reverted Corey's changes to the SQZ Guardians' nominal states (listed in his alog77740), then optimized the SQZ angle by running SQZ_MANAGER through 'SCAN_ALIGNMENT_FDS' and 'SCAN_SQZANG,' increasing BNS range by ~10Mpc.
Vicky pointed out that we have picos to adjust the fiber polarization for the new TTFSS fiber beatnote. Adjusting that did bring our beatnote back to a similar level to what it was before the box was swapped on Tuesday, just below 8dBm.
There were many SQZ SDFs, I think related to going to OBSERVE with no squeezing. I think it would be better to ignore these SDF files from the checks when we are in no sqz than to accept many new settings into the OBSERVE.snap, which kind of defeats the purpose of SDF.
The RF Scanner resides in the MSR and its antenna is located on the LVEA roof, close to the GPS receivers. It scans for RF signals in the MHz range, producing a time-freq png plot every 10 minutes.
The freq plots are now available via the DTS web server, URL is https://badger.ligo-wa.caltech.edu/rfscan/pngs/ (one directory per UTC day).
I converted the 144 daily plots into a mp4 movie for the days May 01-08, for example 03 May MP4 Movie. Note that there are some 700-800MHz bursts in the second half, which represents LHO business hours on site (5am - 5pm PDT Friday 3rd May).
TITLE: 05/10 Day Shift: 1430-2330 UTC (0730-1630 PST), all times posted in UTC
STATE of H1: Observing at 131Mpc
OUTGOING OPERATOR: Ryan C
CURRENT ENVIRONMENT:
SEI_ENV state: CALM
Wind: 4mph Gusts, 3mph 5min avg
Primary useism: 0.01 μm/s
Secondary useism: 0.12 μm/s
QUICK SUMMARY: H1 has been locked and observing (without SQZ) for almost 5 hours.
Lockloss overnight (08:39 UTC) appears to be from a M5.8 EQ out of Taiwan; earthquake mode activated 40 seconds prior. H1 relocked itself without issue and resumed observing at 09:46 UTC.
I finally got round to comparing the visibility measurements we took in this entry and comparing them with the mode scan taken on April 16th before our mysterious drop in optical gain possibly due to the OFI.
April 16th Measurement:
HOM mis-match from scan = 0.09825 = 9.83% calculated using inferred height of carrier 02 and carrier 20 modes and the measured height of the carrier 00 mode.
HOM mis-match from visibility = 9.763 %
round trip loss: 3504 ppm
Measurement taken on April 30th - old alignment
HOM mis-match from scan = 0.08454 = 8.45% calculated using inferred height of carrier 02 and carrier 20 modes and the measured height of the carrier 00 mode.
HOM mis-match from visibility = 19.870 %
round trip loss = 3289 ppm
Measurement taken on April 30th - new SR2 and SR3 alignment:
HOM mis-match from scan = 0.09954 = 9.95% calculated using inferred height of carrier 02 and carrier 20 modes and the measured height of the carrier 00 mode.
HOM mis-match from visibility = 14.415 %
round trip loss = 3495 ppm
The round trip loss seems to have been worse after the OFI problems started but I can't reconcile the two methods of measuring mode mis-match. In any case it seems like out current alignment has brought our current OMC round trip loss and the mode mis-match (as inferred from mode scans) back to the April 16th values.
TITLE: 05/09 Eve Shift: 2300-0800 UTC (1600-0100 PST), all times posted in UTC
STATE of H1: Observing at 153Mpc
INCOMING OPERATOR: Ryan C
SHIFT SUMMARY:
H1 is in No-Squeezing configuration (see procedure). These SQZ nodes will need their nominal states changed in their python files to return to Observing WITH-Squeezing:
LOG:
Since the A2L script that measures a transfer function isn't quite minimizing our ASC noise in DARM, Sheila suggested re-finding the old A2L script that we used to use, which just looks at the height of the peak in DARM.
I think I've found it, in /opt/rtcds/userapps/release/isc/common/scripts/decoup/al2_min_LHO.py . I made sure that it, and other scripts in that directory, were checked in to svn (they were last modified somewhere between 2018 and 2019, depending on the script).
The script (as wrtitten) uses the ADS to actuate each of the quads, and uses the demods to find the size of the signal (it does a sum of the squares of the I and Q of the demodulated signal). The script just guess-and-checks several A2L gain values for each optic, makes a step, and checks again. Once it's finished, it does a linear fit to find the A2L value at which the peak height is expected to be zero. The script runs 8 dither lines (pit and yaw from each quad) around 20 Hz, so that it can do this guess-and-check for all the optics at the same time.
The values in the script are out of date (we've slightly modified the frequencies we use for ADS while locking), so those values and the filter numbers for the matching bandpasses need to be checked. Also, the excitation amplitude in the script is probably higher than we need (they are set to be 300 counts, but we use 30 counts at full power right now, but we may want a little better SNR so we might want to find a value that is between those two.
Also, we may find that we want to instead do the optics one at a time, at 30 Hz, where the coupling of ASC to DARM is more important to our range.
We can try this out during one of our commissioning windows later this week, to see how it goes.
Hey Jenne, I did a total rework of the A2L scirpt for LLO [70246, 69555, 70219].
We never did all of the quads at the same time. We only ran 1 QUAD at a time.
Despite that, the biggest issue I found was that running 2 lines (pitch and yaw) at the same time was a big no-no because the sideband noise they create bleeds into eachother's demod bandwidhts, making the data rubbish and consequently the result rubbish.
My new script that now lives in, and is up to date in the svn:
/opt/rtcds/userapps/release/isc/common/scripts/decoup/a2l_min_generic.py
Warning: despite the script living in a common directory, it is infact only for LLO, because it makes calls to our Calibration Guardian to turn off all of the calibration lines, since we chose to run the demod line at the worst decoupled frequency (exactly where our calibration lines are).
Feel free to draw upon my hours of testing this approach :)
I pulled Vlad's LLO script via the svn (thanks!!), and made a copy /opt/rtcds/userapps/release/isc/common/scripts/decoup/a2l_min_generic_LHO.py . The name is not so good, but at least by knowing that it's the most recently modified file in the folder, we might have some memory of it being the latest.
I lowered the amplitude of excitation to be 30 counts (the same as what we use for ADS after Lownoise_ASC), and when the A2L gains are at the extremal values that the script measures (+/-0.3 from nominal) the line is clear in DARM but not scary-big. I am using the same 30 Hz that Sheila had been using, so this 30 count amplitude is actually a bit smaller in meters than 30 counts at ~20 Hz for ADS.
I set up filters in PIT7 / YAW7 and changed the script to use #7 rather than LLO's #2 set of ADS infrastructure, since #7 was unused for us. I used the same 0.1 Hz half-width for the bandpass that I think Vlad has in place at LLO.
I commented out the "setting the matrices" section and just did those steps by hand today, since I need to import the correct guardian matrices and double-check the indices, and doing it by hand got me going faster to actually trying the script.
I added _SPOT to the test mass drivealign channel names, since we use those here.
I added a few measurement steps so that it's not just jumping by an A2L gain of 0.3. The IFO can handle it, and I may take these extra steps back out (where I pause at a value of 0.15 from nominal before finishing to the 0.3 step), but for testing I didn't want to be too risky.
I also added a calculation to Vlad's script (and this is what could easily be the source of the error that I'll talk about next has come from), to take the sqrt of the sum of the squares of the I and Q demod signals, so that I don't have to worry about setting the demod phase of the ADS demodulator.
However, the answer from the linear fit doesn't seem to make much sense at all. Again, this could be due to my modification of Vlad's script, so I'll need to come back to this and make sure I'm doing what I think I'm doing, before testing again on the IFO. I was only testing on ETMX P so far, and it's clear by watching the line height in DARM and watching the I and Q demod outputs that the current nominal that Sheila has set of 3.35 P2L gain for ETMX is about as good as we can do. However, after trying values between 3.05 and 3.65, somehow the fitting function seems to think that it should be set to 1.76(!!). Thankfully I had forgotten to add the _SPOT to the line that would have written the value and jumped the gain straight to there, so that value didn't actually get written to the IFO. I've commented out the writing of the value from the script for now, until I figure out what's going on with the fitting.
Next up is to see if I can understand why the fit tried to send me to such a strange A2L gain, then check that this amplitude is okay for other quads both pit and yaw, then actually run it to see it minimize coupling.
Below here is just notes to self, for figuring out what's going on with the fitting. I should have had the script print out more so I could double check it's sqrt-sum-squares, but I can at least check for the last value. The two long arrays are what are being fit to. Reminder to self that I got the same gain it wanted to send me to of 1.7-ish, even before I changed / added more steps and re-measuring some values. But, that was after I added in the summing of the squares. I didn't ever run the script with just looking at the I output of the demod.
Result in terminal from (lines 279-282 in the script)
print(gainList)
print(meanI)
print(meanQ)
print(meanList)
is
[3.2 3.05 3.2 3.35 3.5 3.65 3.5 3.35]
0.0004724146701240291
2.2764012343638282e-05
[0.00614473 0.01331277 0.0065377 0.00075812 0.00755947 0.01463074
0.00760131 0.00047296]
Want to change gain from 3.35 to 1.779, rounded to 2 decimal places. St.Div is 0.054
take the sqrt of the sum of the squares of the I and Q demod signals, so that I don't have to worry about setting the demod phase of the ADS demodulator.
I only take the I; I am not sure if the sqrt of I and Q might confise signs: and therefore break the linear fit of the function. Might make it non-linear; which breaks things. I quickly plotted (attachment) what you wrote, and it looks like it isnt going negative because sqrt will only give positive results. It tries to solve for zero crossing, but here zero looks to be near 3.35, but then goes back up.
Actually the reason I only look the I-phase is because I dont want go rephasing the demodulation, and just assume there is some signal in I. Then just solving for zero crossing should not care about actual amplitudes.
However, after trying values between 3.05 and 3.65, somehow the fitting function seems to think that it should be set to 1.76(!!)
Do not trust this! After fixing it such that you preserve sign (so that linear fit solves for zero crossing), always check the output to make sure it is not extrapolating a linear result far away, because at far distances you can't comepletly trust that it is linear.
Want to change gain from 3.35 to 1.779, rounded to 2 decimal places. St.Div is 0.054
For reference: the fitted zero crossing st.div for us is about 0.003. Adjust amplitudes accordingly, after you are getting logical results.
Sheila asked a good question the other day of, Did SR2 alignment change between the beginning of O4b (when things were still good) and when we had the bad losses through the OFI (when things were bad, before the big shift). The answer: no, I don't think SR2 moved very much (according to its top mass osems) when the the losses through the OFI showed up. It did move about 10 urad in yaw (see table below), which I plan to look into further.
I looked at several times throughout the last few weeks when ALIGN_IFO guardian had just finished up state 58, SR2_ALIGN at 10 W, which it now does every time initial alignment is automatically run. These should all be single bounce off of ITMY, with the beam centered on AS_C by adjusting the SR2 sliders, for some given SR3 slider position (nothing automatic touches the SR3 sliders).
In the table, I summarize the SR3 and SR2 top mass osems. I've got 3 categories of times for the IFO situation:
Note that this table is not chronological, since I've grouped rows by IFO situation rather than time. The SR2 and SR3 osem values that are in bold are the ones to compare amongst each other. There does seem to be a 10 urad shift in SR2 yaw between the April 21st and April 23rd times. There are no other run-throughs of the SR2_ALIGN state of ALIGN_IFO between these times to check. This SR2 yaw shift (which is consistent even when we revert sliders to the 'pre shift' values and run SR2_ALIGN) is notable, but not nearly as large as what we ended up using for steering around the spot in the OFI.
| IFO 'situation' | Date / time [UTC] | AS_C NSUM value | SR3 Pit [M1_DAMP_P_INMON] | SR3 Yaw [M1_DAMP_Y_INMON] | SR2 Pit [M1_DAMP_P_INMON] | SR2 Yaw [M1_DAMP_Y_INMON] |
| (1) before EQ, before loss, before alignment shift | 17 Apr 2024 00:19:00 | 0.0227 | -281.5 | -612.2 | 569.8 | 35.3 |
| (1) after EQ, before loss, before alignment shift | 21 Apr 2024 20:08:30 | 0.0227 | -281.5 | -611.9 | 571.9 | 35.3 |
| (2) after EQ, after loss, before alignment shift | 23 Apr 2024 23:10:00 | 0.0193 | -281.9 | -612.2 | 572.7 | 26.7 |
| (2) after EQ, after loss, shift temporarily reverted to check | 7 May 2024 18:10:00 | 0.0187 | -282.3 | -616.0 | 558.5 | 23.2 |
| (3) after EQ, after loss, after alignment shift | 25 Apr 2024 12:18:20 | 0.0226 | -291.7 | -411.1 | 599.6 | 1150.0 |
| (3) after EQ, after loss, after alignment shift | 7 May 2024 19:11:15 | 0.0226 | -292.4 | -408.8 | 597.6 | 1149.9 |
After a quick re-look, that 10 urad move in SR2 yaw seems to have come during maintenance, or sometime later than the time that the loss showed up.
In the attachment, the vertical t-cursors are at the times from the table in the parent comment on April 21st and 23rd. The top row is SR2 pitch and yaw, and the bottom row is SR3. The middle row shows our guardian state (i.e. when we were locked), and kappa_c which is indiciative of when we started to see loss. In particular, there are 3 locks right after the first t-cursor, and they all have quite similar OSEM values for SR2 yaw (also the times between locks are similar-ish). Those three locks are the last one with no loss, one with middling-bad loss, and one with the full loss. So, it wasn't until after we had our full amount of loss that SR2 moved in yaw. I haven't double-checked sliders yet, but probably this is a move that happened during maintenance day.
I'm using Jenne's times above to do a similar check, but looking at times when ALIGN_IFO was in state 65 (SRY align) because in that state the AS WFS centering servos are on. This state is run shortly after state 58, so I'll reuse Jenne's numbers to refer to times and the IFO situation.
This table indicates that changes in AS power are consistent between AS_C and the AS WFS, so the beam transmitted by OM1 and reflected by OM1 see similar losses. This makes it seem less likely that a bad spot on OM1 is the problem (and points to probably being an issue with the OFI), although it's not impossible that a loss on OM1 is seen in the same way for transmission and reflection.
| AS_C sum | AS_C normalized to first row | AS_A sum | AS_A normalized to first row | AS_B sum | AS_B normalized to first row | ||
| 1 | April 17 00:20:15 UTC | 0.0626 | 1 | 5264 | 5104 | ||
| 1 | April 21 20:09:43 UTC | 0.0629 | 1.005 | 5283 | 1.004 | 5114 | 1.002 |
| 2 | April 23 23:34:15 UTC | 0.0534 | 0.853 | 4595 | 0.873 | 4359 | 0.854 |
| 2 | AS centering was not run this time | ||||||
| 3 | April 25 12:19:36 UTC | 0.0622 | 0.993 | 5209 | 0.989 | 5083 | 0.996 |
| 3 | May 7 19:12:30 UTC | 0.0624 | 0.997 | 5241 | 0.996 | 5118 | 1.003 |
Sheila, Jenne, Tony, Camilla
We've had locklosses in DRMI because the PRCL gain has been to high when locked on REFL1F. Tony looked and thinks that this started on 77583, the day of our big shift in the output alignment.
Today we acquired DRMI with half the gain in the PRCL input matrix for 1F, this one acquisition was fast. I've attached the OLG measurements for PRCL and MICH after the change.
Tony is working on making histograms of the DRMI acquisition times, before the 23rd, from the 23rd to today, and eventually a histogram from today for the next few weeks to evaluate if this change has an impact on the DRMI acquisition times.
Jenne also found that it seems out POP18 build up seems higher in DRMI since the 23rd.
I'm no longer quite so sure about the conclusion that Pop18 is higher, or at least enough to really matter.
Here are 2 screenshots that I made extremely quickly, so they are not very awesome, but they can be a placeholder until Tony's much more awesome version arrives. They both have the same data, displayed 2 ways.
The first plot is pop18 and kappaC versus time. The x-axis is gpstime, but that's hard to interpret, so I made a note on the screenshot that it ranges from about April 20th (before The Big Shift) to today. Certainly during times when the optical gain was low, Pop18 was also low. But, Pop18 is sometimes high even before the drop in optical gain. So, probably it's unrelated to The Big Shift. That means that the big shift in the output arm is not responsible for the change in PRCL gain (which makes sense, since they should be largely separate).
The second plot is just one value versus the other, to see that there does seem to be a bit of a trend that if kappaC is low, then definitely Pop18 is low. But the opposite is not true - if pop18 is low kappaC isn't necessarily low.
The last attachment is the jupyter notebook (you'd have to download it and fix up the suffix to remove .txt and make it again a .ipynb), with my hand-typed data and the plots.
I actually didn't load the guardian at the time of this change, so it didn't take effect until today.
So, we'd like histograms of DRMI acquitisiton times from before April 23rd, from April 23rd until today, and for a few weeks from today.
Using the Summary pages I was able to get a quick google sheet to give me before and after Histograms of how long ISC_LOCK was in DRMI 1F.
First Sheet's data is before Nov 18th 2024, consisting of 100 gpstimes and durations where ISC_LOCK was in AQUIRE_DRMI_1F.
Second Sheet's data is After Nov 18th 2024. Consisting of 100 gpstimes and durations where ISC_LOCK was in AQUIRE_DRMI_1F
Interesting notes about ISC_LOCK.
ISC_Lock will request PRMI or Check MITCH Fringes some where between 180 seconds and 600 seconds, depending on how much light is seen on AS_AIR.
If AS_AIR sees flashes above 80 then ISC_LOCK will not kick us out of DRMI until 600 seconds.
So it looks like one of the changes that happened on or around Nov18th made the Flashes on AS_Air higher but we are still not actually locking DRMI.
We had fewer Aquire DRMI durations, over 180 Seconds before Nov 18th's changes.
Jennie W, Sheila
Today we took OMC scans to help diagnose what is going on with our alignment through the OFI - that is, what is the mode-matching at our the old alignment (as of Monday 22nd) and our new alignment (as of this morning).
Sheila turned off the sidebands before the test and we had the ETMs and the ITMX mis-aligned initially for single bounce configuration.
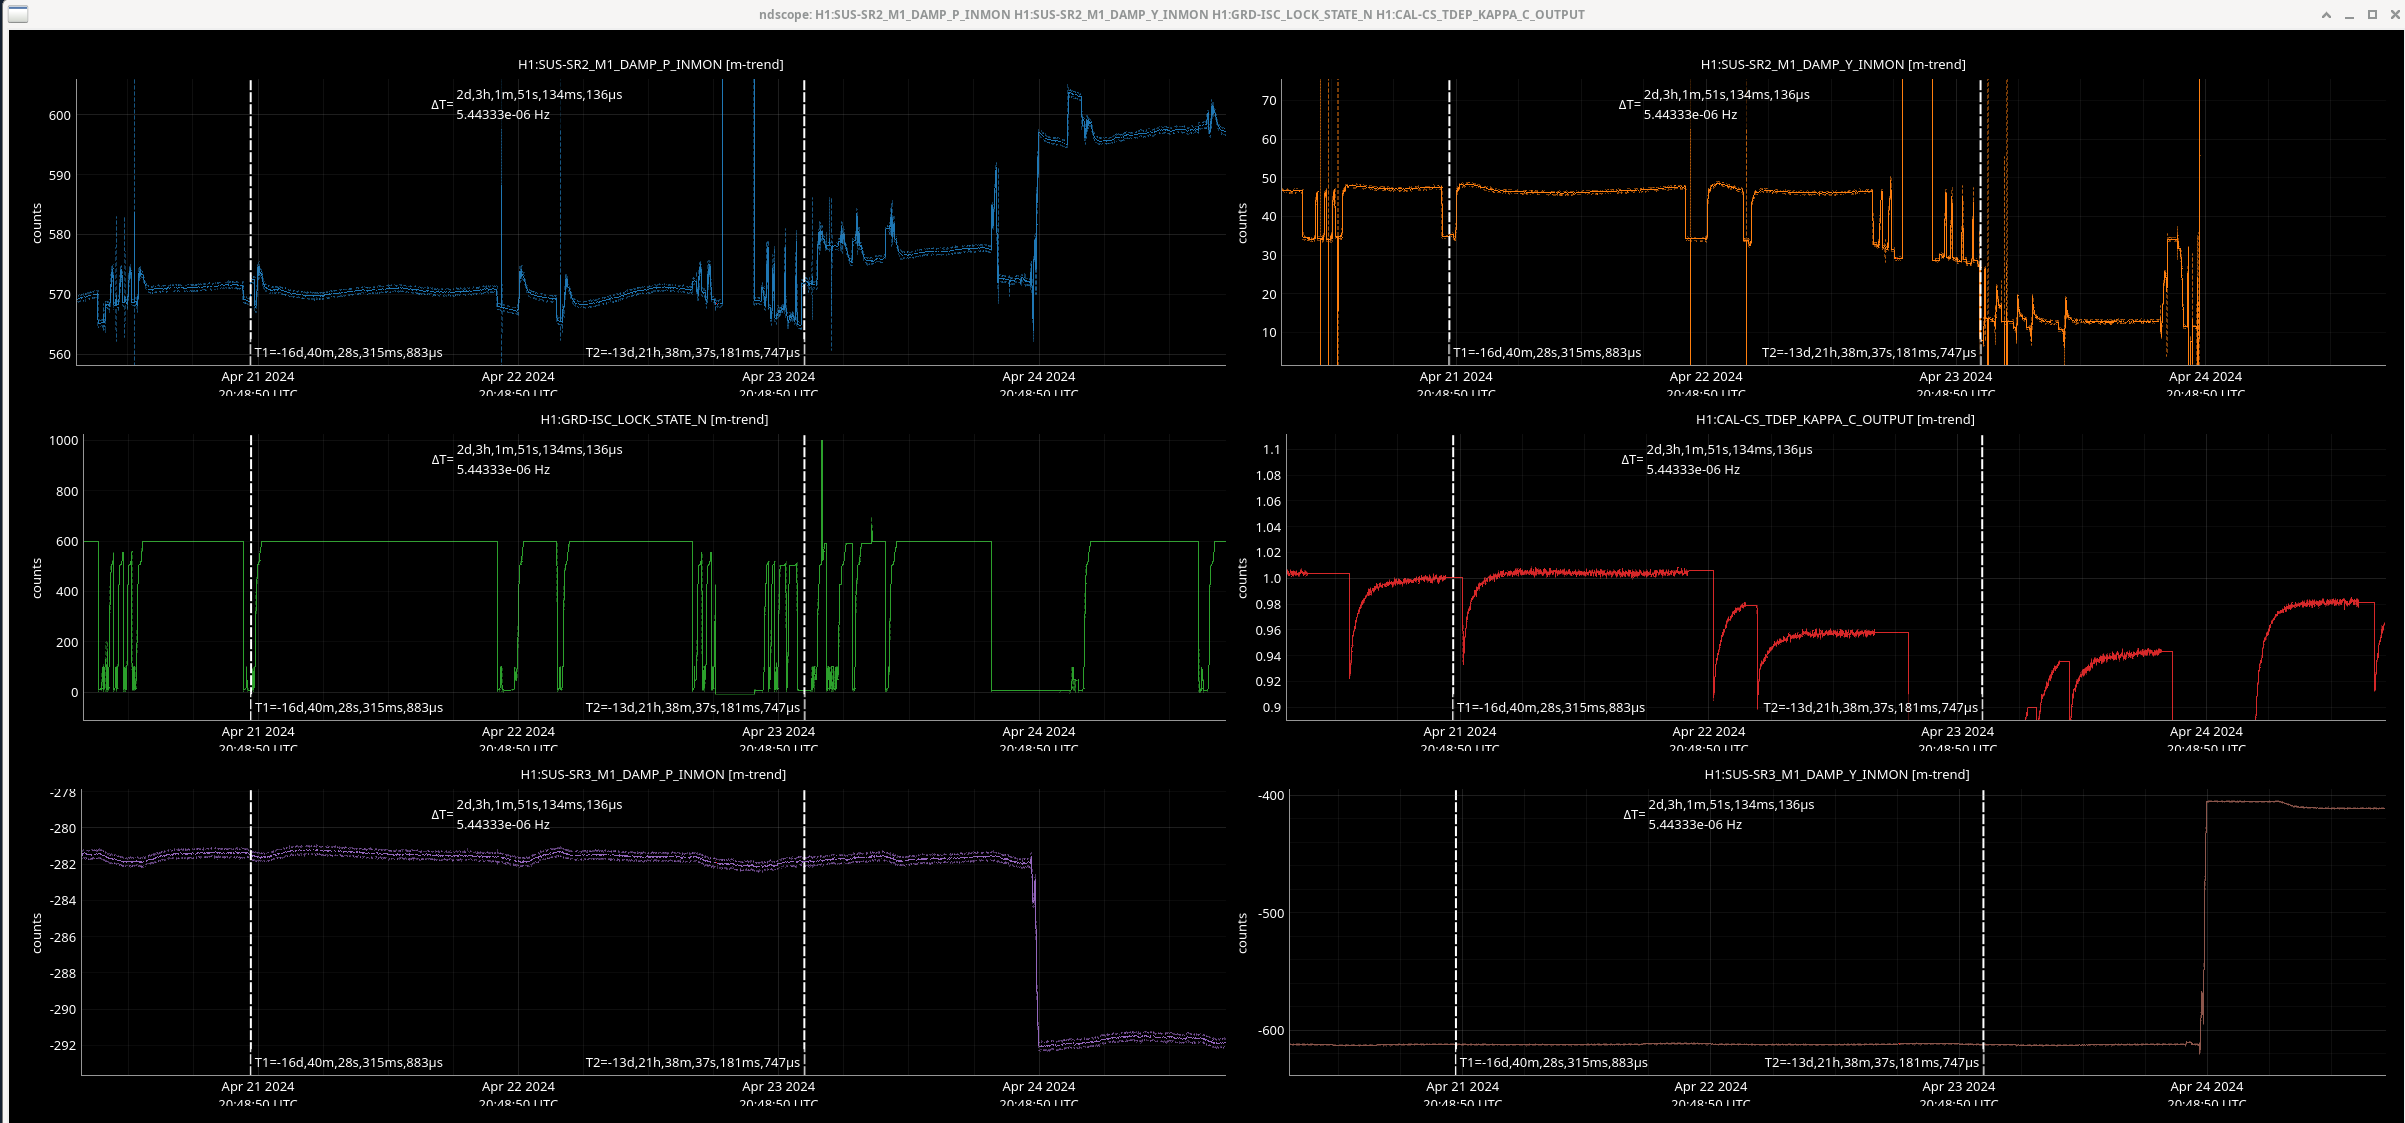
Old alignment: SR3 M1 YAW OFFSET = -125 microradians
SR3 M1 PIT OFFSET = -437 microradians
SR2 M1 YAW OFFSET = -421 microradians
SR2 M1 PIT OFFSET = -64 microradians
Due to PEM measurements we switched from single bounce off ITMY to single bounce off ITMX.
Locked time = 1 minute from GPS 1398534847
Unlocked time = 1 minute from GPS 1398534984
Scan = 200 s starting at 1398535070 GPS
New alignment: SR3 M1 YAW OFFSET = 120.2 microradians
SR3 M1 PIT OFFSET = 437.9 microradians
SR2 M1 YAW OFFSET = 2061.7 microradians
SR2 M1 PIT OFFSET = -5.5 microradians
Locked time = 1 minute from 1398538330 GPS
Unlocked time = 1 minute from 1398538461 GPS
Scan = 200 s starting at 1398537927 GPS
Dark time with IMC offline and fast shutter closed = 1398538774 GPS
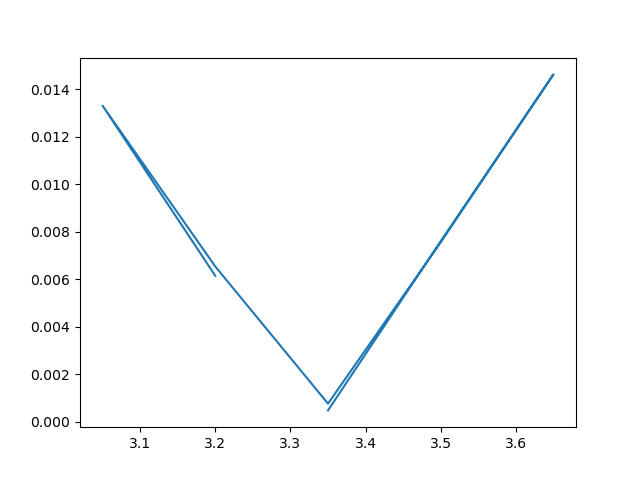
Mode mis-match measurments pending...
The loss through the OMC appears to have increased after whatever happened to the output path on April 22nd.
I use again Sheila's OMC loss calculation code as we previously used in this entry.
Power on refl diode when cavity is off resonance: 29.698 mW
Incident power on OMC breadboard (before QPD pickoff): 30.143 mW
Power on refl diode on resonance: 5.153 mW
Measured effiency (DCPD current/responsivity if QE=1)/ incident power on OMC breadboard: 56.5 %
assumed QE: 100 %
power in transmission (for this QE) 17.029 mW
HOM content infered: 14.415 %
Cavity transmission infered: 66.501 %
predicted efficiency () (R_inputBS * mode_matching * cavity_transmission * QE): 56.494 %
omc efficency for 00 mode (including pick off BS, cavity transmission, and QE): 66.009 %
round trip loss: 3495 (ppm)
Finesse: 335.598
We compare these values to that found from our scans on the 16th April and it seems like the HOM content has increased substantially, the incident power has decreased, and the measured and predicted cavity efficiency has decreased by 3%.
It would be good to cross-check these figures against the other methods of checking the losses, such as DARM offset step and the mode mis-match I still need to calculate from the mode scan taken on the same day.
I forgot to run the same analysis for the locked and unlocked measurements we got at the old (pre April 23rd) alignment of SR2 and SR3.
Power on refl diode when cavity is off resonance: 25.306 mW
Incident power on OMC breadboard (before QPD pickoff): 25.685 mW
Power on refl diode on resonance: 5.658 mW
Measured effiency (DCPD current/responsivity if QE=1)/ incident power on OMC breadboard: 54.1 %
assumed QE: 100 %
power in transmission (for this QE) 13.885 mW
HOM content infered: 19.870 %
Cavity transmission infered: 67.970 %
predicted efficiency () (R_inputBS * mode_matching * cavity_transmission * QE): 54.061 %
omc efficency for 00 mode (including pick off BS, cavity transmission, and QE): 67.467 %
round trip loss: 3289 (ppm)
Finesse: 339.266
I went to FCES this morning to try to troubleshoot the sort of busted H1 GS13 on HAM8. I suspect there is something going on with the cable or interface chassis, but it's not something I think I've seen before. I tried swapping cables at both the rack and the chamber, and whenever the corner 1 chassis was connected to the H1 sensor, the transfer function from the H1 CPS to the H1 sensor would be half the magnitude of the other two sensor pairs. ASDs also show the H1 GS13 has half gain when the corner 1 sensors are connected to the corner 1 chassis. However, when the H1 sensor was plugged into the corner 2 or 3 chassis, all three sensor pair tfs would have the same amplitude. I could repeat this consistently, didn't matter how I swapped the cables around, as long as the H1 sensor wasn't plugged into the correct chassis all the l2l sensor tfs would look normal.
Attached plot shows two sets of data I took during this period, red blue and light green are the normal config, dark green, pink and light blue are with the H1 sensor on the corner 3 chassis, H3 sensor on the corner 1 chassis.
I will talk to Fil, but maybe in a couple weeks we can try running a temp cable from the FC mezzanine to the chamber, and see if that changes anything.
Issue is tracked in FRS 31005
J. Kissel As we continue to investigate both ADC noise (both broadband, in-general behavior) as well as down-converted aliasing noise in the new fast 524 kHz OMC DCPD signal chain, I needed to wrap my head around all the available channels in order to begin thinking about how to compare / take advantage of the differences between the channels. I don't understand anything until I diagram it, so here's my diagram of the existing OMC DCPD signal chain as I understand it, hoping it helps others. As mentioned in each of the previous aLOGs where I've started the investigation (LHO:67552, LHO:67530, LHO:67465, LHO:67297, LHO:67439), studies of the 524 kHz portion of the system are severely limited in that (a) no 524 kHz channel stored in the frames, (b) one can only look at 3 test points at a time, (c) we don't have any analog measure of the noise between 524 kHz and 102.4 kHz (the upper limit of the SR785) to compare against But, we'll do what we can! Hopefully this visual aide will help understand future studies. For example, because we *don't* have any digital anti-aliasing filters in the OMC-PI SIG filter bank, we can compare these test point channels, - H1:OMC-DCPD_A0_OUT (524 kHz, w/ digital anti-aliasing) - H1:OMC-PI_DOWNCONV_SIG_OUT (524 kHz, w/o digital anti-aliasing) - H1:OMC-PI_DPCD_64KHZ_AHF (65 kHz, w/o digital anti-aliasing) - H1:OMC-DCPD_A_IN1 (16 kHz, w/ digital anti-aliasing) to explore the effectiveness of the digital anti-aliasing filters to better understand the aliasing that Evan Hall found in LHO:67328. Note -- and this is something that I'm still learning (via conversations with Erik von Ries and Daniel Sigg and their aLOGs, including but not limited to LHO:67587, LHO:67560, LHO:67291) -- the h1iopomc0 model actually runs at 65 kHz (really, 2^16 kHz). In order to achieve a pseudo-524 kHz data stream, there's a for loop within the h1iopomc0 model that's able to complete 8 iterations (thus 2^16 kHz * 8 = 2^19 kHz = 524 kHz) during any given 65 kHz clock cycle.
Sorry team. There's a typo in the 65 kHz version of the DCPD channel in the PI model in both the above list, as well as in the diagram.
The channel list to accompany the diagram should be
- H1:OMC-DCPD_A0_OUT (524 kHz, w/ digital anti-aliasing) [[NOT STORED IN THE FRAMES, ONLY LIVE AVAILABLE]]
- H1:OMC-PI_DOWNCONV_SIG_OUT (524 kHz, w/o digital anti-aliasing [[NOT STORED IN THE FRAMES, ONLY LIVE AVAILABLE]]
- H1:OMC-PI_DCPD_64KHZ_AHF (65 kHz, w/o digital anti-aliasing) [[STORED IN FRAMES at 65 kHz as H1:OMC-PI_DCPD_64KHZ_AHF_DQ]]
- H1:OMC-DCPD_A_IN1 (16 kHz, w/ digital anti-aliasing) [[STORED IN FRAMES at 16 kHz as H1:OMC-DCPD_A_OUT_DQ]]
Careful here: In O3, H1:OMC-DCPD_A_IN1 was NOT equivalent to H1:OMC-DCPD_A_OUT_DQ, since H1:OMC-DCPD_A_IN1 *used* to be the "raw" (down-sampled, and digital AA filtered) ADC 16 kHz channel, and then the DCPD_A bank applied all of the the calibration and frequency response compensation. Now, as of O4, with the 524 kHz system, that's done in the DCPD_A0 bank, and the DCPD_A bank is an "empty" gain of 1.0 "passthrough," so DCPD_A_IN1 is equal to DCPD_A_OUT.
Further, a reminder that we've installed a "plug" that shorts the ADC inputs of channels 17 through 20 of this new 524 kHz system, so looking at the channels might also be interesting if we're looking for noise that might be present on the ADC channels alone (i.e. without any signals going into it). See LHO:67465 for details, but in short, you want to look at the (live, not stored in the frames) 524 kHz channels, - H1:IOP-OMC0_MADC0_EPICS_CH17 - H1:IOP-OMC0_MADC0_EPICS_CH18 - H1:IOP-OMC0_MADC0_EPICS_CH19 - H1:IOP-OMC0_MADC0_EPICS_CH20 for a "shorted" version of the OMC DCPD ADC card channels. This would be useful to, say, investigate how / why the DuoTone signal shows up in the DCPDs (see LHO:77579), and to compare and contrast against the L1 DCPDs which also see it (see LHO:70961), but they've not yet segregated their OMC ADC card, and (I think) have a different, older version of the Timing Interface card.
H1 back to observing at 19:56 UTC.
A (small) wiggle