Sheila, Ryan C, Ryan S, Marc, Daniel, Oli, Control Room...
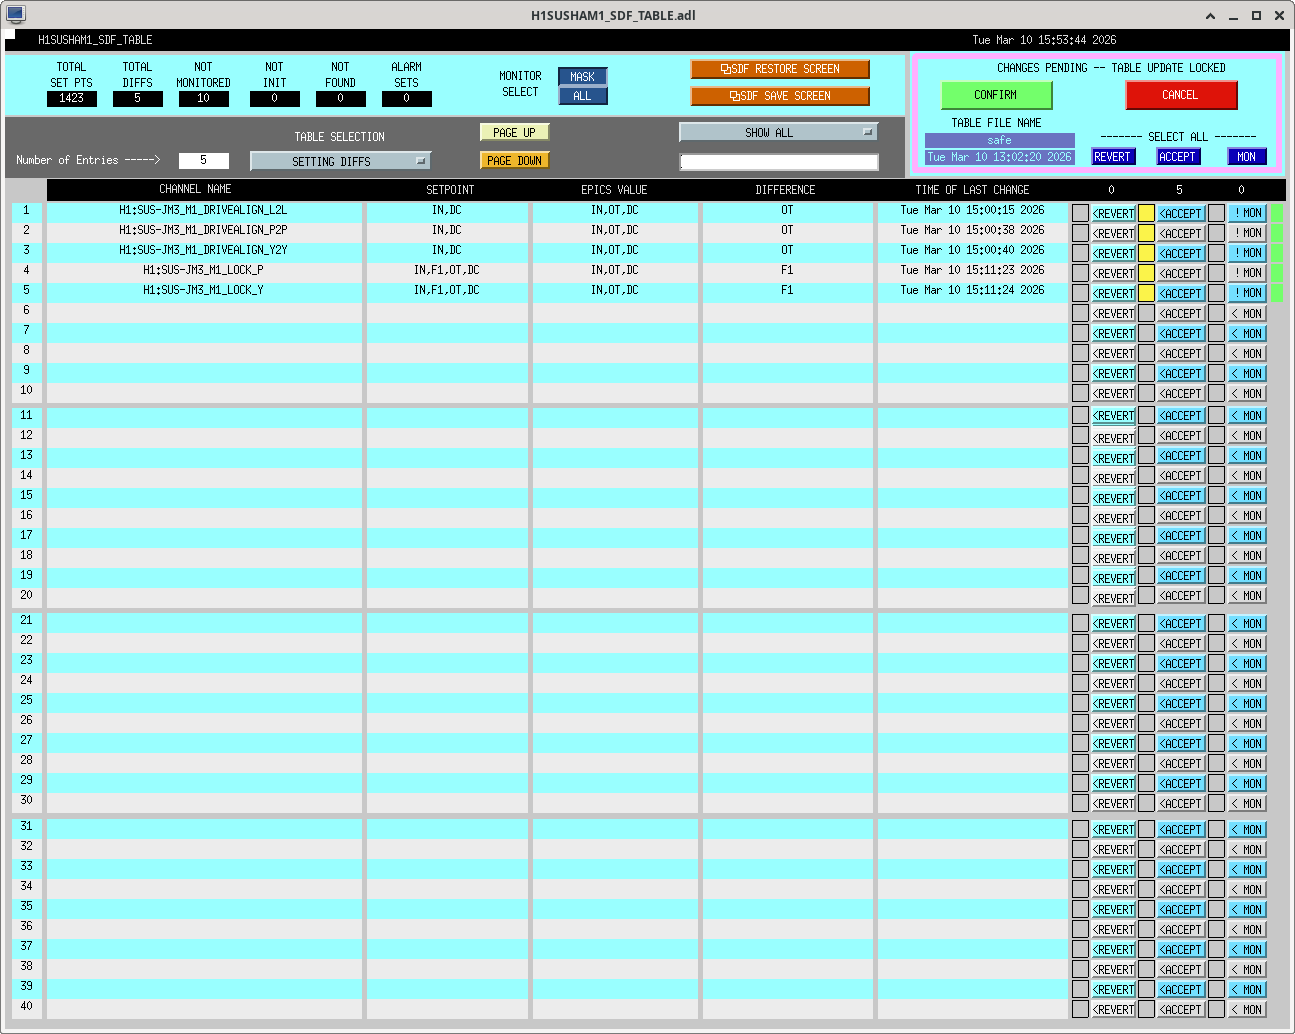
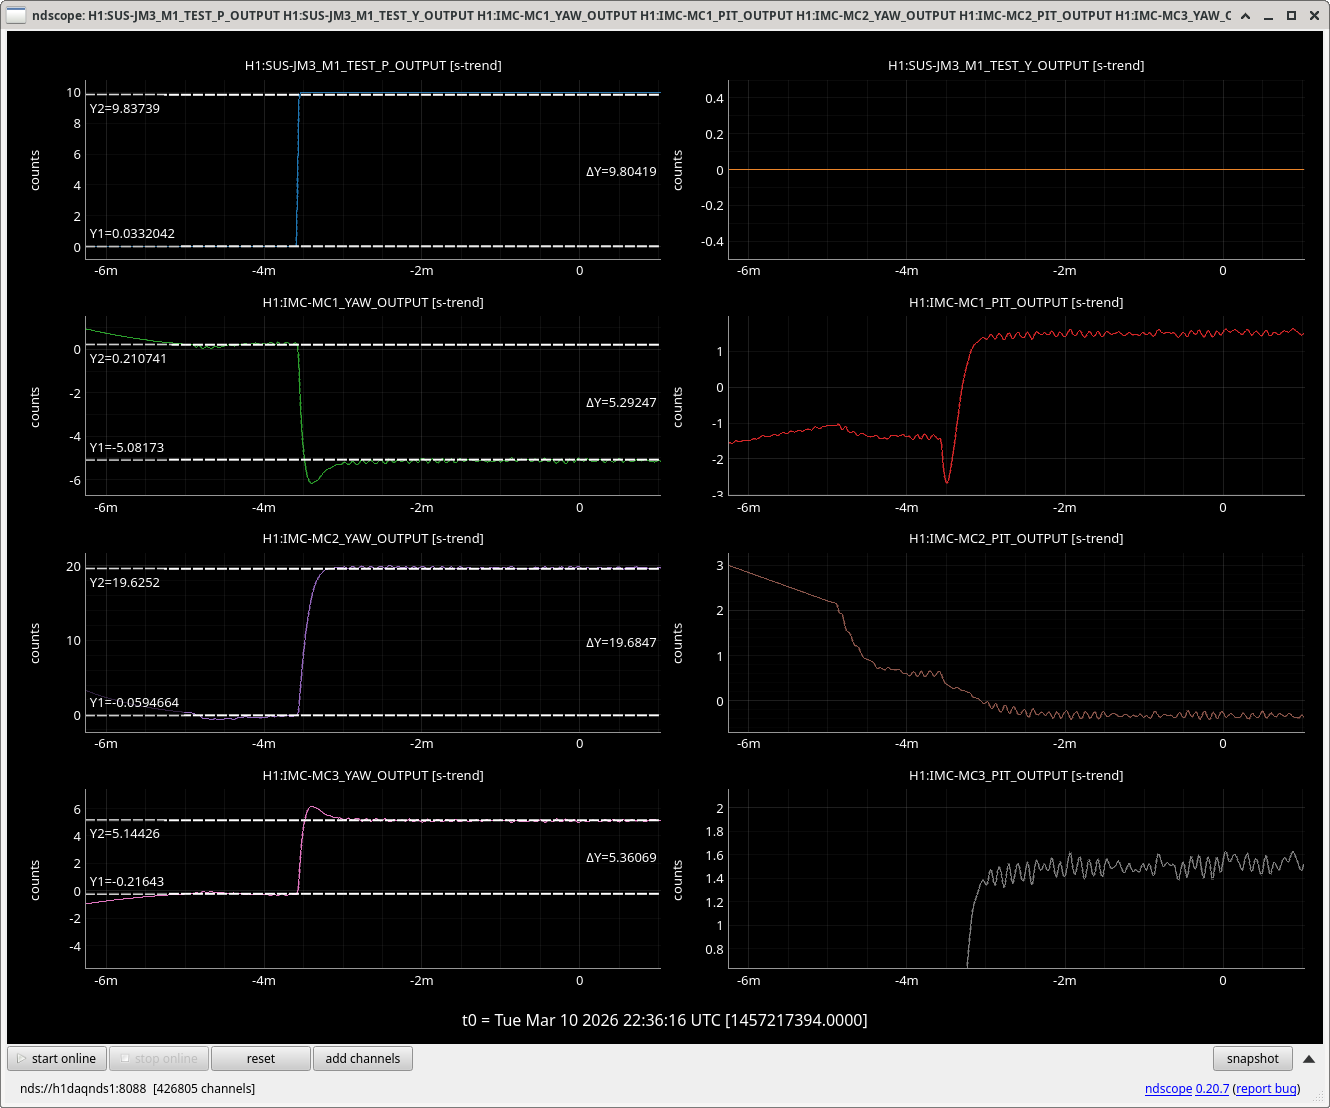
During the morning, Sheila and Ryan struggled again with the IMC locking. Lots of trending and adjusting gains and signs. The IMC OLG looked noisy and the IMC could stay locked for ~1minute without SUS feedback but not with feedback. The MC1 DAC card was swapped 89426, 89427 and new transfer functions showed this was better than Friday 89435, however IMC still wouldn't stay locked. Daniel, Ryan and Sheila then realized that MC2 M2 was not actuating and Marc and Oli tracked this down to a loose cable 89434, 89436. Oli opened FRS ticket: 37180.
After this was fixed, Sheila started editing the guardian to remove temporary fixes and remeasured the IMC OLG, see attached. This now looks good, 38.5kHz UGF is with 2W into the IMC, gain 5, one common boost on, which is as old guardian would have set it, except M1 feedback is still off. This was compared to 89046 Feb measurements. IM4 trans is 1.2W which is a little lower than before the JAC install.
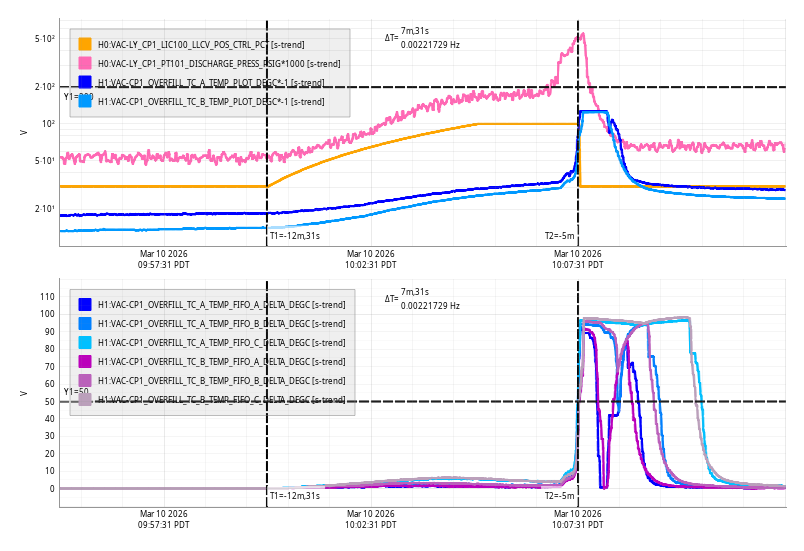
After the VAC team decoupled the AUX carts by HAM1/2, Jim unlocked the HAM2 HEPI.
Ryan C locked the green arms using INTIAL_ALIGNMENT_OFFLOAD as Jenne reset those references last week 89385.
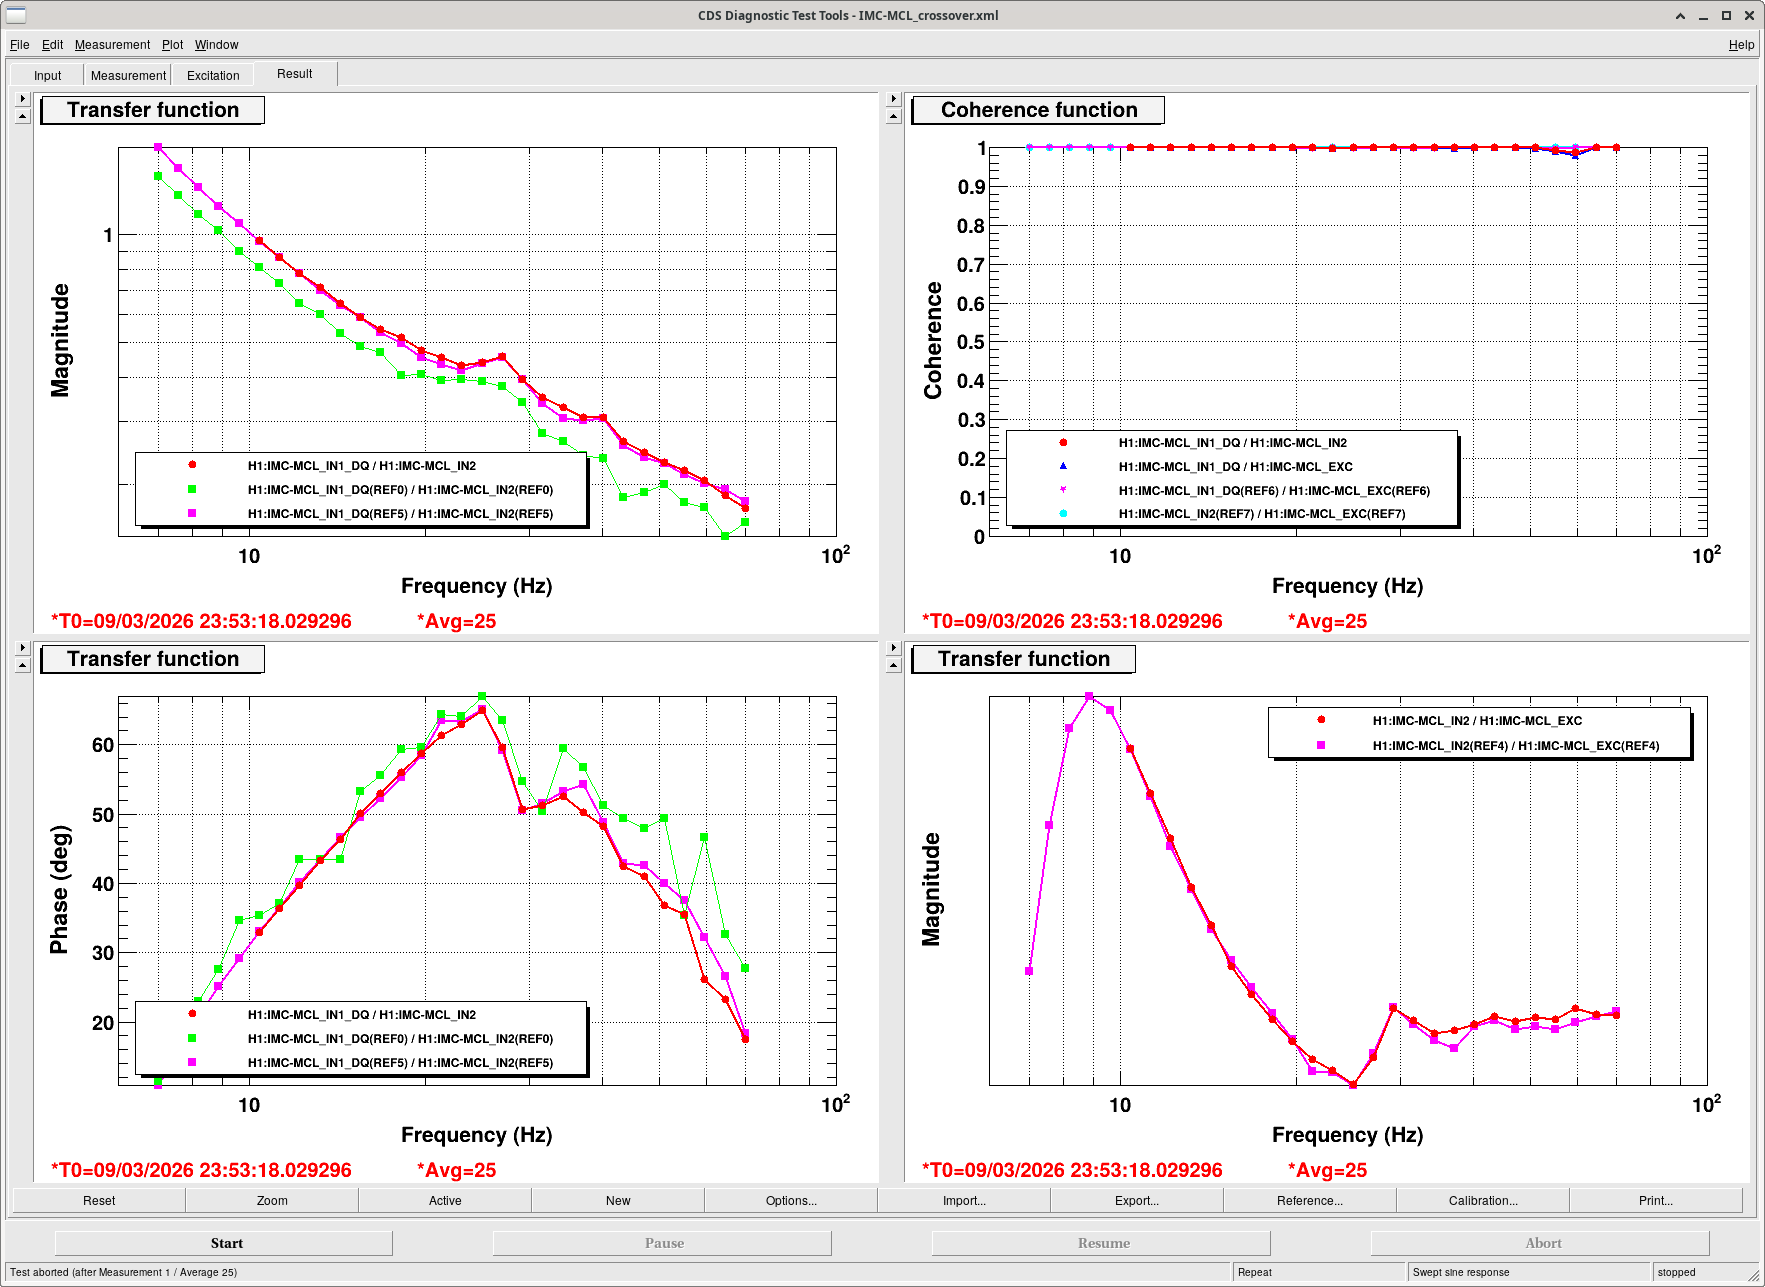
After HAM2 was unlocked, we struggled to turn on the MC2 M2 feedback, however the IMC was surprisingly stable with only the M3 and laser feedback, Sheila took IMC-MCL crossovers. It's a strange loop as M2 isn't really doing anything so Sheila tried copying the PRCL M2 filters over to actuate via M1, this didn't work.
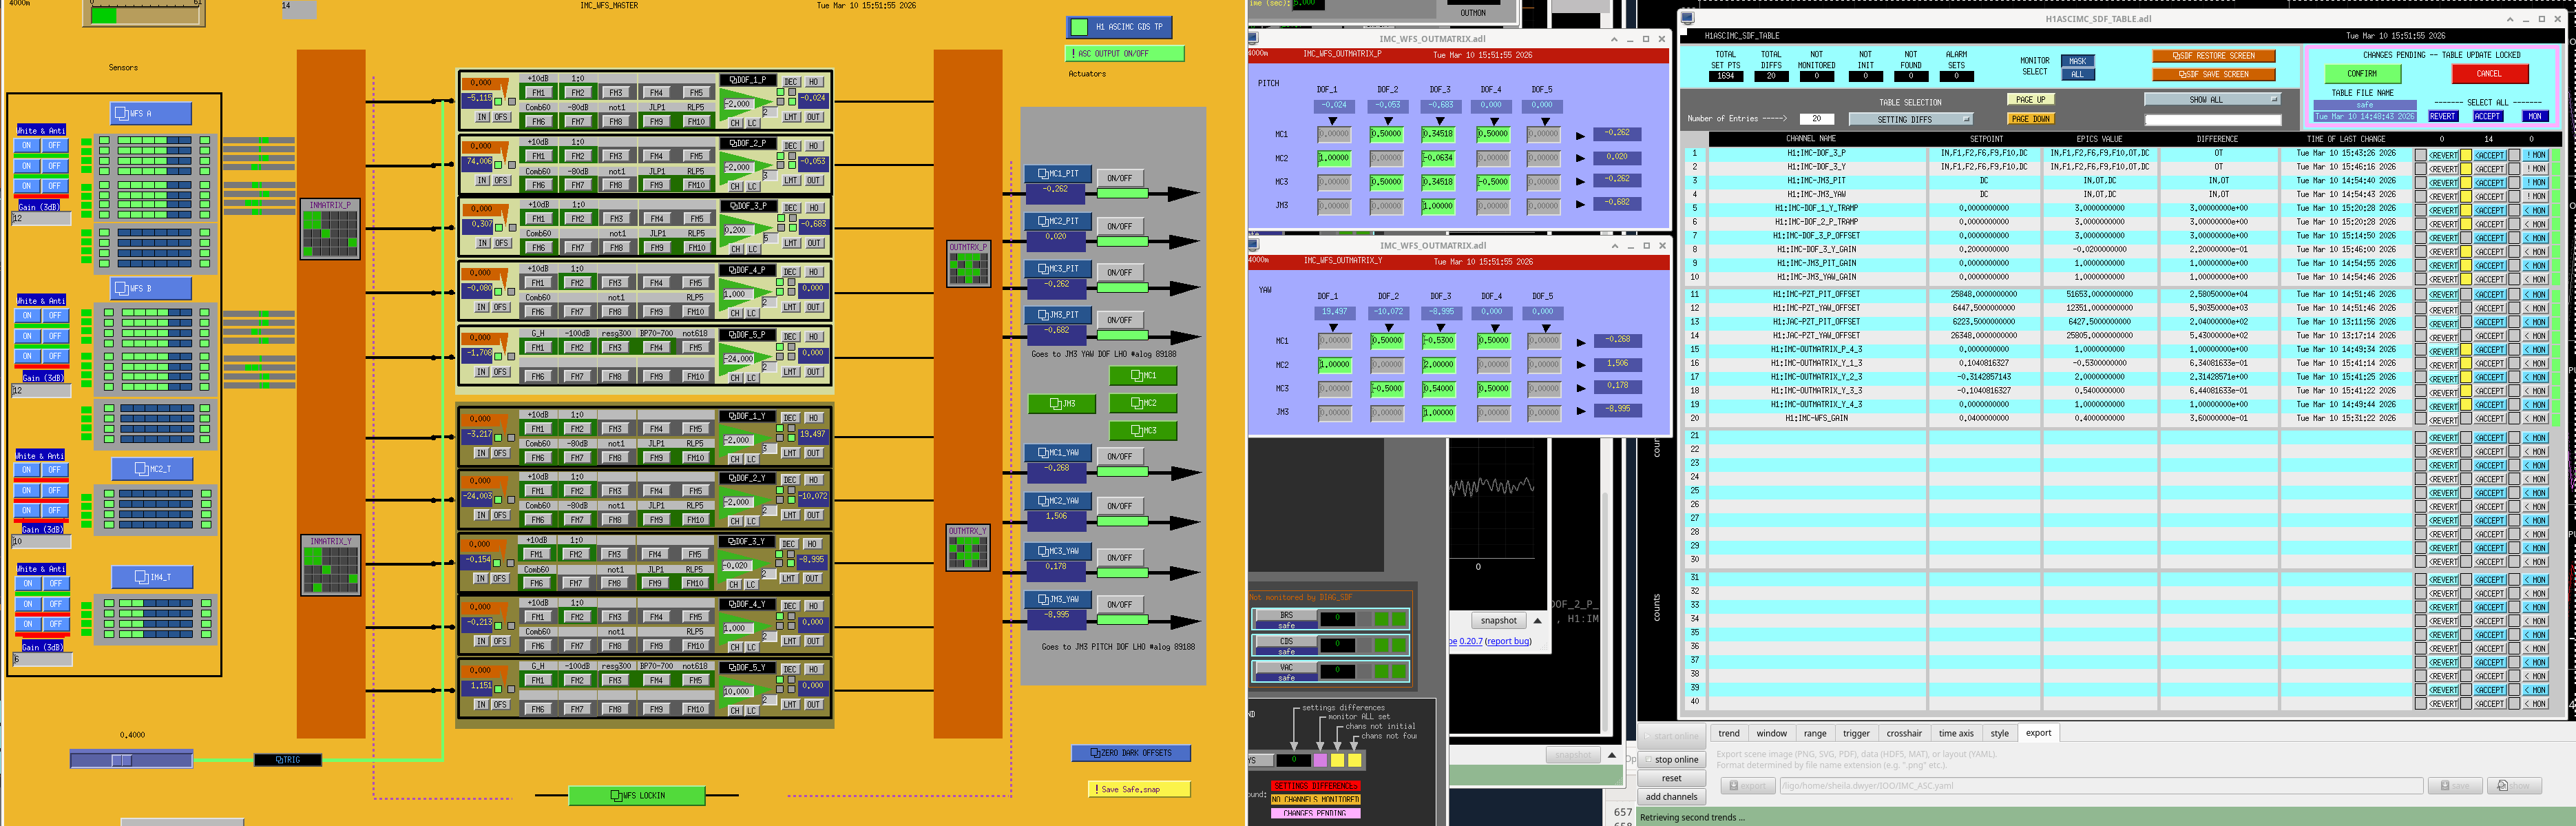
Sheila turned on the IMC WFS, this worked well and brought IMC_TRANS from 180 to 200. Then they were offloaded using the guardian (not the smoothest offloading). After the WFS were offloaded, we reset the guardian to include both M1 and M2 feedback and it worked.
The IMC-MCL crossover was re-measured to be on it's reference, see attached.