Naoki, Camilla, Evan, Sheila, Julian, Nutsinee
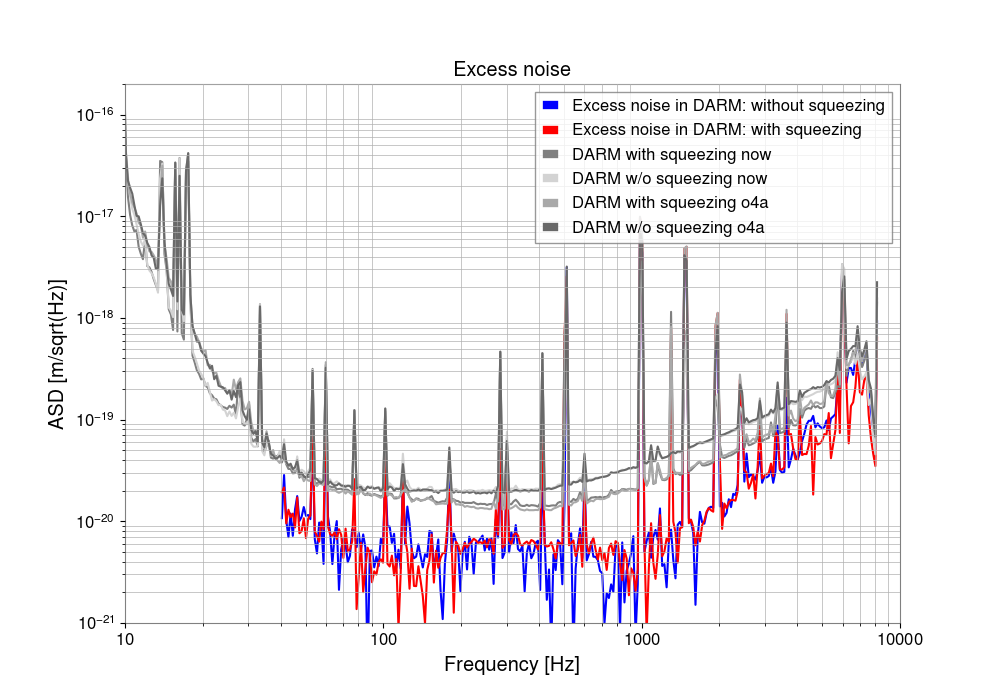
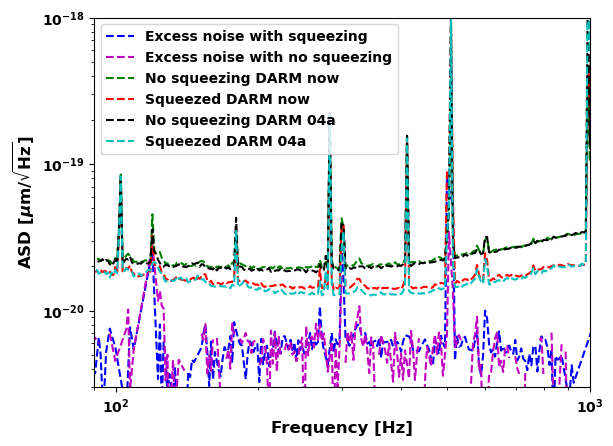
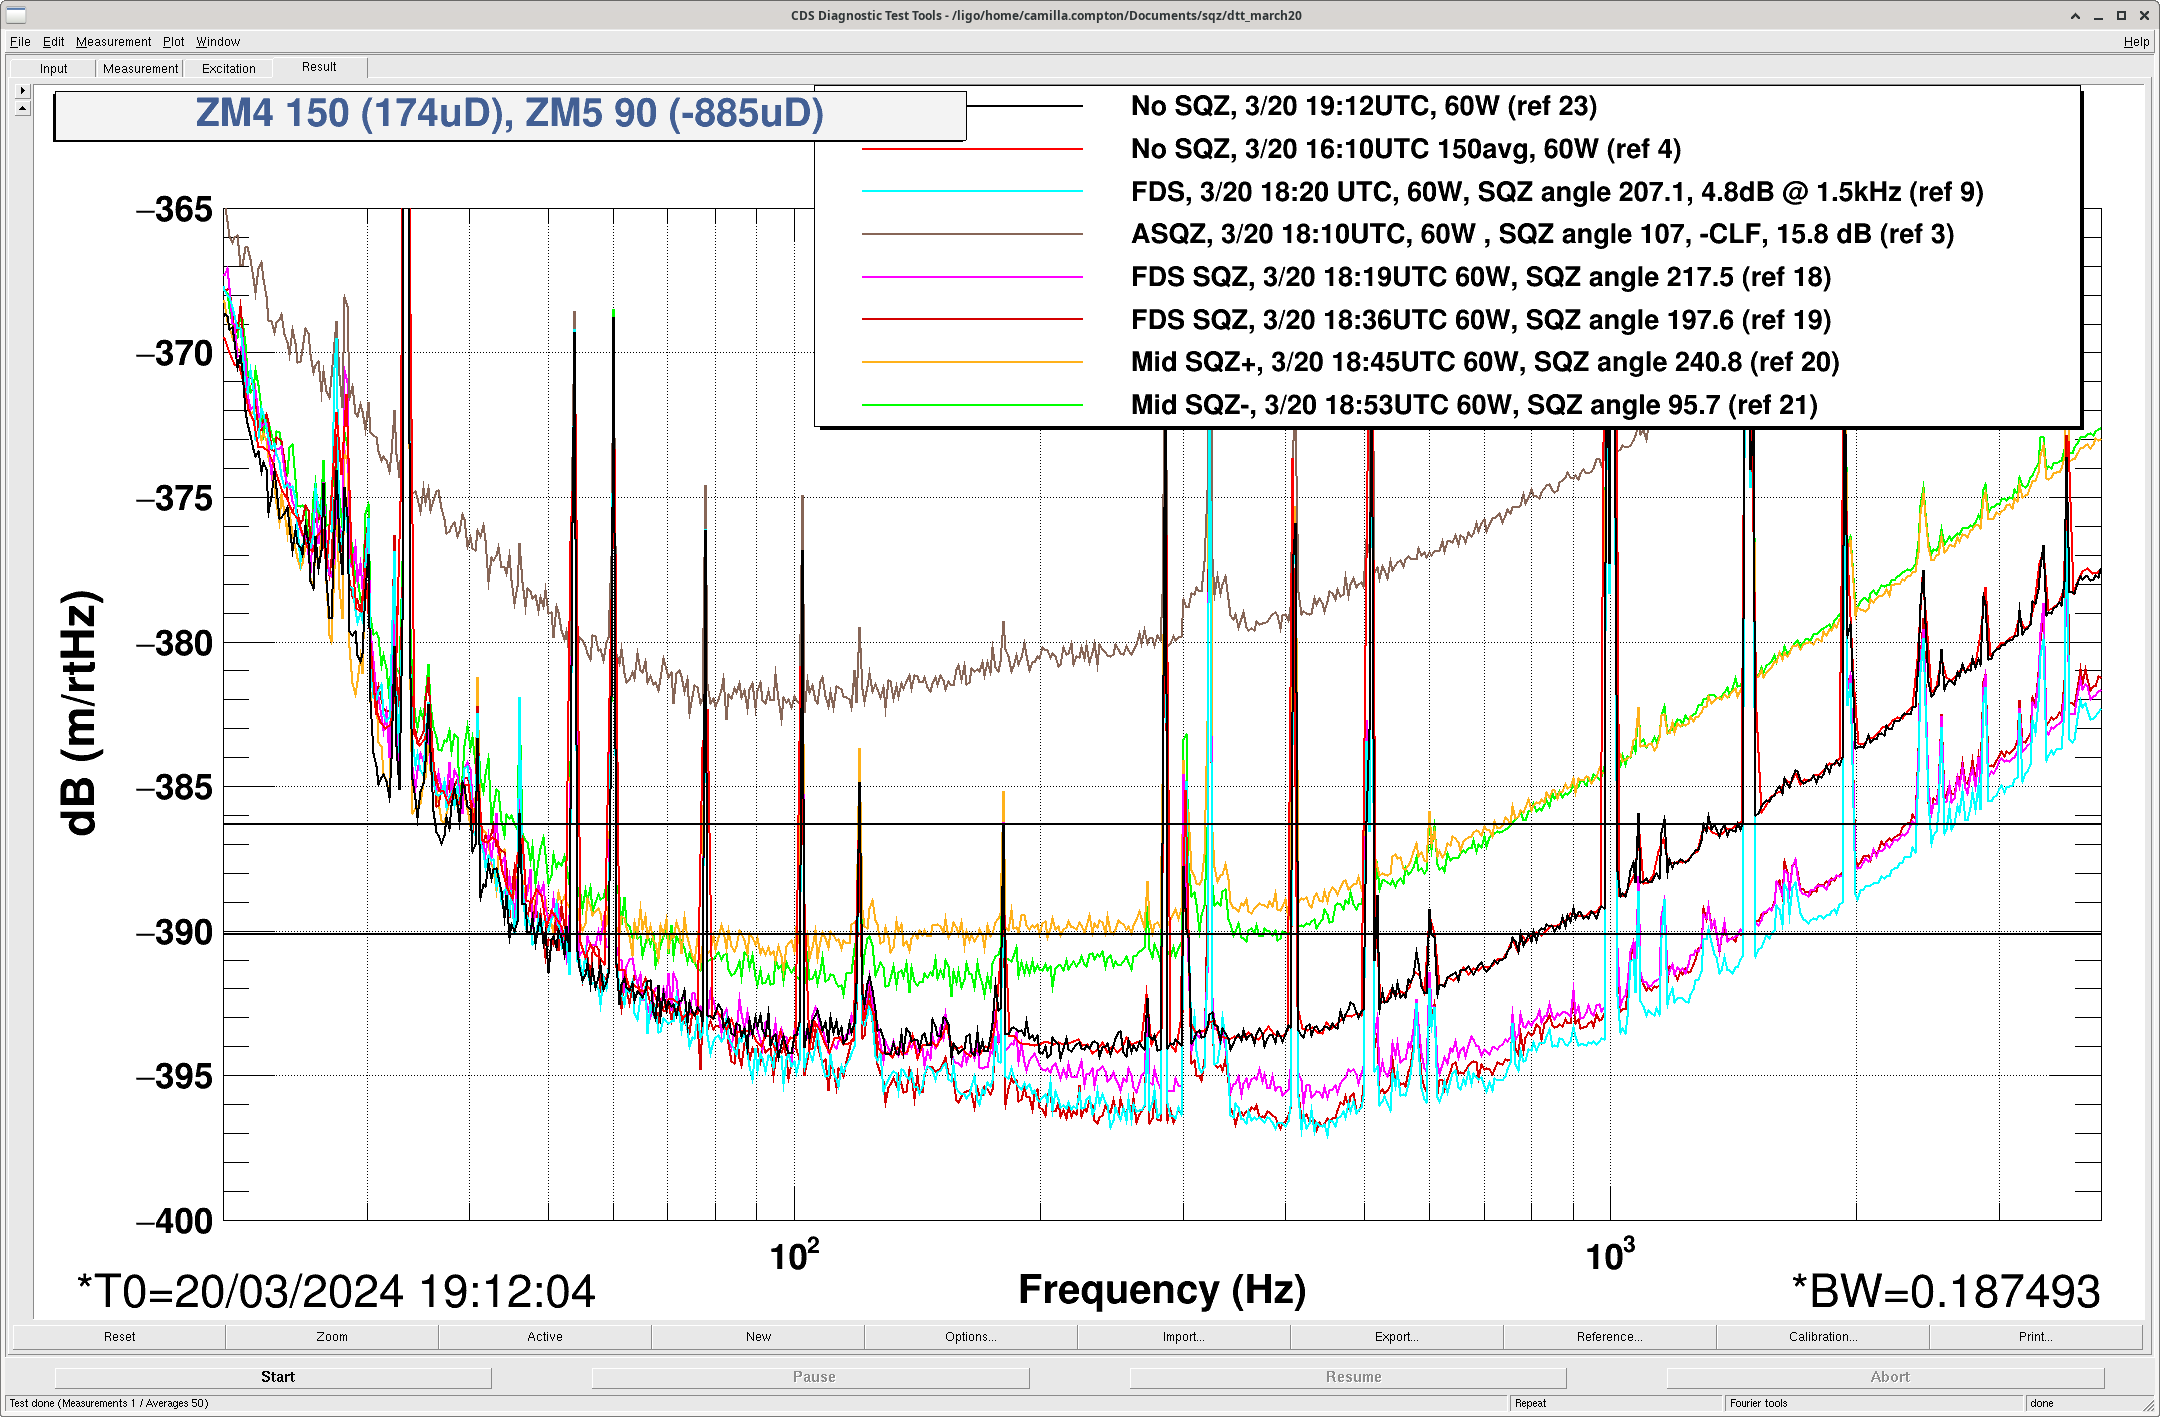
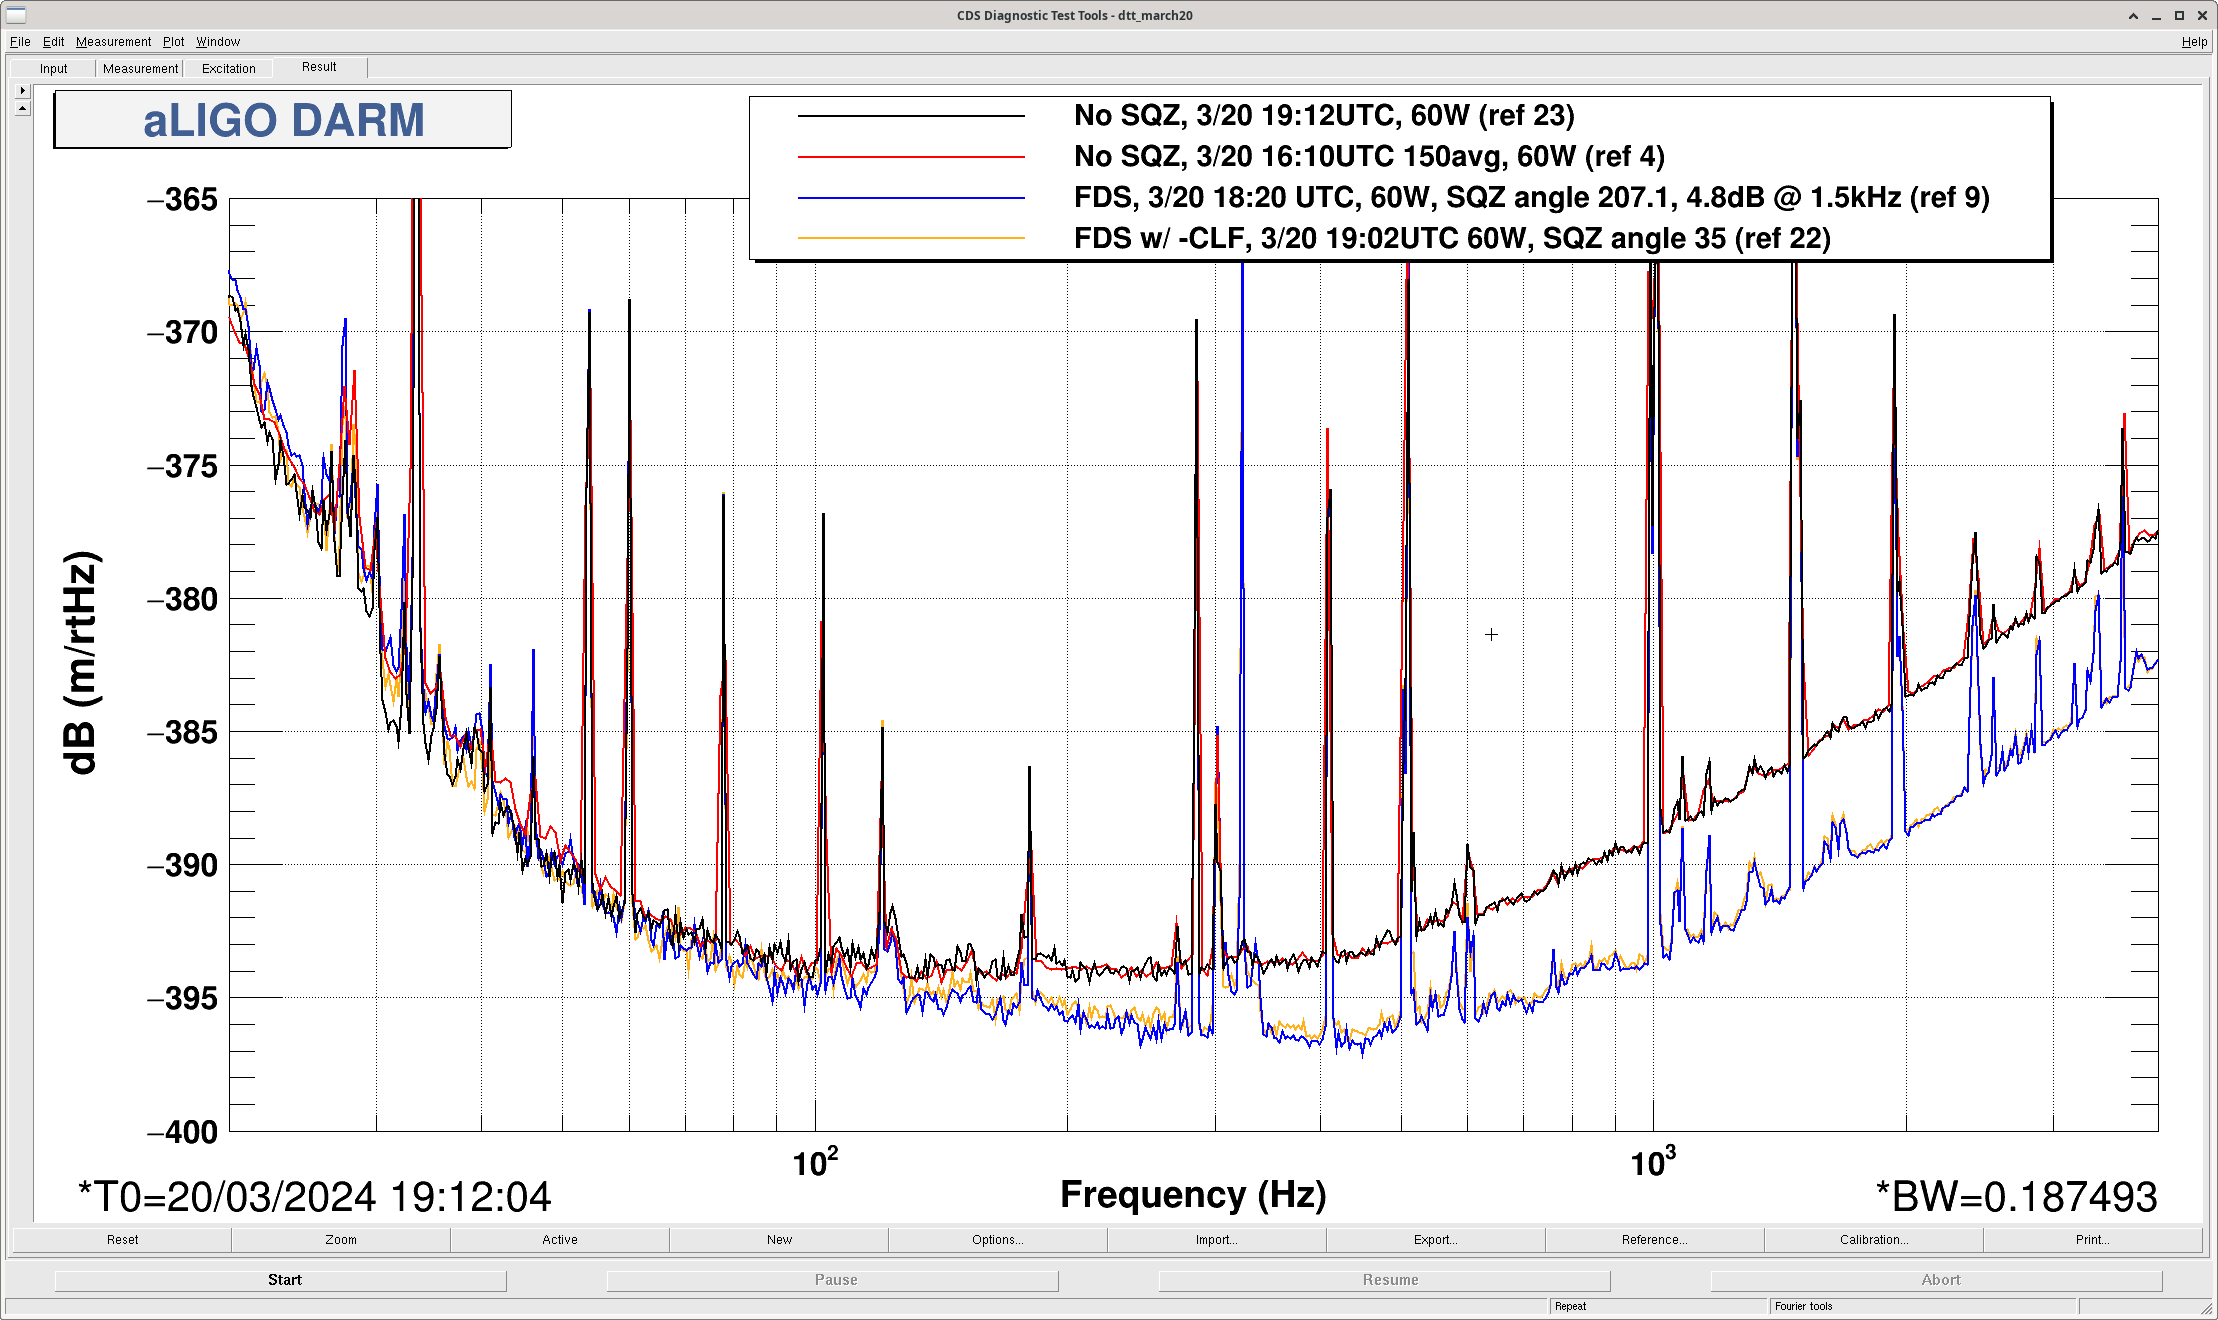
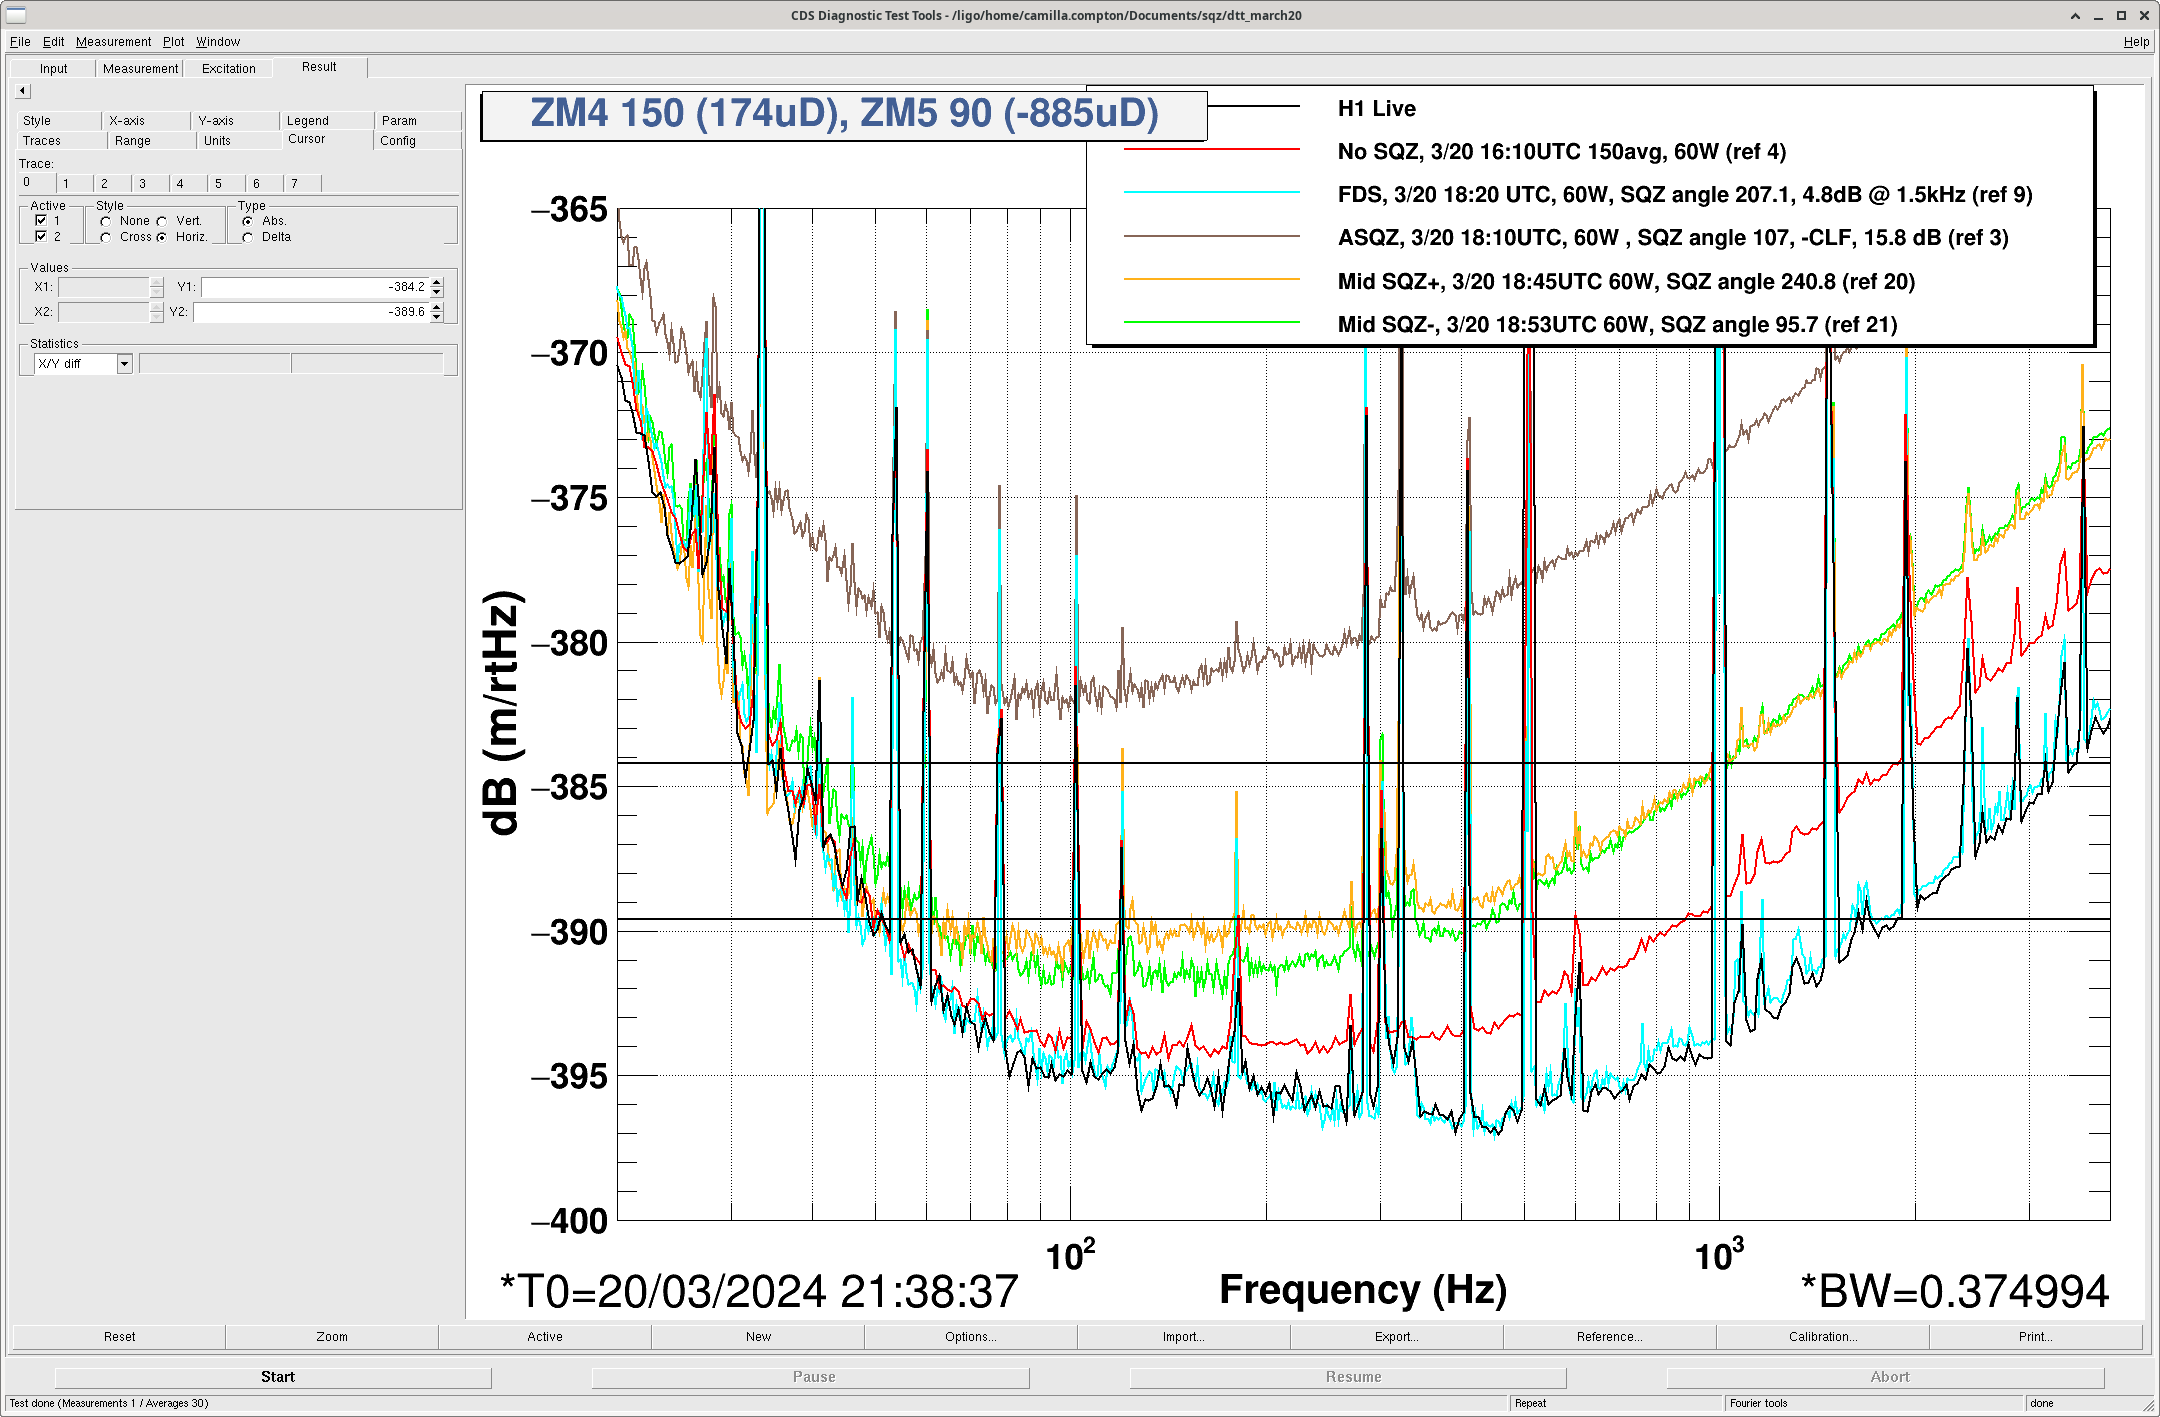
Many things happened with the squeezer this afternoon. A quick summary is we are back to 5 dB at kHz and we should be able to do this repeatedly. No PSAMs adjustment required at this time.
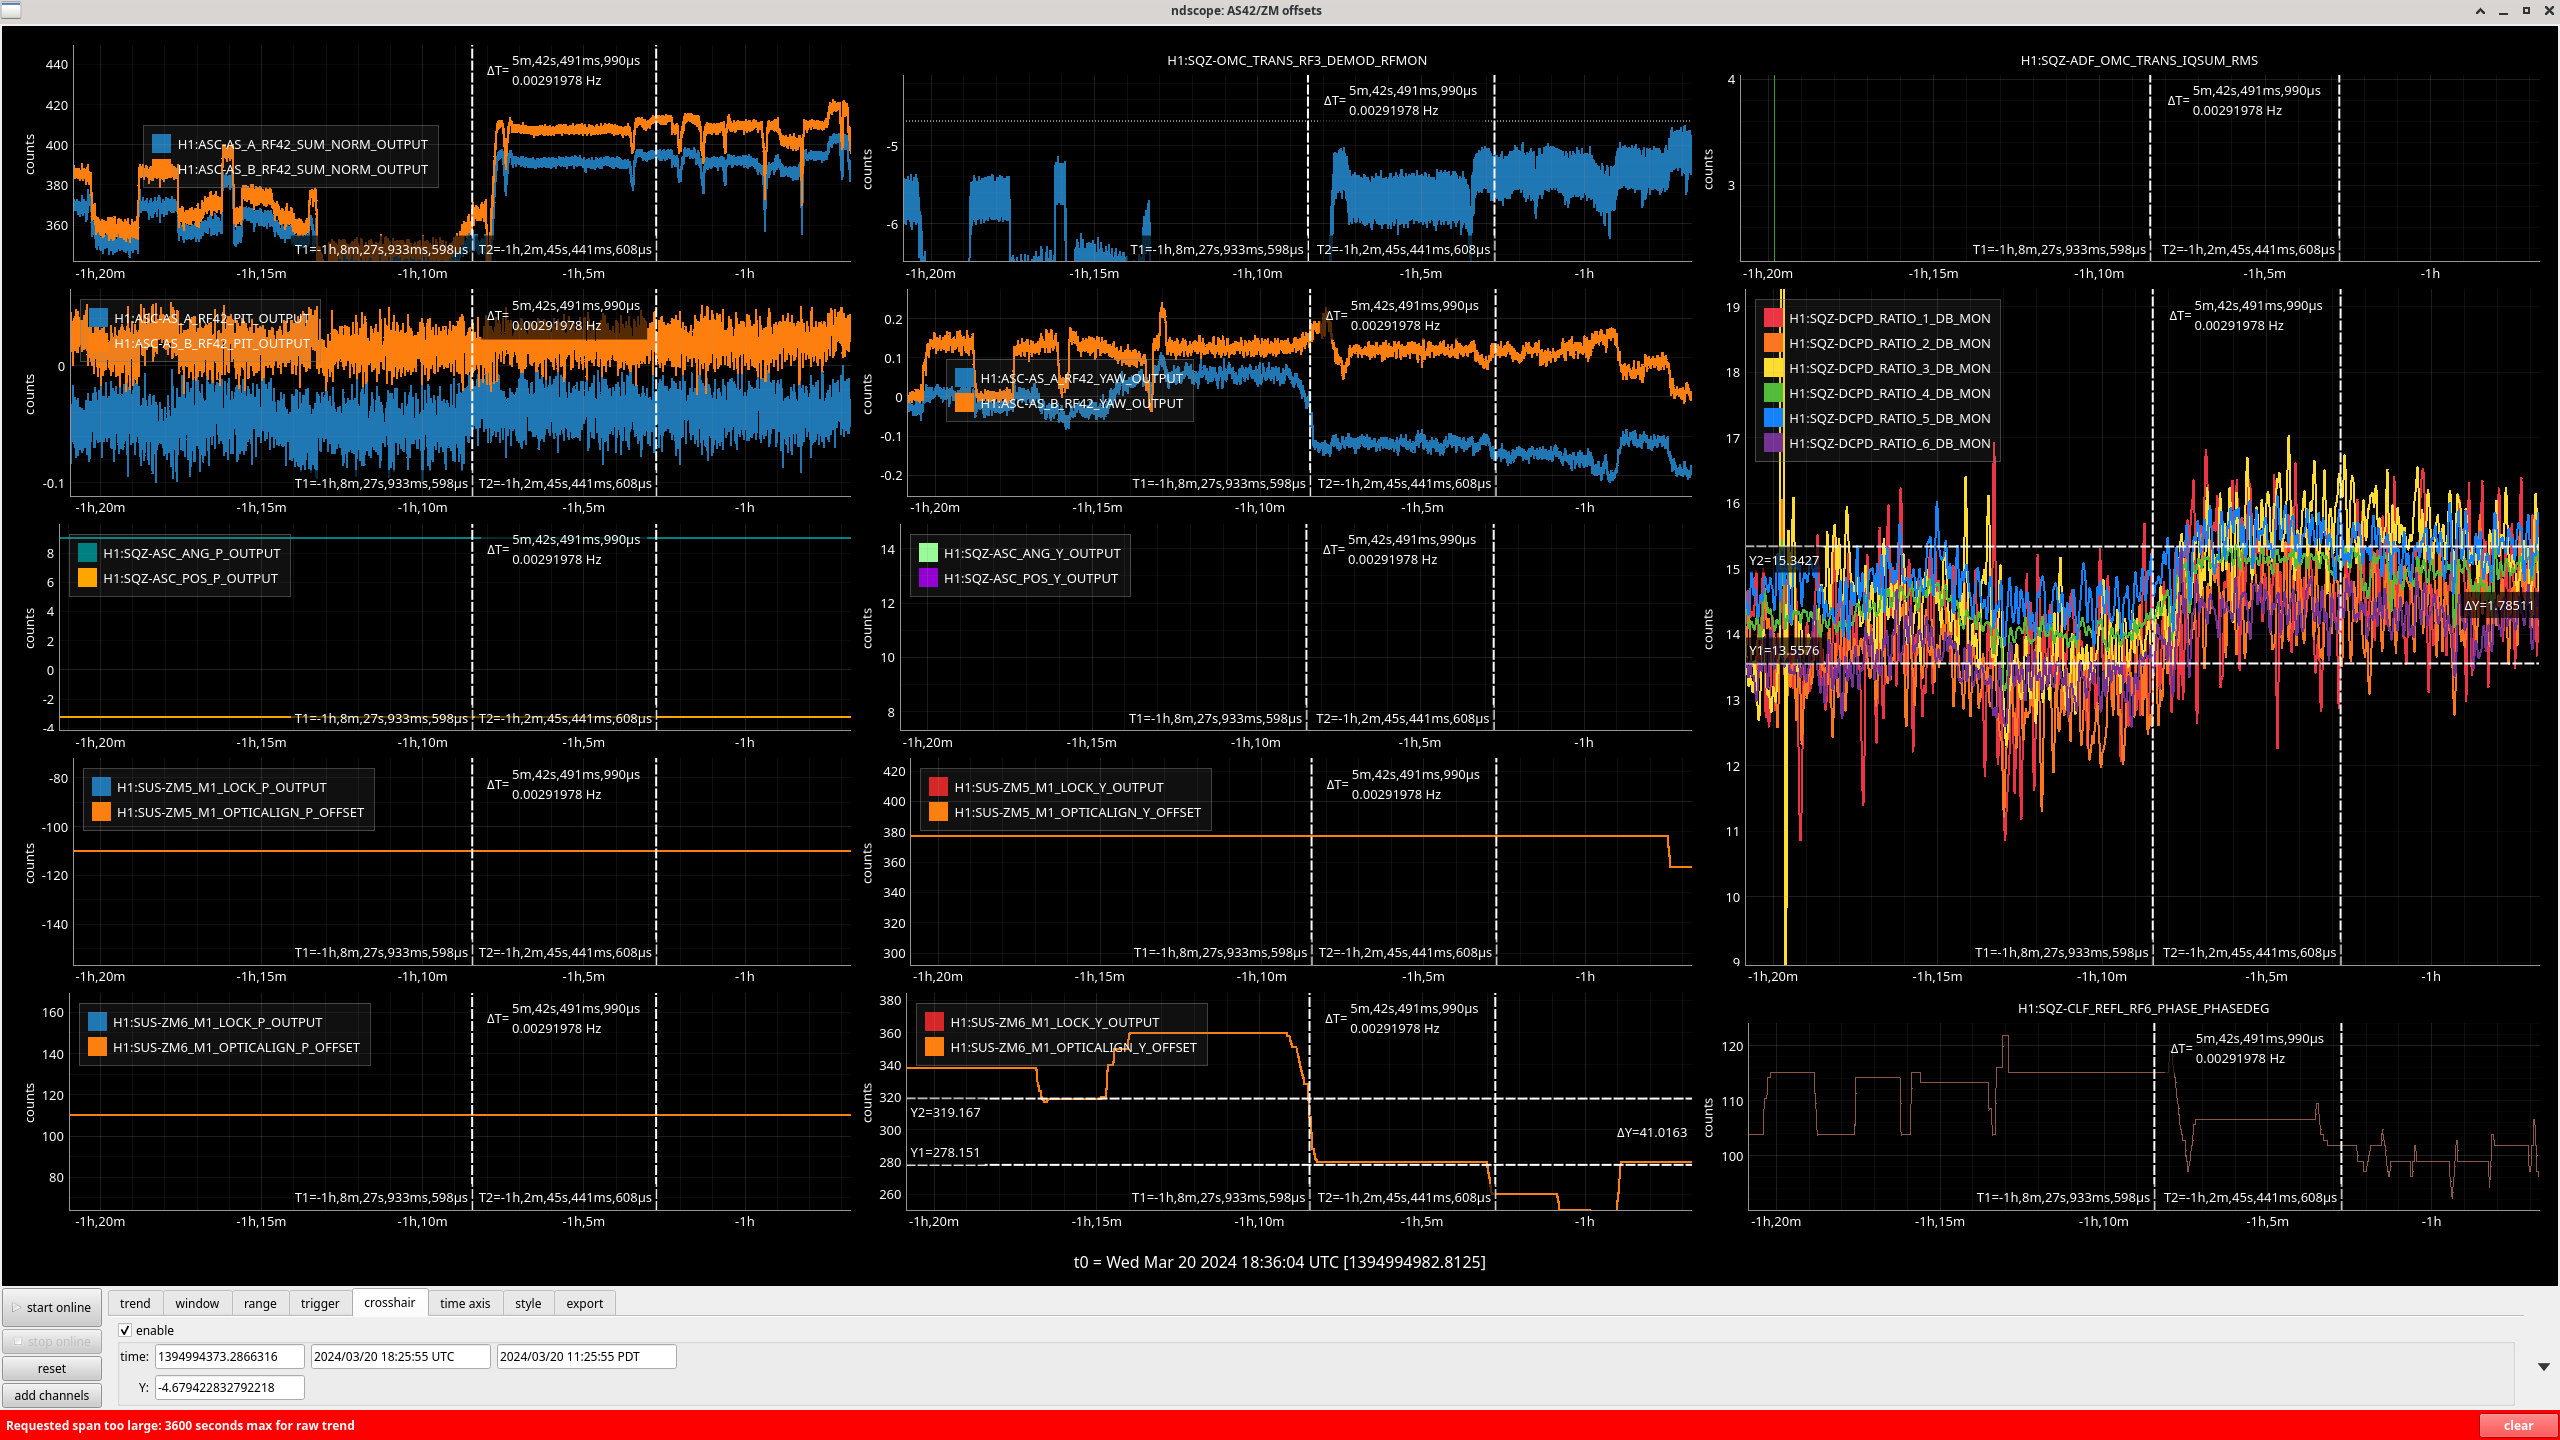
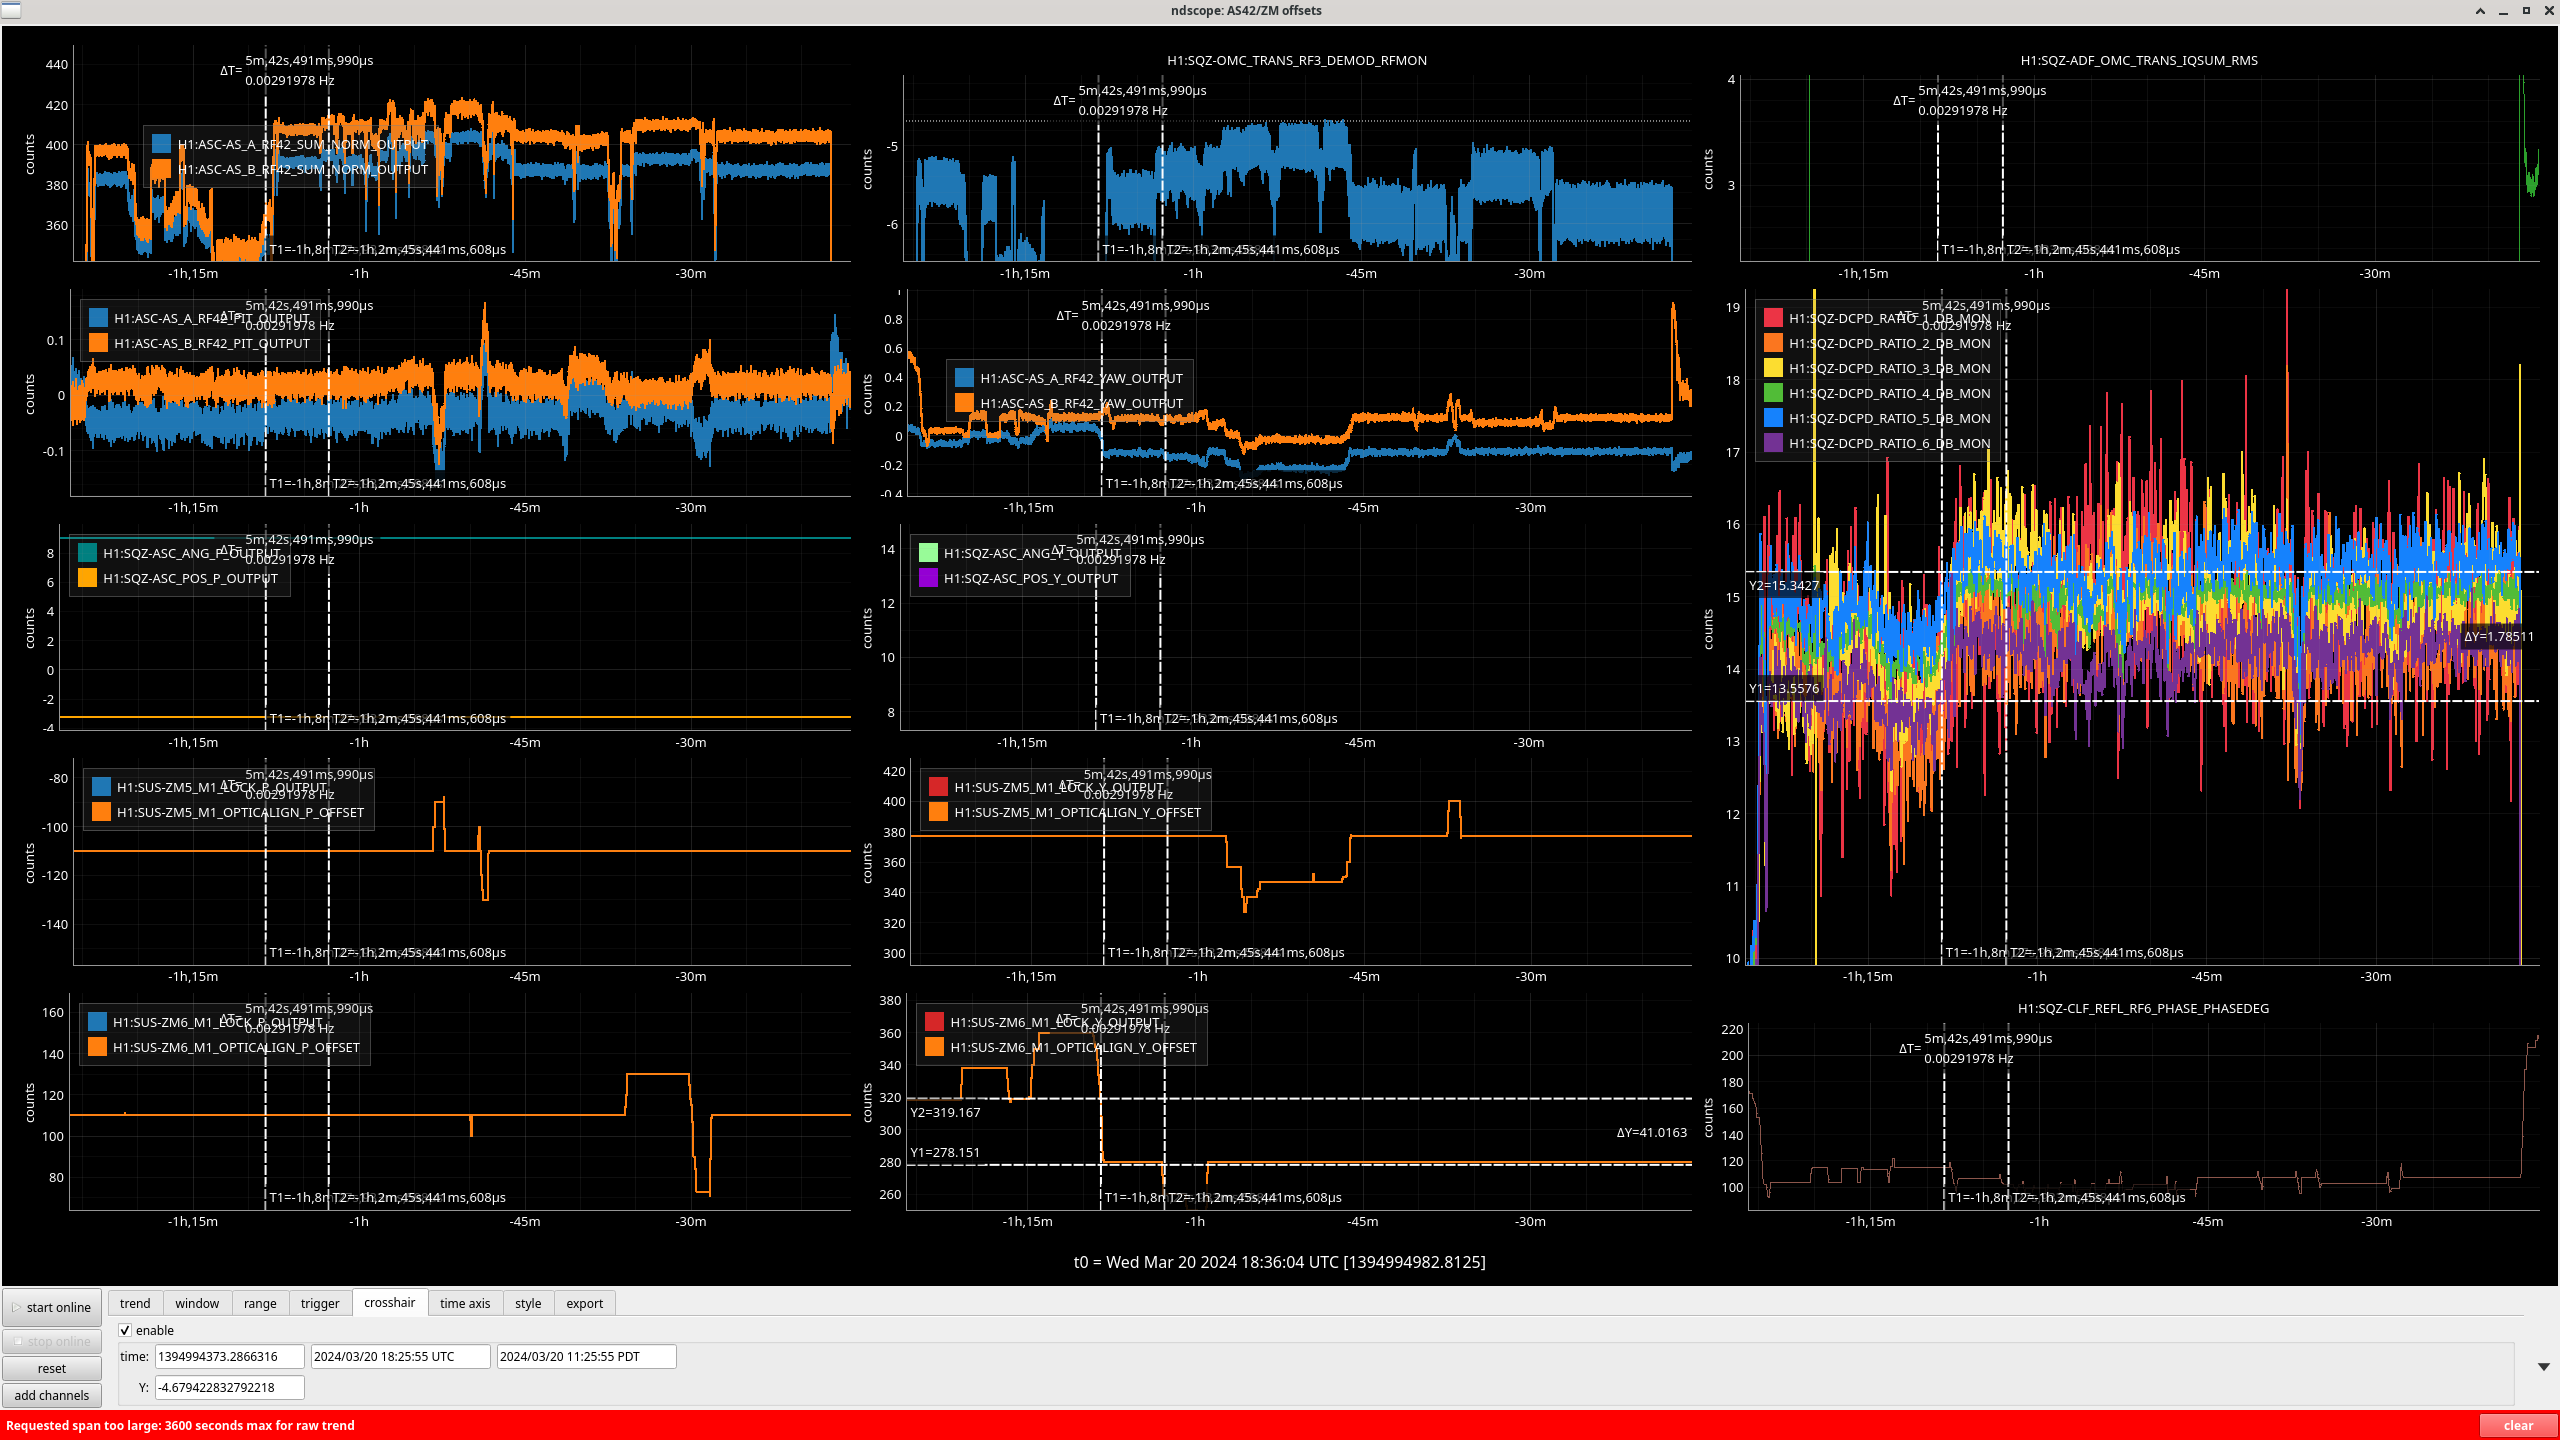
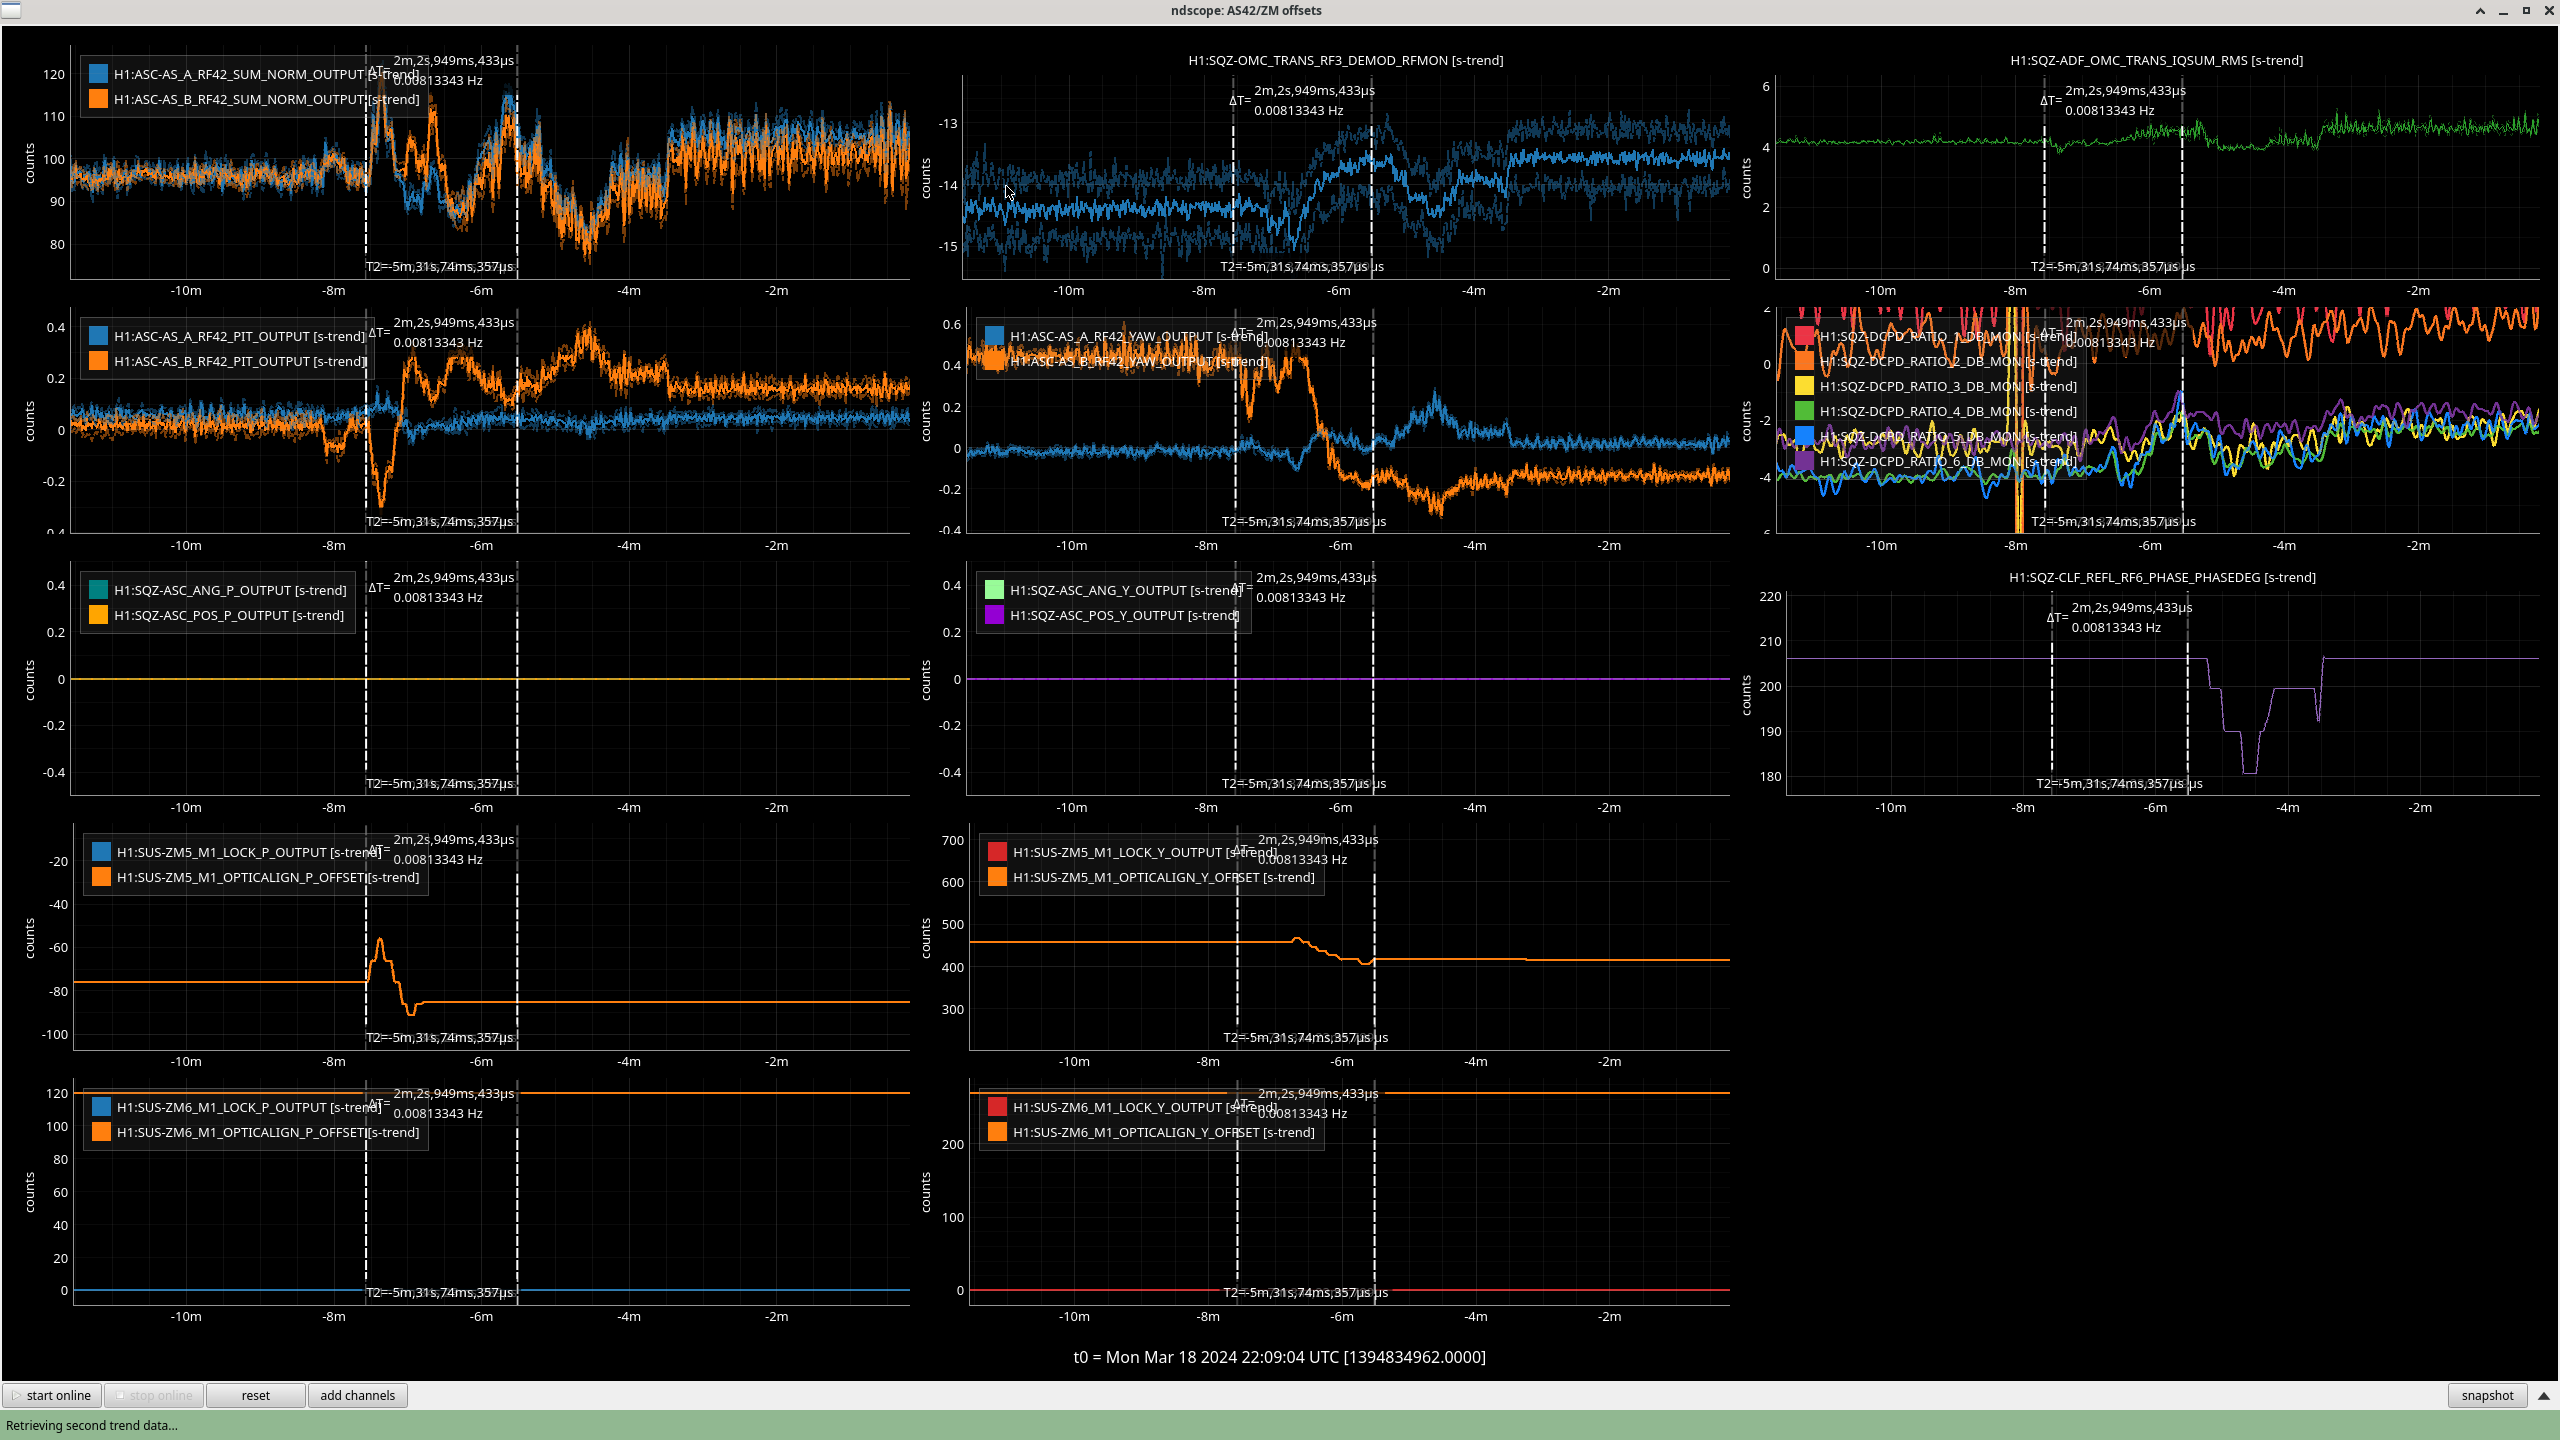
- When the IFO relocked this afternoon we adjusted ZM5 alignment to optimize ADF trans signal. By doing so we improved both the RF3 and the 42. However this made squeezing worse.
- We adjusted the SQZ angle. We couldn't make it better so we went the other way. This made squeezing worse and ADS TRANS went up with it. Note that this is the IQSUM channel. We didn't think that was a sensible behavior but we've seen it before.
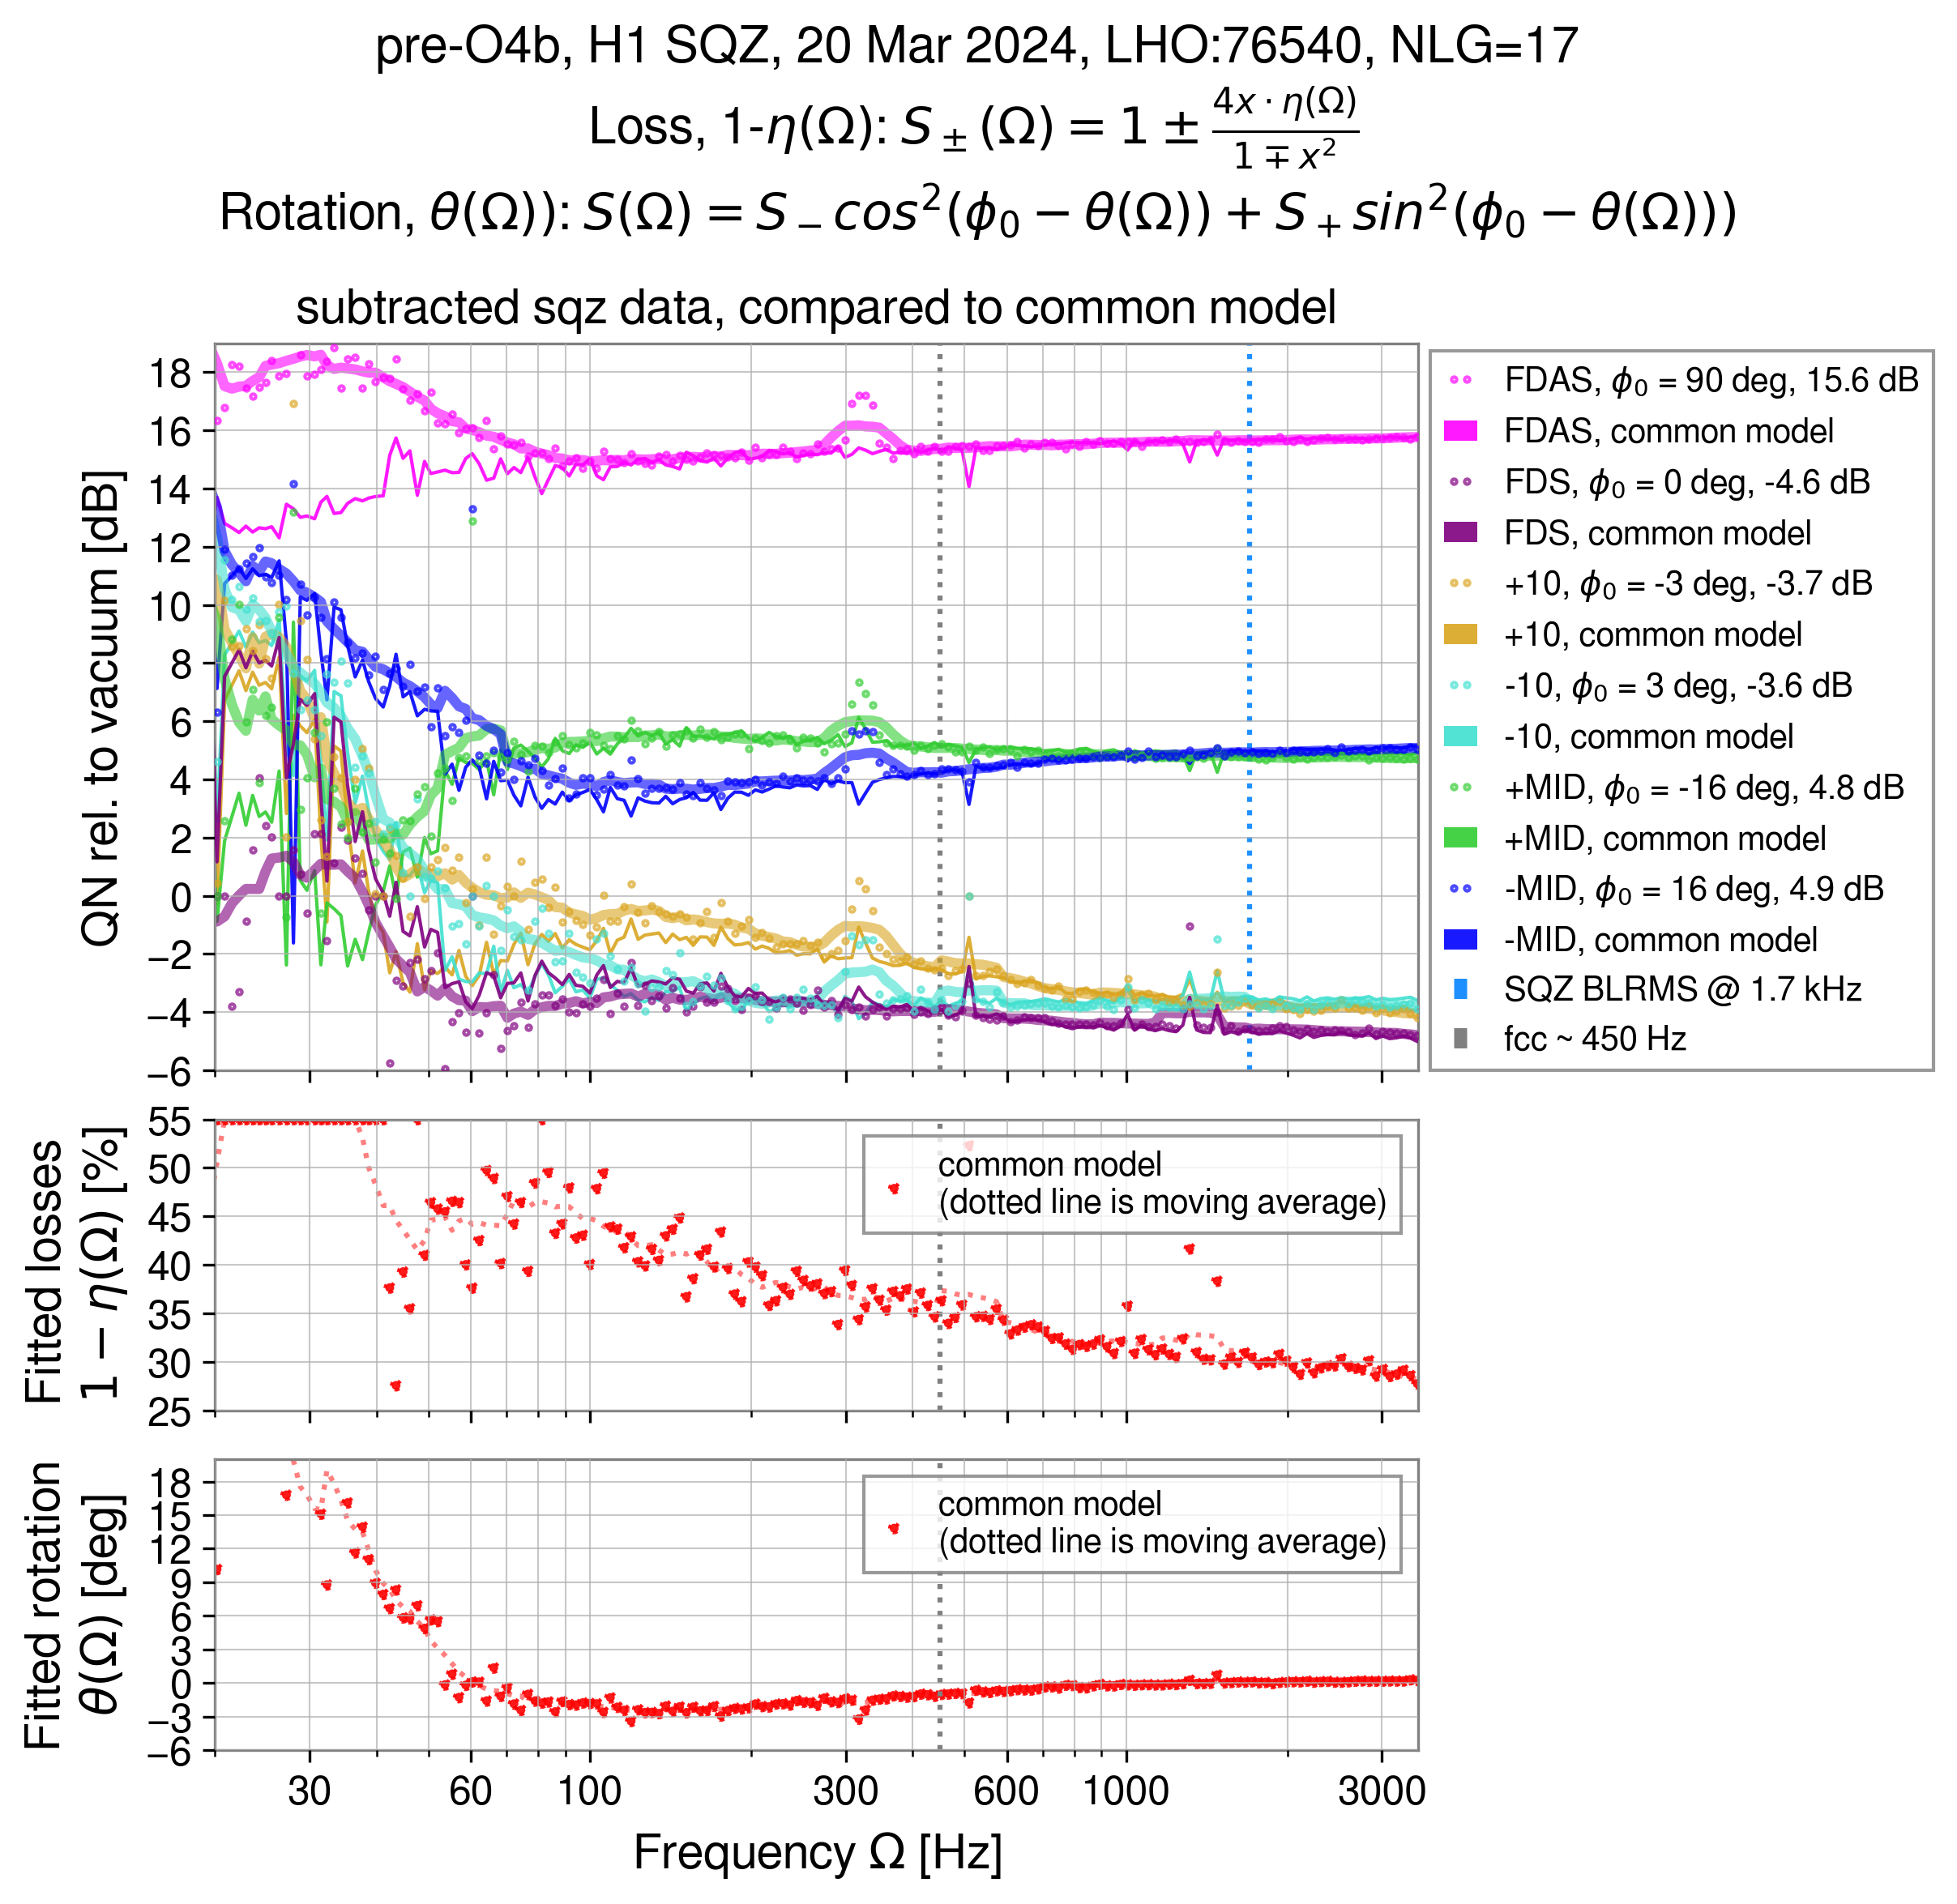
- Sheila and Julian then optimized the crystal tempeature. The NLG for today was 17.3.
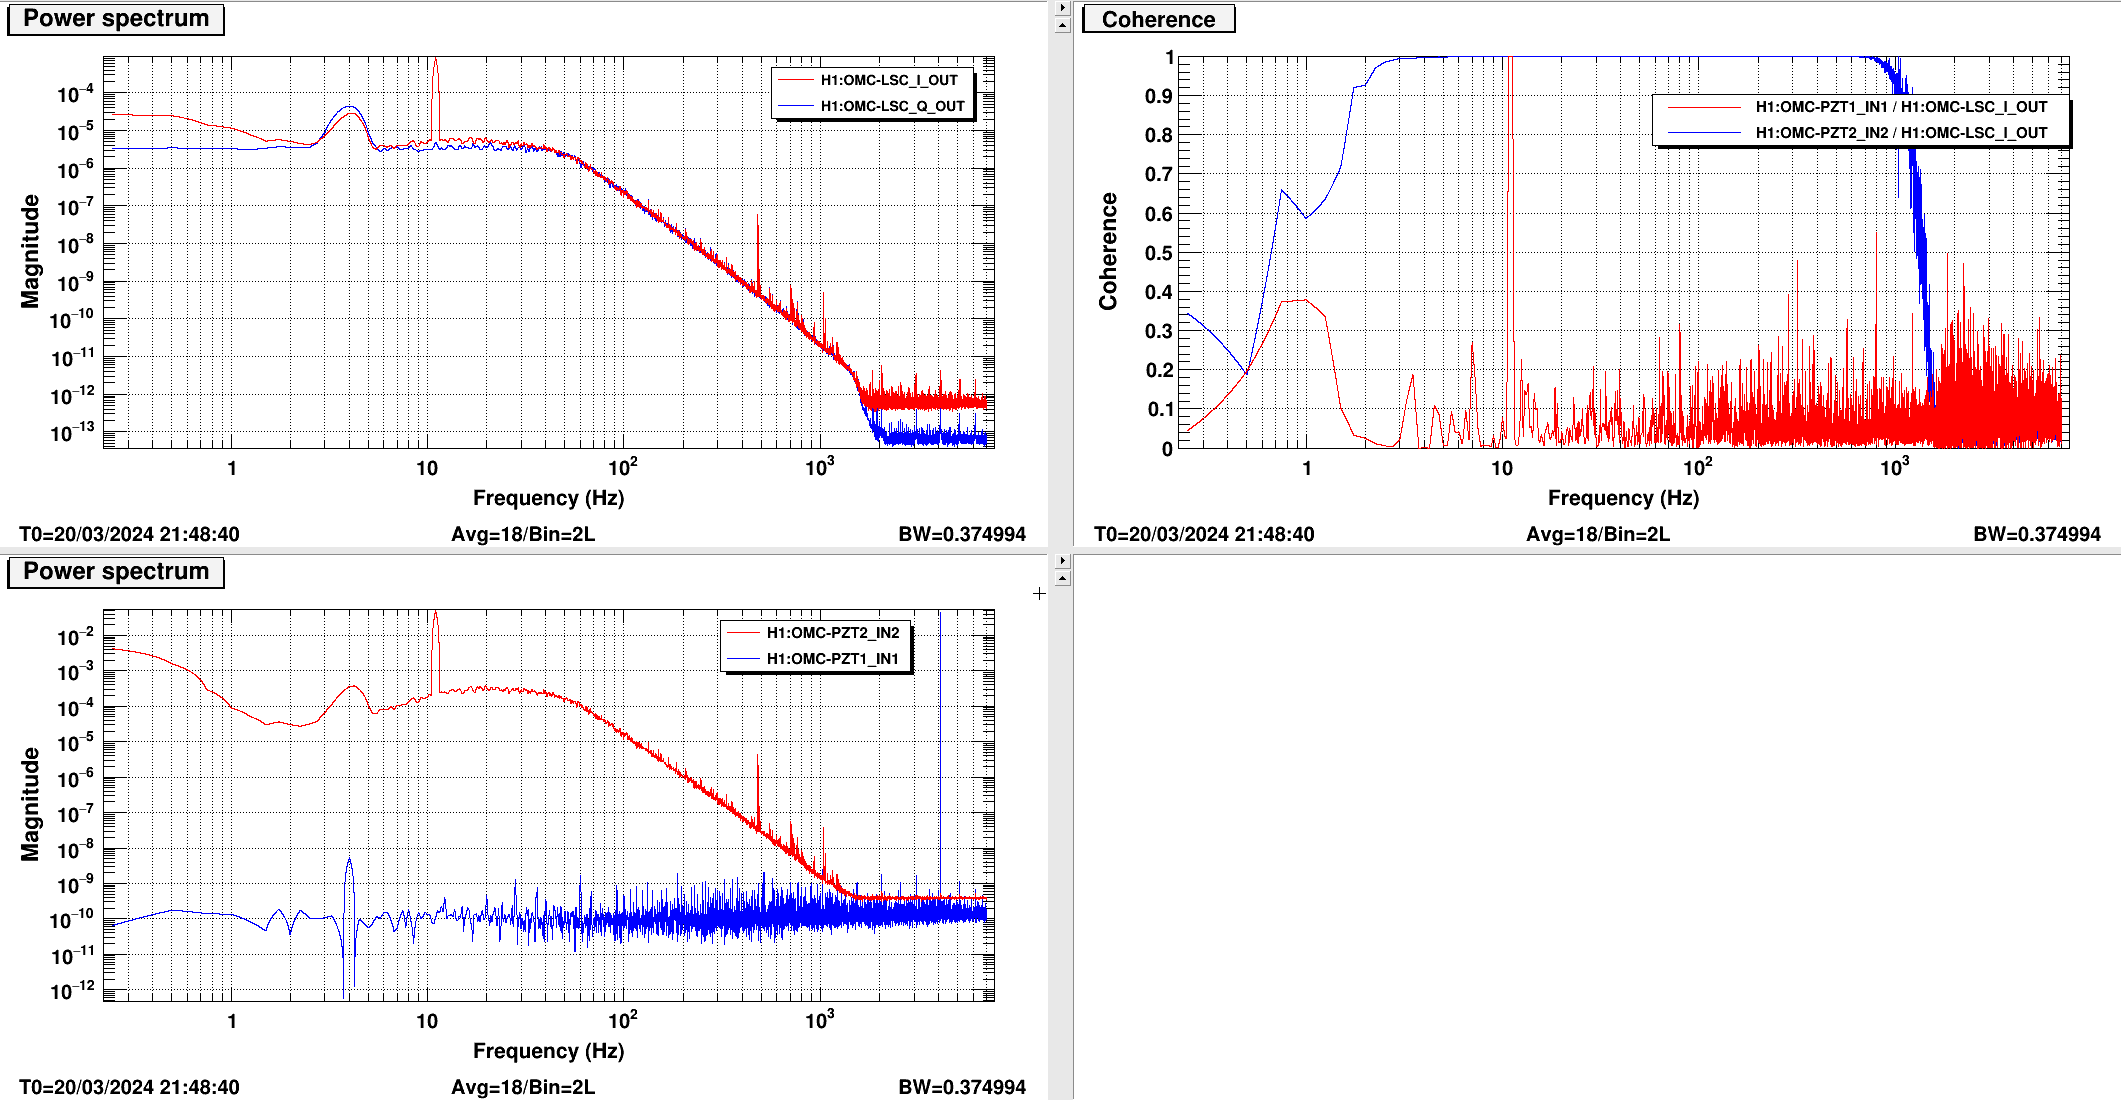
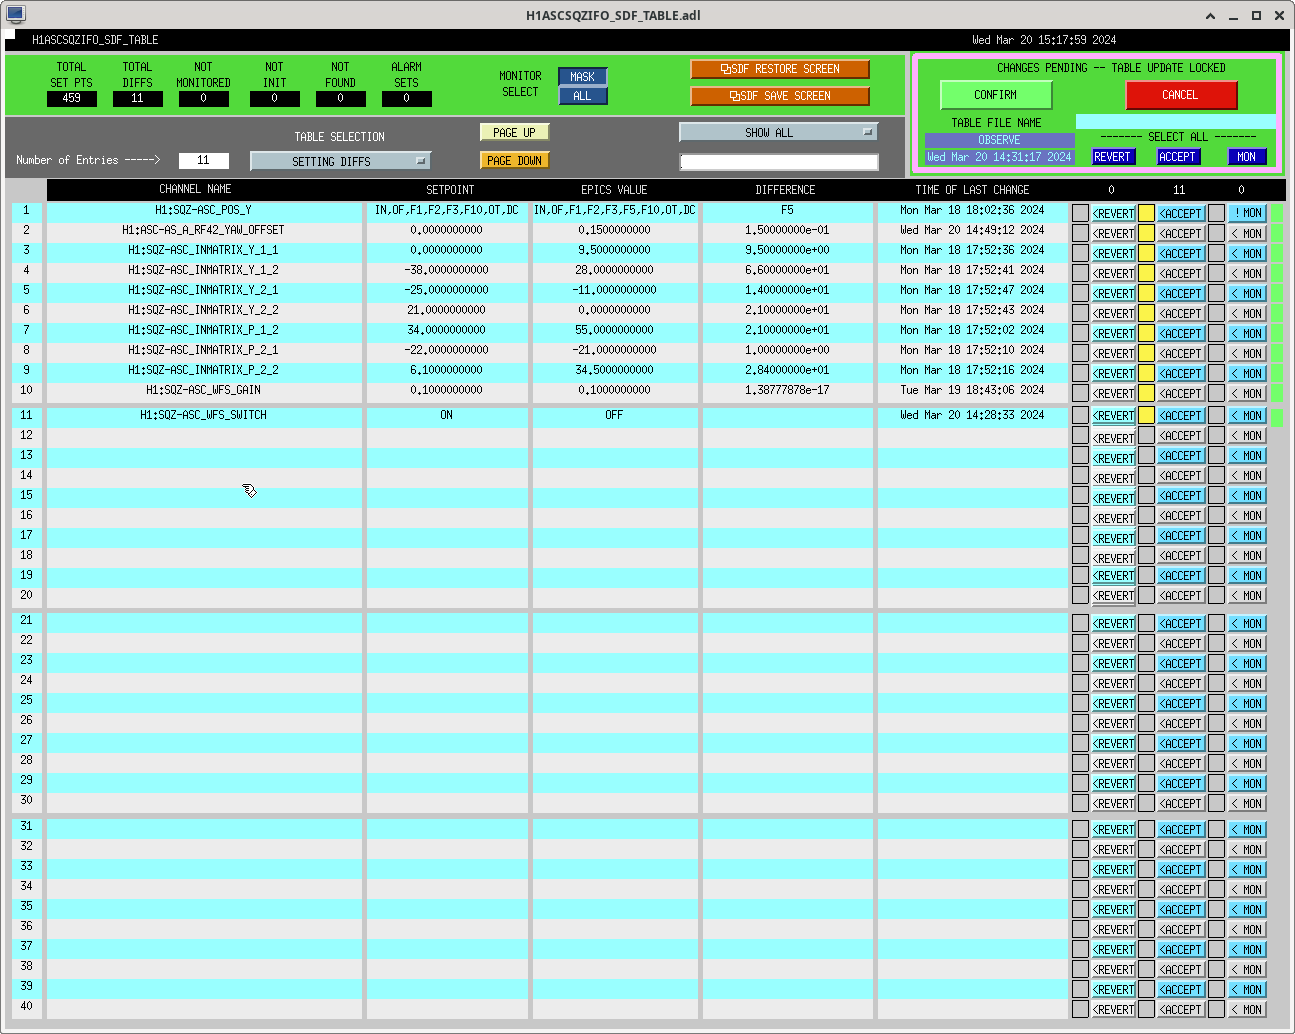
- Naoki measured the SQZ IFO sensing matrix. We found a big cross coupling between ZM5 P to AS42 B Y. Other than then everything else was sensible. A new improved sensing matrix has been implemented.
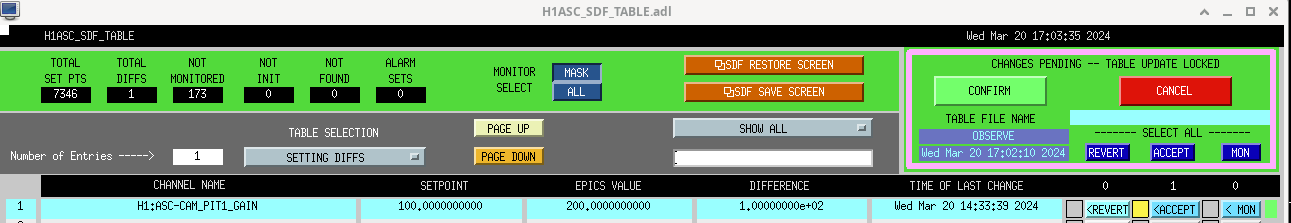
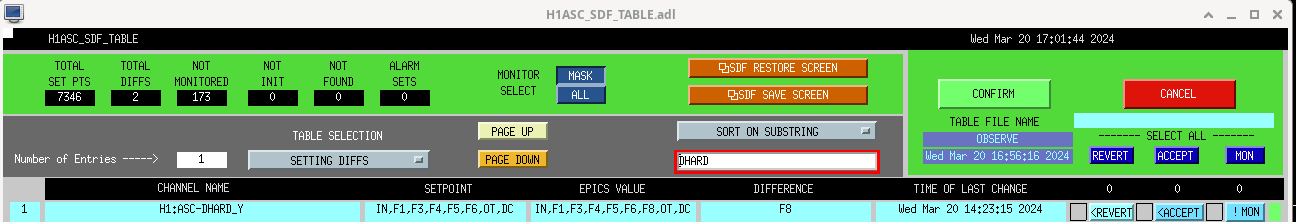
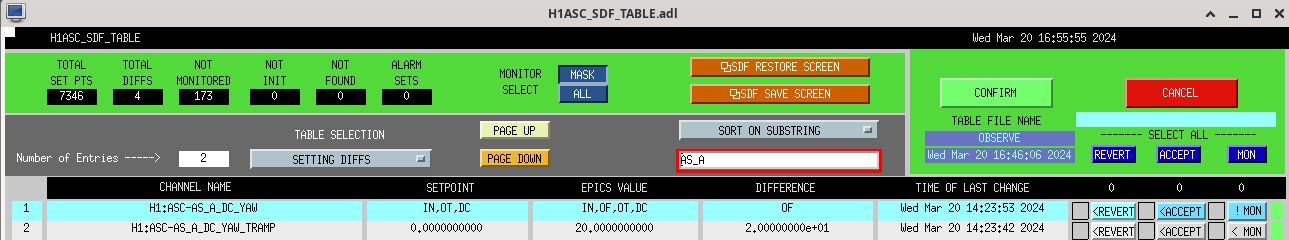
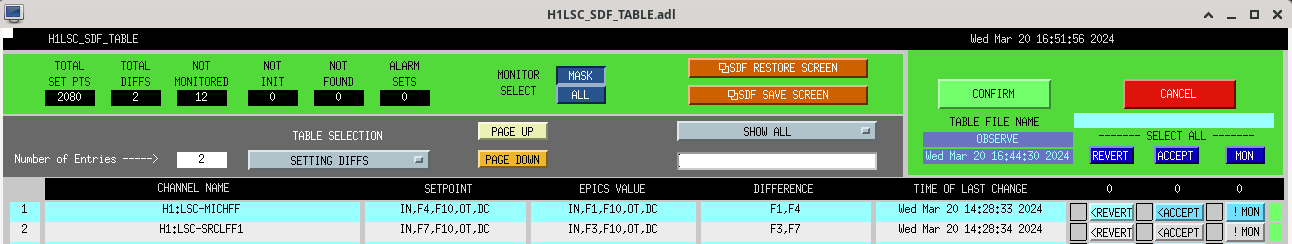
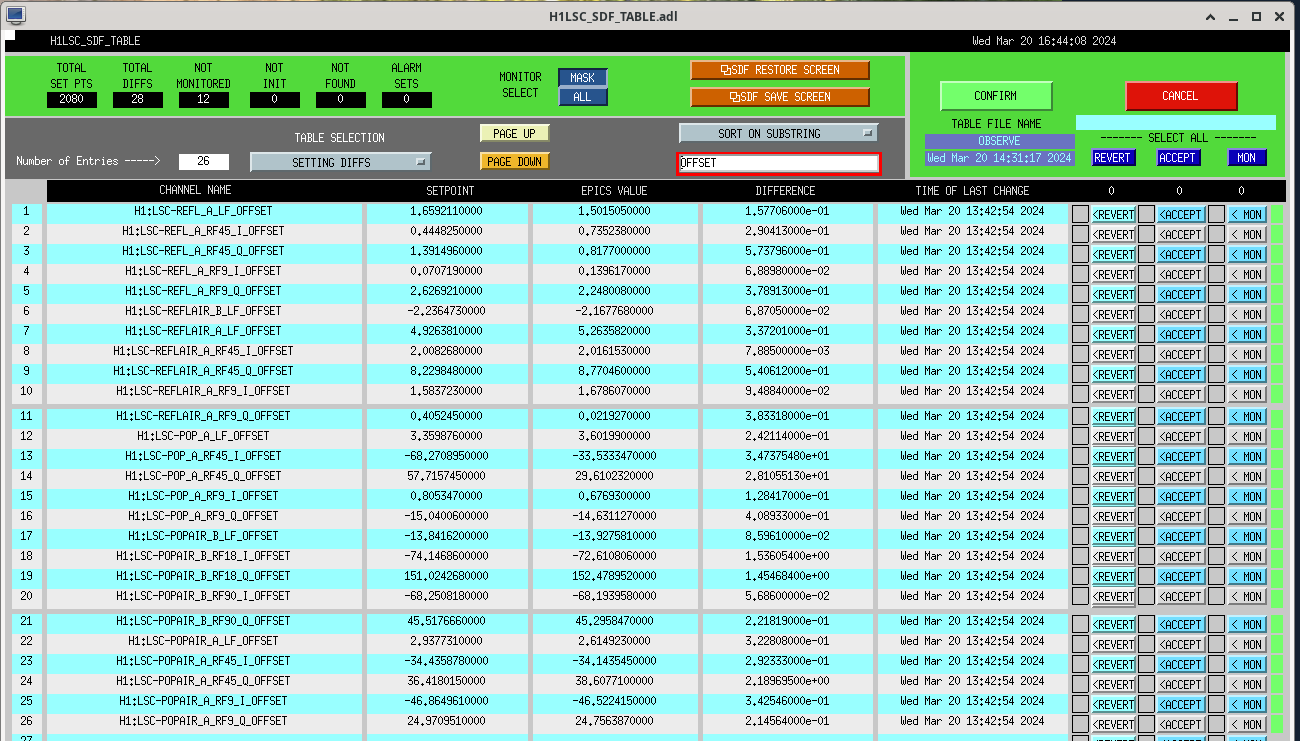
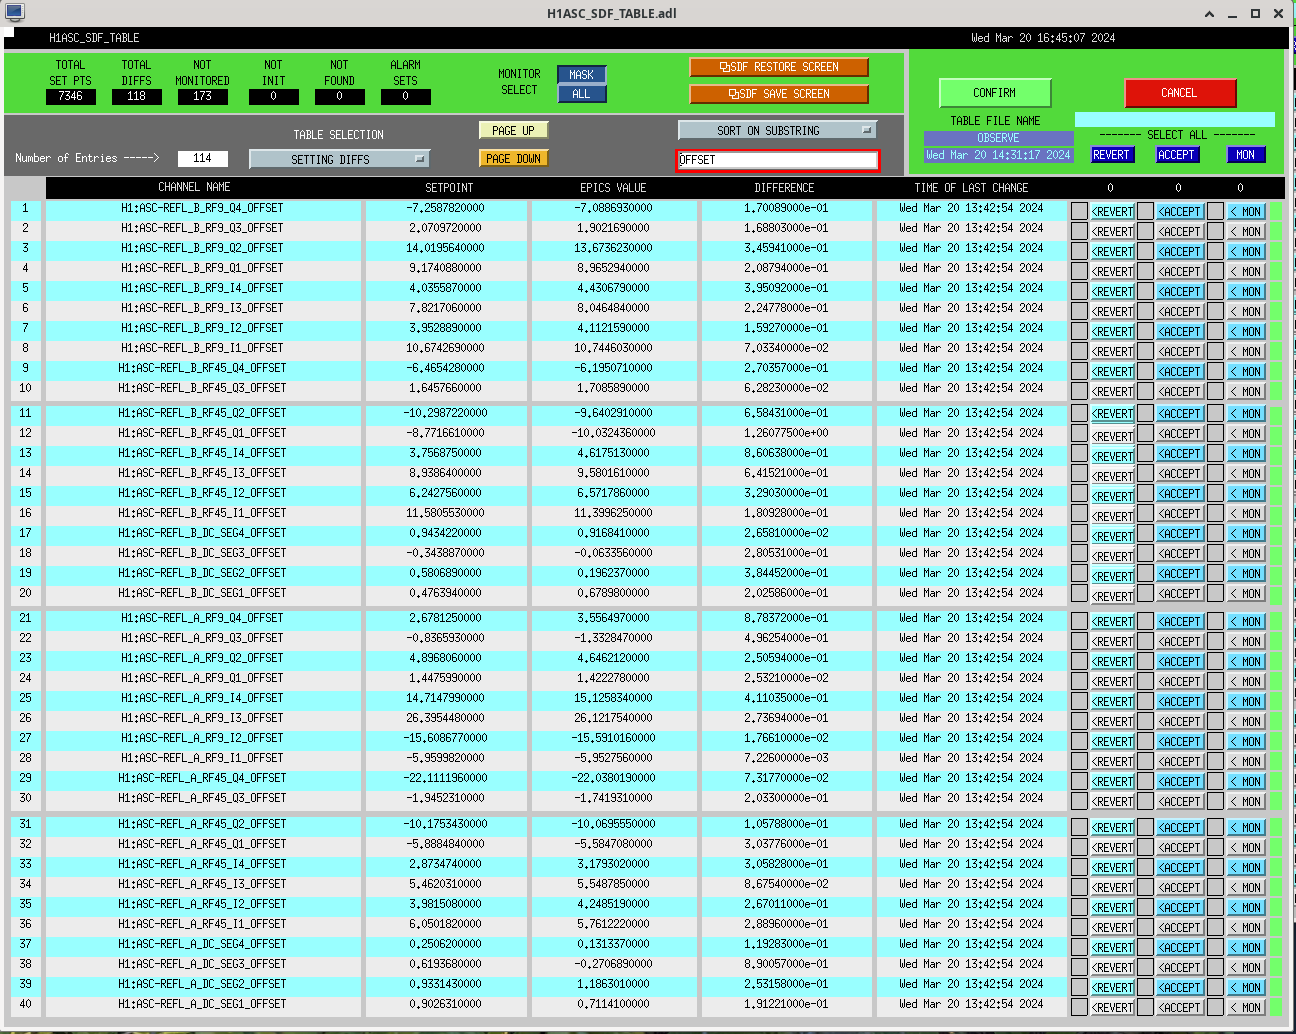
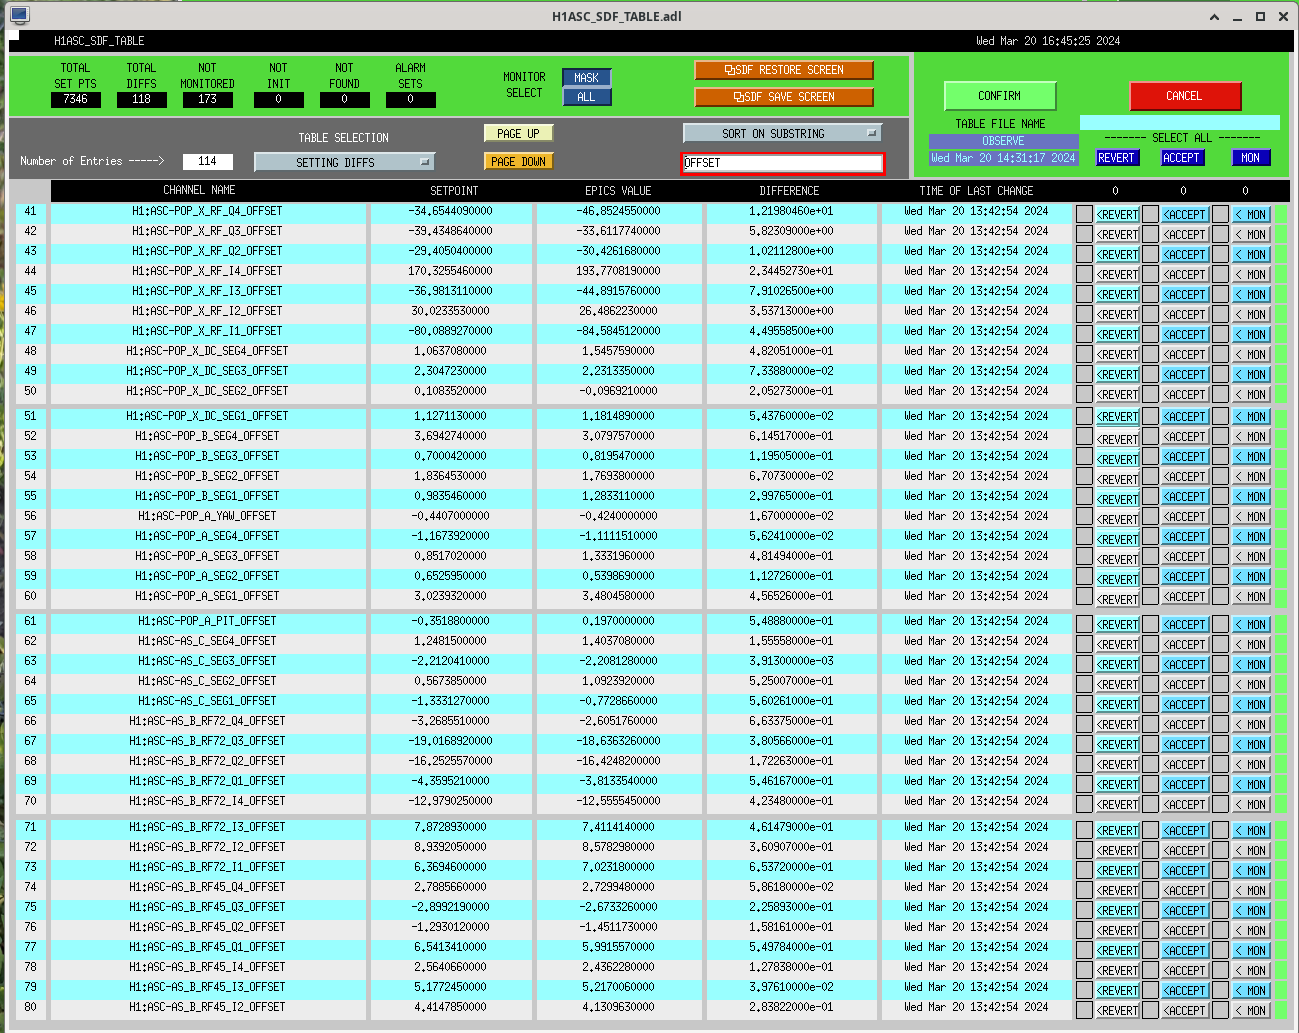
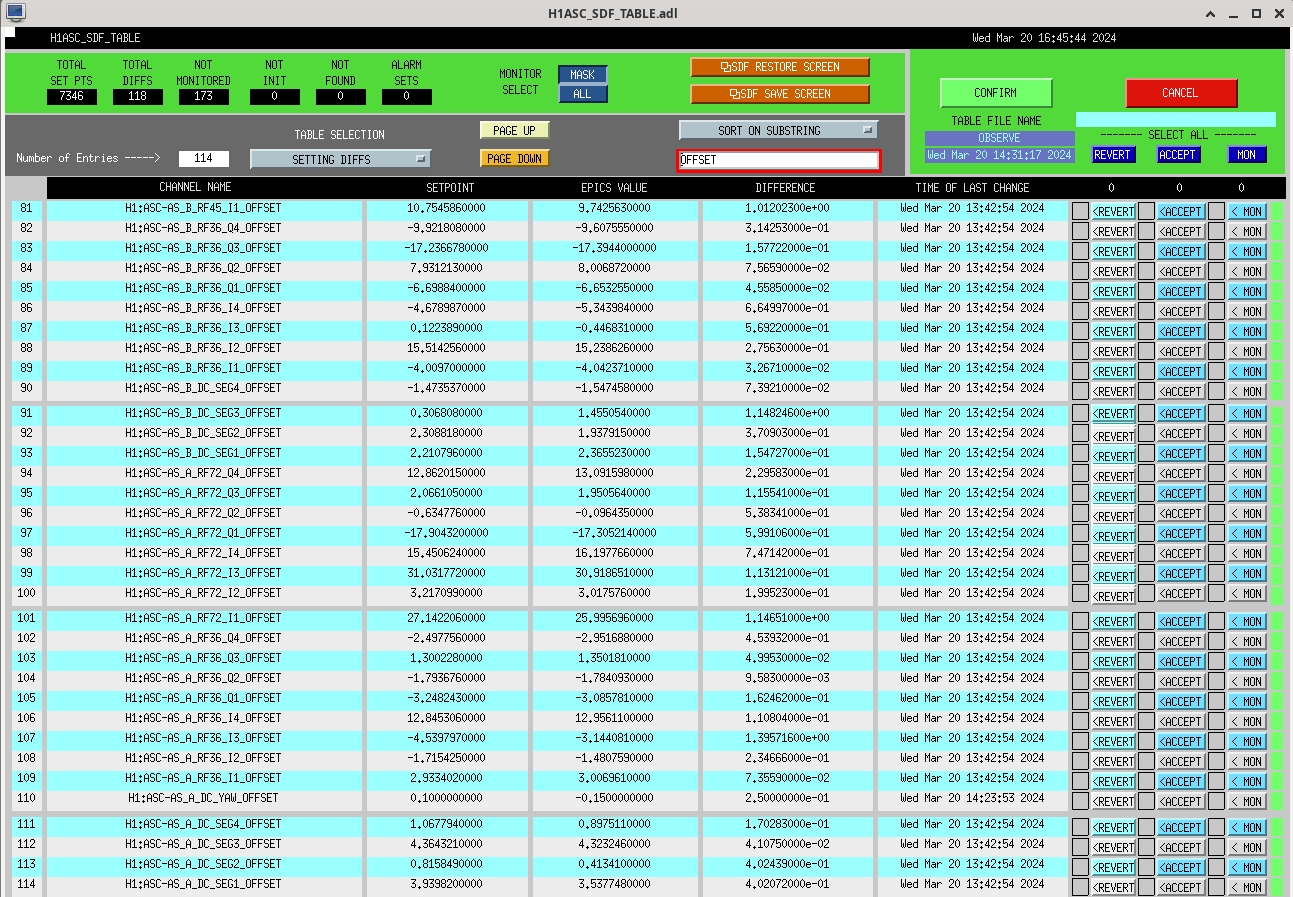
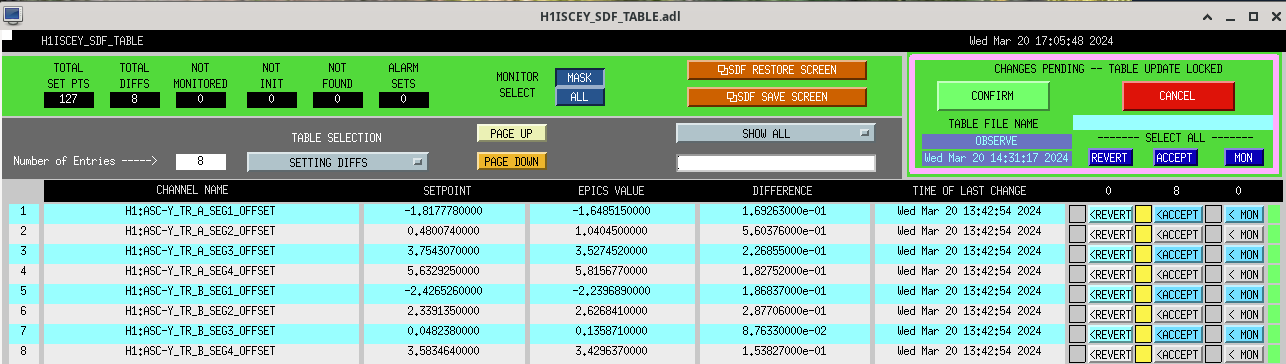
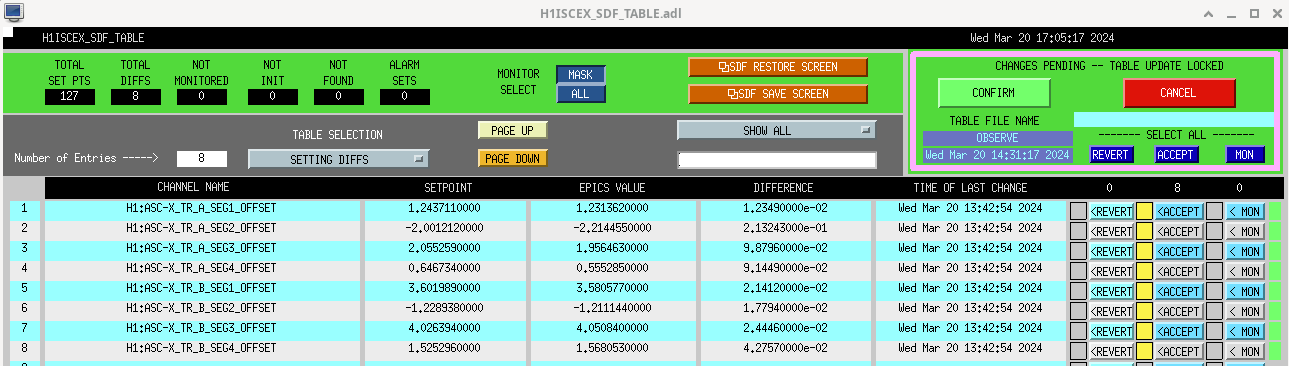
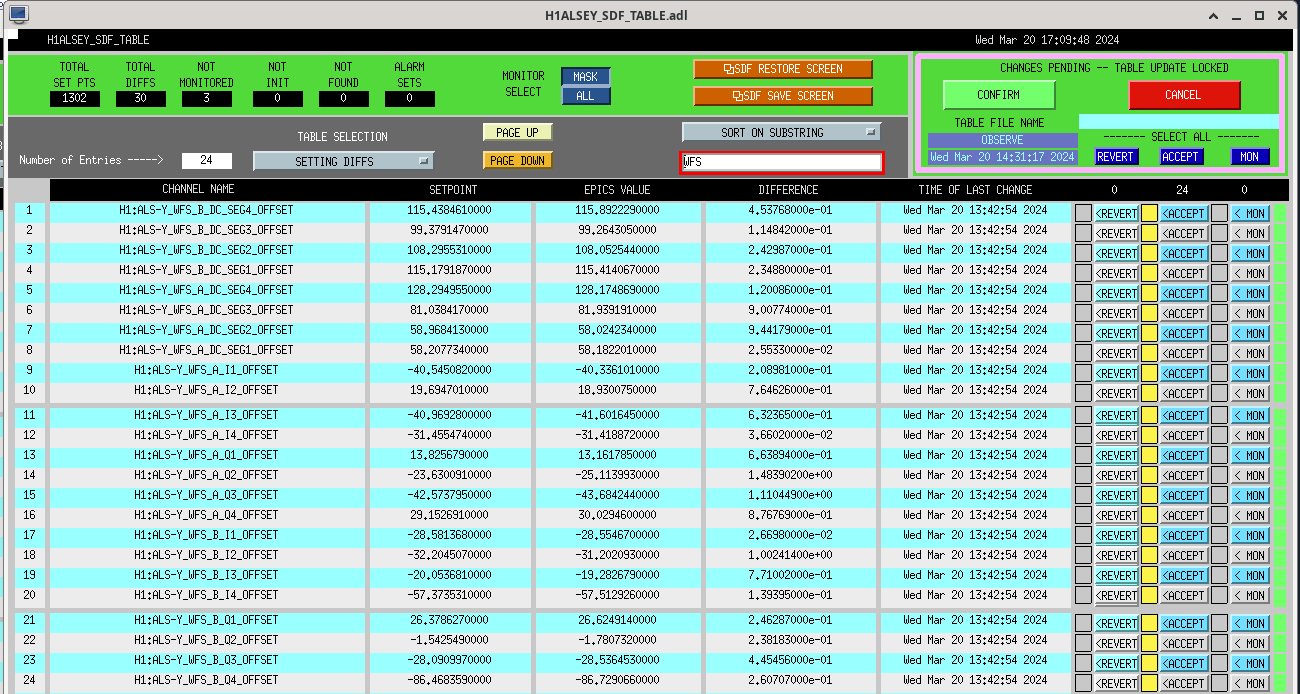
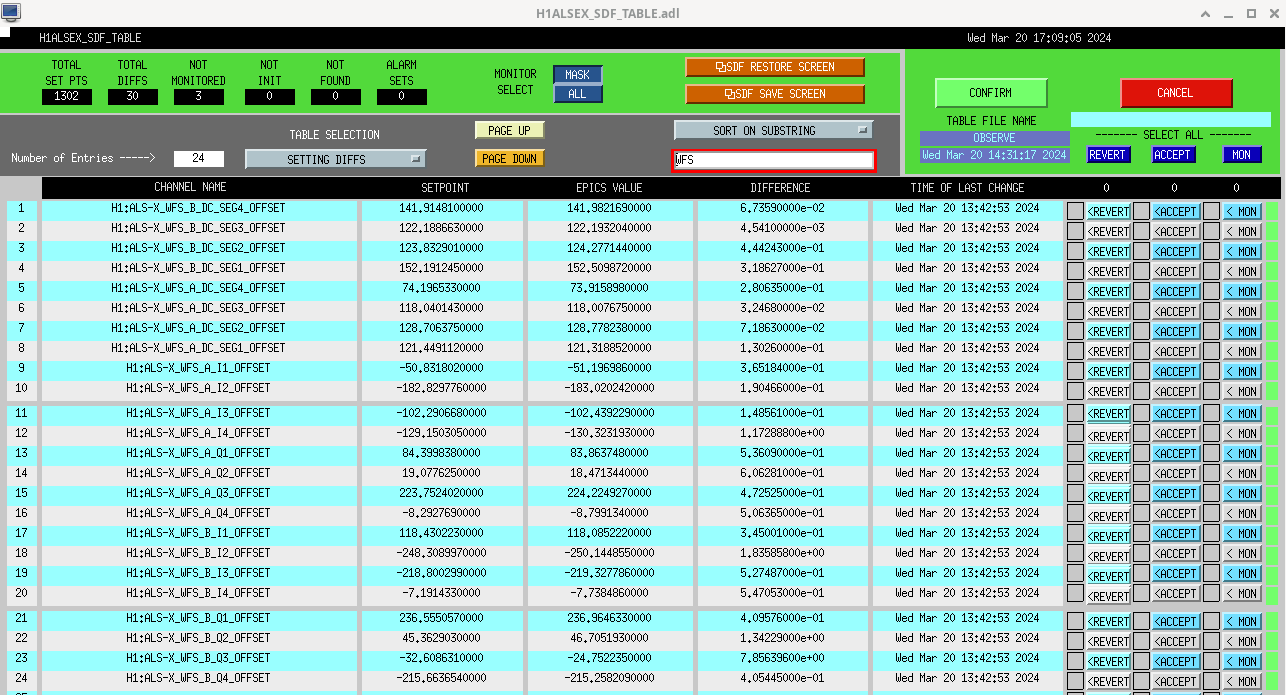
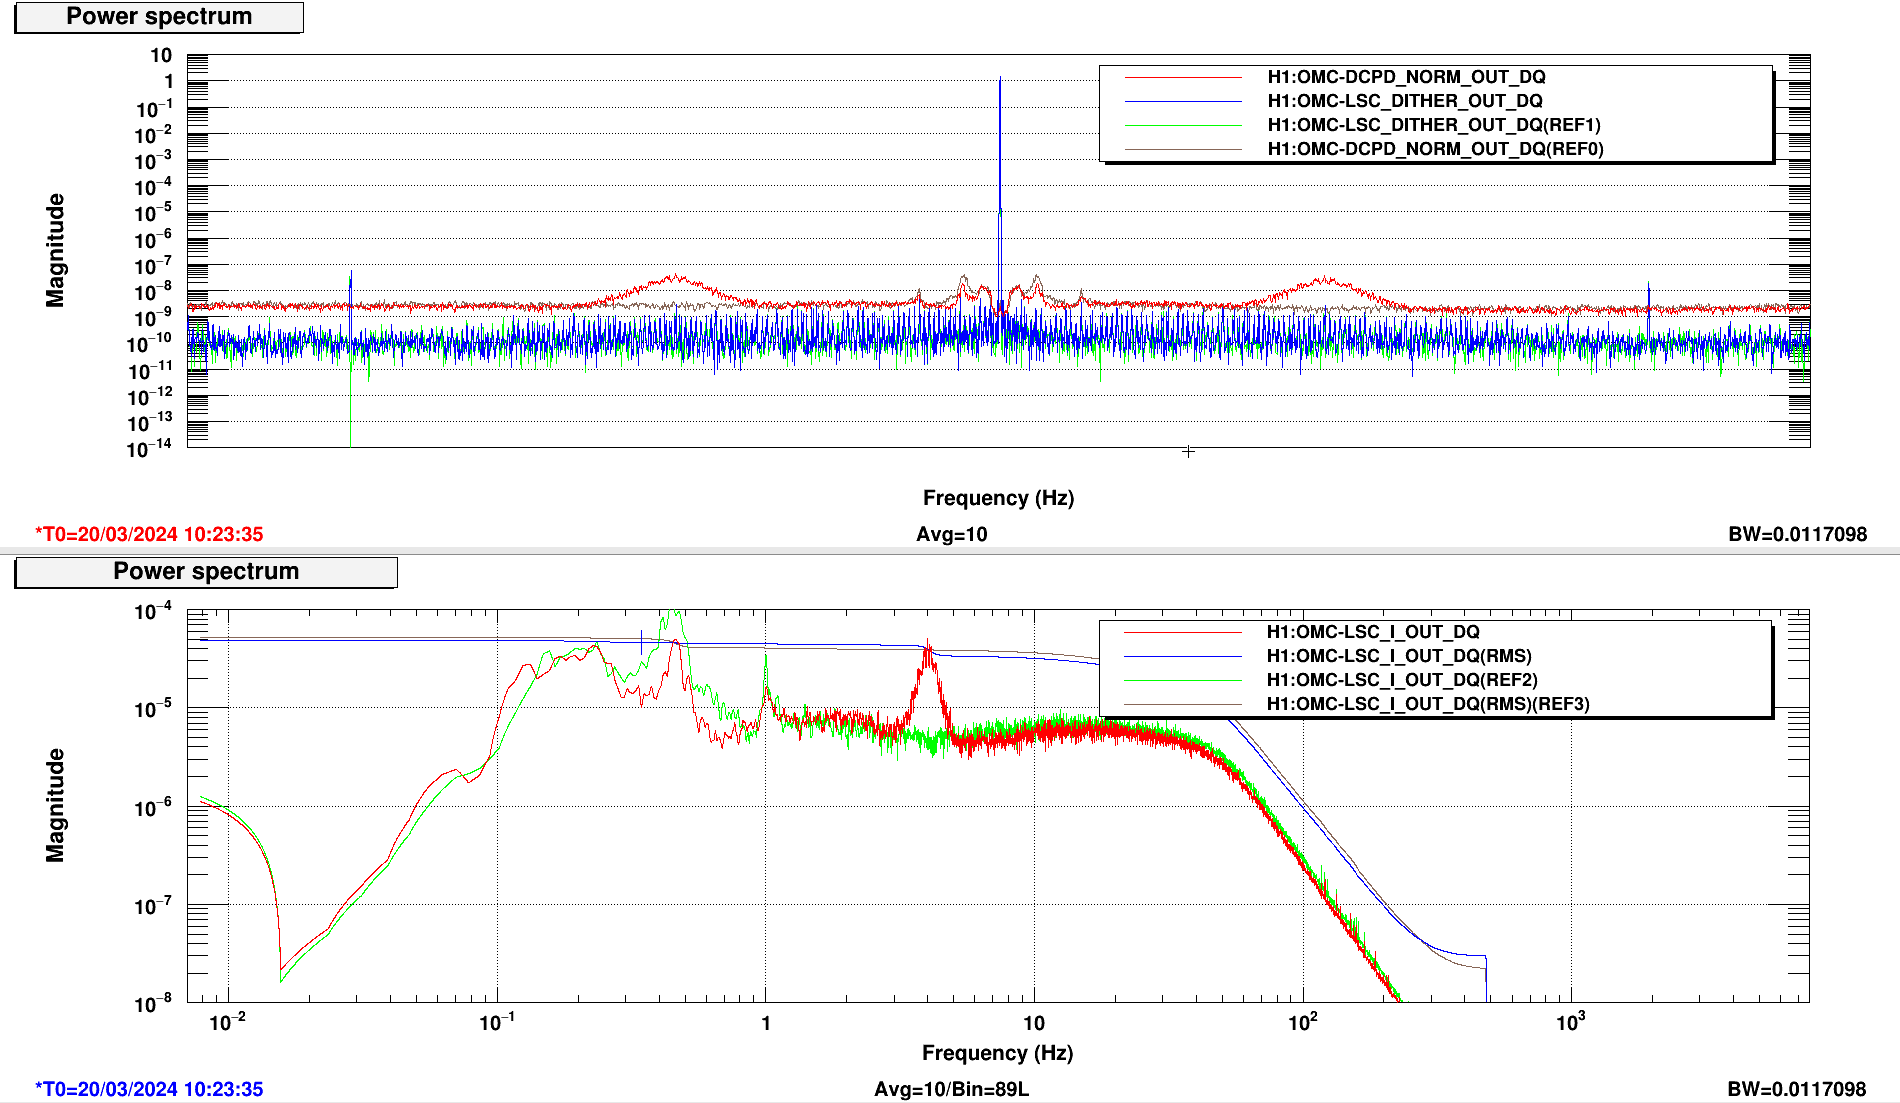
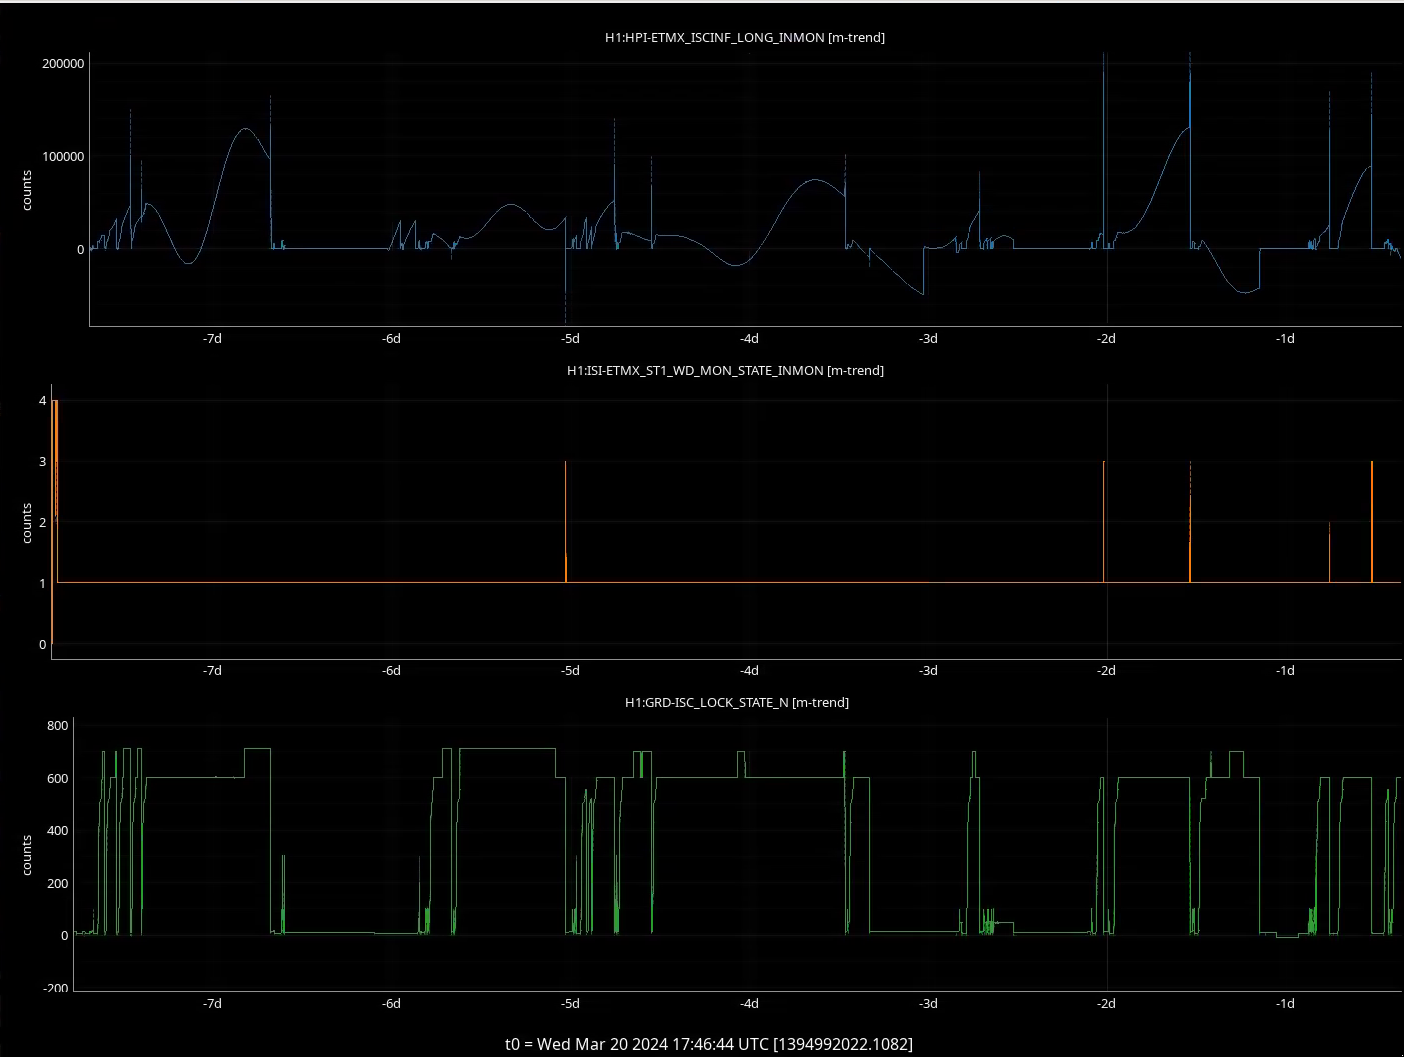
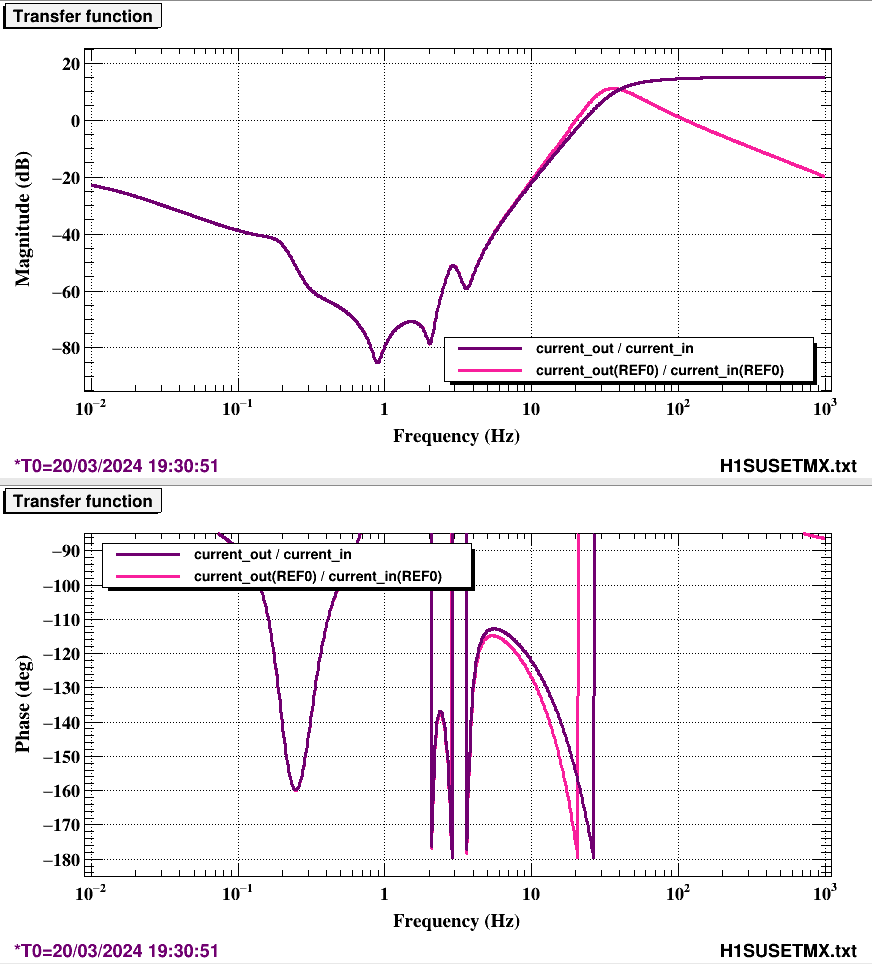
- We lost hours tracking down why the filter cavity failed to lock on green. A reminder to check SDF next time we run into mysterious problems.
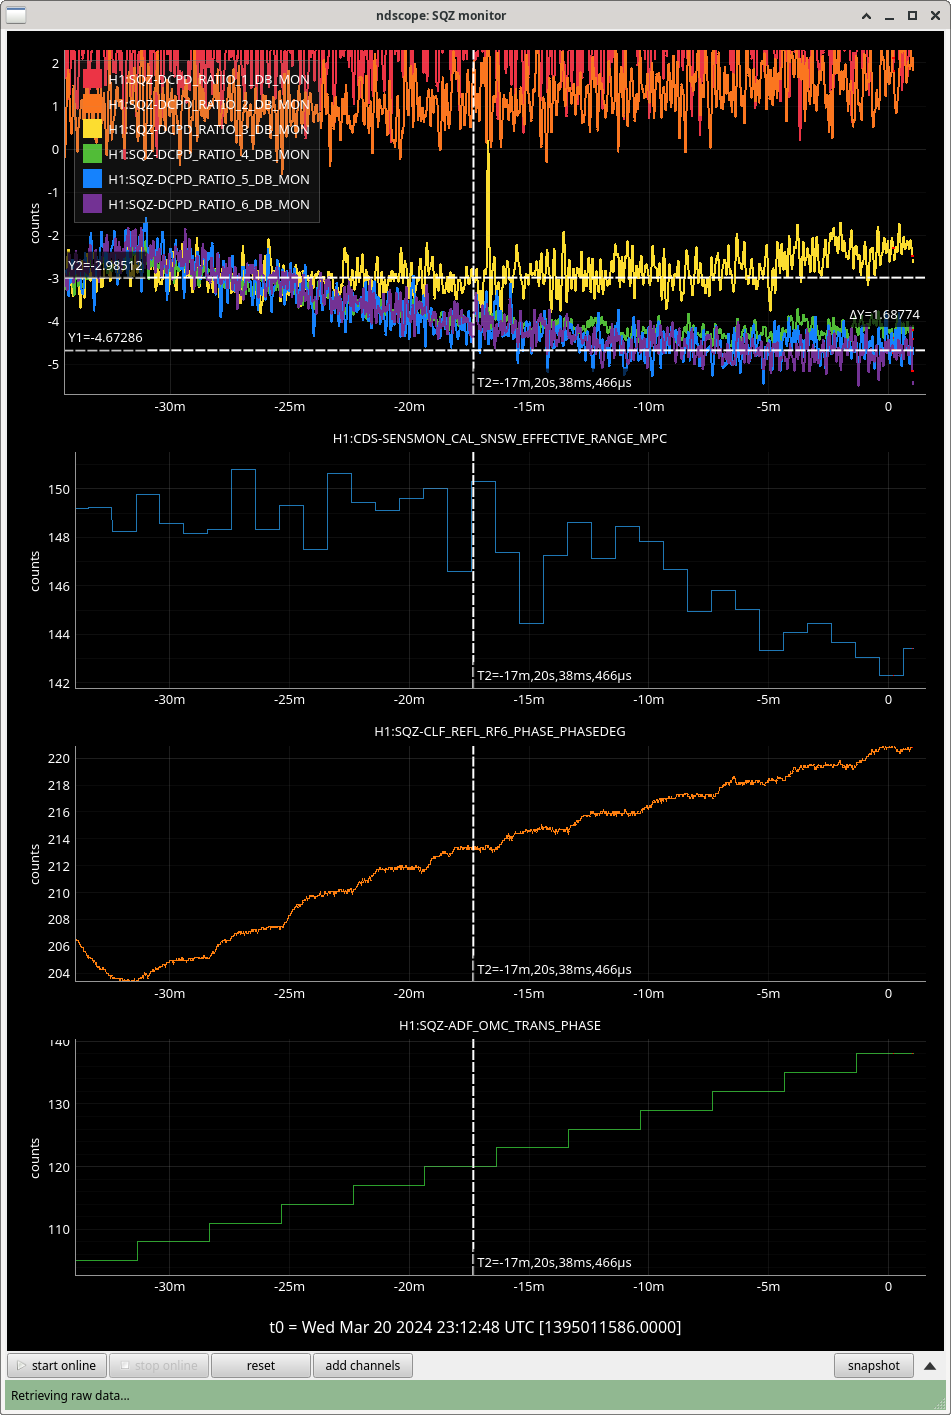
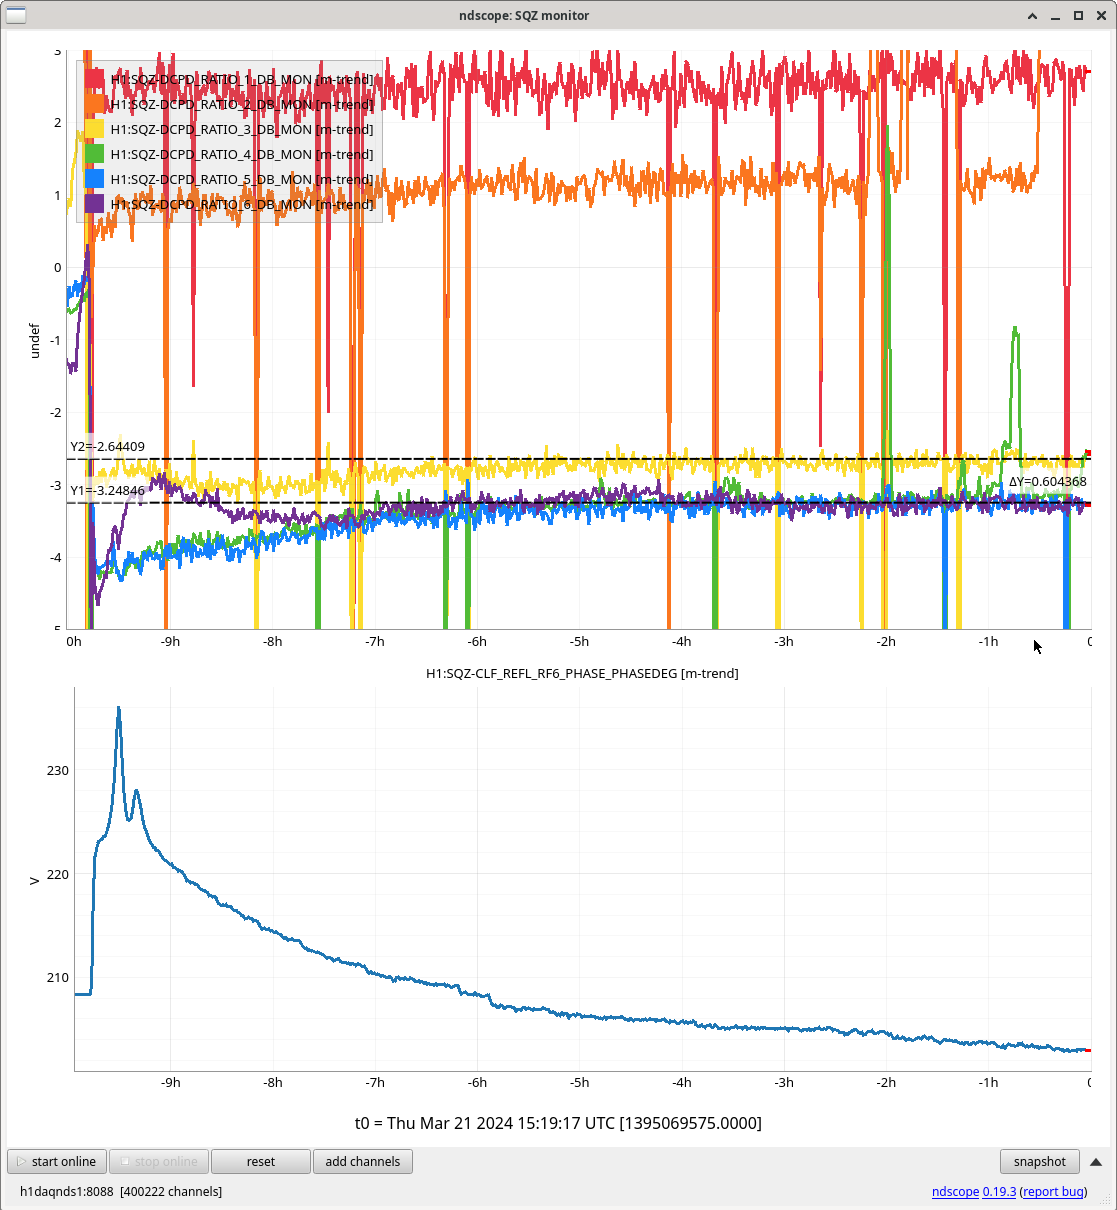
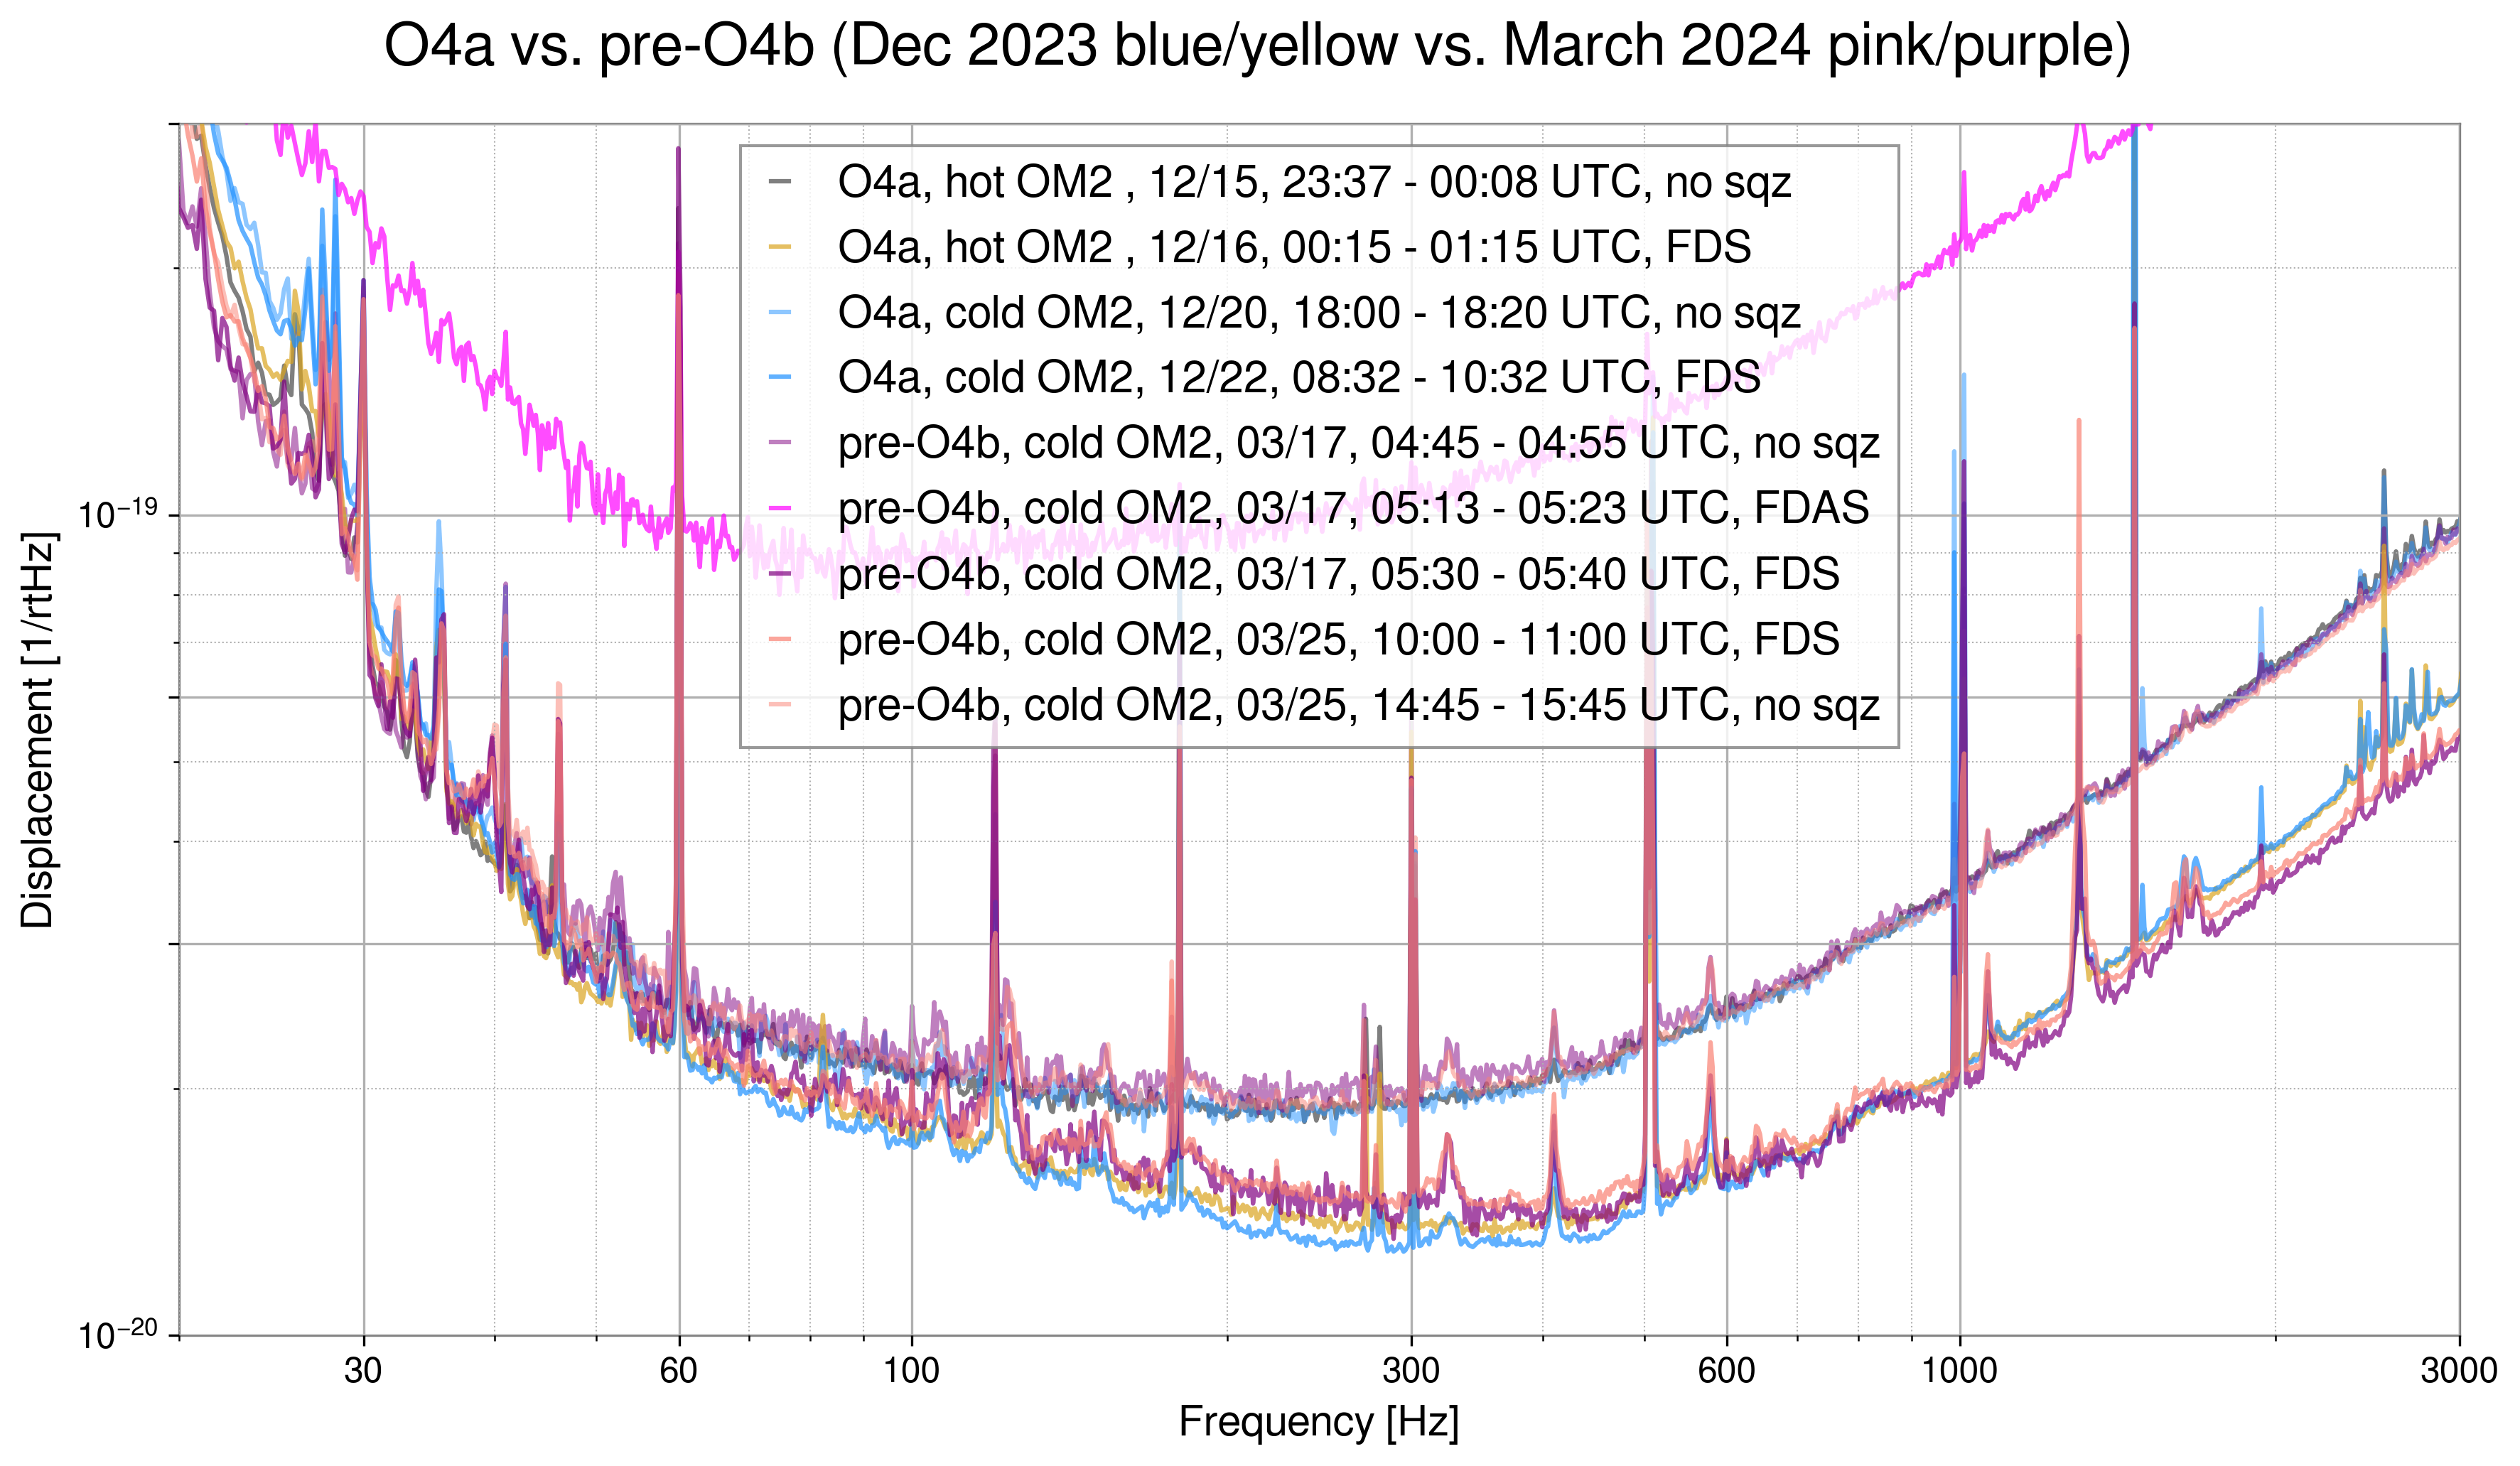
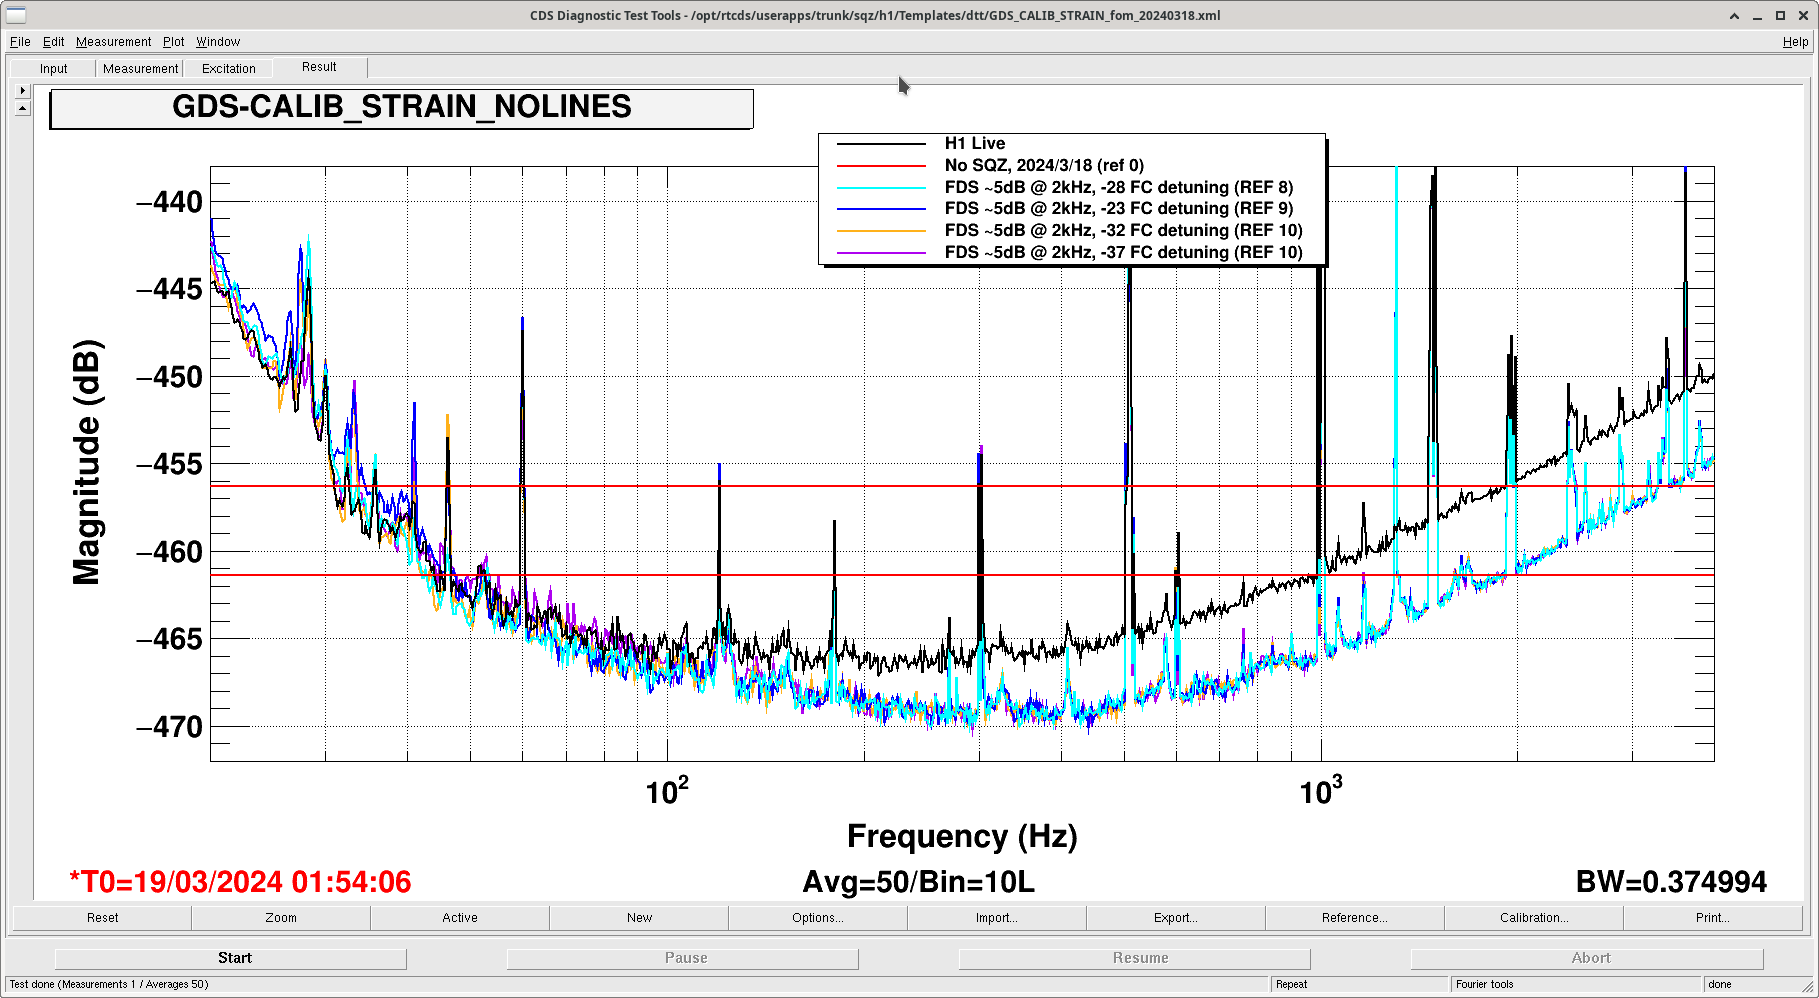
- After everything went back to normal we recovered 5 dB of squeezing. DARM plot said so. BLRMS seemed slightly off. We tried turning the ASC loop off and optimizing the ZM alignment by hand to see if we could do any better than the loop. We couldn't. SQZ IFO ASC loop now works as it should.
- We also optimized the filter cavity offset. Mostly to double checked that we were sitting at a good place. An offset of -28 (where we started) gave the best squeezing at low frequency.
We haven't got to increase CLF power today.
After a new CLF VCO installed we should revert the CLF sign to make sure everything was the same as before. In theory this shouldn't do anything.