TITLE: 03/17 Day Shift: 15:00-23:00 UTC (08:00-16:00 PST), all times posted in UTC
STATE of H1: Commissioning
INCOMING OPERATOR: None
SHIFT SUMMARY:
IFO is at LOCKING and at CARM_5_PICOMETERS (309)
(15:00 UTC 0- 21:45 UTC) ISI IY Interface Chassis is dead and requires replacement:
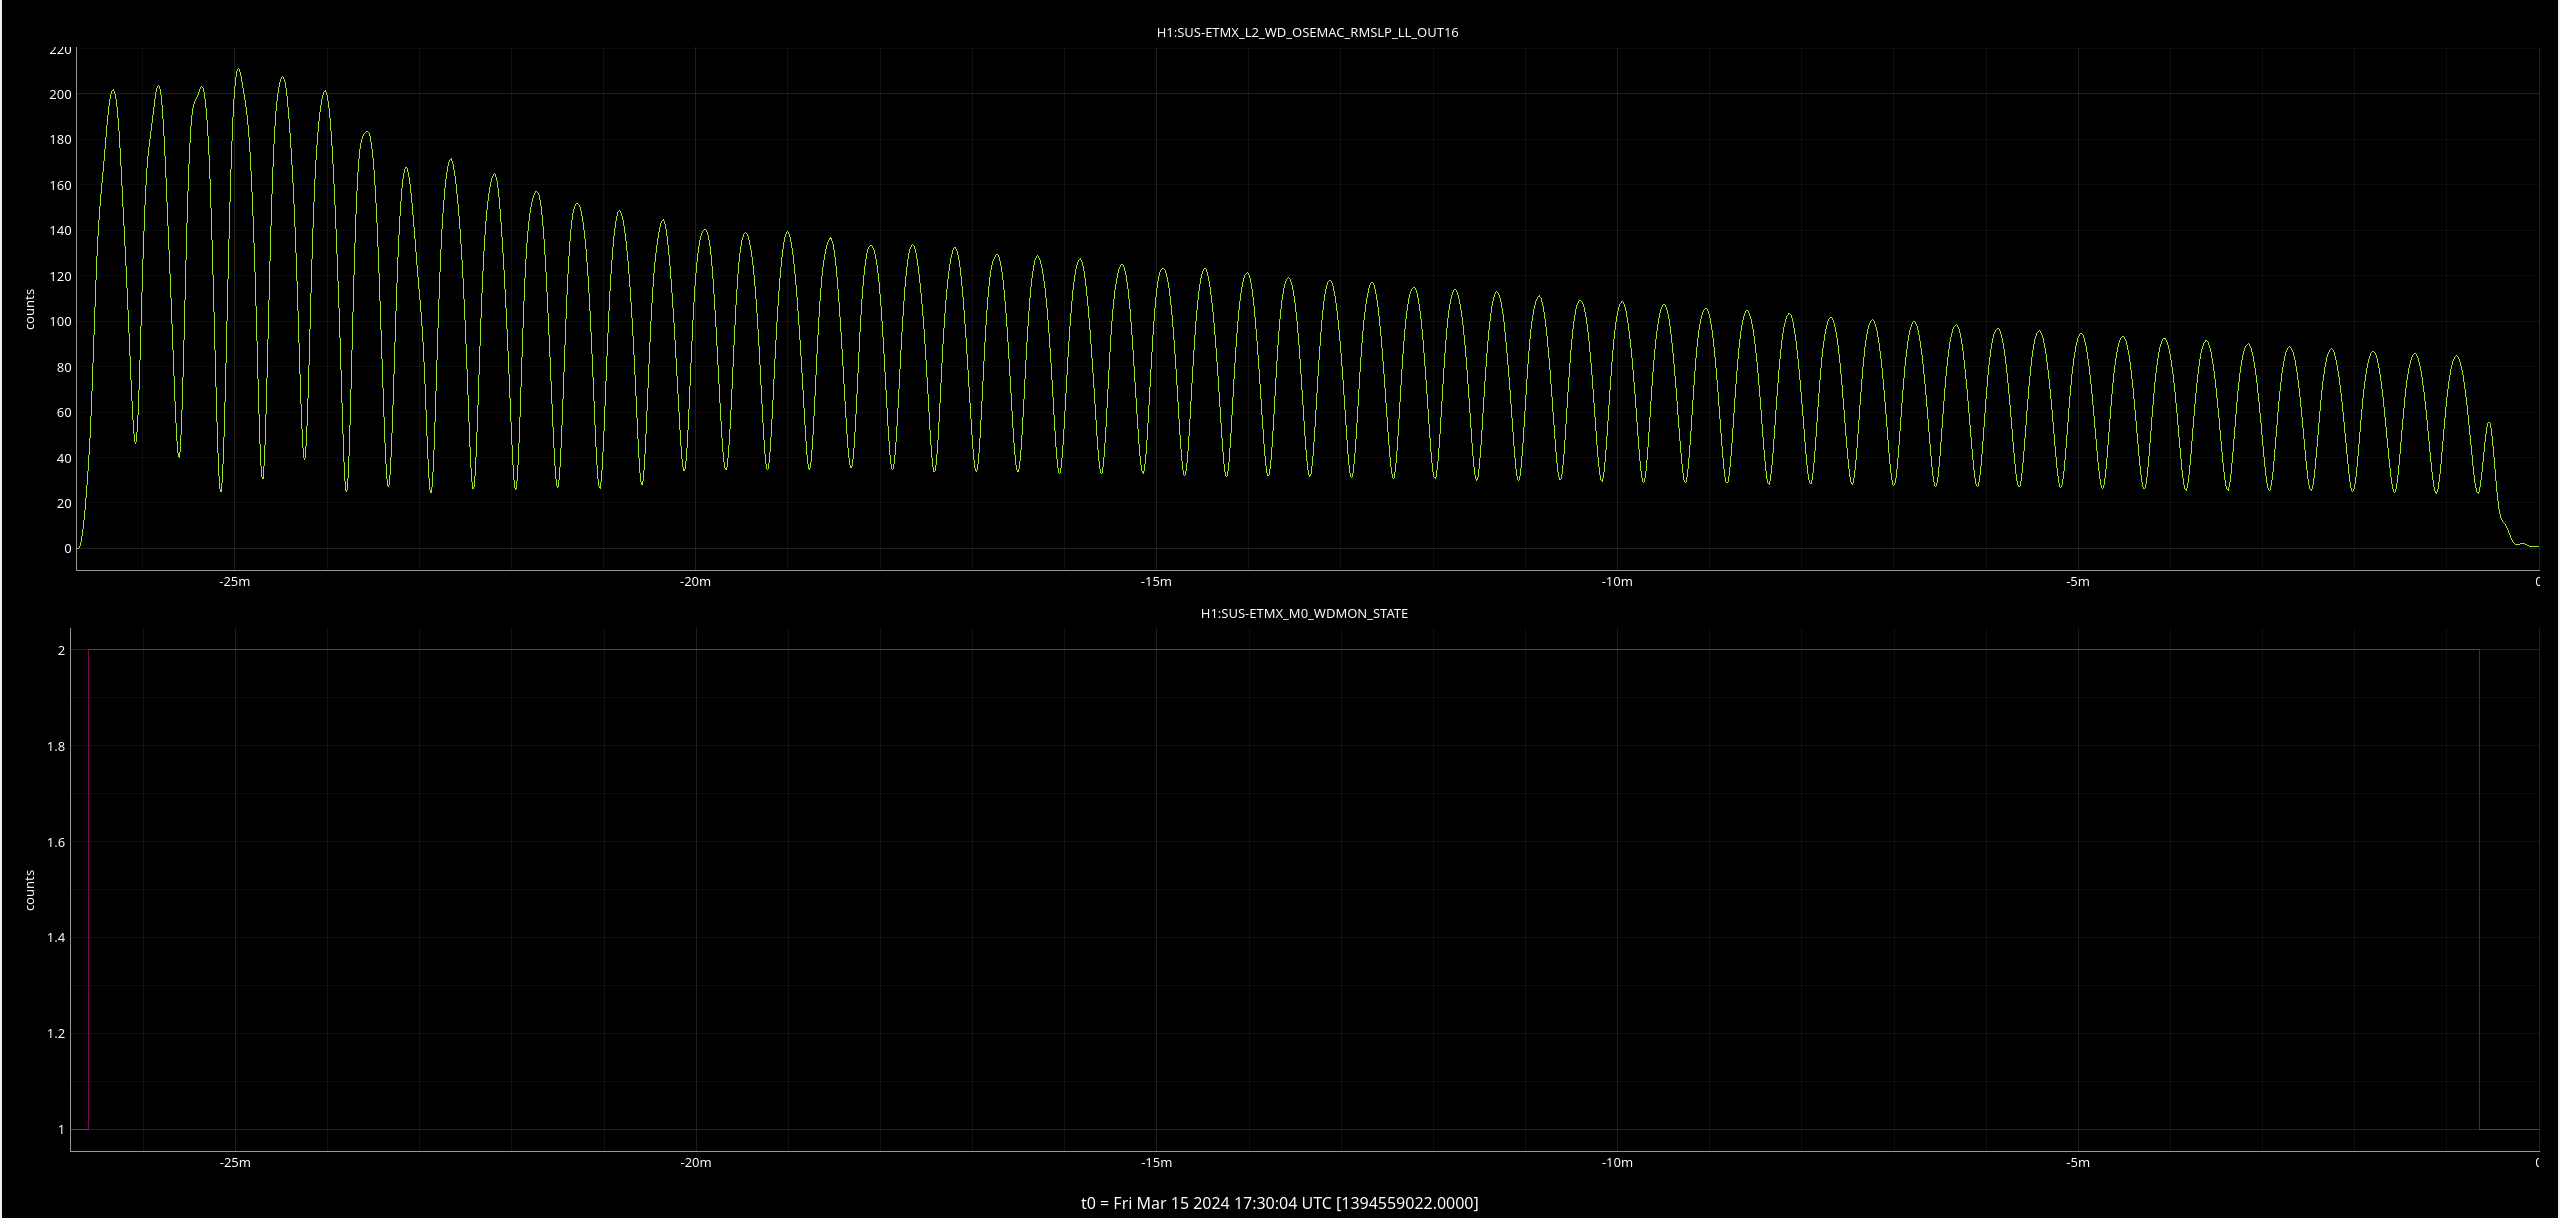
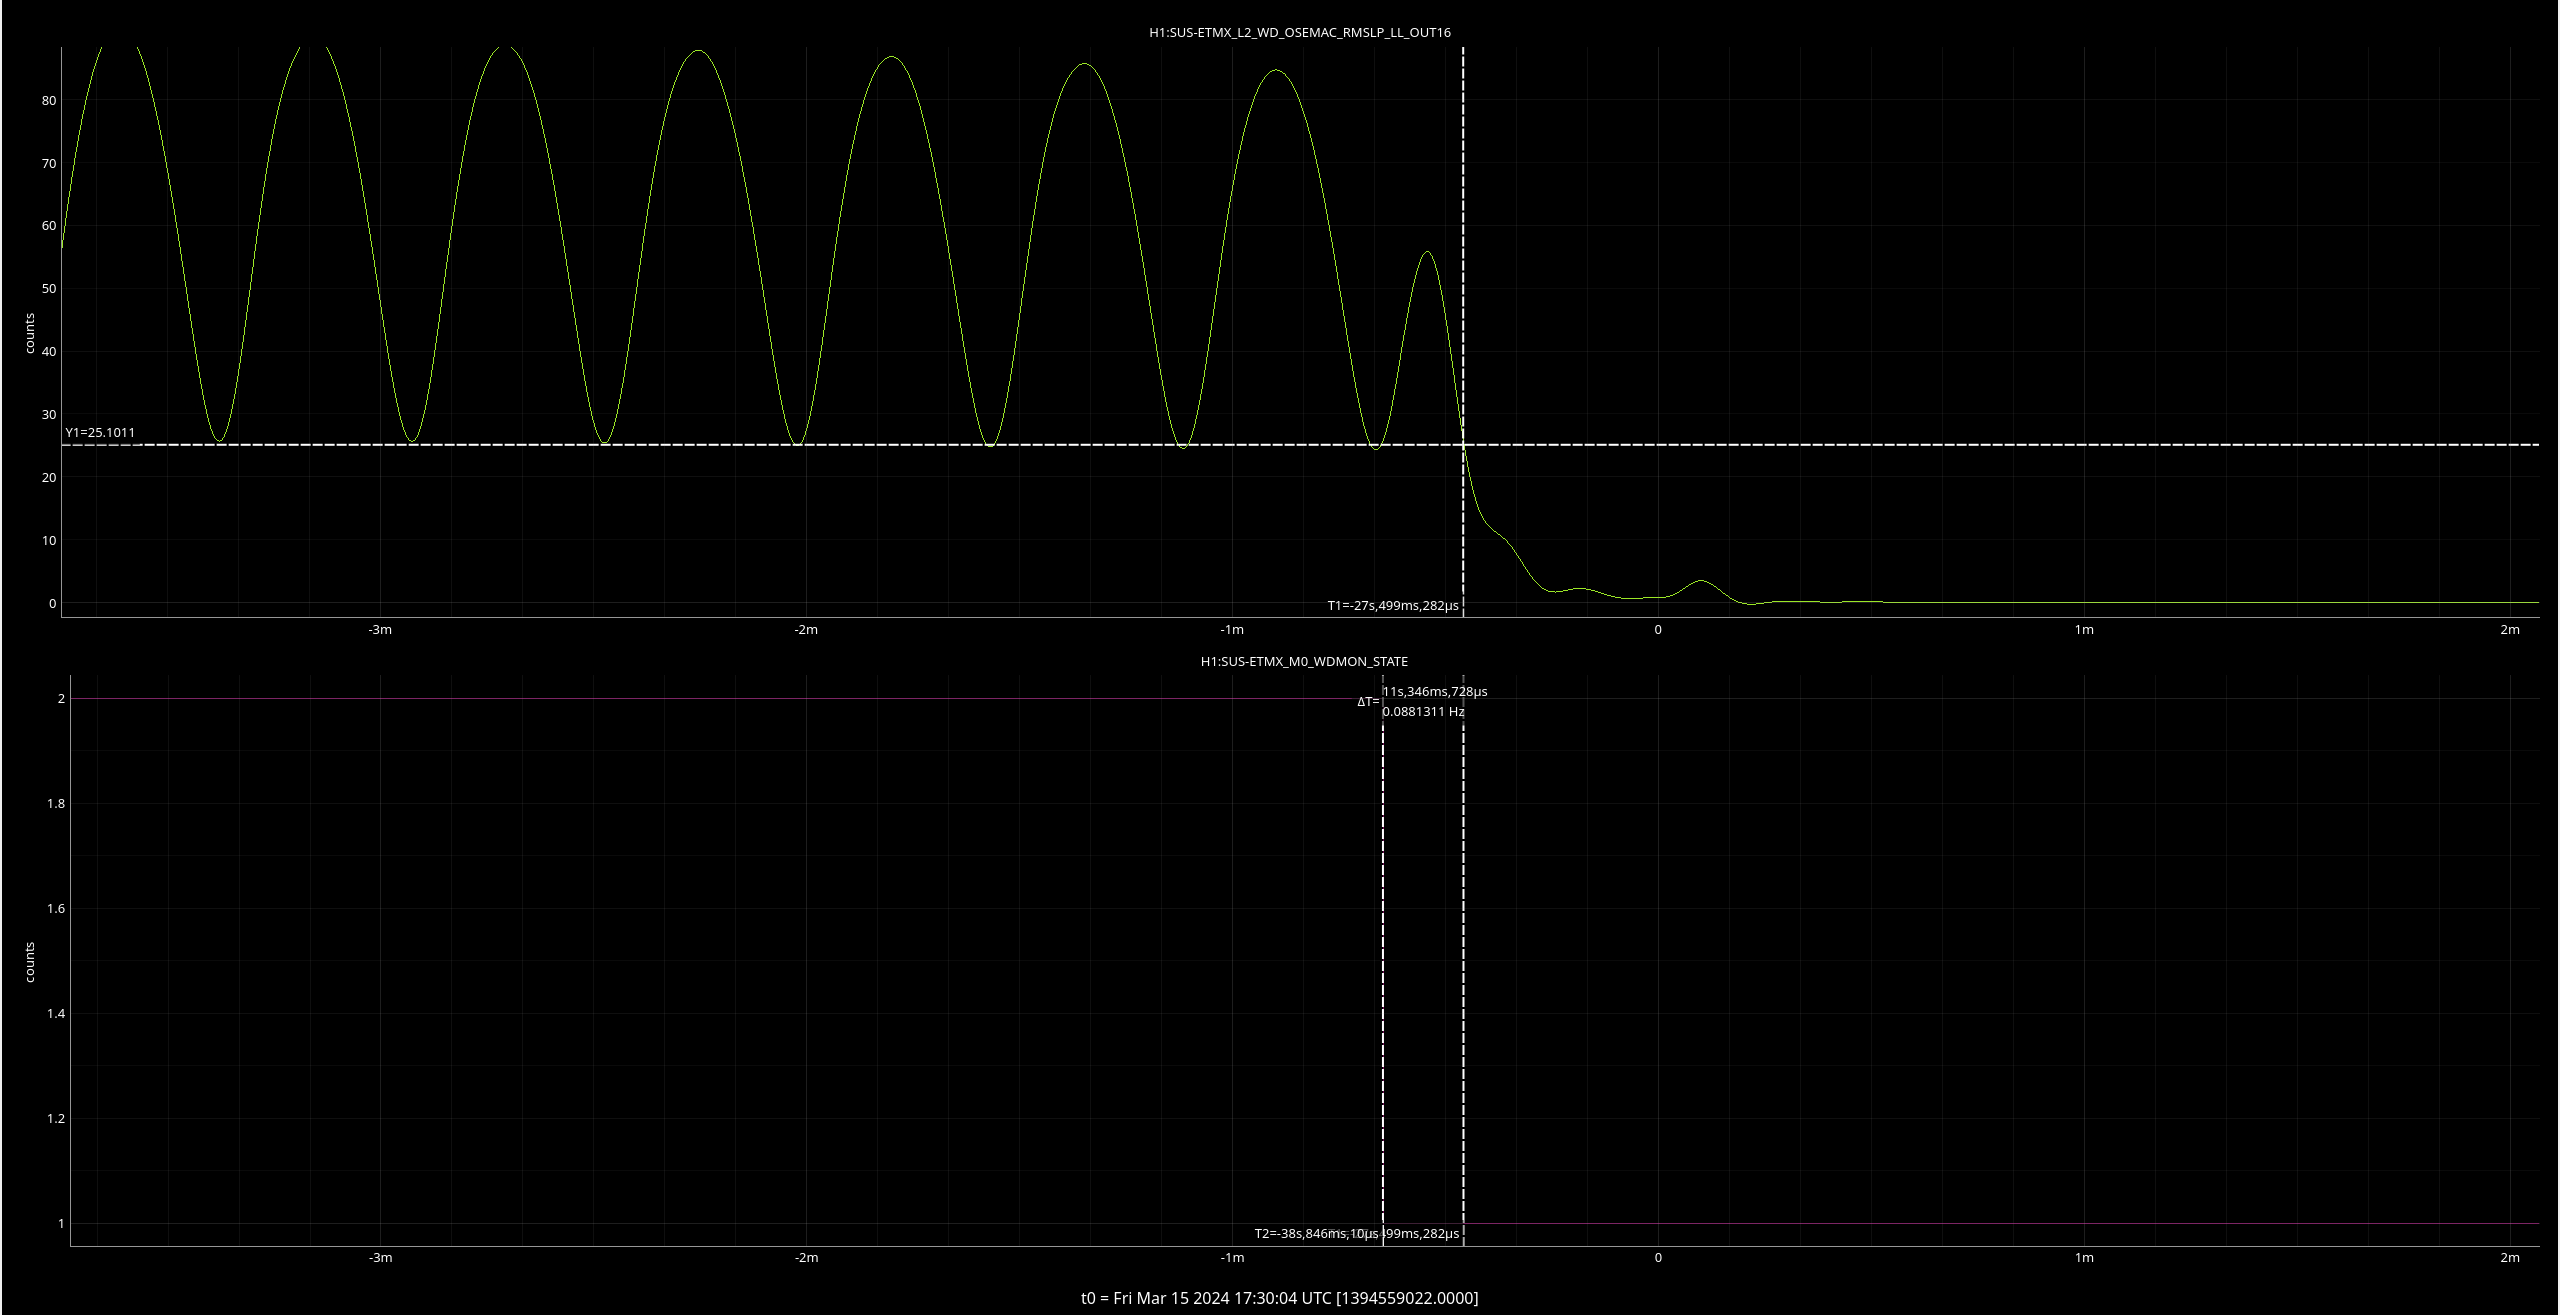
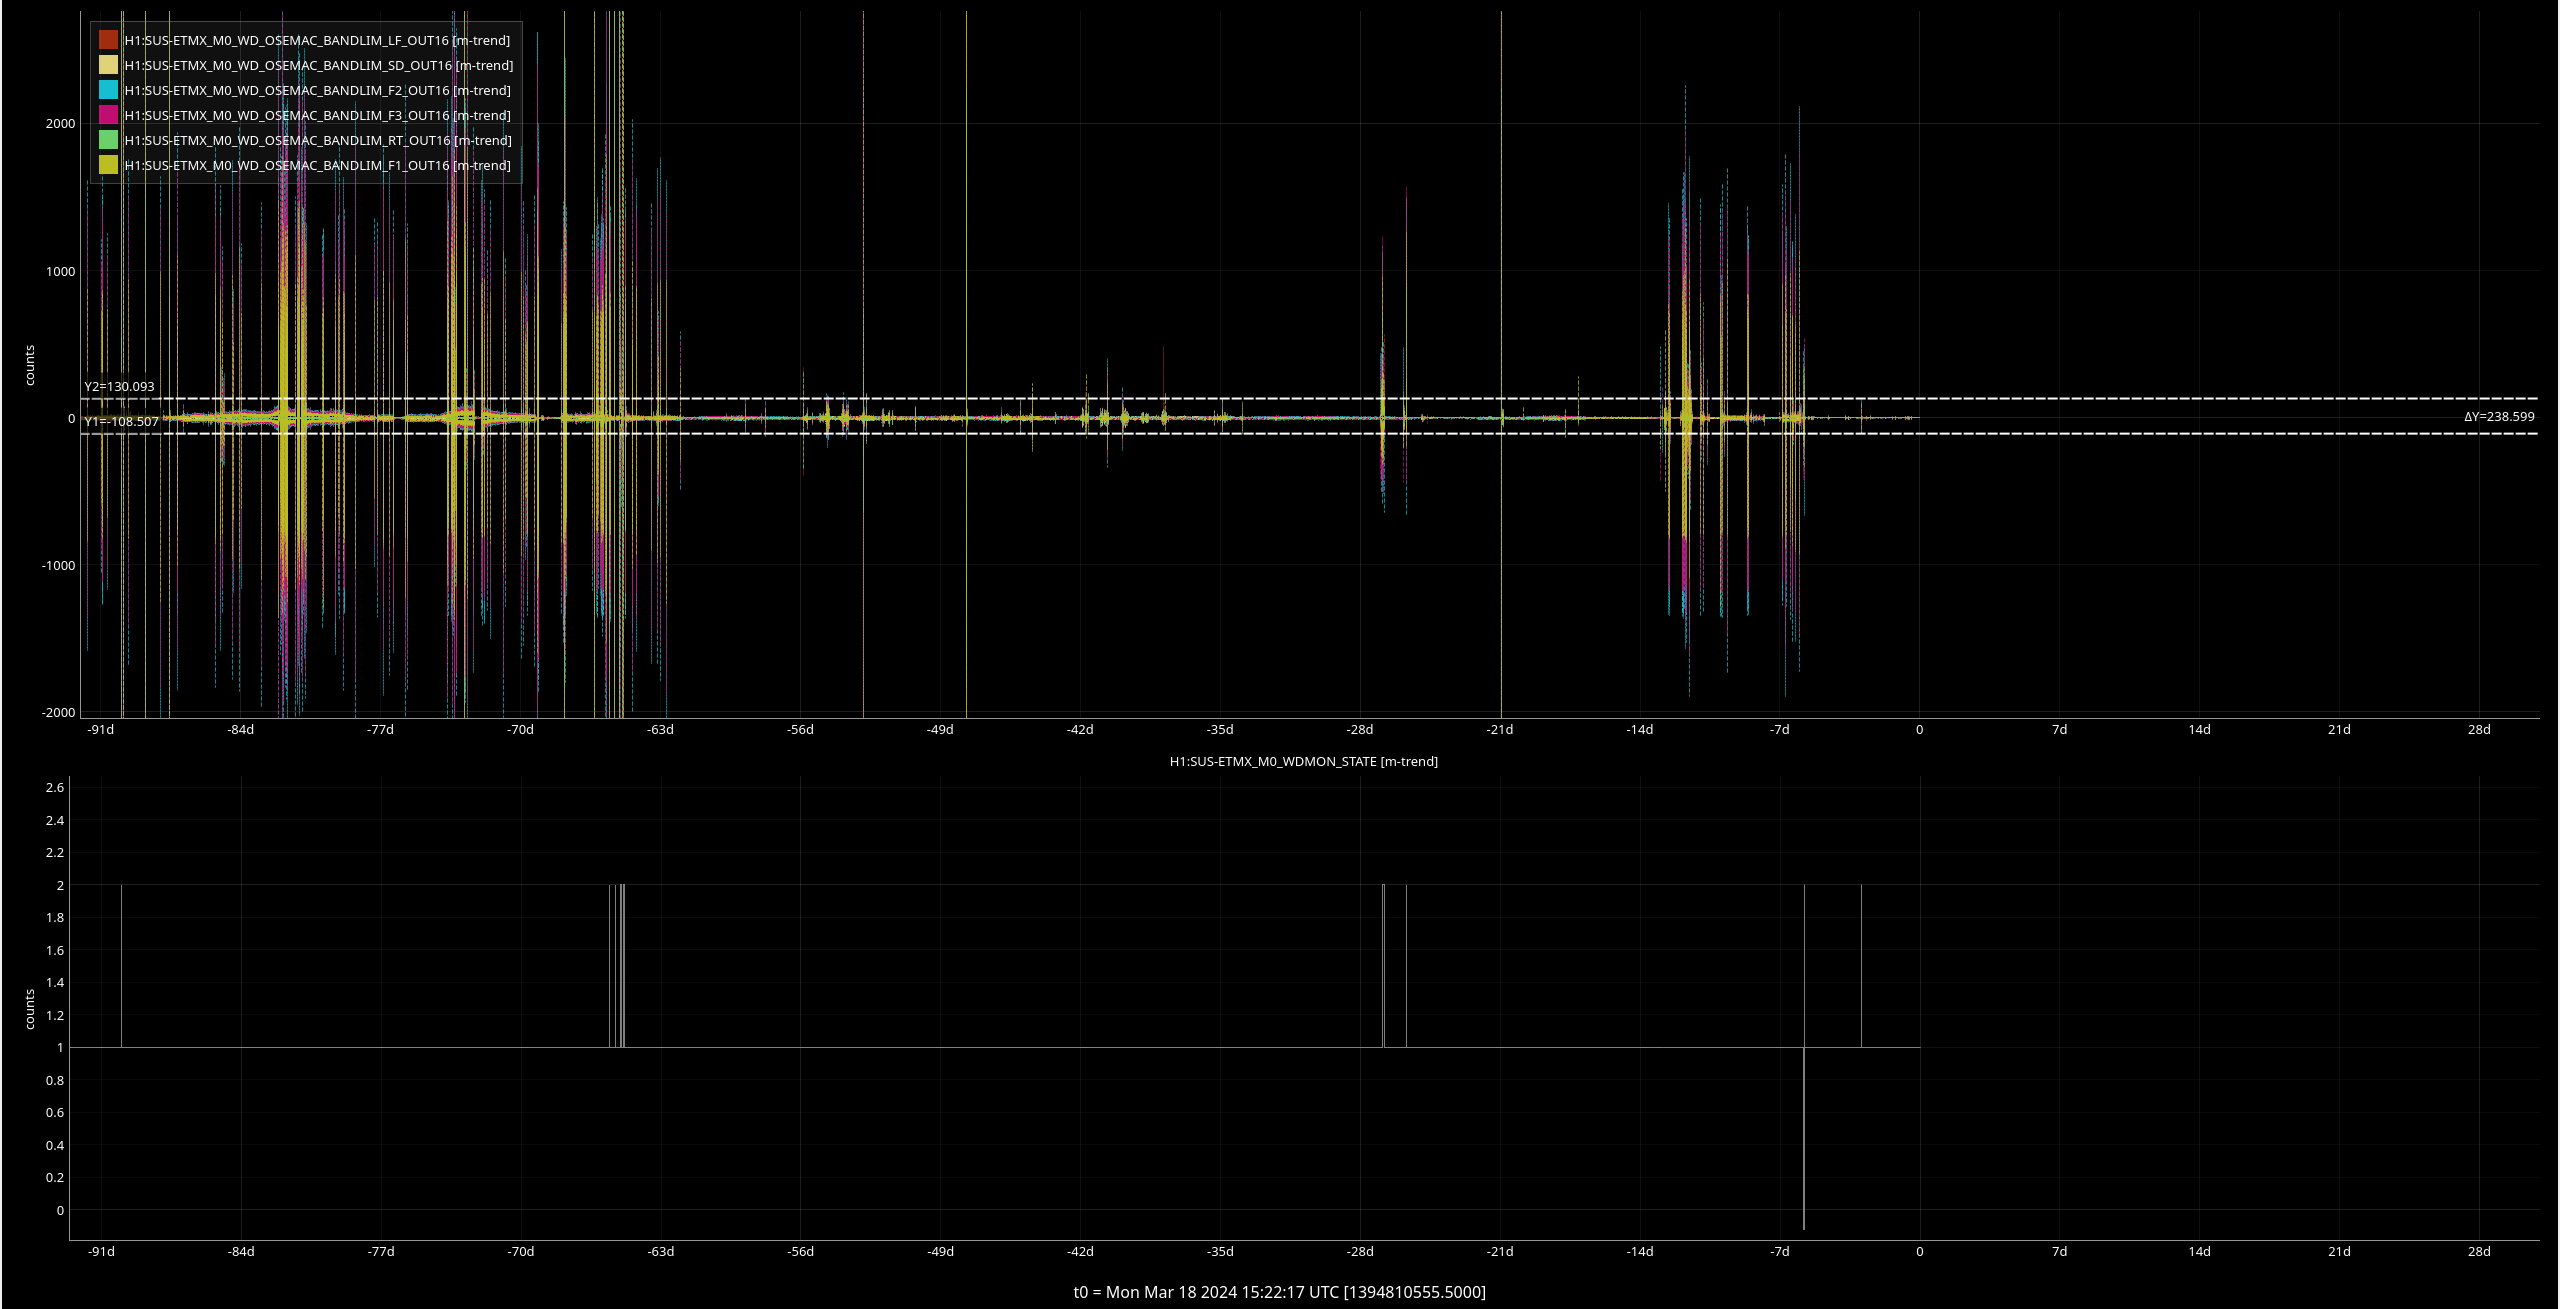
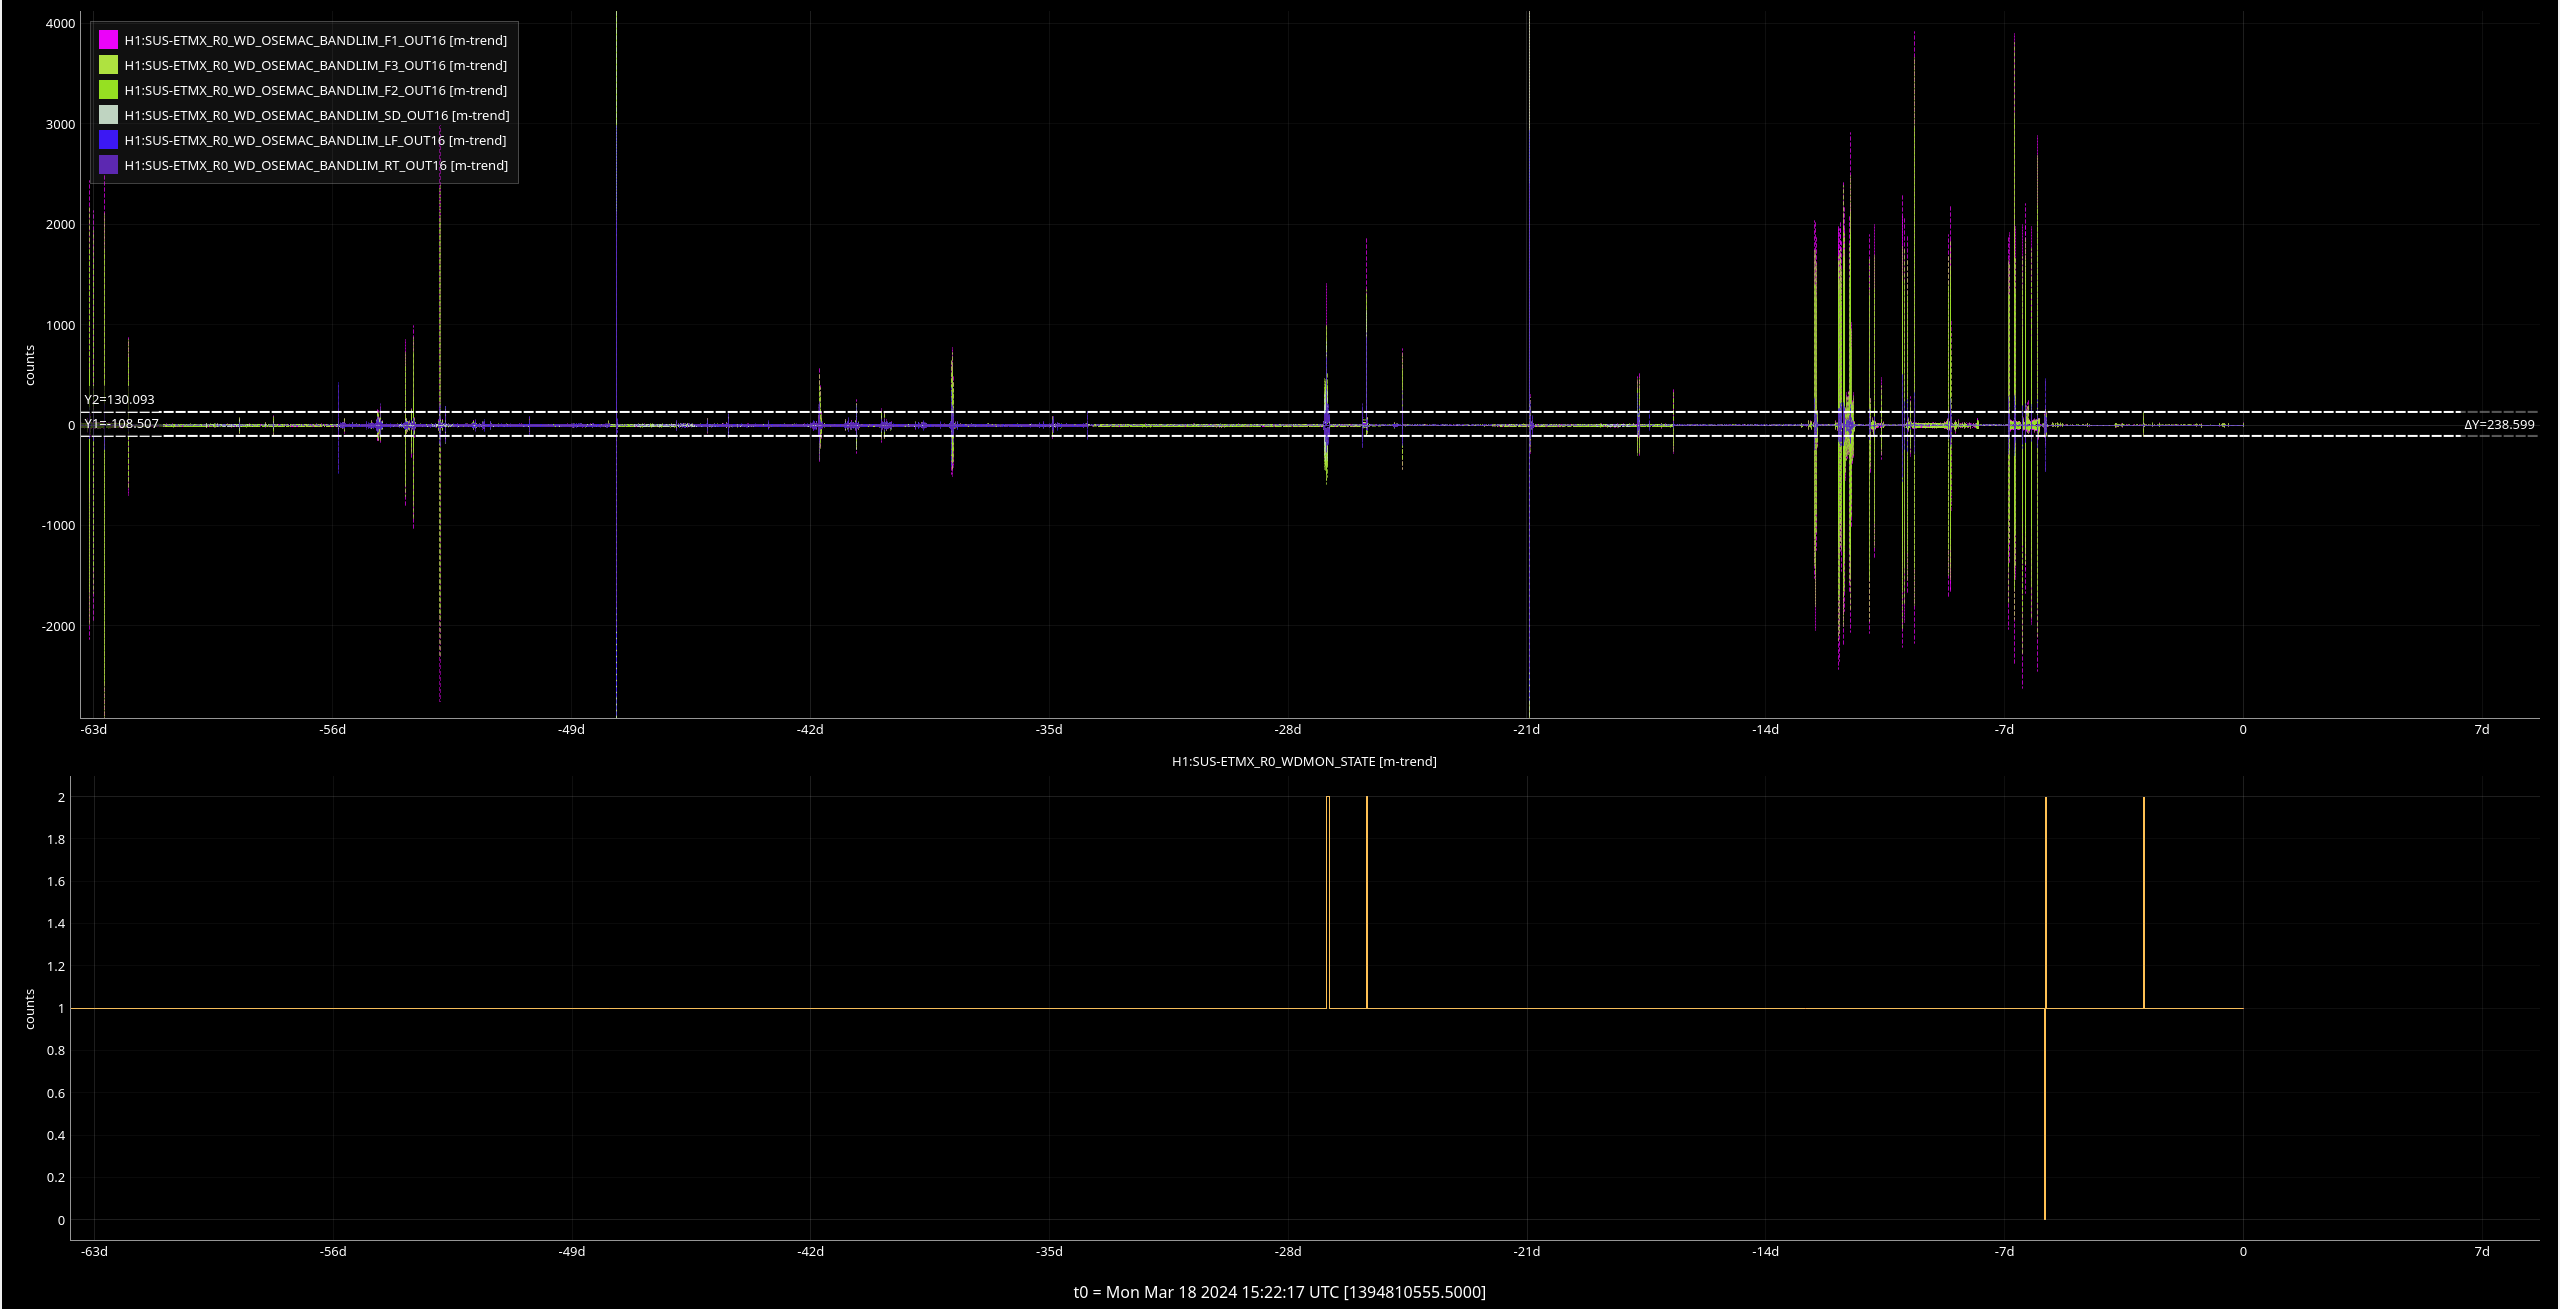
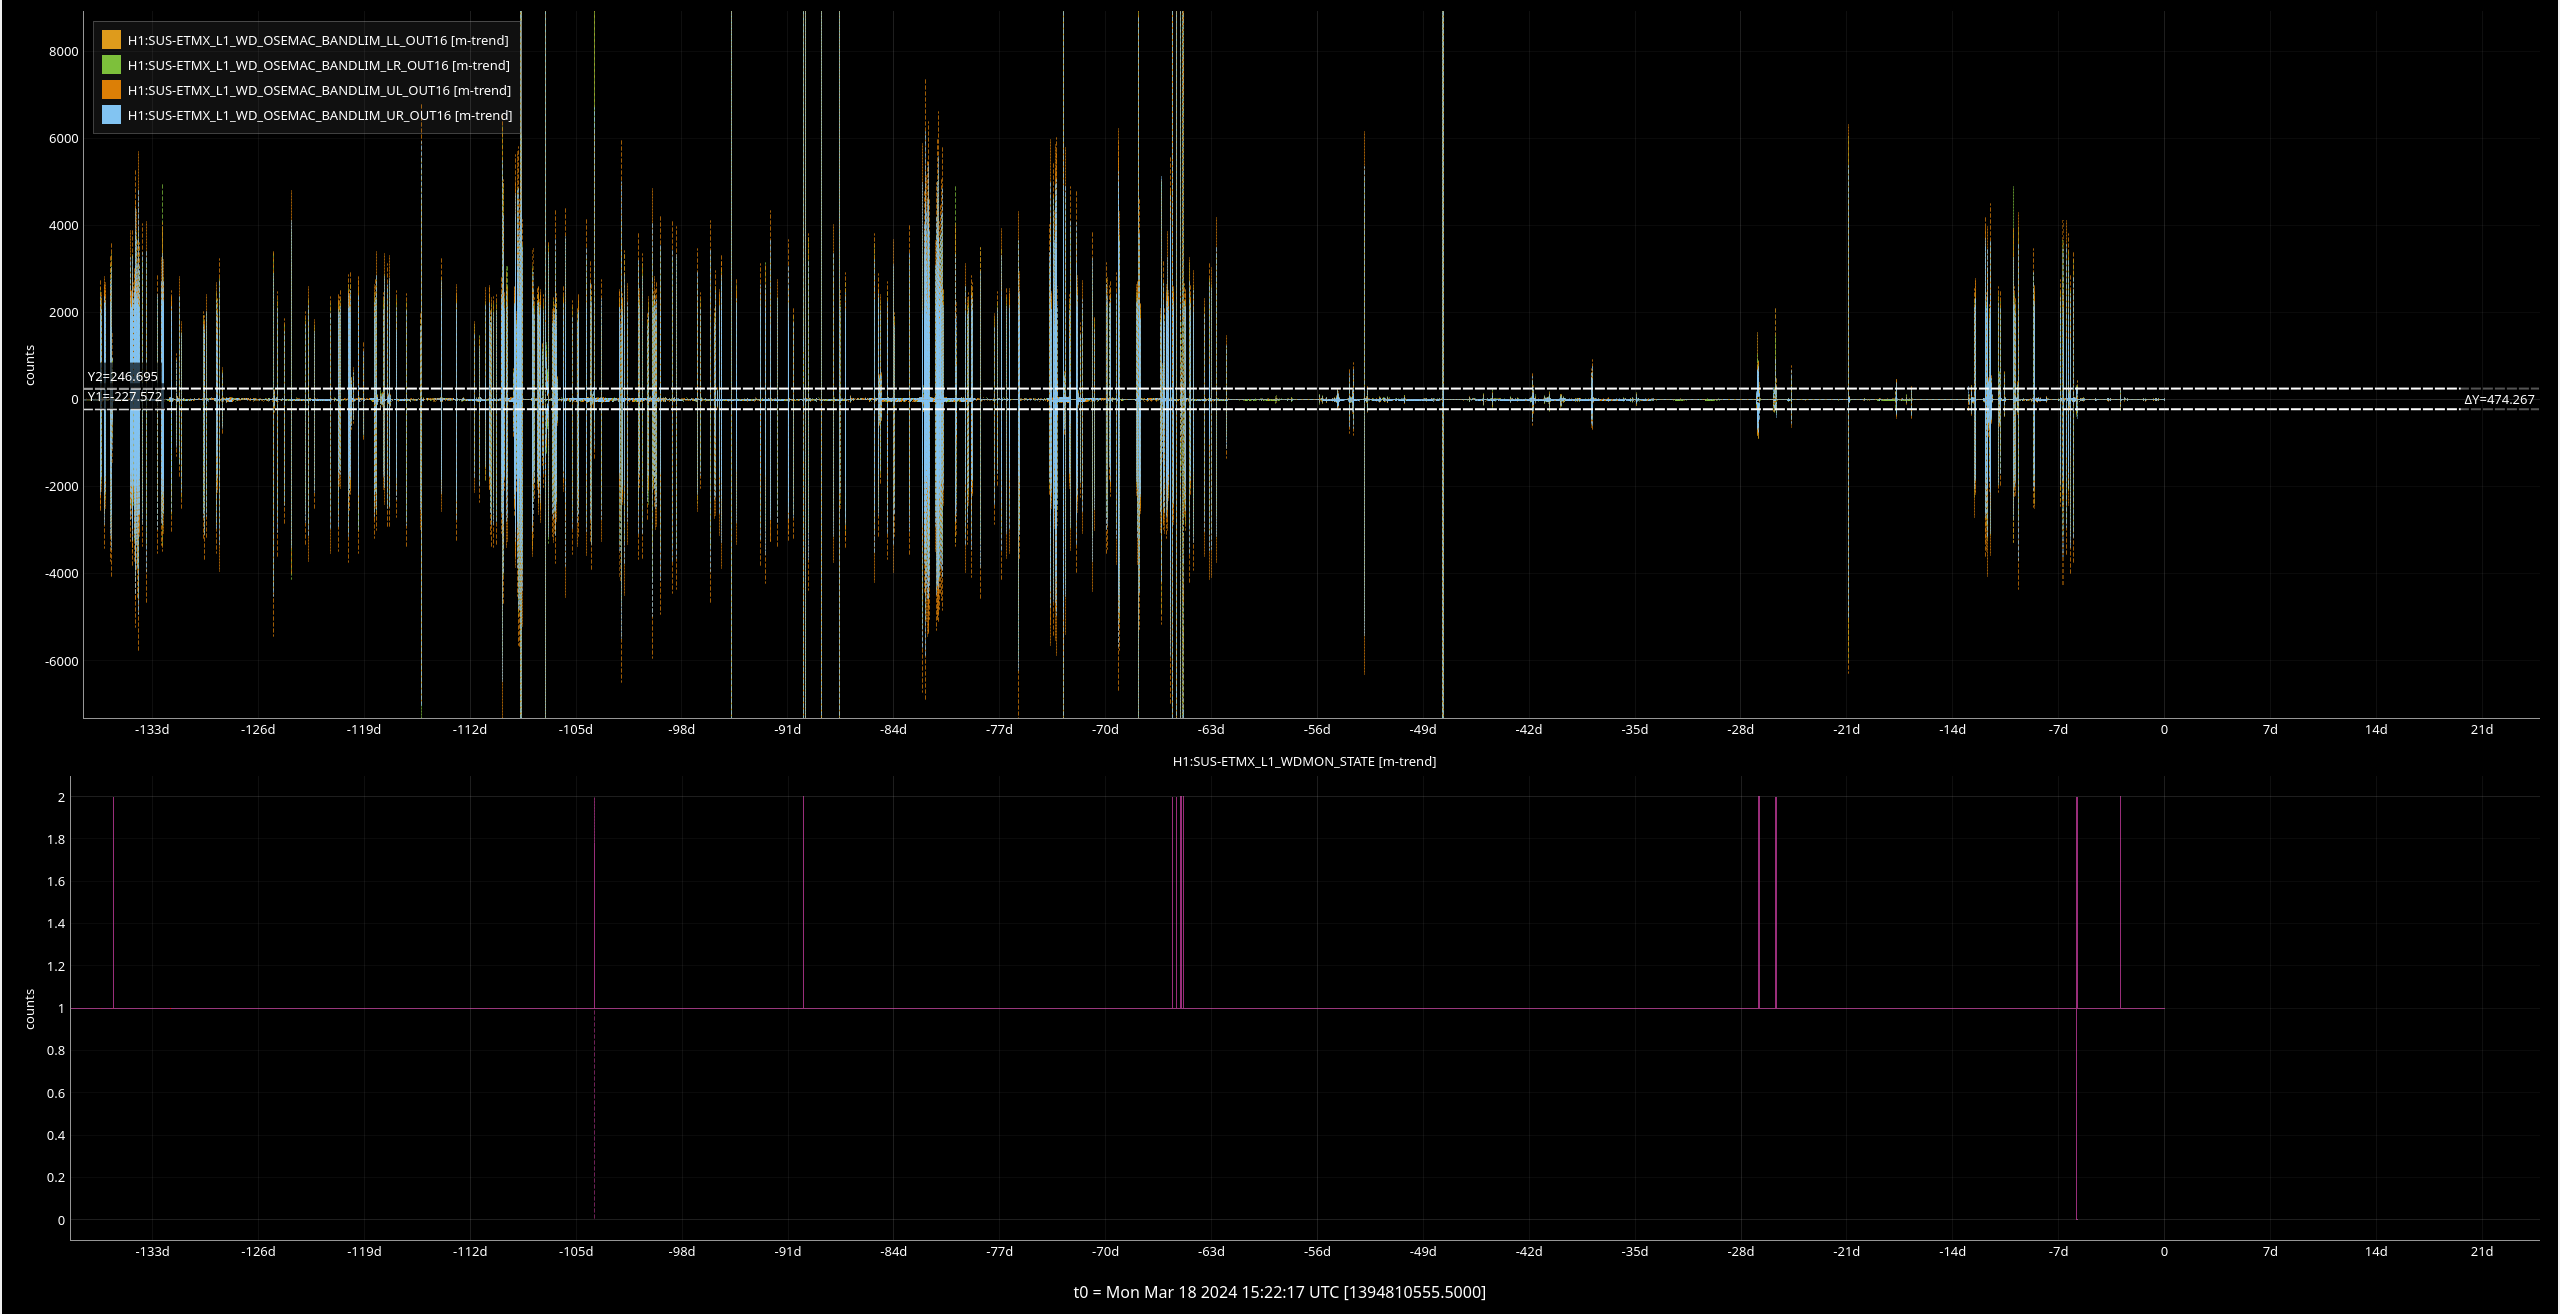
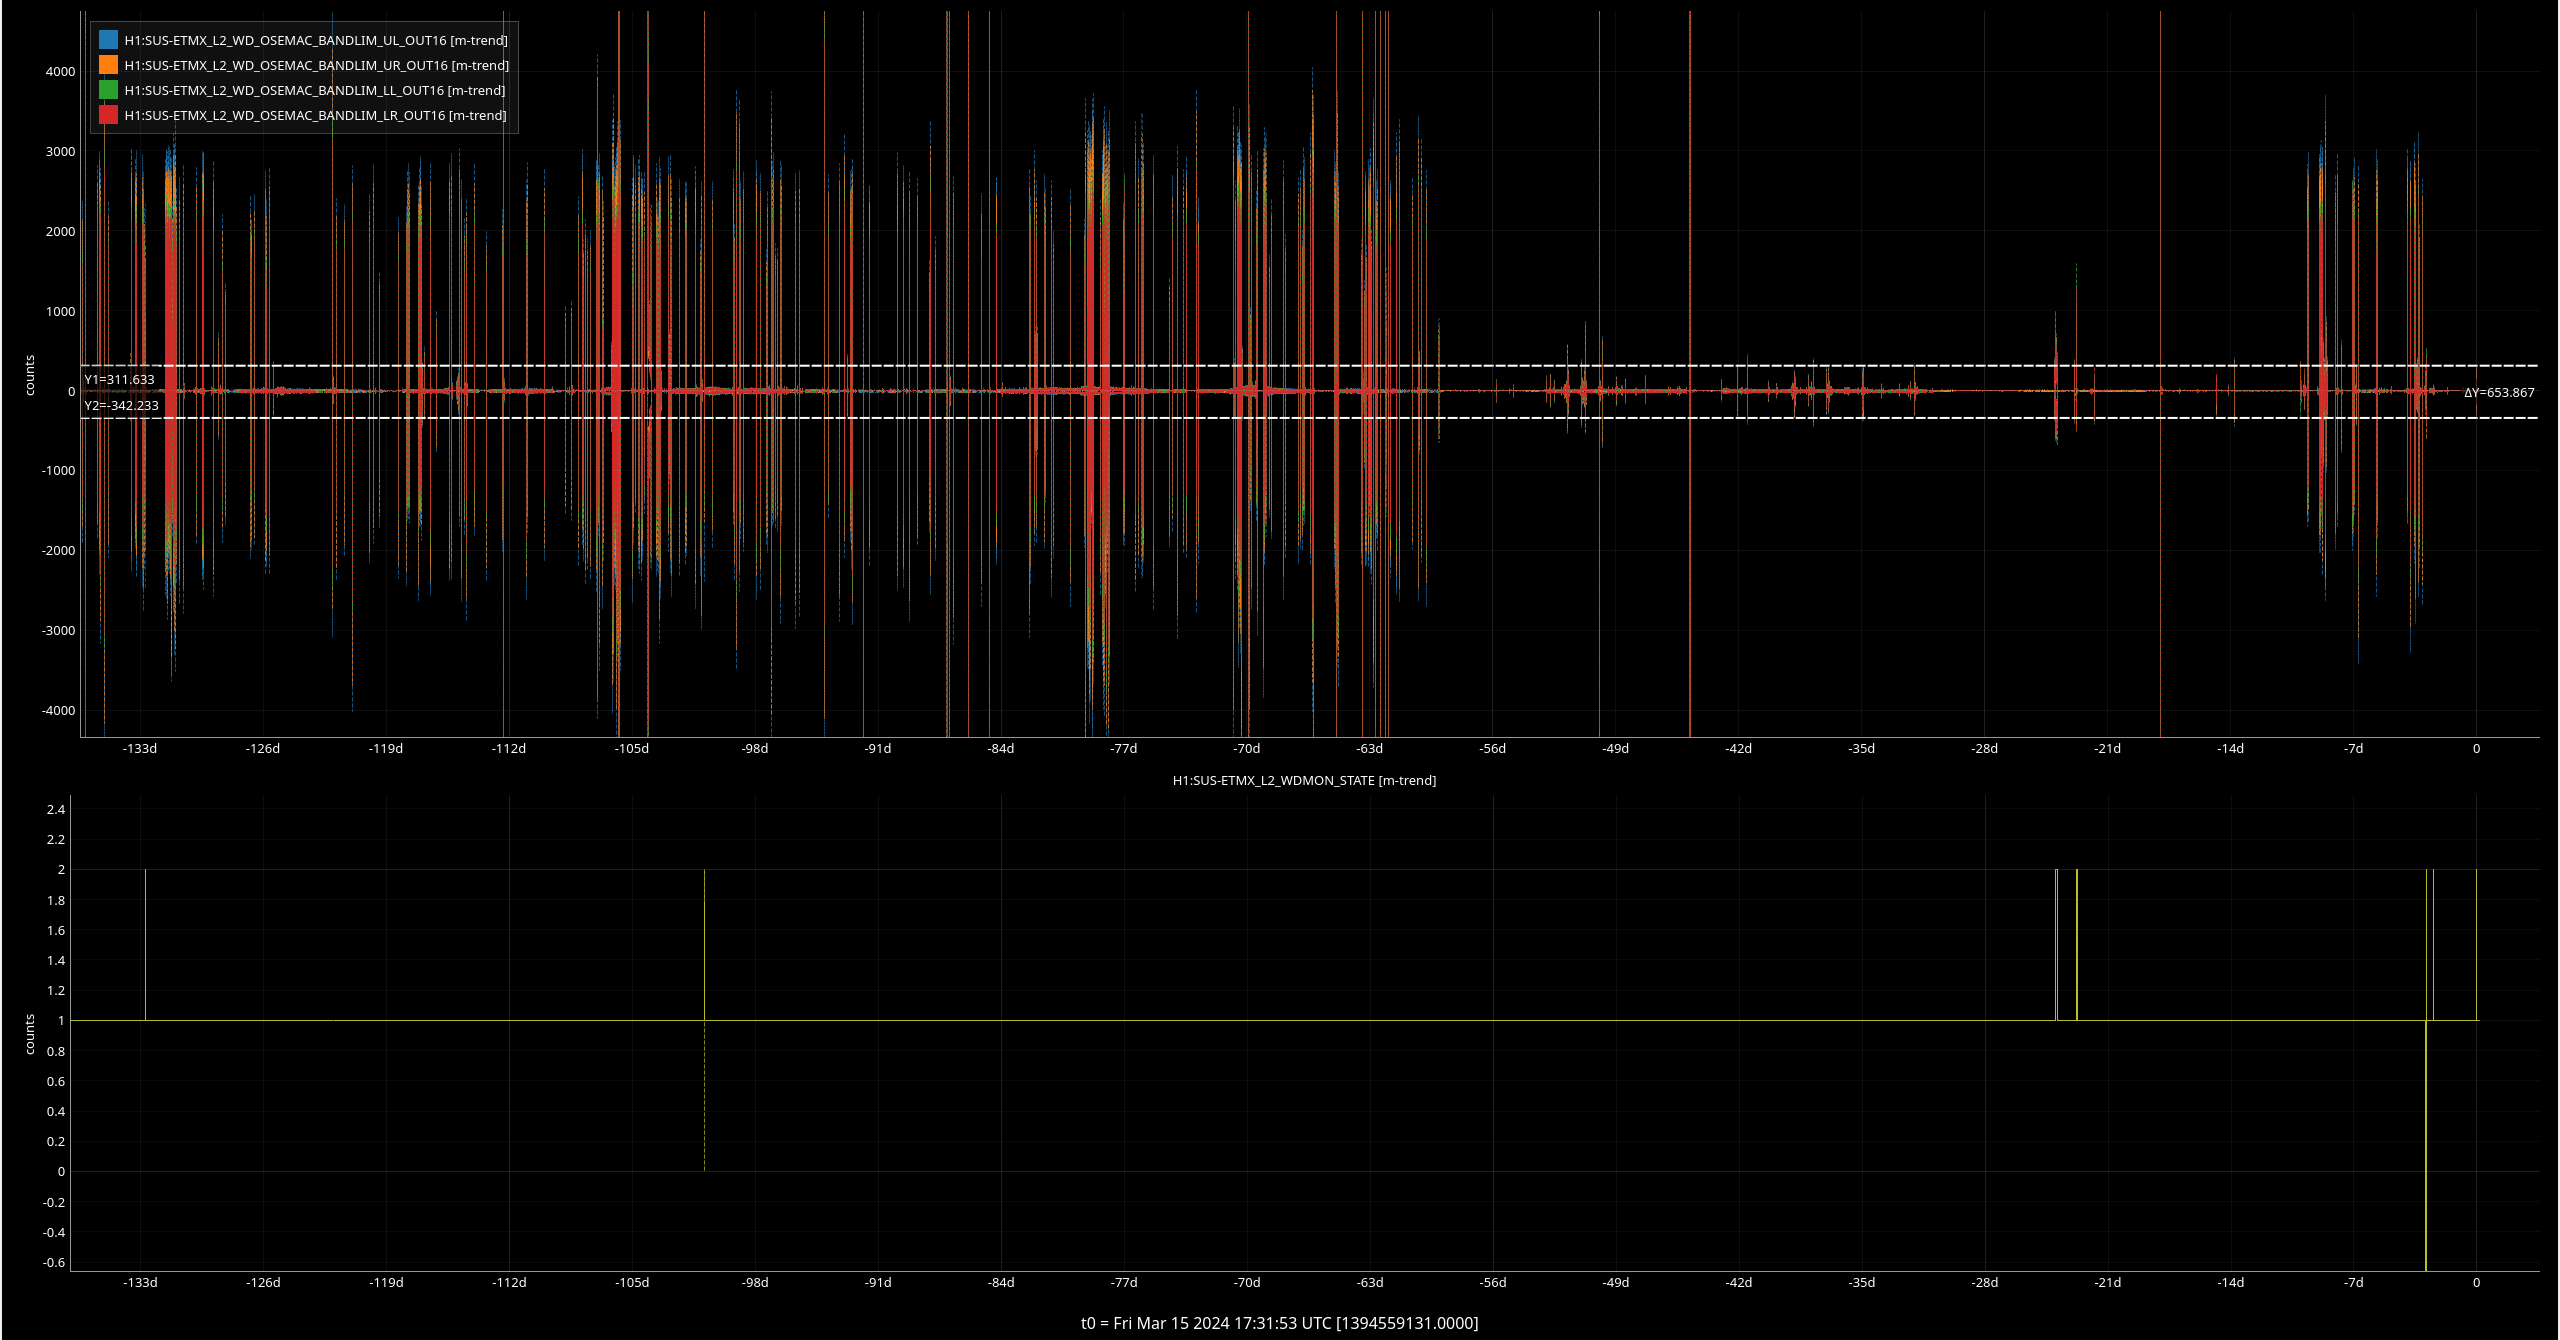
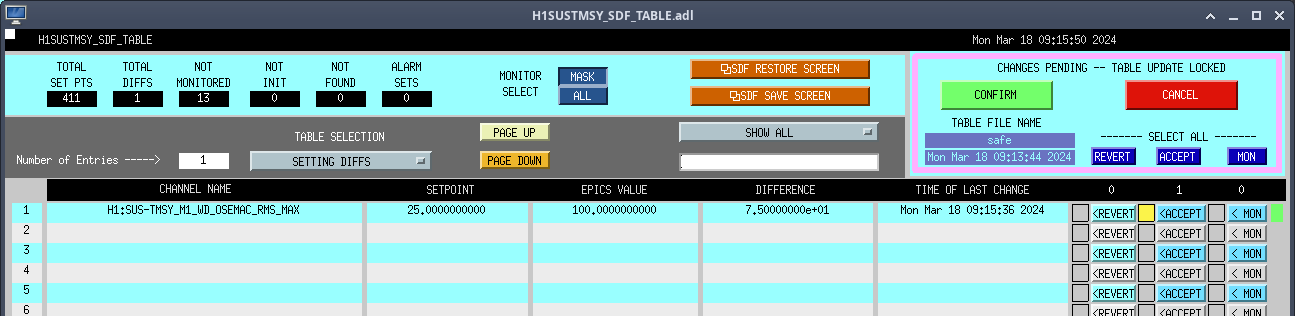
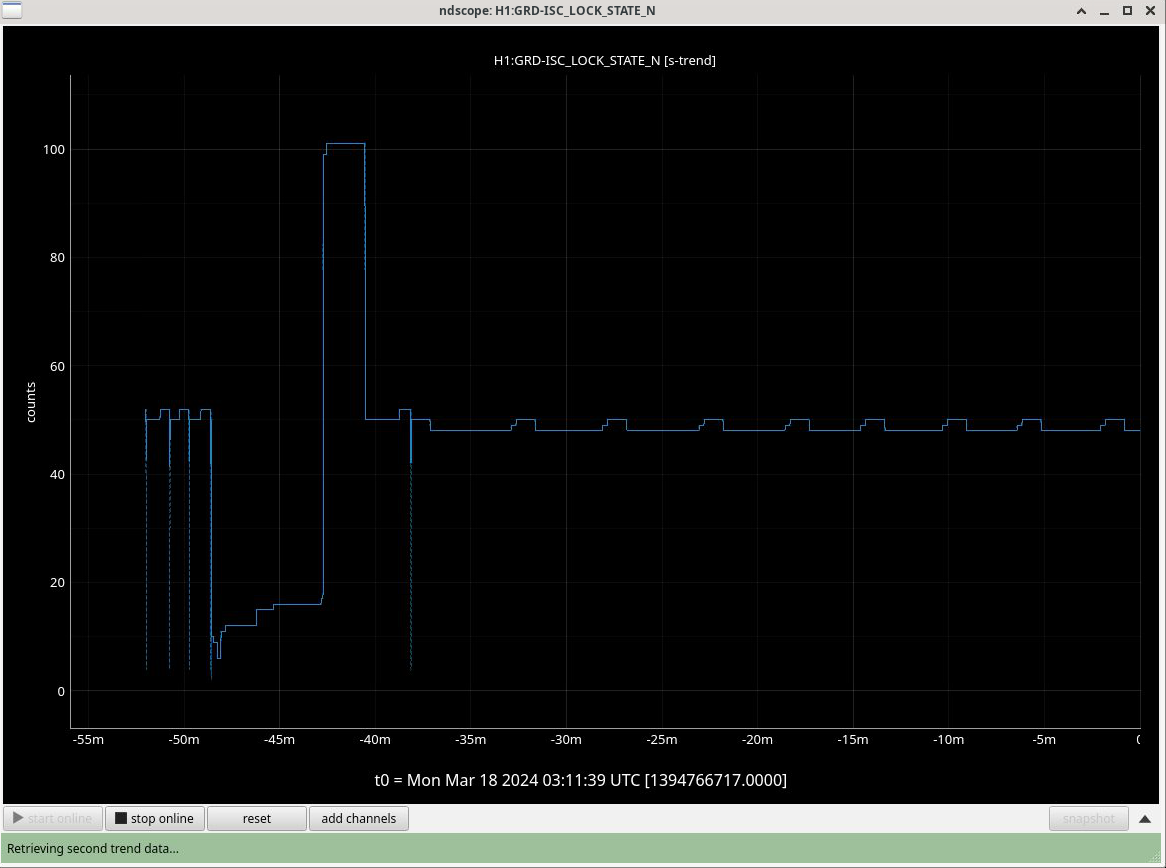
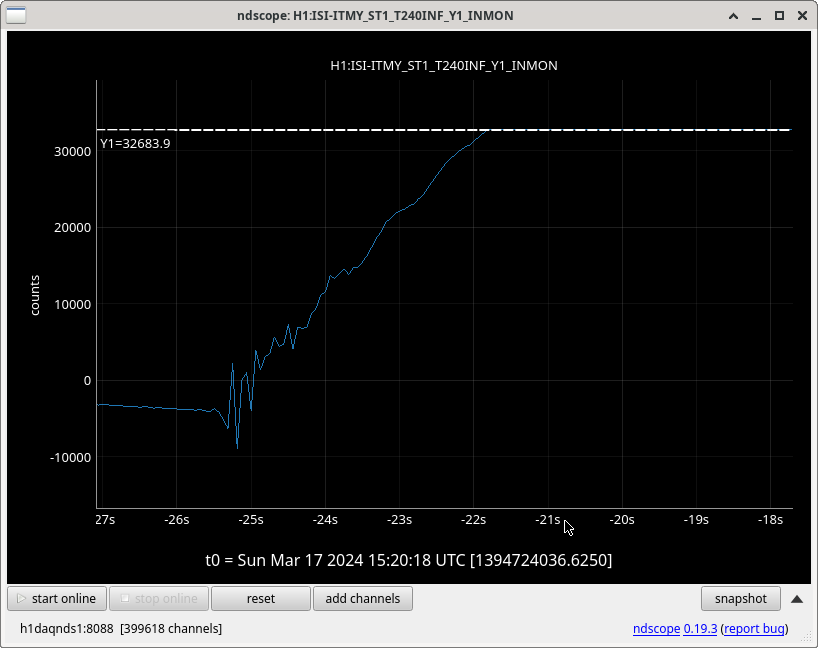
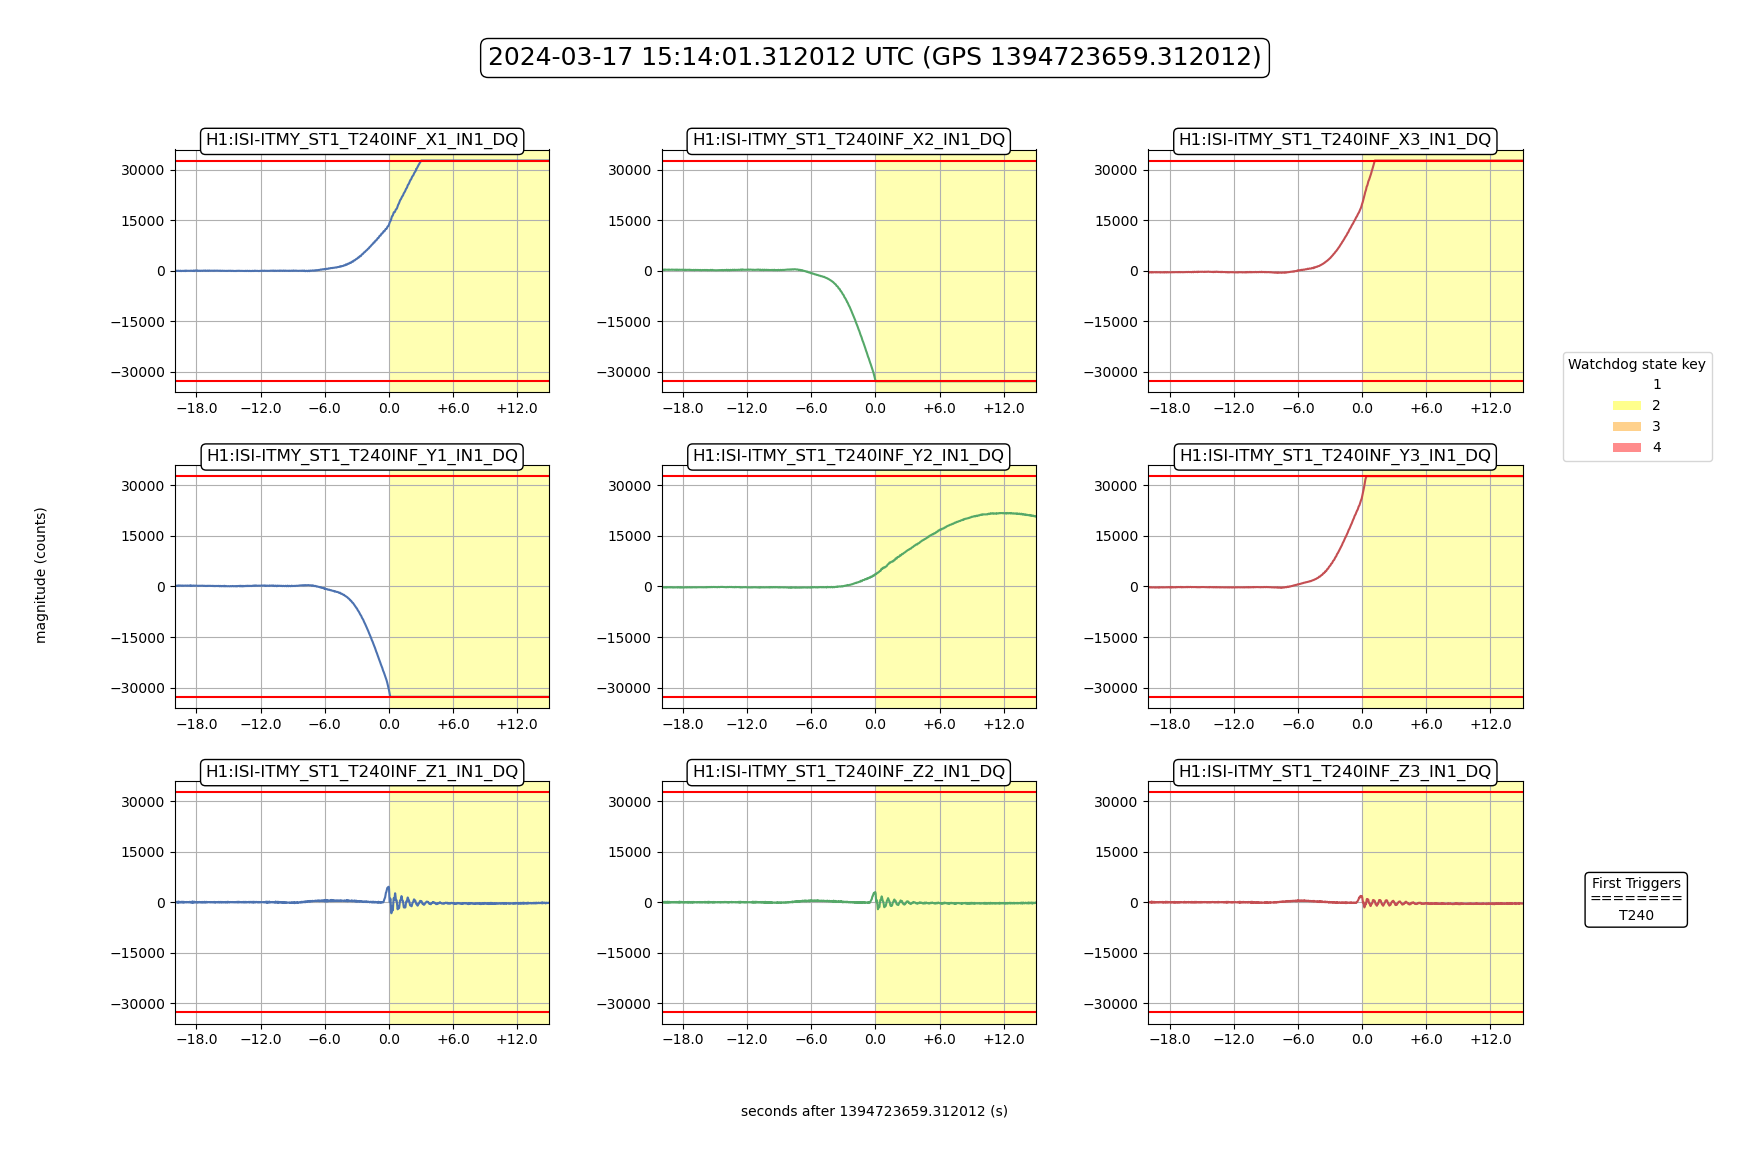
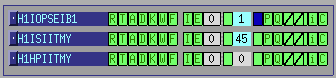
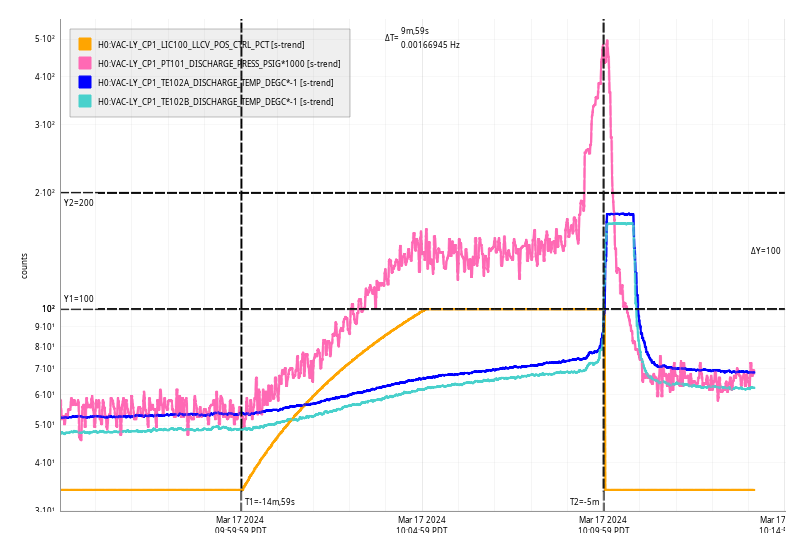
ISI IY WD tripped around 3AM - I go to untrip right now, it trips again, triggering our last lockloss. (09:48 UTC)
Looking at the values, they are all below threshold so I untrip and then <1 minute later, it trips again. I try this one more time while trending the relevant channel, T240 ISI Stage 1and the counts climb uo irrattically until it trips again (<1 min later). After ensuring, Screenshots of this behavior below.
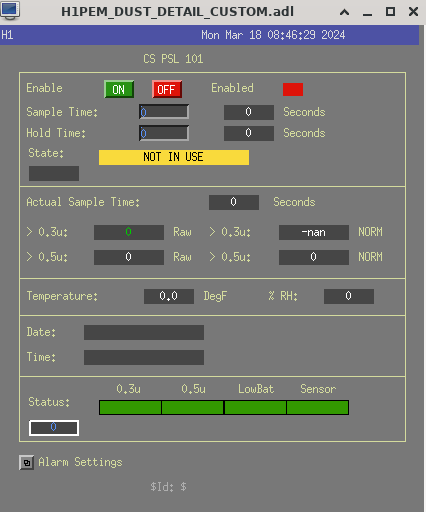
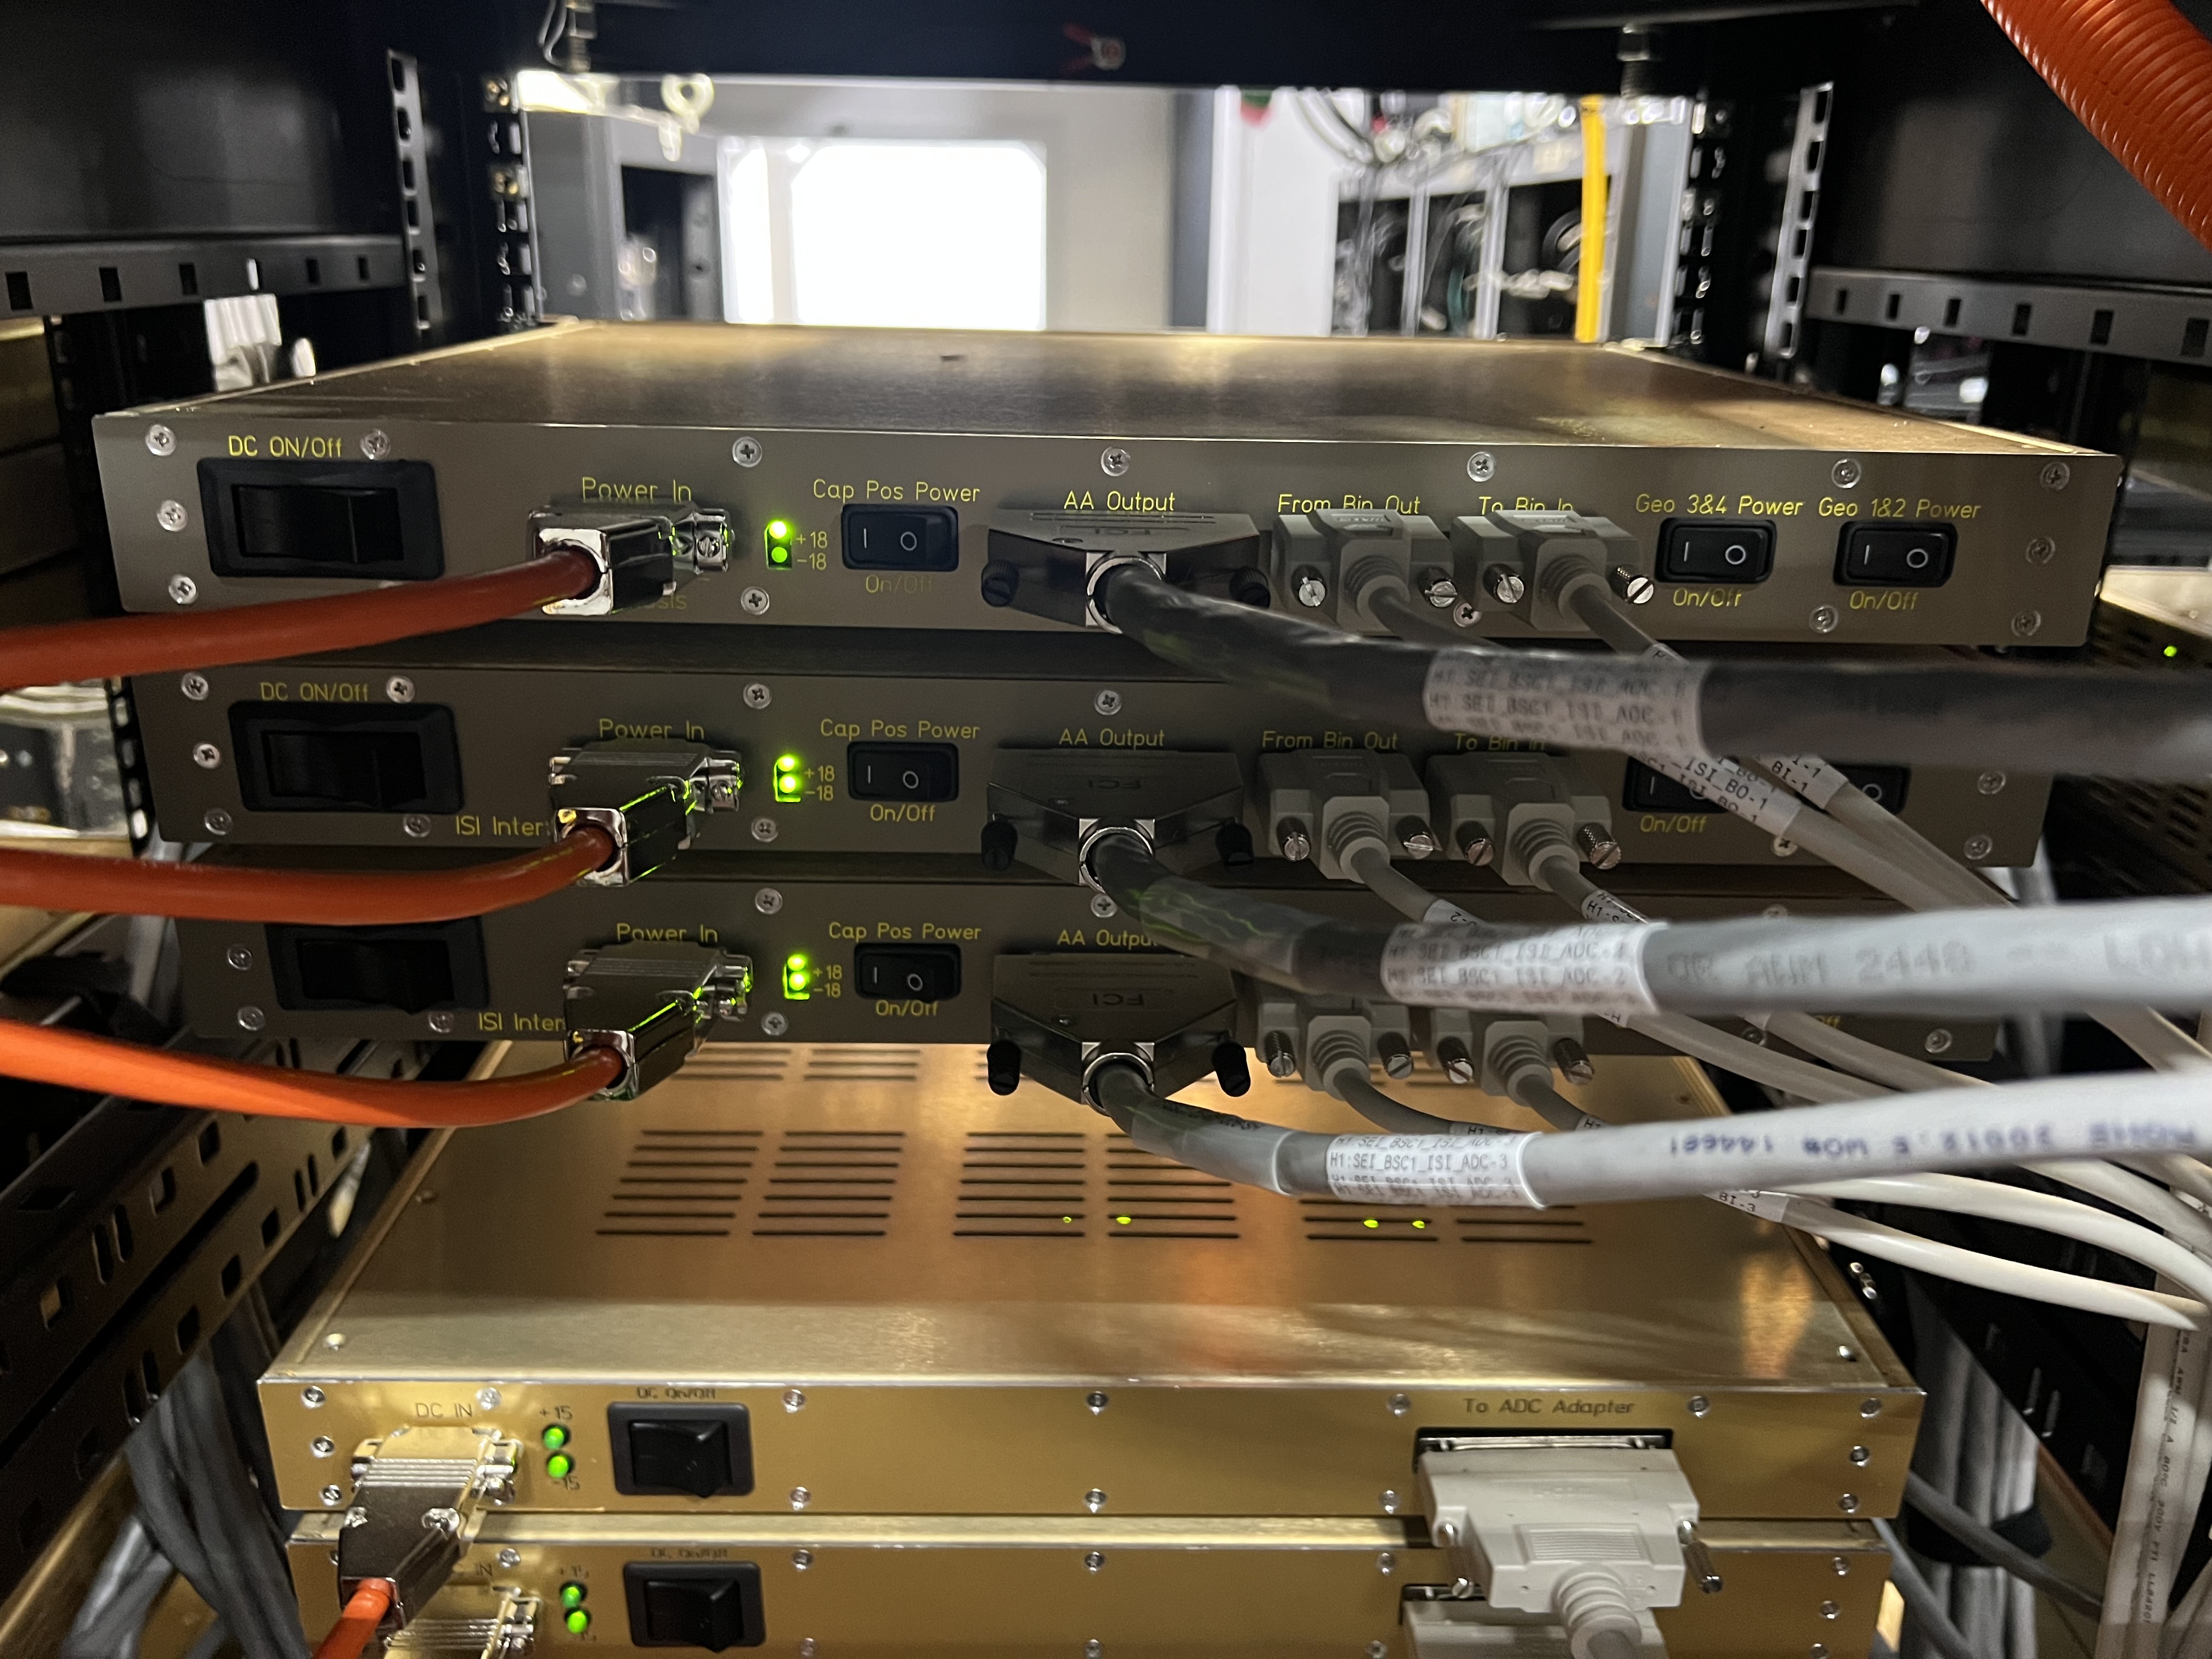
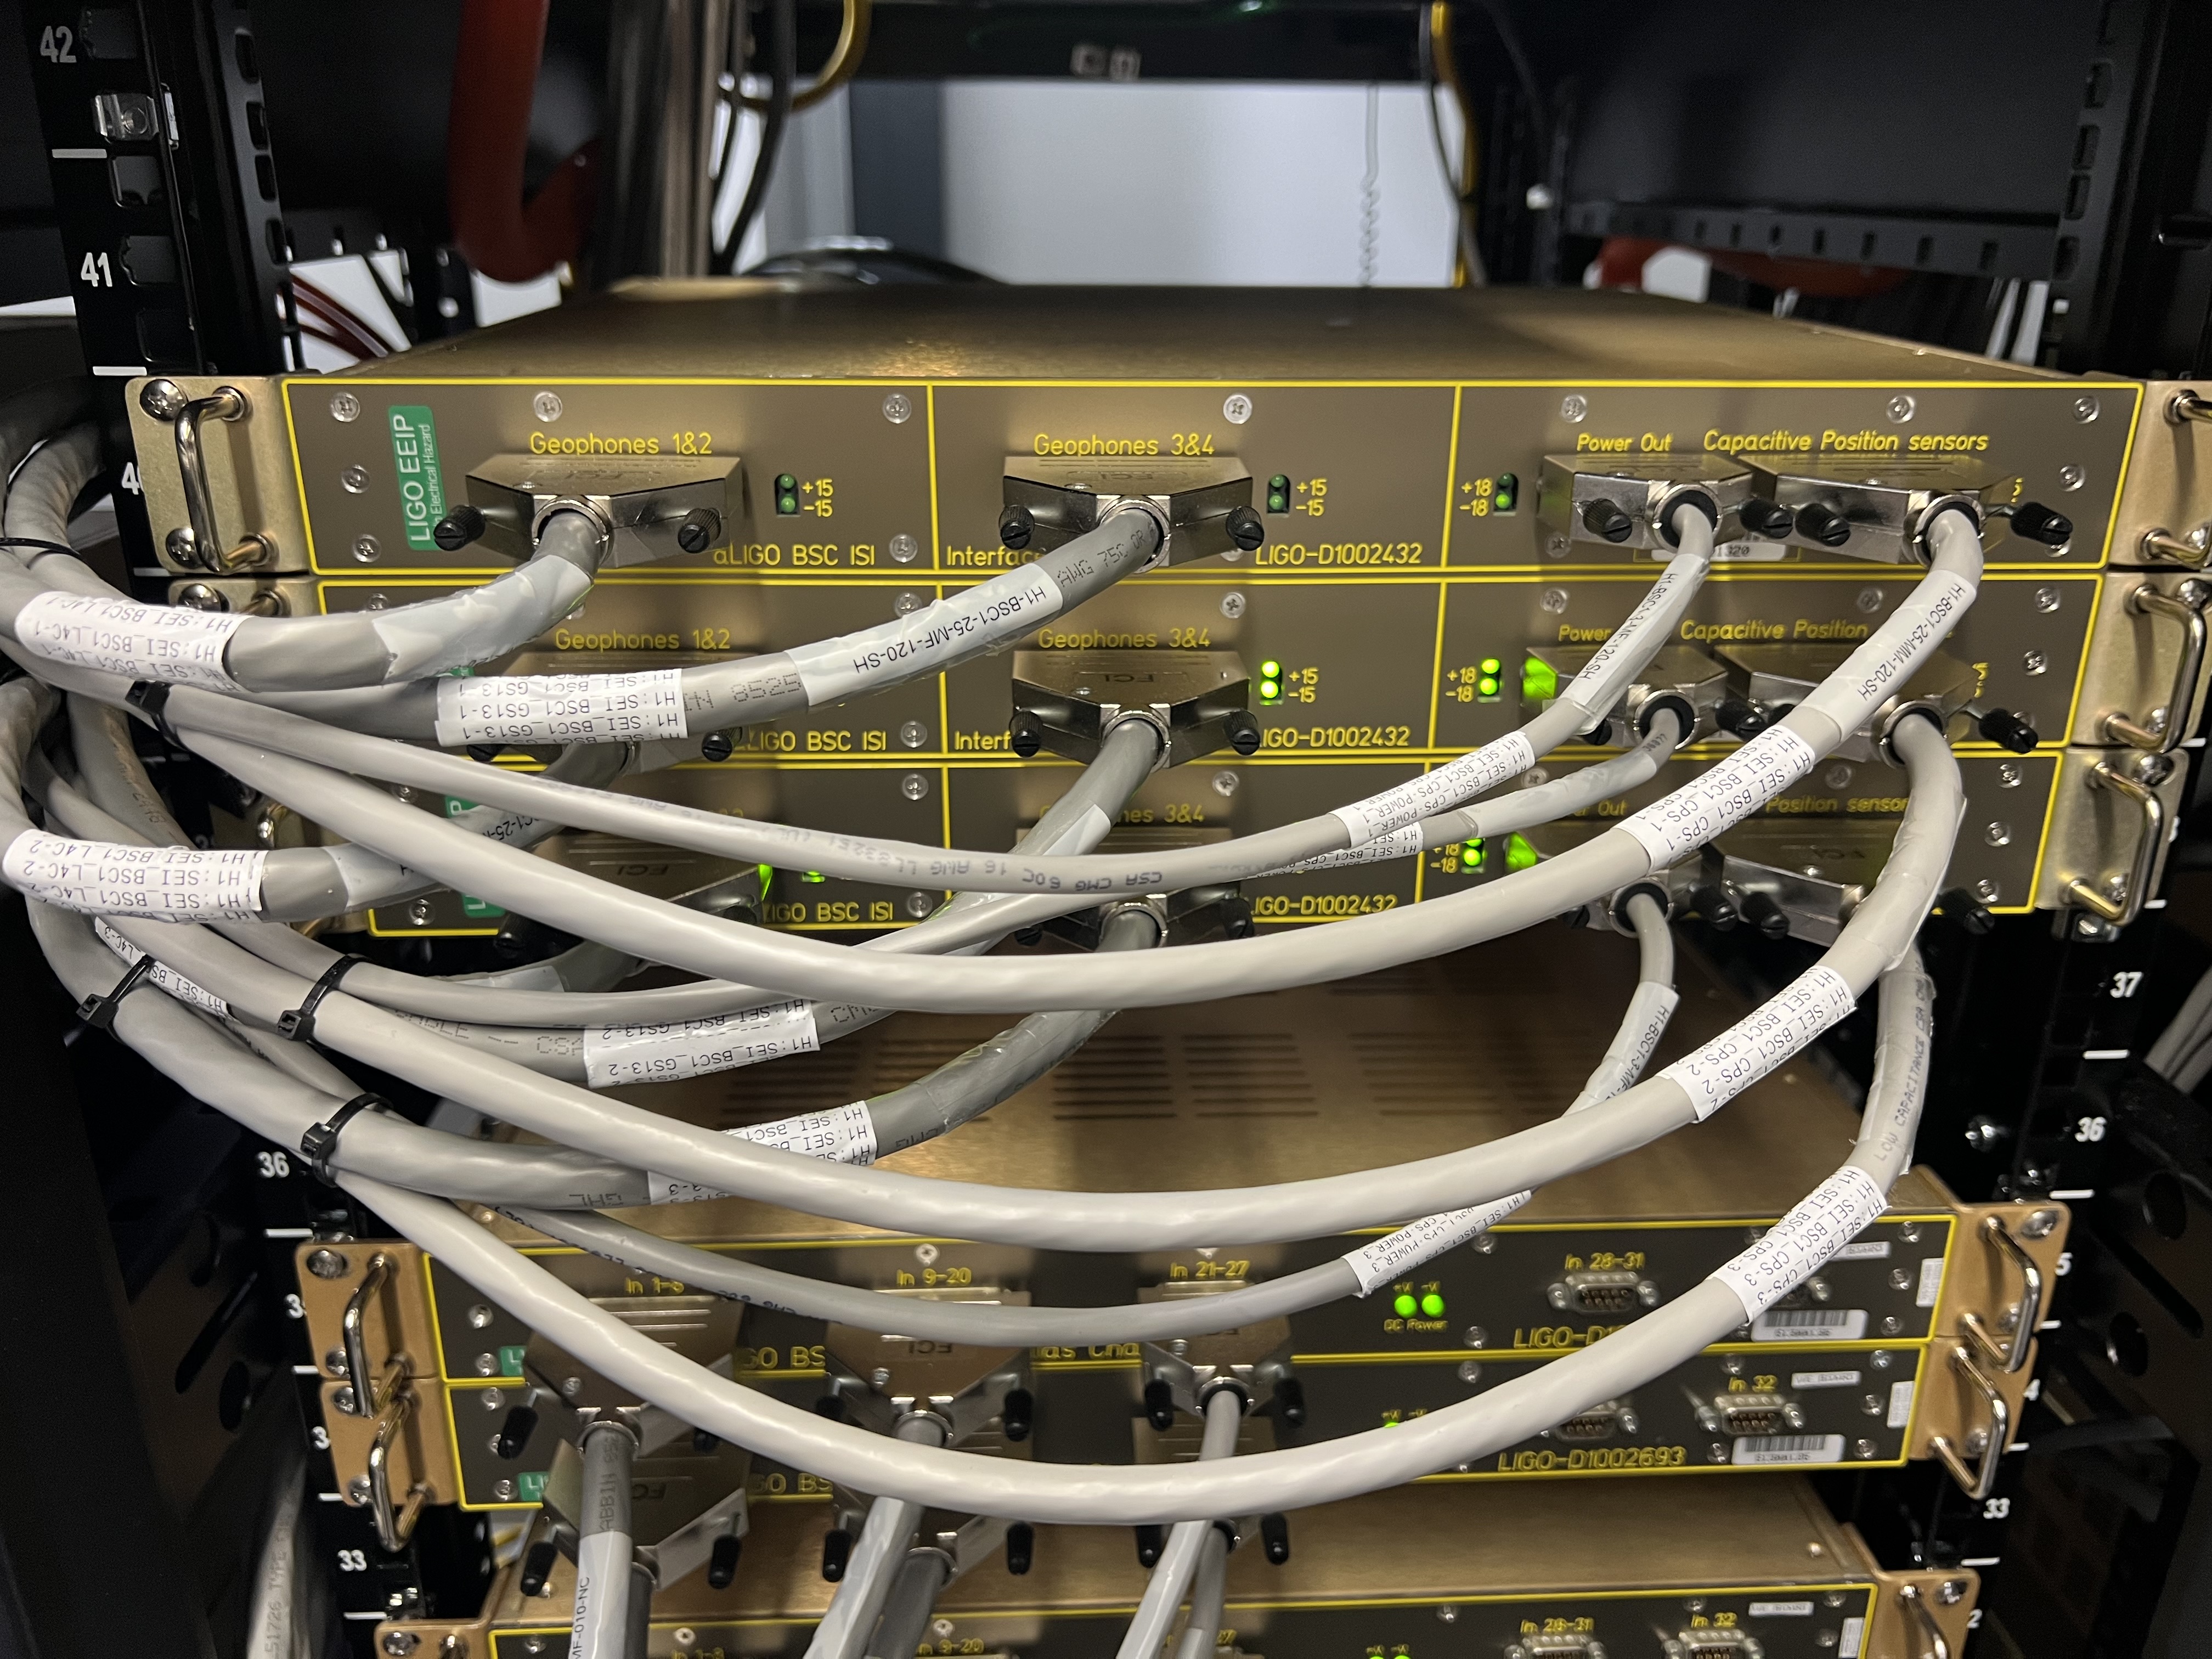
I get in contact with Jim, and he informs me that the corner 1 sensors are all dead, indicating an interface chassis issue. With instructions, I go to the CER to power cycle but it stays dead. Photos of the dead chassis below.
After getting a hold of Fernando, him and Richard were able to get a hold of Fil, who said he would come to site to do the replacement/fix (according to Richard).
Jim noticed that the Chassis came back at 10:53 but that we should stay down until Fil investigates.
At around 21:00 UTC, Fil arrived and we replaced the Chassis with a functional one. Fil stayed until ALSY locked, confirming that the issue was fixed.
21:25 UTC - Began Locking
22:23 UTC - Started Initial Alignment due to CHECK MICH FRINGES ran and failed for the 3rd time and manual touching of BS and PRM was going nowhere.
22:49 UTC - Initial Alignment Complete, locking now
22:56 UTC - DRMI Locked - requested NLN
Other:
EX Pressure EX_X5_PT526 MOD1 PRESS TORR is showing a yellow alert on the vacuum alarm handler.
LOG:
| Start Time |
System |
Name |
Location |
Lazer_Haz |
Task |
Time End |
| 21:00 |
OPS |
Ibrahim |
CER |
N |
Power cycling interface chassis |
22:00 |
| 20:51 |
PCAL |
Rick |
Optics Lab |
N |
Grabbing something to ship to LLO |
21:21 |
| 22:27 |
EE |
Fil, Ibrahim |
CER |
N |
Interface chassis replacement |
22:27 |