david.barker@LIGO.ORG - posted 10:12, Saturday 02 March 2024 (76081)
Sat CP1 Fill
Sat Mar 02 10:08:57 2024 INFO: Fill completed in 8min 54secs
Images attached to this report

Sat Mar 02 10:08:57 2024 INFO: Fill completed in 8min 54secs
The pressures:
HAM7: ~4.55E-7 Torr
HAM8: ~1.1E-6 Torr
Corner: ~1.0E-7 Torr
EX: ~1.3E-8 Torr

Today's activities:
- EX RGA was done, and it was found satisfactory
- EX large ion pump (IP12) was valved in, and the pressure immediately fell to 1.3E-8 Torr from 2.2E-8
- EX further schedule: Turbo pump valve-out: 3-4; RGA scan #2: 3-4; GV20 open: 3-4

- The HAM8 RGA bakeout was ramped up, will be on throughout the weekend
- The HAM7 RGA bakeout was also ramped up, and similarly stays on throughout the weekend - the bake will be finished on Monday morning
- Corner & Filter cavity further schedule: Turbo pumps valve-out: 3-4; RGA scan #2: 3-4; GV5 & GV7 open: 3-4; HAM7 and HAM8 valve-in: ~3-6. Note: the bottleneck is the stabilization of the large ion-pumps. If that doesn't happen until 3-4, the opening of the GVs needs to be shifted later
- GV7 all metal valve was opened, the AIP was already able to take over the pumping
Post EX Vent PCAL EndX Station Measurement
A rare Non Tuesday PCAL End station measurement was done on leap day Feb 29th 2024, the PCAL team(
Francisco L., Julian G, & Tony S.) went to EndX with Working Standard Hanford aka WSH(PS4) and took an End station measurements.
The EndX Station Measurement was carried out according to the procedure outlined in Document LIGO-T1500062-v15, Pcal End Station Power Sensor Responsivity Ratio Measurements: Procedures and Log, and was completed by 11:45 am.
Note:
After the normal measurement.
Measurement Log
First thing we did is take a picture of the beam spot before anything is touched!
We expected the beams to move due to the the vent, and it does seem like both beams have moved. It may be neccisary for us to adjuct the beams. I believe the distance between the holes on this target is 5mm center on center.
Martel:
Martel Voltage source applies voltage into the PCAL Chassis's Input 1 channel. We record the GPStimes that a -4.000V, -2.000V and a 0.000V voltage was applied to the Channel. This can be seen in Martel_Voltage_Test.png. We also did a measurement of the Martel's voltages in the PCAL lab to calculate the ADC conversion factor, which is included on the above document.
Plots while the Working Standard(PS4) is in the Transmitter Module during Inner beam being blocked, then the outer beam being block, followed by the background measurment: WS_at_TX.png.
The Inner, outer, and background measurement while WS in the Receiver Module: WS_at_RX.png.
The Inner, outer, and background measurement while RX Sphere is in the RX enclosure, which is our nominal set up without the WS in the beam path at all.: TX_RX.png.
The last picture is of the Beam spots after we had finished the measurement. I did not attempt to adjust the beam positions.
All of this data is then used to generate LHO_EndX_PD_ReportV2.pdf which is attached, and a work in progress in the form of a living document.
All of this data and Analysis has been commited to the SVN :
https://svn.ligo.caltech.edu/svn/aligocalibration/trunk/Projects/PhotonCalibrator/measurements/LHO_EndX/
PCAL Lab Responsivity Ratio Measurement:
A WSH/GSHL (PS4/PS5)FrontBack Responsivity Ratio Measurement was ran, analyzed, and pushed to the SVN.
The analysis of this measurement produces 4 PDF files which we use to vet the data for problems.
raw_voltages.pdf
avg_voltages.pdf
raw_ratios.pdf
avg_ratios.pdf
Obligitory BackFront PS4/PS5 Responsivity Ratio:
PCAL Lab Responsivity Ratio Measurement:
A WSH/GSHL (PS4/PS5)BF Responsivity Ratio measurement was ran, analyzed, and pushed to the SVN.
The analysis of this measurement produces 4 PDF files which we use to vet the data for problems.
raw_voltages2.pdf
avg_voltages2.pdf
raw_ratios2.pdf
avg_ratios2.pdf
This adventure has been brought to you by Francisco, Julian, & Tony Sanchez.


TITLE: 03/01 Day Shift: 16:00-00:00 UTC (08:00-16:00 PST), all times posted in UTC
STATE of H1: Planned Engineering
INCOMING OPERATOR: None
SHIFT SUMMARY:
OMC measurements ongoing. RGA work throughout site today. Gate valves set to open Monday morning.
LOG:
| Start Time | System | Name | Location | Lazer_Haz | Task | Time End |
|---|---|---|---|---|---|---|
| 23:29 | SAFETY | LASER SAFE | LVEA | N | The LVEA is LASER SAFE | 03:14 |
| 16:05 | FAC | Tyler | MY | N | Fire antenna upgrade | 17:34 |
| 16:14 | FAC | Karen/Kim | LVEA | N | Tech clean | 16:50 |
| 16:46 | SEI | Jim | Remote | N | ISI HAM 8 measurements | ?? |
| 16:56 | TCS | Camilla | LVEA | N | Look for parts | 17:22 |
| 17:02 | VAC | Jordan | HAM 7 | N | Increase HAM 7 RGA | 18:28 |
| 17:03 | FAC | Randy | W Bay | N | Craning | 17:41 |
| 17:42 | PCAL | Tony/Julian | PCAL Lab | Y | Measurements | 17:59 |
| 17:45 | PEM | Robert/Michael | LVEA | N | PEM checks | ?? |
| 18:47 | VAC | Gerardo/Jordan | EX | N | RGA scans | 20:34 |
| 18:54 | FAC | Randy | EY/EX | N | Boom lift for cameras | 20:54 |
| 19:00 | PCAL | Tony | PCAL Lab | Y (LOCAL) | Measurement | 20:46 |
| 19:01 | HWS | Camilla/Georgia/Craig/Swadha/Julian | Optics Lab | Y (LOCAL) | Measurement | 20:28 |
| 19:03 | SQZ | Nutsinee/Dhruva/Naoki | SQZT0 | Y (LOCAL) | SQZ work | 20:24 |
| 19:11 | PEM | Robert/Michael | MY/EY | N | PEM measurements | ?? |
| 19:33 | ISC | Sheila/Elenna/Jennie | CR | N | OMC alignment | ?? |
| 19:35 | OpLev | Fernando | LVEA/EX/EY | N | OpLev chassis work | 22:49 |
| 21:05 | SQZ | Dhruva/Camilla | SQZ tables | N | Clean up | 21:19 |
| 21:13 | VAC | Jordan | HAM 7 | N | Turn up RGA | 21:21 |
| 21:20 | SUS | Rahul | CR | N | HAM 7 TF health checks | 21:50 |
| 21:30 | FAC | Mitch | LVEA | N | Grab serial numbers | 21:38 |
| 21:58 | SQZ | Nutsinee | SQZT0 | Y (LOCAL) | SQZ work | 22:15 |
| 22:08 | VAC | Jordan/Gerardo | EX | N | Turn on ion pump | 22:59 |
| 22:11 | SQZ | Camilla/Julian/Dhruva | HAM Shack | N | Move sqz table | 22:59 |
| 23:00 | VAC | VAC team | LVEA - GV7 | N | Annulus ion pump work | 23:43 |
| 23:06 | SQZ | Dhruva/Nutsinee | CER | N | Cabling | 23:52 |
| 23:51 | PCAL | Tony | PCAL Lab | Y (LOCAL) | LLO sphere measurement | ?? |
I made a LOCK_PMC state in SQZ_MANAGER guardian. The LOCK_PMC state is between LOCK_TTFSS and LOCK_SHG states. The LOCK_PMC state is copied from LOCK_SHG state, but I commented out the PZT checker because the PMC_PZT_OK function is not defined now.
Camilla, Nutsinee
SQZ_MANAGER now takes charge of PMC Guardian. For now we commented out FC related activities in LOCK_OPO_AND_FC state of the SQZ_MANAGER and LOCKING_HD state in SQZ_LO_LR. Look for "NK March 6" for any changes made today in SQZ_MANAGER and SQZ_LO_LR Guardian. These should be reverted when we have the filter cavity back. For now we can lock PMC all the way to LO with SQZ_MANAGER and will automatically relock themselves when IFO kills the PSL.
We have filter cavity. Changes have been reverted.
Closes WP11693 Dhruva, Julian, Camilla,
After 75894 and HAM8 vent, today we rolled SQZT8 enclosure back to its marked position next to HAM8, replaced the bellows and removed guillotine from the viewport. Fil will recable the enclosure early next week.


[Sheila, Jennie, Elenna]
Here are some notes about how we by-hand improved the OMC alignment
As a final check I turned on both OMC ASC and AS WFS centering and the loops converged appropriately.


Elenna and I tried to take a single bounce OMC scan after this. We closed AS centering loops (DC3 and DC4) by turning on the inputs, closed the OMC ASC by setting the master gain up one click (I think it was at 0.25?). We turned off the offset on PZT2, and ran an old scan template. Elenna realised that we need to reset the dark offset for the DCPDs, so that's something we'll need to do next time.
We opened the OMC ASC but I think we left the centering loops closed sorry!
Jeff K, Oli P
In alog 75947 part3, we had modeled the BBSS using what we thought were the correct Final Design parameters and then adjusted the d1 and d4 values* in order to get our model to match how the actual BBSS was responding. However, the parameter set we were using had the boolean variable stage2** set to 0, when the parameter set from the BBSS Final Design document(T2000503) had stage2 = 1. This was a change that I had made due to a misinterpretation.
Because of this mistake, the parameters that we had thought were correct were actually wrong, and so when we adjusted d1 and d4, we were unknowingly fitting to an incorrect model. These results were shared with the SUS group, where it was mentioned that stage2 was supposed to be 1.
We've now rerun the model with the actually correct Final Design(FD) parameters, and have adjusted d1 and d4 to fit our data. This adjustment has d1 = FD - 2.5mm and d4 = FD - 1.0mm, which are smaller changes than when we were using the wrong parameter set (d1 and d4 were increased by 5.0mm and 1.5mm respectively). Attached are our results in pdf form, along with pngs of the transfer functions for Pitch and Longitude, since those are the two most affected by the changes to d1 and d4. This adjusted parameter set can currently be found at $sussvn/Common/MatlabTools/TripleModel_Production/bbssopt_pendstage2on_d1minus2p5mm_d4minus1p0mm.m, but eventually will replace the bbssopt.m that is in that same directory.
Figure legend:
- Black - Model using the wrong Final Design parameters
- Dark blue - Model using the wrong Final Design parameters plus adjustments for d1 & d4 to match data
- Dark green - Model using the correct Final Design parameters
- Light Green - Model using the correct Final Design parameters plus adjustments for d1 & d4 to match data
- Gray - BBSS M1 Transfer Function data
Appendix:
* d{top, 0, 1, 2, 3, 4} is the vertical distance between the break off point of a wire and the CoM for each mass. These values are important for calculating the locations of fundamental modes for each DOF. There are two different types of d's, effective d's and physical d's.
- The physical d's are the vertical distance between the break-off point of the wire and the CoM of the mass. These values assume an infinitely flexible wire, which isn't the case in real life.
- The effective d's are the vertical distance between where the wire leaves the clamp and the CoM. Since the wires aren't actually infinitely flexible, they'll start bending before they reach the break off point, meaning we'll have a larger effective d as compared to the physical d.
These two relate to each other as physical d = effective d - effective flexure point, with the effective flexture point being the extra distance between the clamps and the breakoff point.
In the building of the suspension model, both types are used at different times, so there is a need to be able to swap between them. That's what the stage2** variable is used for.
** stage2 is a boolean variable that determines whether the effective(stage2 = 0) or physical(stage2 = 1) d's are used.
- If stage2 = 0, the d values are used as effective values, and there are no corrections made to account for the flex of the wires.
- If stage2 = 1, the d values are taken to be the physical values, and so an effective flexture point is calculated and added to account for the flexing of the wires.
Since we entered in the physical d's, me changing stage2 to 0 meant that the model wasn't adding in the effective flexture point distances, changing our results.


Verification that the d4 value is correct: 82138
Fri Mar 01 10:08:34 2024 INFO: Fill completed in 8min 30secs
Gerardo confirmed a good fill curbside.

Late entry.

The pressures as of today (March 1st):
HAM7: ~4.7E-7 Torr
HAM8: ~1.3E-6 Torr
Corner: ~1.1E-7 Torr
EX: ~2.2E-8 Torr

Activities on 2-29:
- At the corner, IP1, IP2, IP3, IP4, IP14 ion pumps were valved in
- The controller of IP1 was needed to be replaced, as the current was very unstable. After switching it with the former H2 IP5's controller, it went back to normal
- A safety incident happened with the HAM7 RGA pumpdown: a castor wheel of a Pfeiffer cart fell off, and the cart fell over. HAM7 RGA needs at least a weekend-long pumpdown and bakeout; no further consequences
- Corner (and HAM7) further schedule: Turbo pumps valve-out: 3-4; RGA scan #2: 3-4; GV5 & GV7 open: 3-4; HAM7 and HAM8 valve-in: ~3-6
- EX further schedule: RGA scan #1: 3-1; Ion pump valve-in: 3-1; Turbo pump valve-out: 3-4; RGA scan #2: 3-4; GV20 open: 3-4
- HAM8 was leak tested; all the joints are tight, see in more detail: https://alog.ligo-wa.caltech.edu/aLOG/index.php?callRep=76063
J. Kissel
IIET Ticket 8193

A decade ago, Rana put in the above IIET ticket calling out that we made the QUAD's custom L3 LOCK bank before the RCG was able to ramp the offset, and/or before the ramping of the offset got highlighted yellow during ramping like the gain typically does. I've fixed this issue this morning by grabbing the latest auto-generated versions of these filter banks from

    /opt/rtcds/lho/h1/medm/h1susetmx/
        H1SUSETMX_ETMX_L3_LOCK_BIAS.adl
        H1SUSETMX_ETMX_L3_LOCK_L.adl
        H1SUSETMX_ETMX_L3_LOCK_P.adl
        H1SUSETMX_ETMX_L3_LOCK_Y.adl

and hand copied the filter medm guts over to the

    /opt/rtcds/userapps/release/sus/common/medm/quad/
       SUS_CUST_QUAD_L3_LOCK.adl
then search and replaced "H1:SUS-ETMX" with the macros "$(IFO):SUS-$(OPTIC)" in order to make it sufficiently generic for all QUADs and both sites to use. Also, while there, I took the extra effort to remove all the old "Online Detchar Channels," or ODC channels that were removed and/or deprecated after O2. The updated screen is committed to the userapps svn as of rev 27162.

Attached is the screenshot showing the BIAS offset being ramped as a test (this was the original motivation for the ticket).

This closes the ticket!

TITLE: 03/01 Day Shift: 16:00-00:00 UTC (08:00-16:00 PST), all times posted in UTC
STATE of H1: Planned Engineering
OUTGOING OPERATOR: None
CURRENT ENVIRONMENT:
SEI_ENV state: MAINTENANCE
Wind: 29mph Gusts, 19mph 5min avg
Primary useism: 0.07 μm/s
Secondary useism: 0.52 μm/s
QUICK SUMMARY:
More PEM work slated today along with more potential OMC and SQZ work for early commissioning
Both access ports on -Y door for HAM8 were leak tested. The helium background registered at the leak detector was of 4.6x10^-10 Torr-l/s before starting the test. Both joints were sprayed with helium and no signal above the background was registered by the leak detector. Final background registered by the leak detector once the leak test was done was of 4.0x10^-10 Torr-l/s.

Jennie W, Sheila, Jenne
Sheila and I moved SR2 yaw to centre the beam on ASC_AS_C QPD.
Then we changed OM1 pitch and yaw to centre on WFS ASC_AS_B.
Then we changed OM2 pitch and yaw to centre on WFS ASC_AS_A.
After this we were able to turn on the DC 3 & 4 centering loops.
The first image shows the alignment at this point.
Then Jenne tagged in.
We aligned OM3 to bring the beam back onto centre on QPD A and B.
At this point we tried to turn on the OMC ASC loops but the OMC suspension saturated.
Accidentally clicked 'Offload OM Alignment' button on centering screen but this did not seem to do anything.
Changed POS X and ANG Y gain signs in servo.
The ASC loops still go running off (ie. do not converge).
We turned back on DC centering 3 loops 3 and 4 to stay centred on the AS_{A,B} but these do not do much to the spots.
Turned on OMC ASC loops and they did not converge and the OMC suspension saturated again.
We think this sign convention is definitely wrong so we flipped POS X and ANG Y signs back.
For reference they now have positive gain in POS X loop and negative gain in ANG Y loop.
Turning on the ASC still saturates the OMC SUS.
We turned on the SR2C P and Y loops to keep the beam centred on AS_C QPD.
The nest thing we tried was aligning SR3 to improve the alignment on A and B QPDs and hopefully stop the OMC suspension saturating (we thought maybe this might improve pointing into HAM6).
I stepped the SR3 pitch up in steps of 6 microradians and the loops move to correct the alignment with SR2, OM1 and OM2 so this corre4cts the QPD alignment. It was hard to see any change for the better on QPD A and B.
We also tried the same steps for PR2 but down in yaw and this also did not improve the alignment on QPD A and B overall.
I turned off the DC centering and SRC2 loops and we cleared the history for SRC2 which may have changed the alignment somewhat.
Here is the alignment changes we made in the second image.
I also walked back the alignment changes on SR3 and PR2 relative to this image.
Leaving the OMC ASC and OMC length locking off also.
The thirs image shows that Jenne turned the gain of SRC2 up from 10 to 40 so the loop would converge faster.


TJ, Camilla. Aim to check CO2Y laser is at it;s best temperature after recent 76007 power degradation, and we never got the expected ~50W from this laser after refurb.
I temporarily commented out the temperature checkers in TCS_CO2.py and reloaded for ITMY.
Made a script /tcs/common/scripts/power_adj_scripts/co2_temp_stepper.py to: take the TCS_ITMY_CO2 guardian DOWN, step the chiller setpoint (H1:TCS-ITMY_CO2_CHILLER_SET_POINT_OFFSET), wait 50 minutes, bring the TCS_ITMY_CO2 guardian back up to LASER_UP, wait 10 minutes and then repeat. This is so we can see the laser changing and also a PZT scan (while laser relocking) at each temperature step.
Stepping over chiller setpoints from 19.5 to 23.75 degC in 0.25deg chiller steps. Expect this run 18:00UTC to ~12:00UTC (4am tomorrow) when it will leave the laser in LASER_UP with the setpoint 21.6degC.
During this scan the CO2Y laser didn't output more than 42.8W. Seems to be happiest at 21.5degC or 19.5degC setpoint see attached plot. Will try less than 19.5degC this morning. We don't want the laser temperature less than 19.5degC (LVEA room temperature) but the laser temperature has been staying around 24degC even with a lower setpoint (due to length of cooling cables).

No dramatic power changes so I've reverted the GRD changes that allowed me to run the test. Leaving the setpoint at 19.5degC. If we needed more power in the future we could try cooling the lines much more to bring the laser temperature closer to 20degC.
J. Oberling, R. Crouch
Update on FARO work during the O4 commissioning break. Previous updates at the following alogs (with associated comments): 75669, 75771.
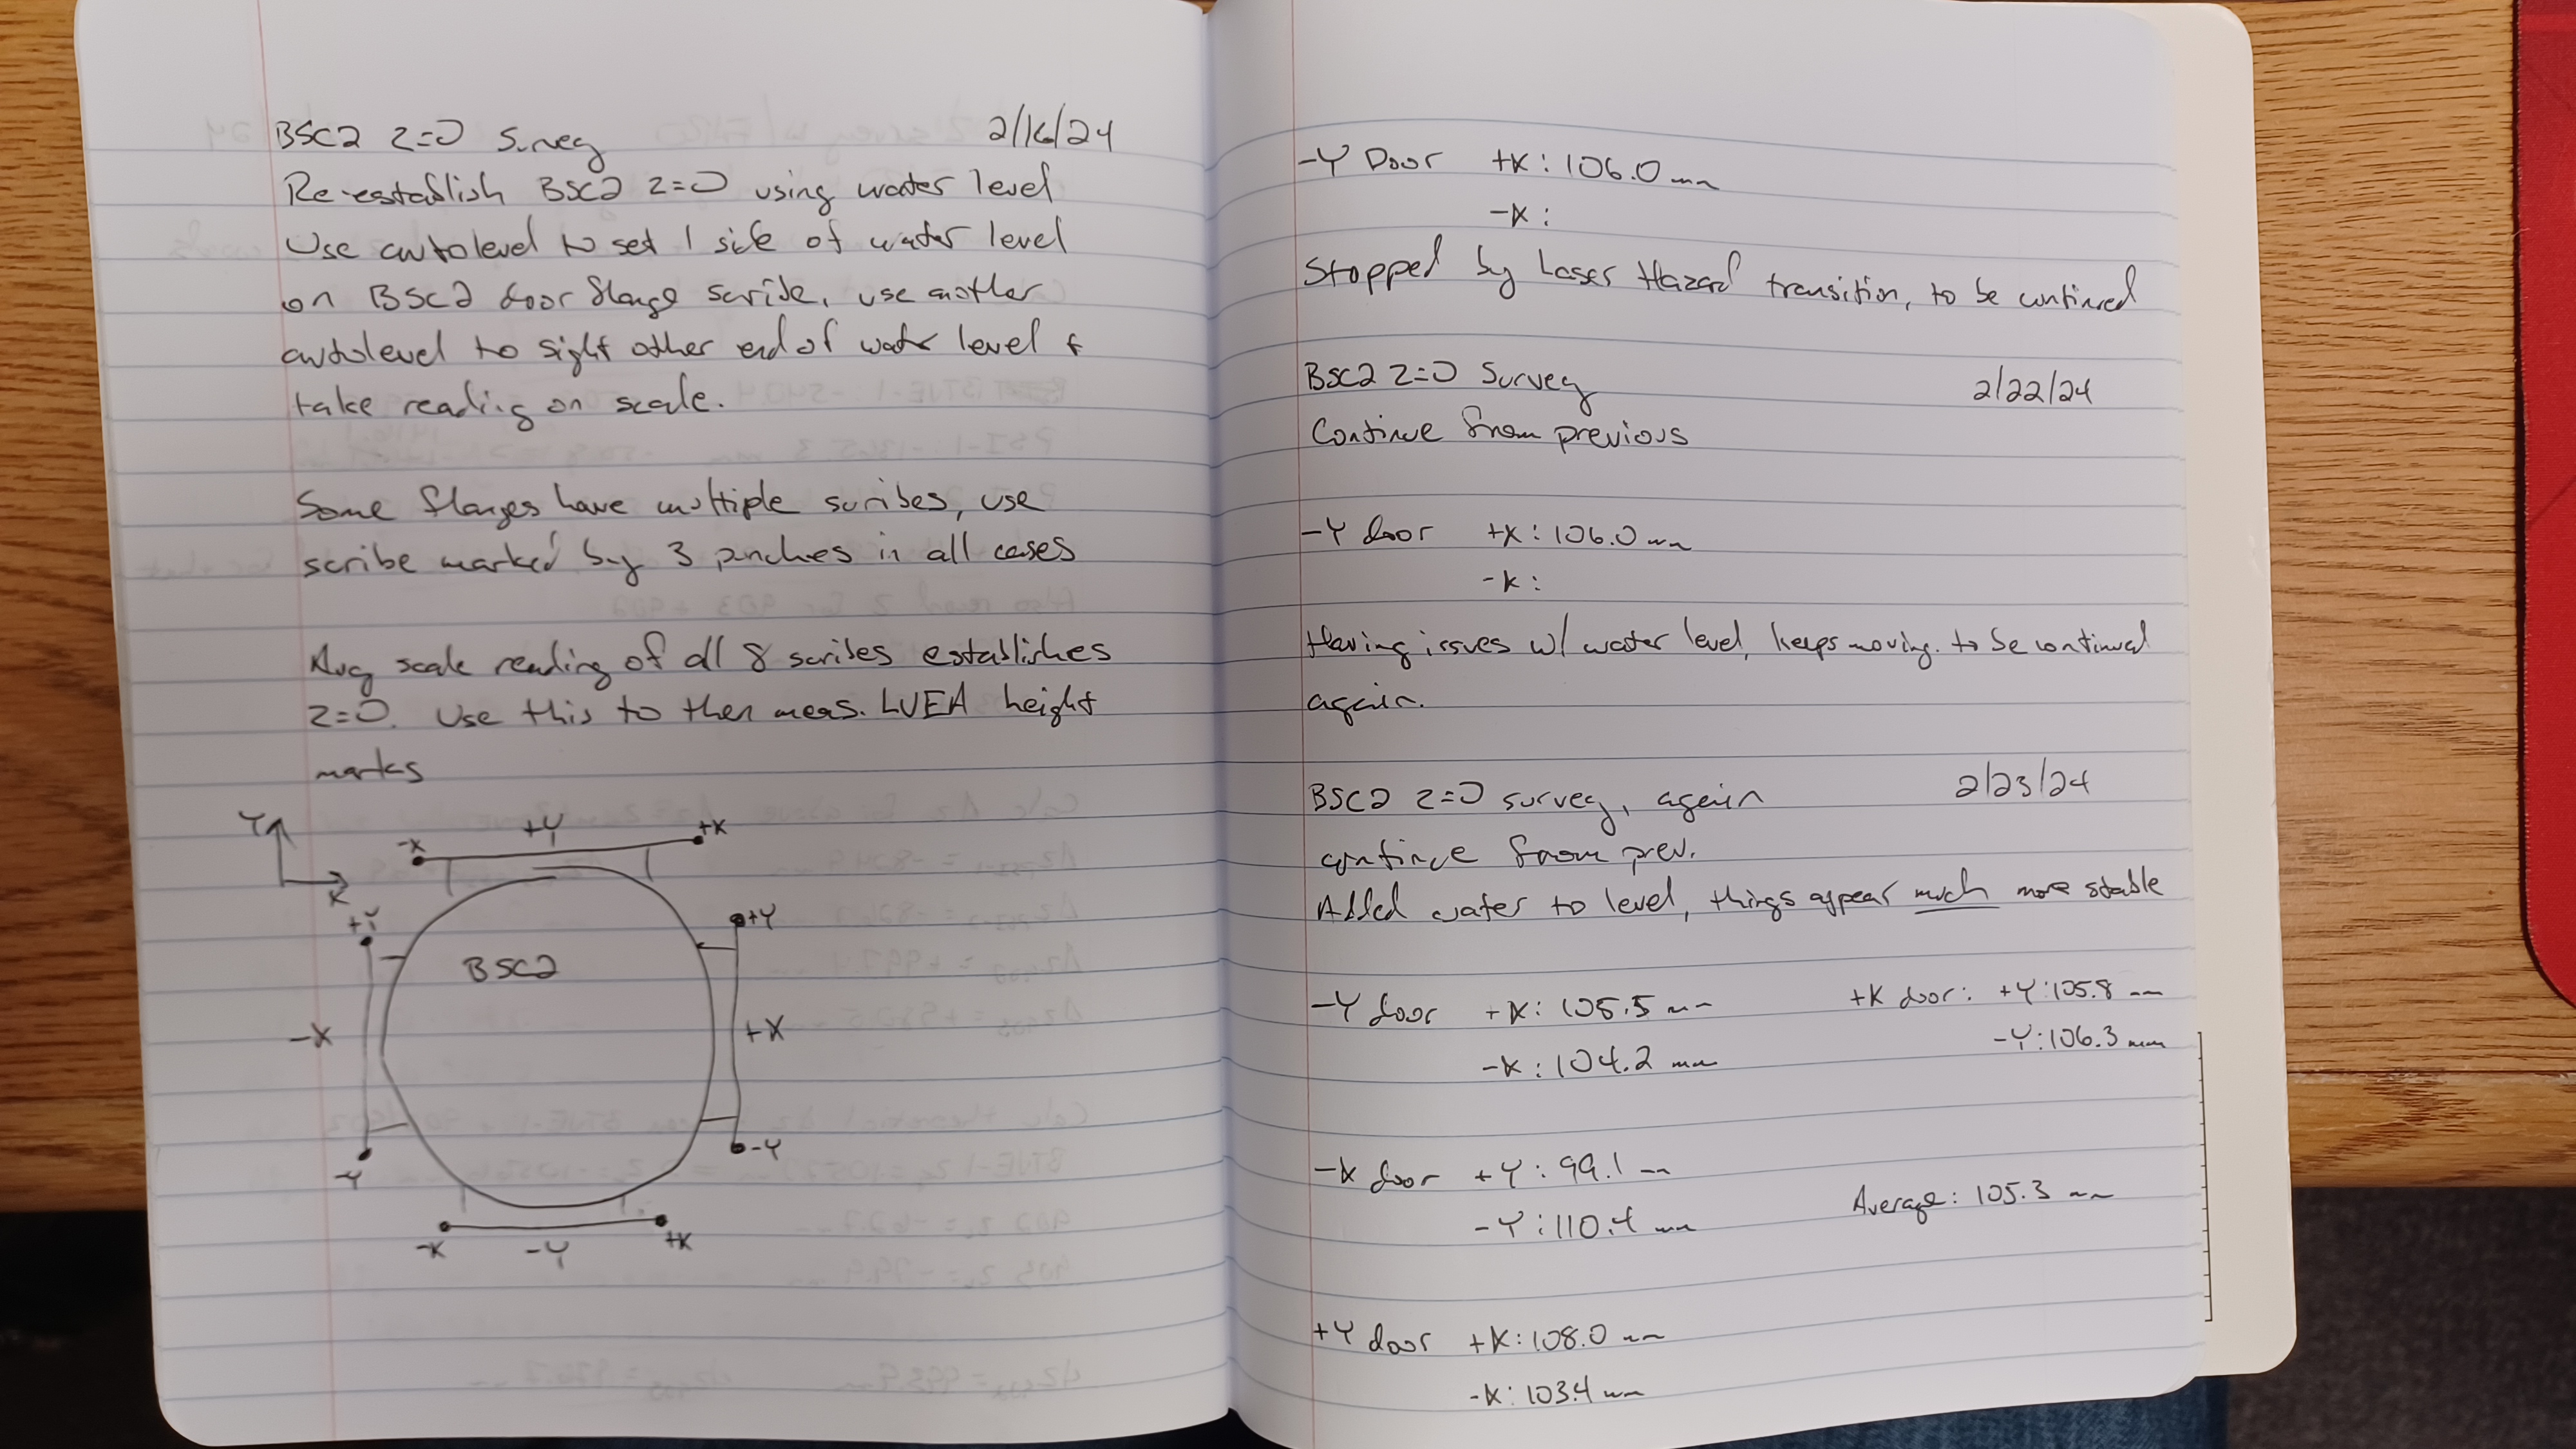
Since the last progress update we've been testing our FARO X/Y alignment routines and attempting to re-establish Z=0 based on the door flange scribes on BSC2. We've been navigating Laser Safe/Hazard transitions, as we can only do optical surveying (like using an autolevel for our BSC2 survey) during Laser Safe; the FARO is usable during Laser Hazard so we've been using these windows for FARO work.
FARO X/Y Alignment Testing
As a means of testing the repeatability of the FARO's X/Y alignments we have been using the brass monuments for mechanical test stand #2 (TS2) in the West Bay of the LVEA. The FARO gives us a global X/Y coordinate for these monuments based on our alignment (which is also a local X/Y coordinate since XG=XL and YG=YL), which we can use to compare the Measured Local LVEA coordinates to each other and test the repeatability of different FARO alignments. In addition, each test stand has a monument that represents the [0,0] of the test stand (monument TS2-10 for TS2). We can therefore subtract the local LVEA X/Y coordinate for the [0,0] monument from each measured test stand monument to translate from Local LVEA coordinates to Local Test Stand coordinates. With this translation we can also compare the monument coordinates measured by the FARO to where we think they are via their as-designed coordinates (designed test stand monument coordinates taken from D1100291).
The results are shown in the attached .pdf file 'FARO_XY_Alignment_Test_TS2_Monuments.pdf'; I have also attached the reports generated from PolyWorks for each of our surveys. To date we have done this with 3 separate alignments:
Alignments 1 and 2 give us insight into how using different feature types (points vs spheres) for our alignment monuments cause variations in the alignment. Alignment 3 was used to give some insight into the repeatability when the same alignment feature types are used with 2 different alignments (in this case 'All Spheres' vs 'All Spheres'). The first 3 pages of the results pdf file detail the measurements of the TS2 monuments, the conversion to Local Test Stand coordinates, and a comparison of the measured test stand coordinates to the as-designed ones; 1 page is used for each alignment. The final page compares the 3 alignments to each other, both in Local LVEA coordinates and in Local Test Stand coordinates. Some thoughts:
We're still digesting this. I'm intrigued by the measured test stand coordinates for the monuments in line with each other. For example, TS2-1 is supposed to be directly in line with TS2-4, only separated along the test stand's Y axis; this is the same for the group TS2-2, TS2-10, and TS2-5, as well as the group TS2-3 and TS2-6. All 3 alignments show these monuments being at an angle with each other, and a similar angle at that; almost like the line from TS2-2 to TS2-5 (which also intersects TS2-10) was not straight when these monuments were laid out, and that carried over in the setting of the monument groups to the sides of this line (TS2-1/TS2-4 and TS2-3/TS2-6). I will say that I find the deviations between FARO measured and as-designed test stand monument coordinates particularly worrying; whether that's due to an error in the FARO alignment or an actual error made when these monuments were first laid out I can't yet say, some more investigation is required (could do something like use a 100' survey tape to measure distances between monuments and compare to the FARO measurements). Also, I would like to to set up a new Sphere+Points alignment to see if using the point alignment feature improves the repeatability; as I've said a few times in the previous alogs, we suspect that the sphere fit routine and the limitations of the sphere fit rods are introducing error into the FARO alignment, and the above alignment comparisons appear to support that at first glance. I'm interested to see if using points instead of spheres improves this, but we need a new alignment to compare to the old Sphere+Points alignment.
BSC2 Z=0 Water Level Survey
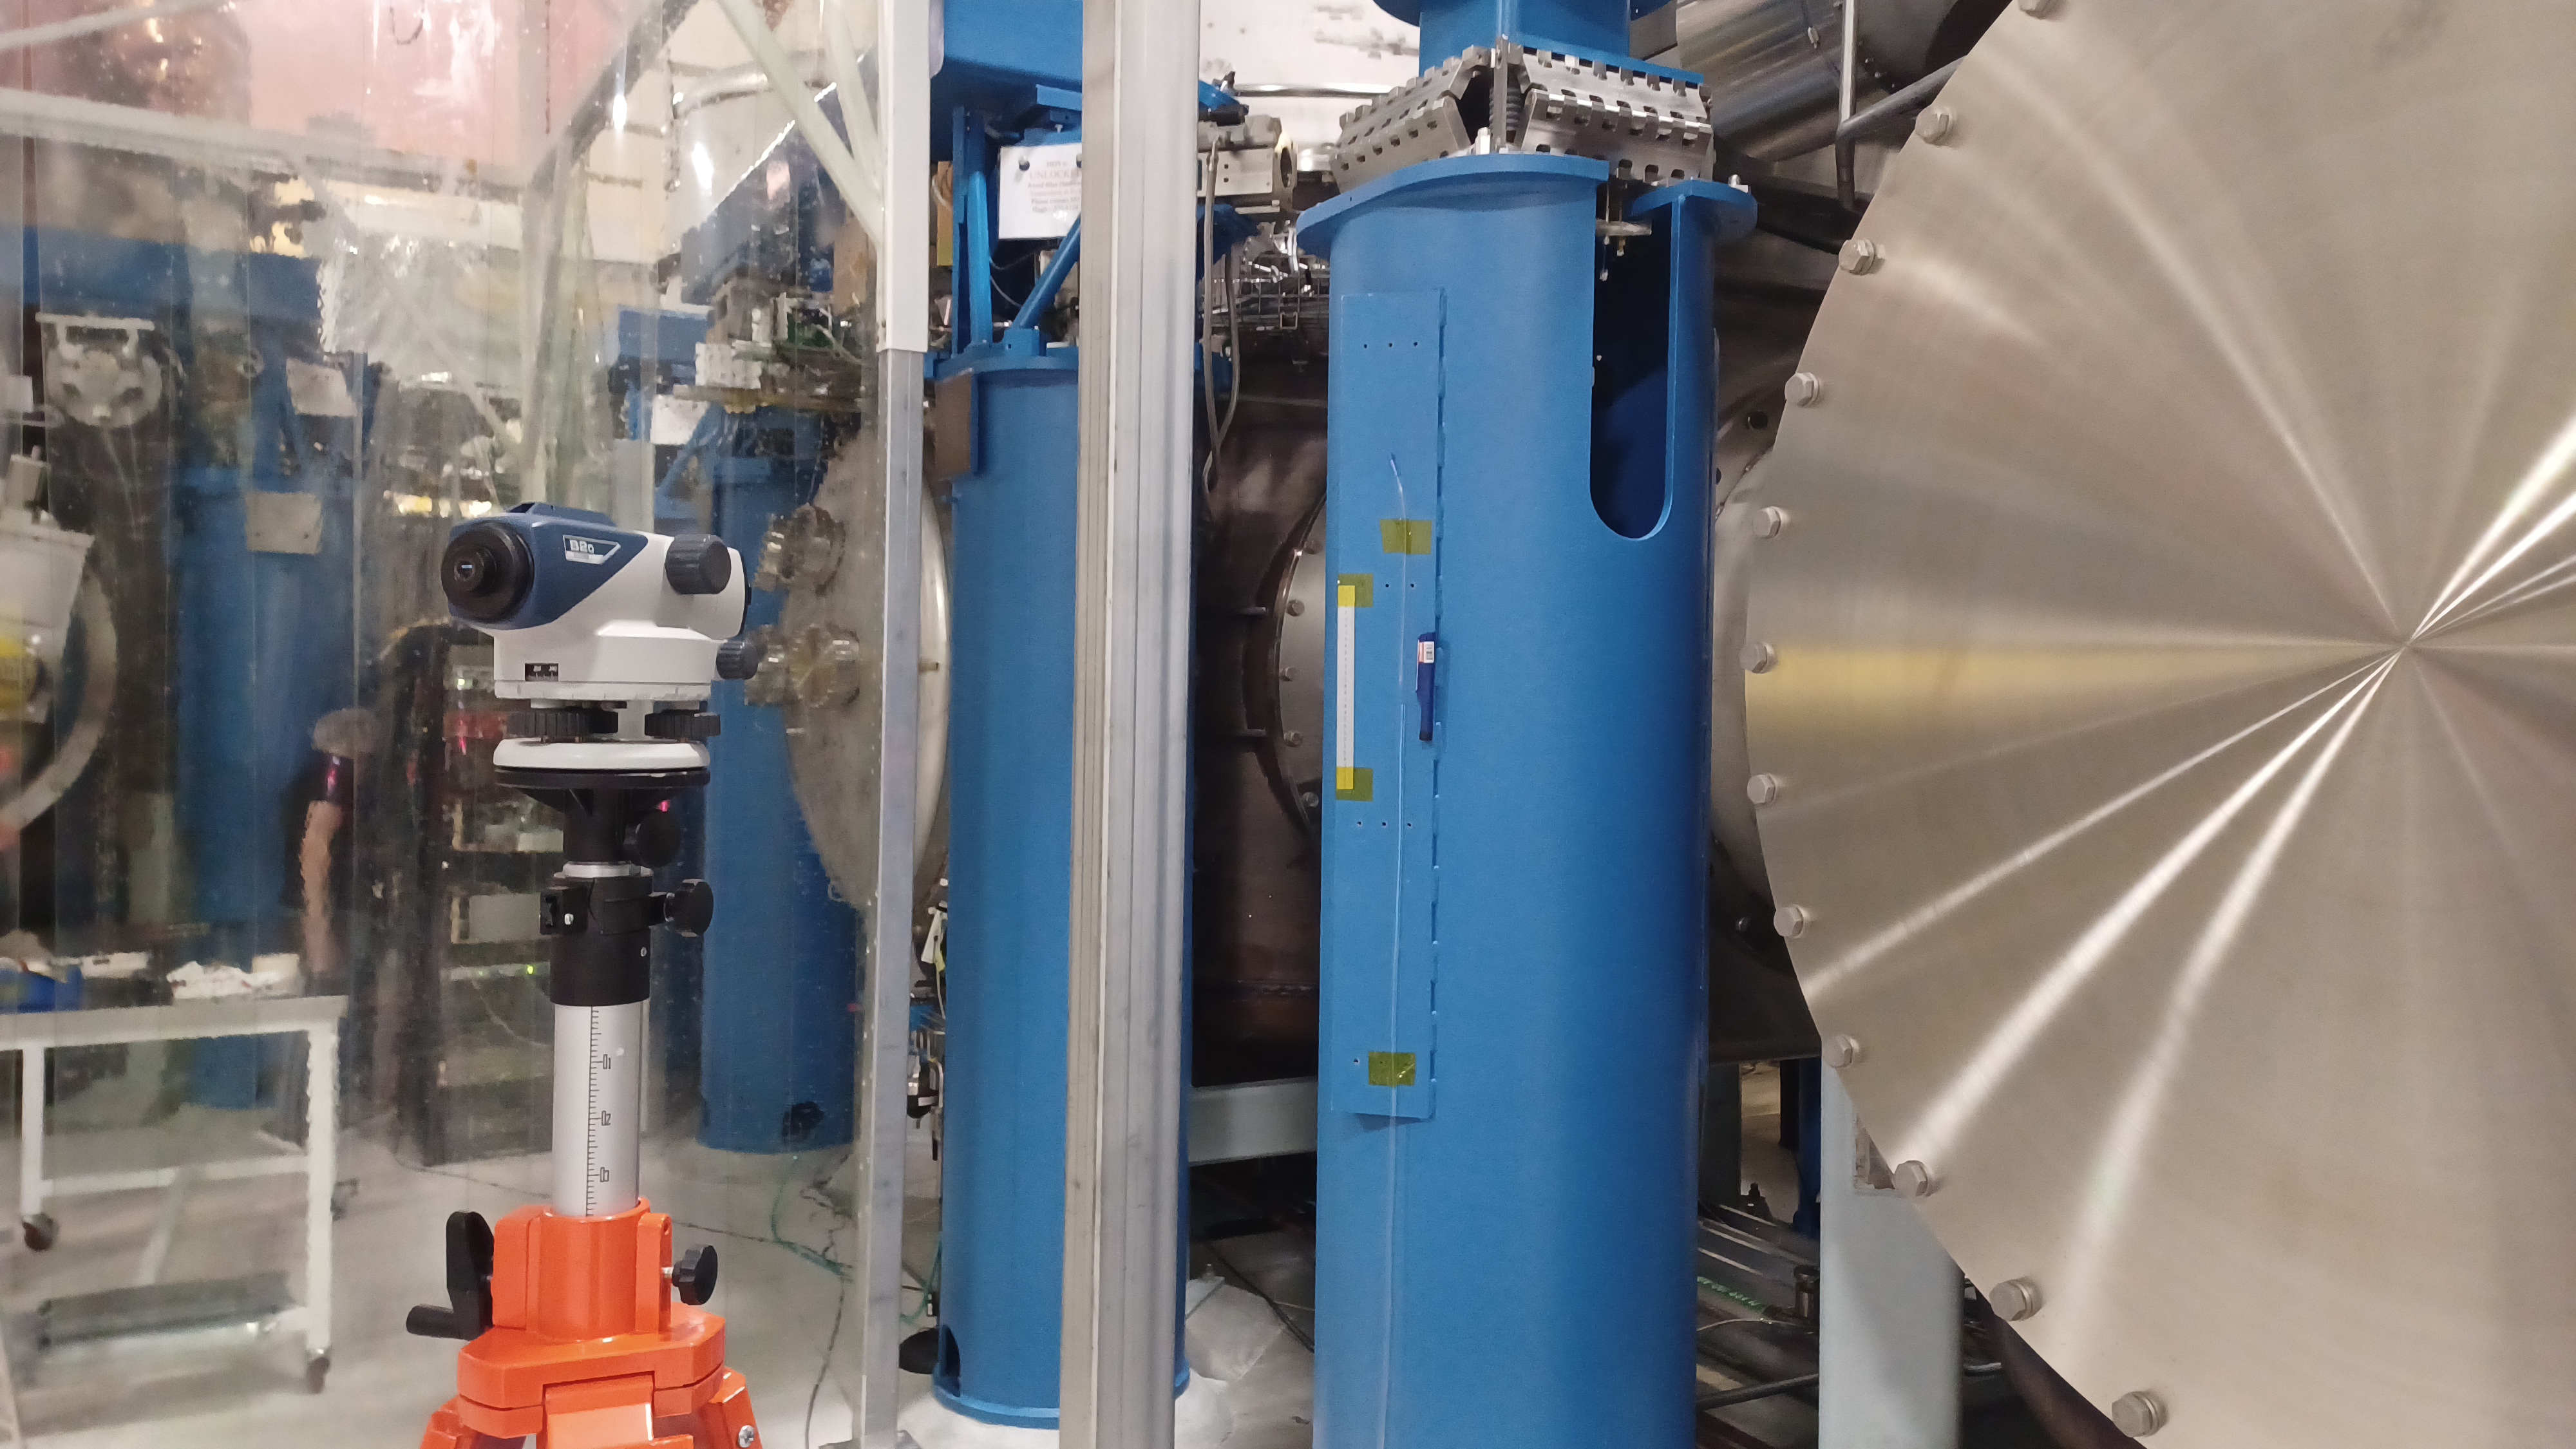
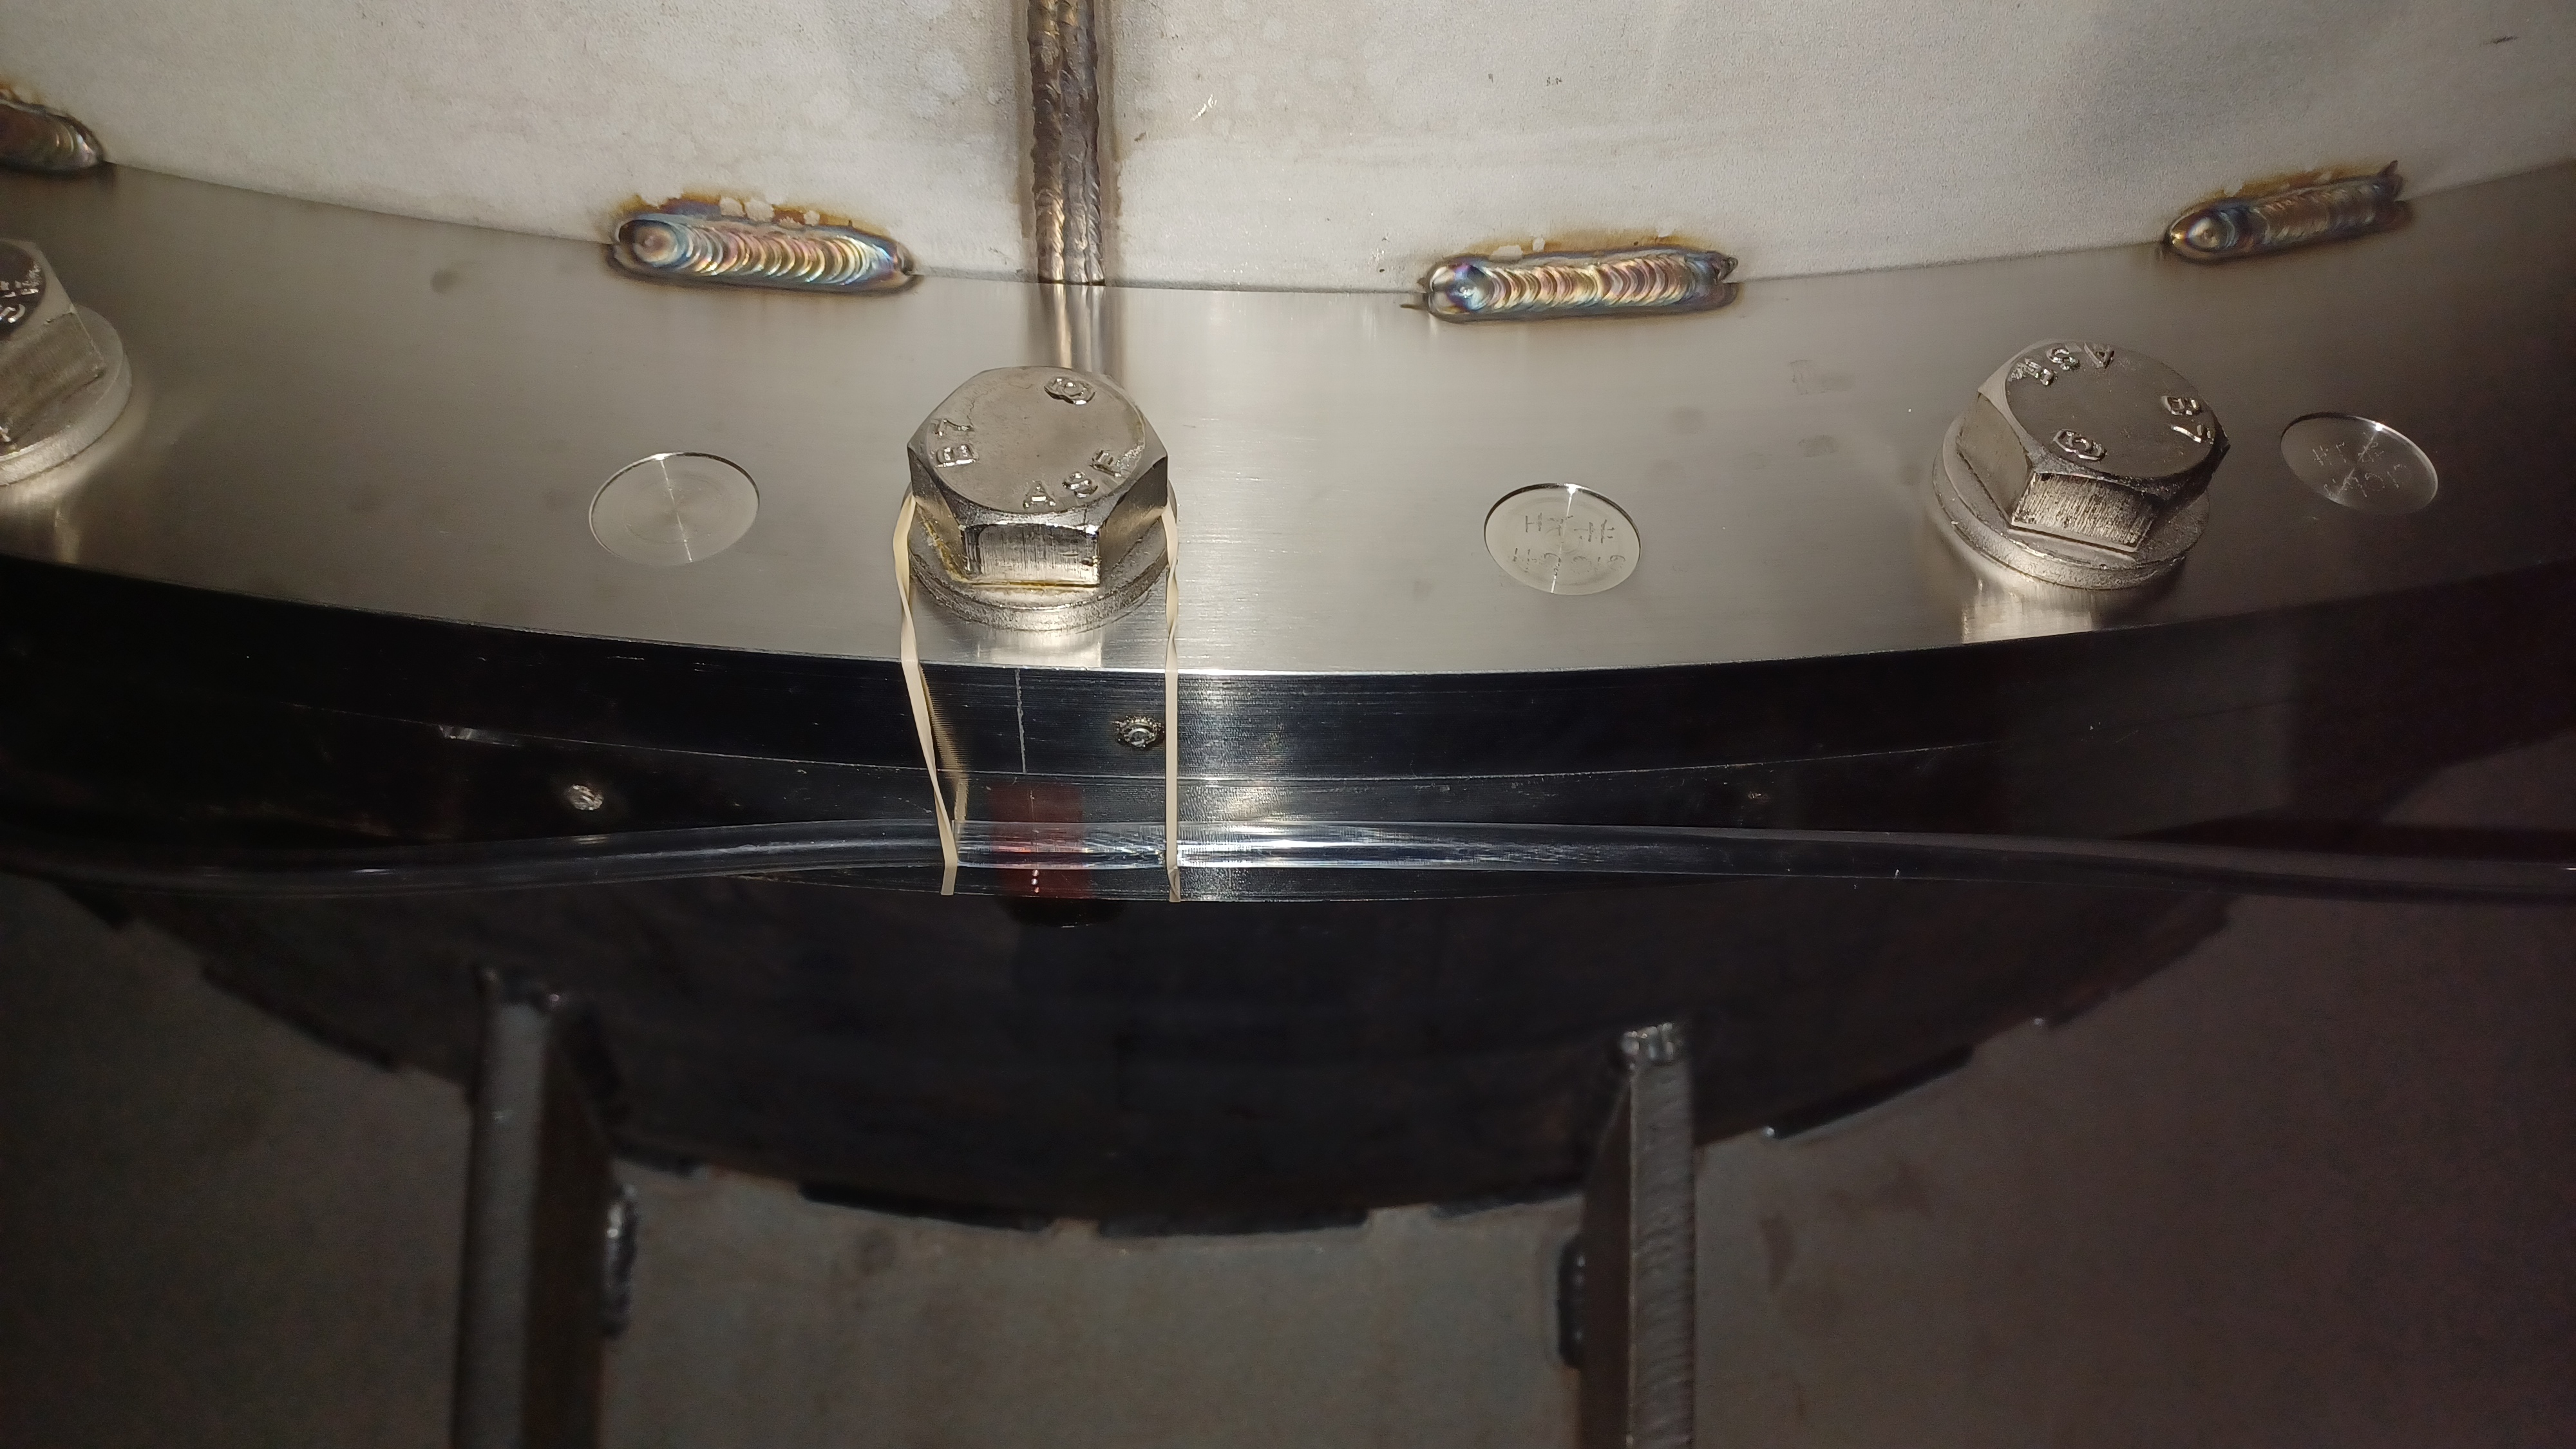
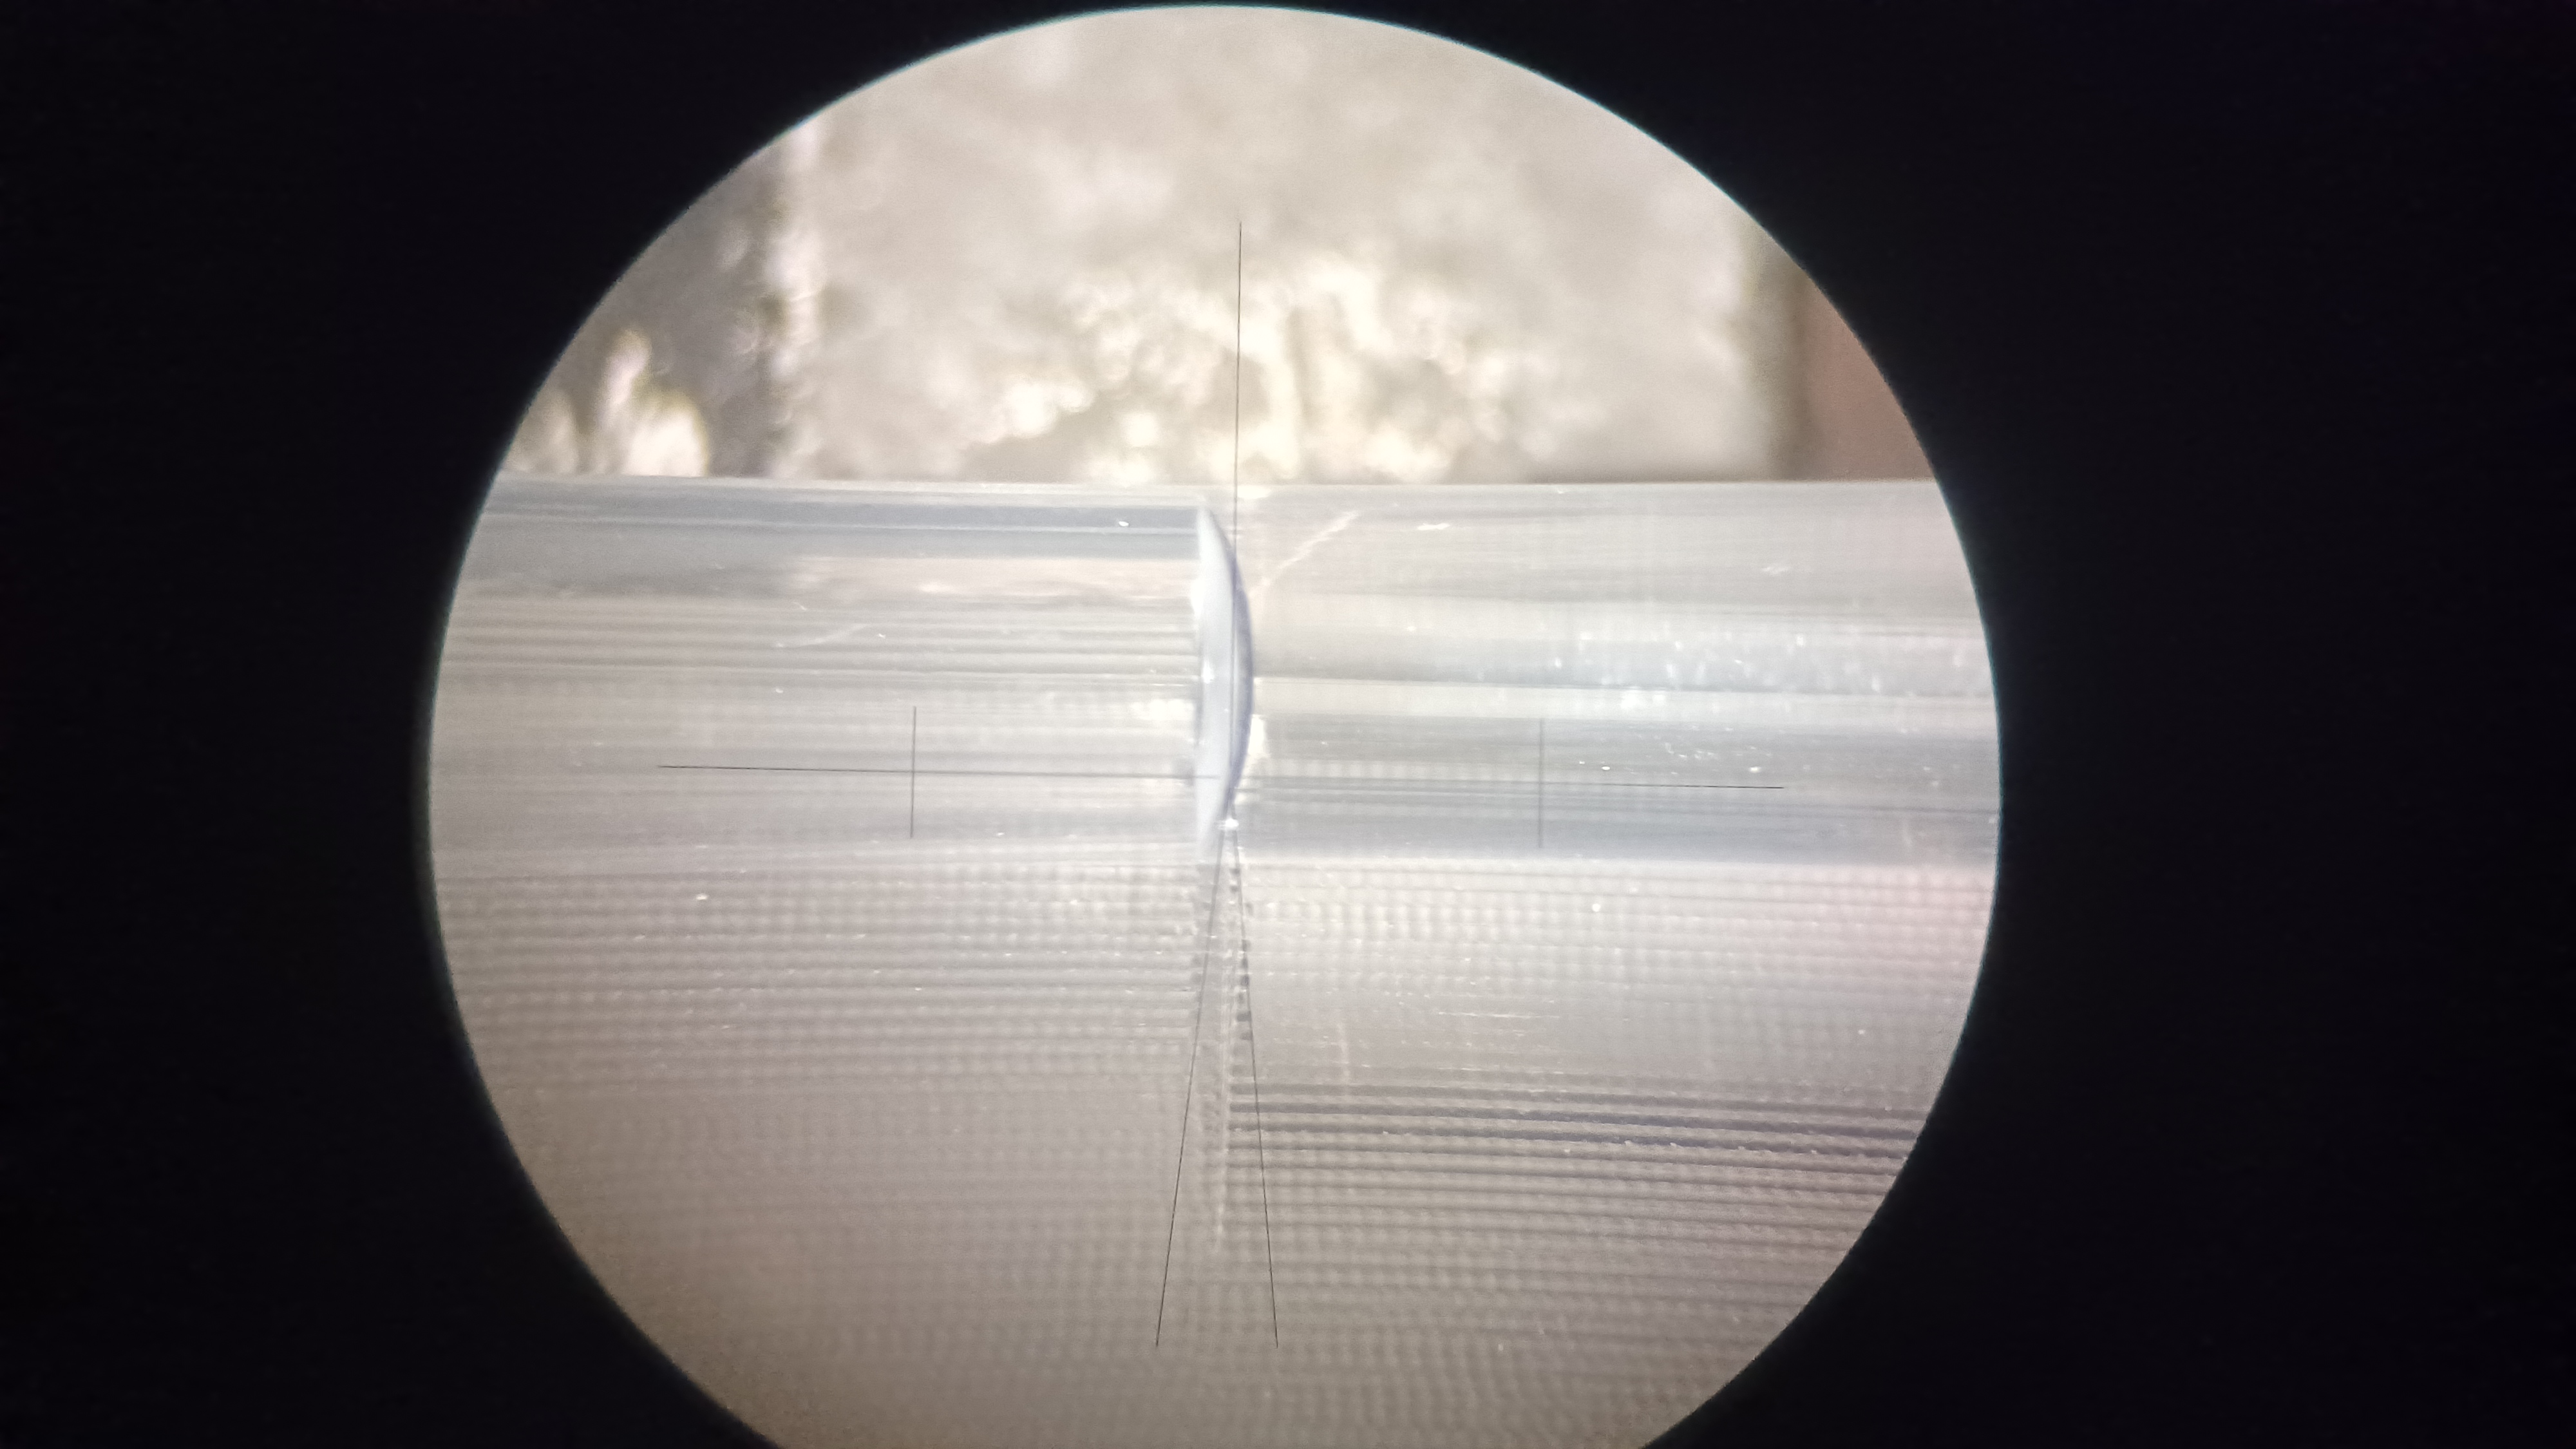
Based on the results of our FARO work detailed in alog 75771, we want attempt to re-establish Z=0. This was originally done by averaging the 8 door flange scribes of the BSC2 chamber (1 and 3 o'clock and 1 and 9 o'clock on each of the 4 door flanges). With all of the line of sight blockers (beam tubes, other chambers, electronics racks, cable runs, etc.) we felt the easiest way to repeat this was to use a water tube level. To do this we used roughly 60' of flexible tubing with an 8mm OD and 6mm ID. We filled it with water (setting up a siphon works great for keeping air bubbles out of the tube), leaving some air at each end, and set up around BSC2. One end of the level was fixed to the unused HEPI pier for BSC8, with a scale attached nearby for measurements; the other end was placed along the door flange scribe under measurement. We used an autolevel to set the water line on the scribe line to be measured, then used a 2nd autolevel to sight the other end of the tube and take a reading on the scale. We ended up using several rubber bands and some tape to secure the tube to the door flange; the tape was necessary to keep the tube from sagging under the weight of the water (the BSC scribes are over 6' above the ground), while the rubber bands helped to keep it mostly secure while we were setting it on a scribe line. The first 3 pictures show the setup, with the third one taken through an autolevel to show a close up of the water in the tube (have to sight at the bottom of the meniscus, just like with a graduated cylinder or similar measurement devices (like glass measuring cups in your kitchen)).
We did have a few issues, chief among them being that we could not get the water in the tube to stop moving at first. We would set the water line on a door flange scribe and watch it settle, and it would keep dropping slowly over several minutes. We noticed that regardless of where we set the water level, it would always drop to the same point; what finally clued us in to the issue was noticing that the other end of the water level was also dropping. If the level were rebalancing we would expect one end drop while the other raised, but this was not the case. At this point we also noticed that, even though we left about 12" of air at each end of the tube when we initially filled it, we now had almost 2' of air at each end. The solution? Not enough water in the tube, so add some more. We did this and all the stability problems vanished. We could then set the level on a scribe line, and after just a few seconds it would settle out and be very stable. Best explanation I have is we didn't have enough water to account for the slight compression of the water column at both ends of the level, since our measurement point was over 6' off the ground. With only a 6mm ID on the tubing, it doesn't take much to cause a big difference in how the level behaves. By adding ~9mL of water to the tube (using a 2mL transfer pipette) all of our problems were solved. Second issue, don't step on or touch the water level once set. This causes the water in the tube to move, a lot.
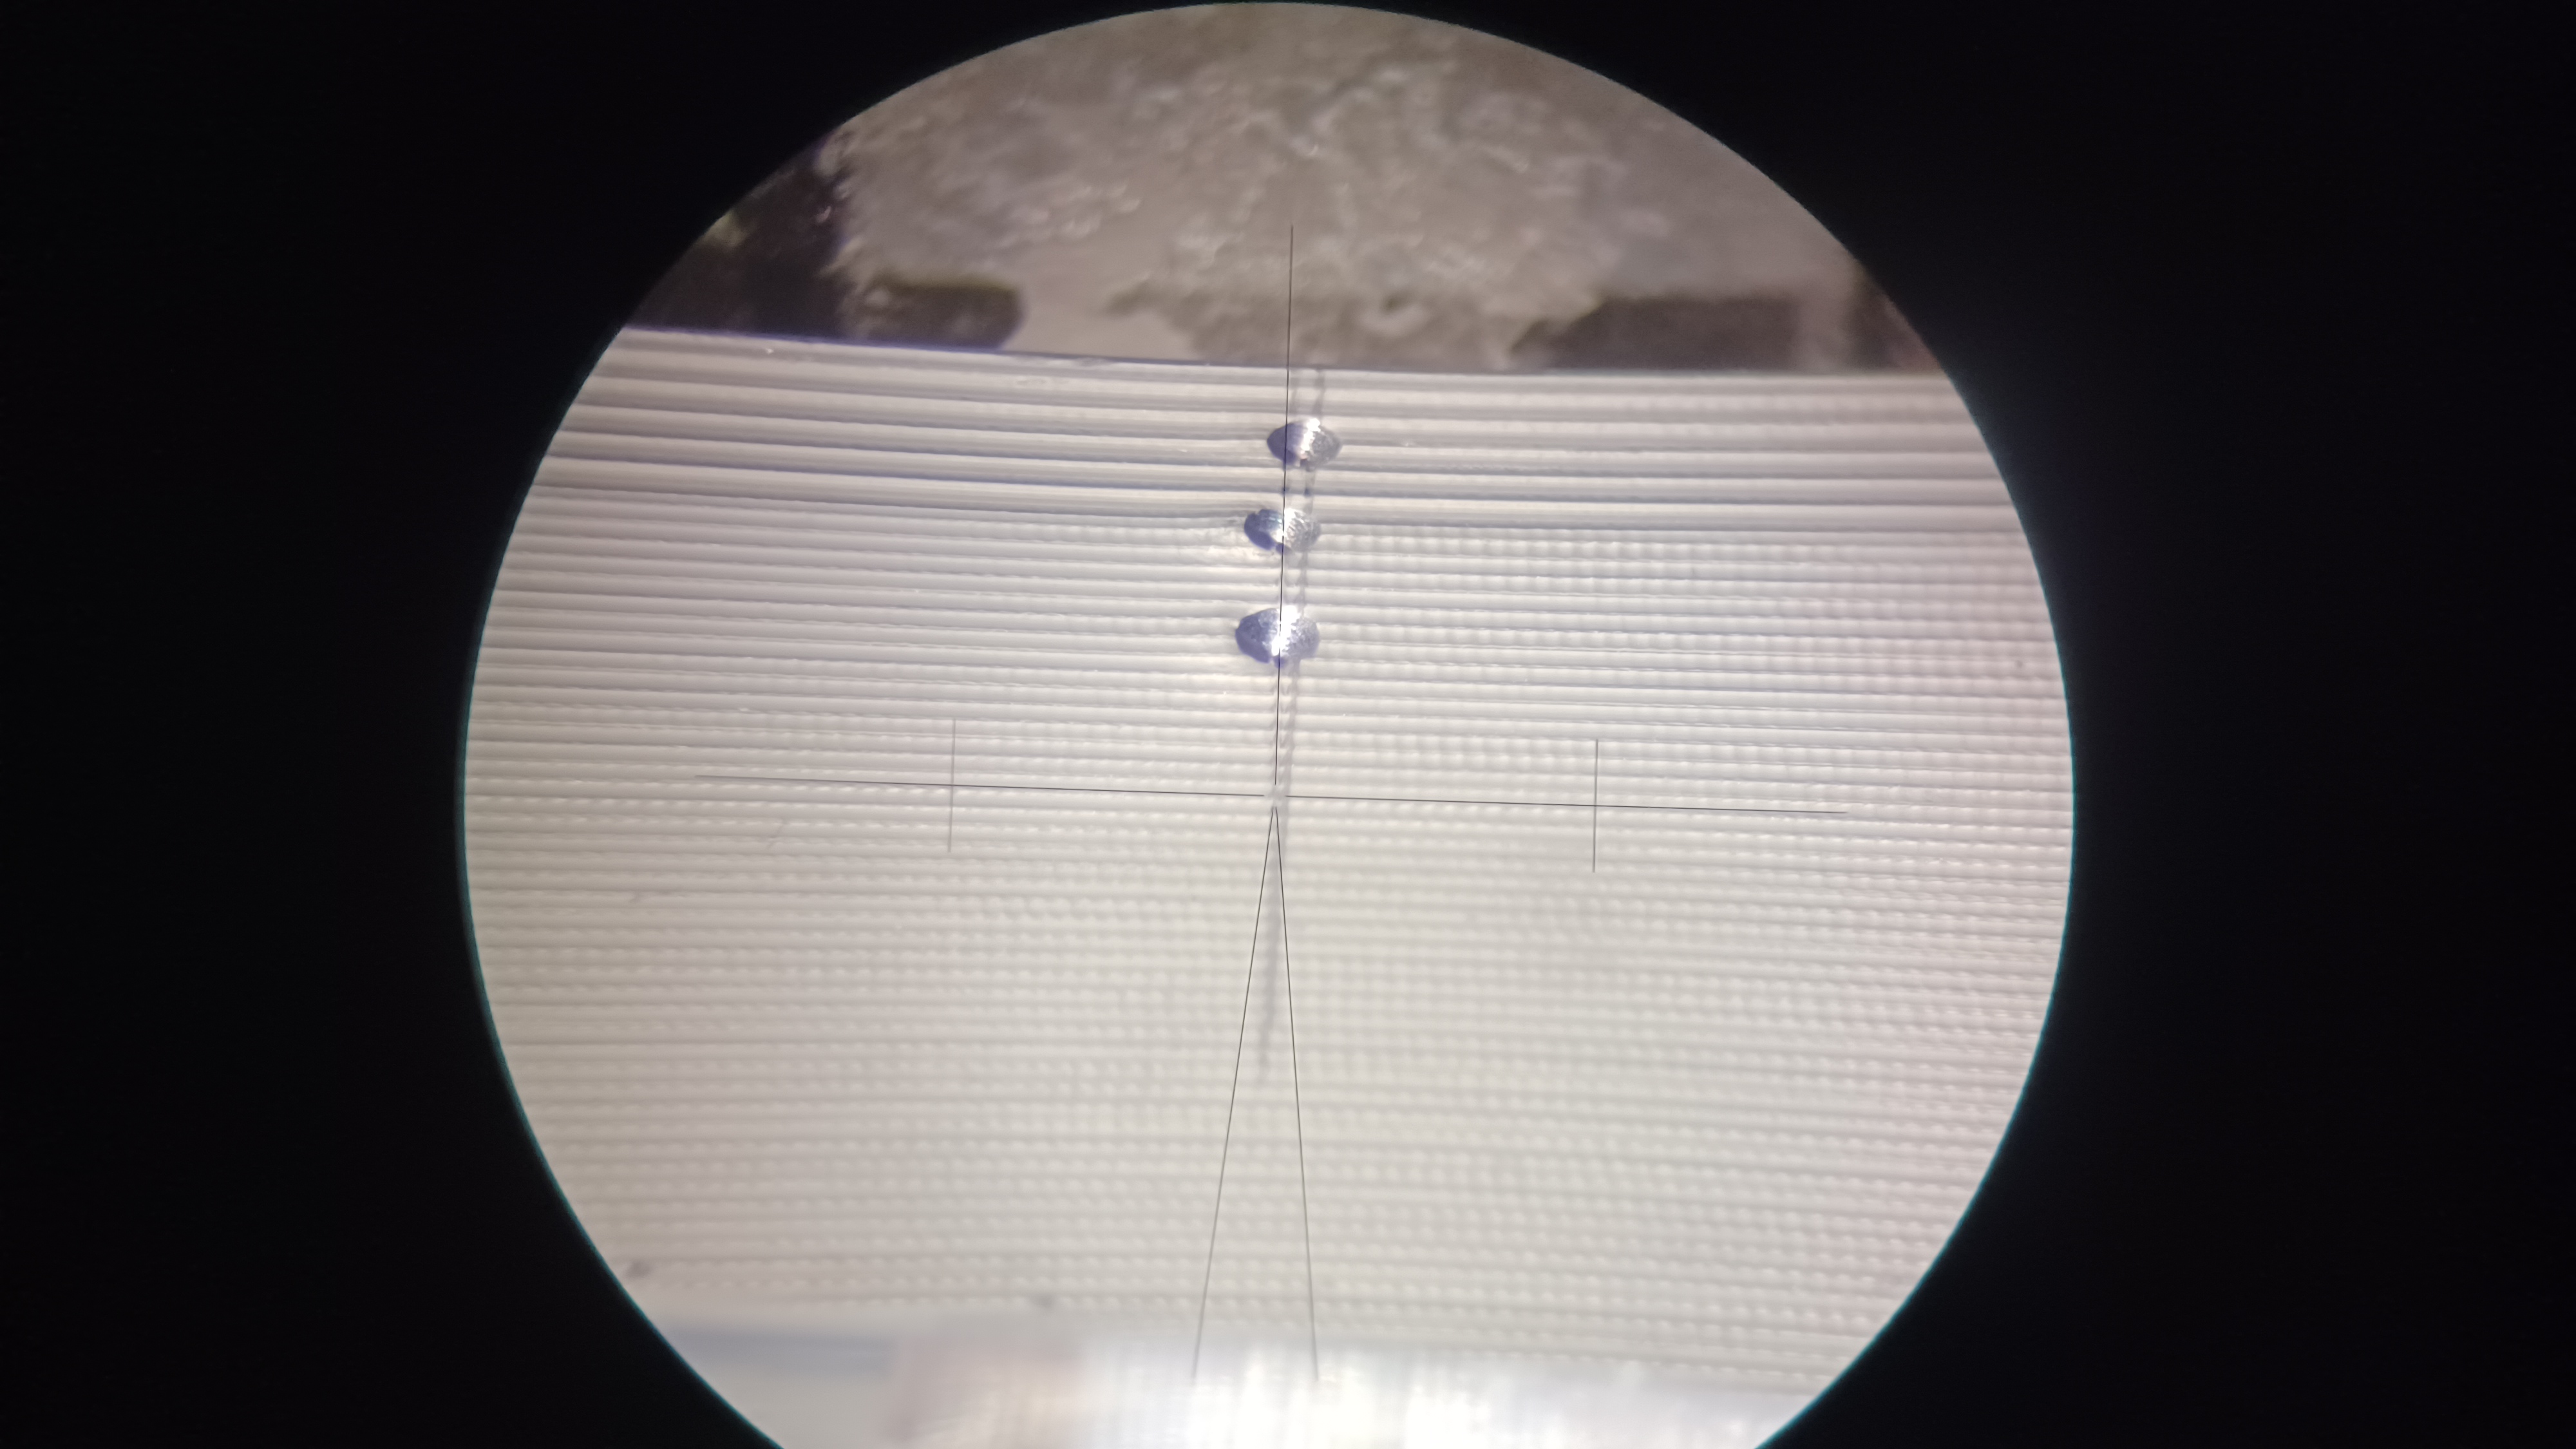
The other big issue we had is sighting the correct scribe line on the door flanges. Over the years since site construction several additional scribe lines have been added to many of the door flanges, all within several mm of each other. Most have no markings on them, a few had arrows, but 1 scribe on each flange was marked with 3 punch marks; this was also true for the 3 flanges with only 1 scribe on them. So we sighted the scribe line marked by the punches on all door flanges. The 4th picture shows an example of these punch marks (there are 2 scribe lines in this pictures, one that is straight and one that is not; we used the one that is straight, which can be seen behind the autolevel cross hairs).
With our scribe lines chosen and other issues figured out, we set about measuring all 8 of the BSC2 door flange scribes. The final picture is a shot of my notes from the survey. Notice the large separation for the -X door scribes. Mike Zucker indicated to us that he thinks the scribes were placed to within +/- 1mm of flange center (having a hard time finding documentation of this, he is currently looking for the old "end item data package" for the chambers from their initial construction in the 90s), so this 11.3mm separation in particular is puzzling (we also measured a 4.6mm separation for the +Y door, 1.3mm separation on the -Y door, and 0.5mm separation on the +X door). One thing he suggested we can do is use a flat survey tape to check that the scribes are on a true diameter of the flange (are they 1/2 circumference apart?), which we will do once we have Laser Safe again. Once we confirm we've used the correct scribe lines we will continue with using the average of these scribes to check the various height marks around the LVEA. Should we find that we don't have the correct scribes then we will have to repeat the water level survey.
Tagging EPO for FARO pics.
J. Oberling, R. Crouch, R. Short
Ryan S. and I went out yesterday, 2/29, and used a flat survey tape to measure the distance between the 3-punch scribe marks along the circumference of the 4 BSC2 door flanges; the survey tape has 1.0 mm tick marks, so best we can measure to is the closest 0.5 mm. If these scribes are the correct ones to use then they should be 1/2 circumference from each other, which would mean the difference we measured with the water level are due to the flanges being clocked when the chamber was built. We had to do some DCC spelunking to find the correct OD for the BSC door flanges. Ryan C. found D970412, which eventually led to D961102. This document is the Release for Quote for the BSC door flanges, so not an as-built, but it's the best we've been able to find so far so I'm going with it. D961102-04.pdf lists the OD of the BSC door flange as 68.50 inches. Converting that to mm and calculating the 1/2 circumference gives us 2733.0 mm. Our measurements from yesterday:
So the 3-punch scribes on all door flanges meet the expected 1/2 circumference of 2733.0 mm to within +1.5/-1.0 mm. We have yet to find any kind of documentation or spec for these scribe lines, so I can't definitively say to what tolerance they were supposed to be placed to, but I've been told +/-2.0 mm in the past and our measurements appear to meet that. To me this says that Ryan C. and I used the correct scribe lines during our water level survey, but the flanges were unexpectedly clocked w.r.t. local horizontal. This in turn does give us an average across those 8 scribe lines that we can use to start measuring height marks to see if we can identify the source of the Z axis discrepancies the FARO has been reporting. Ryan C. and I will begin doing this during upcoming Tuesday maintenace windows as both of our schedules allow.
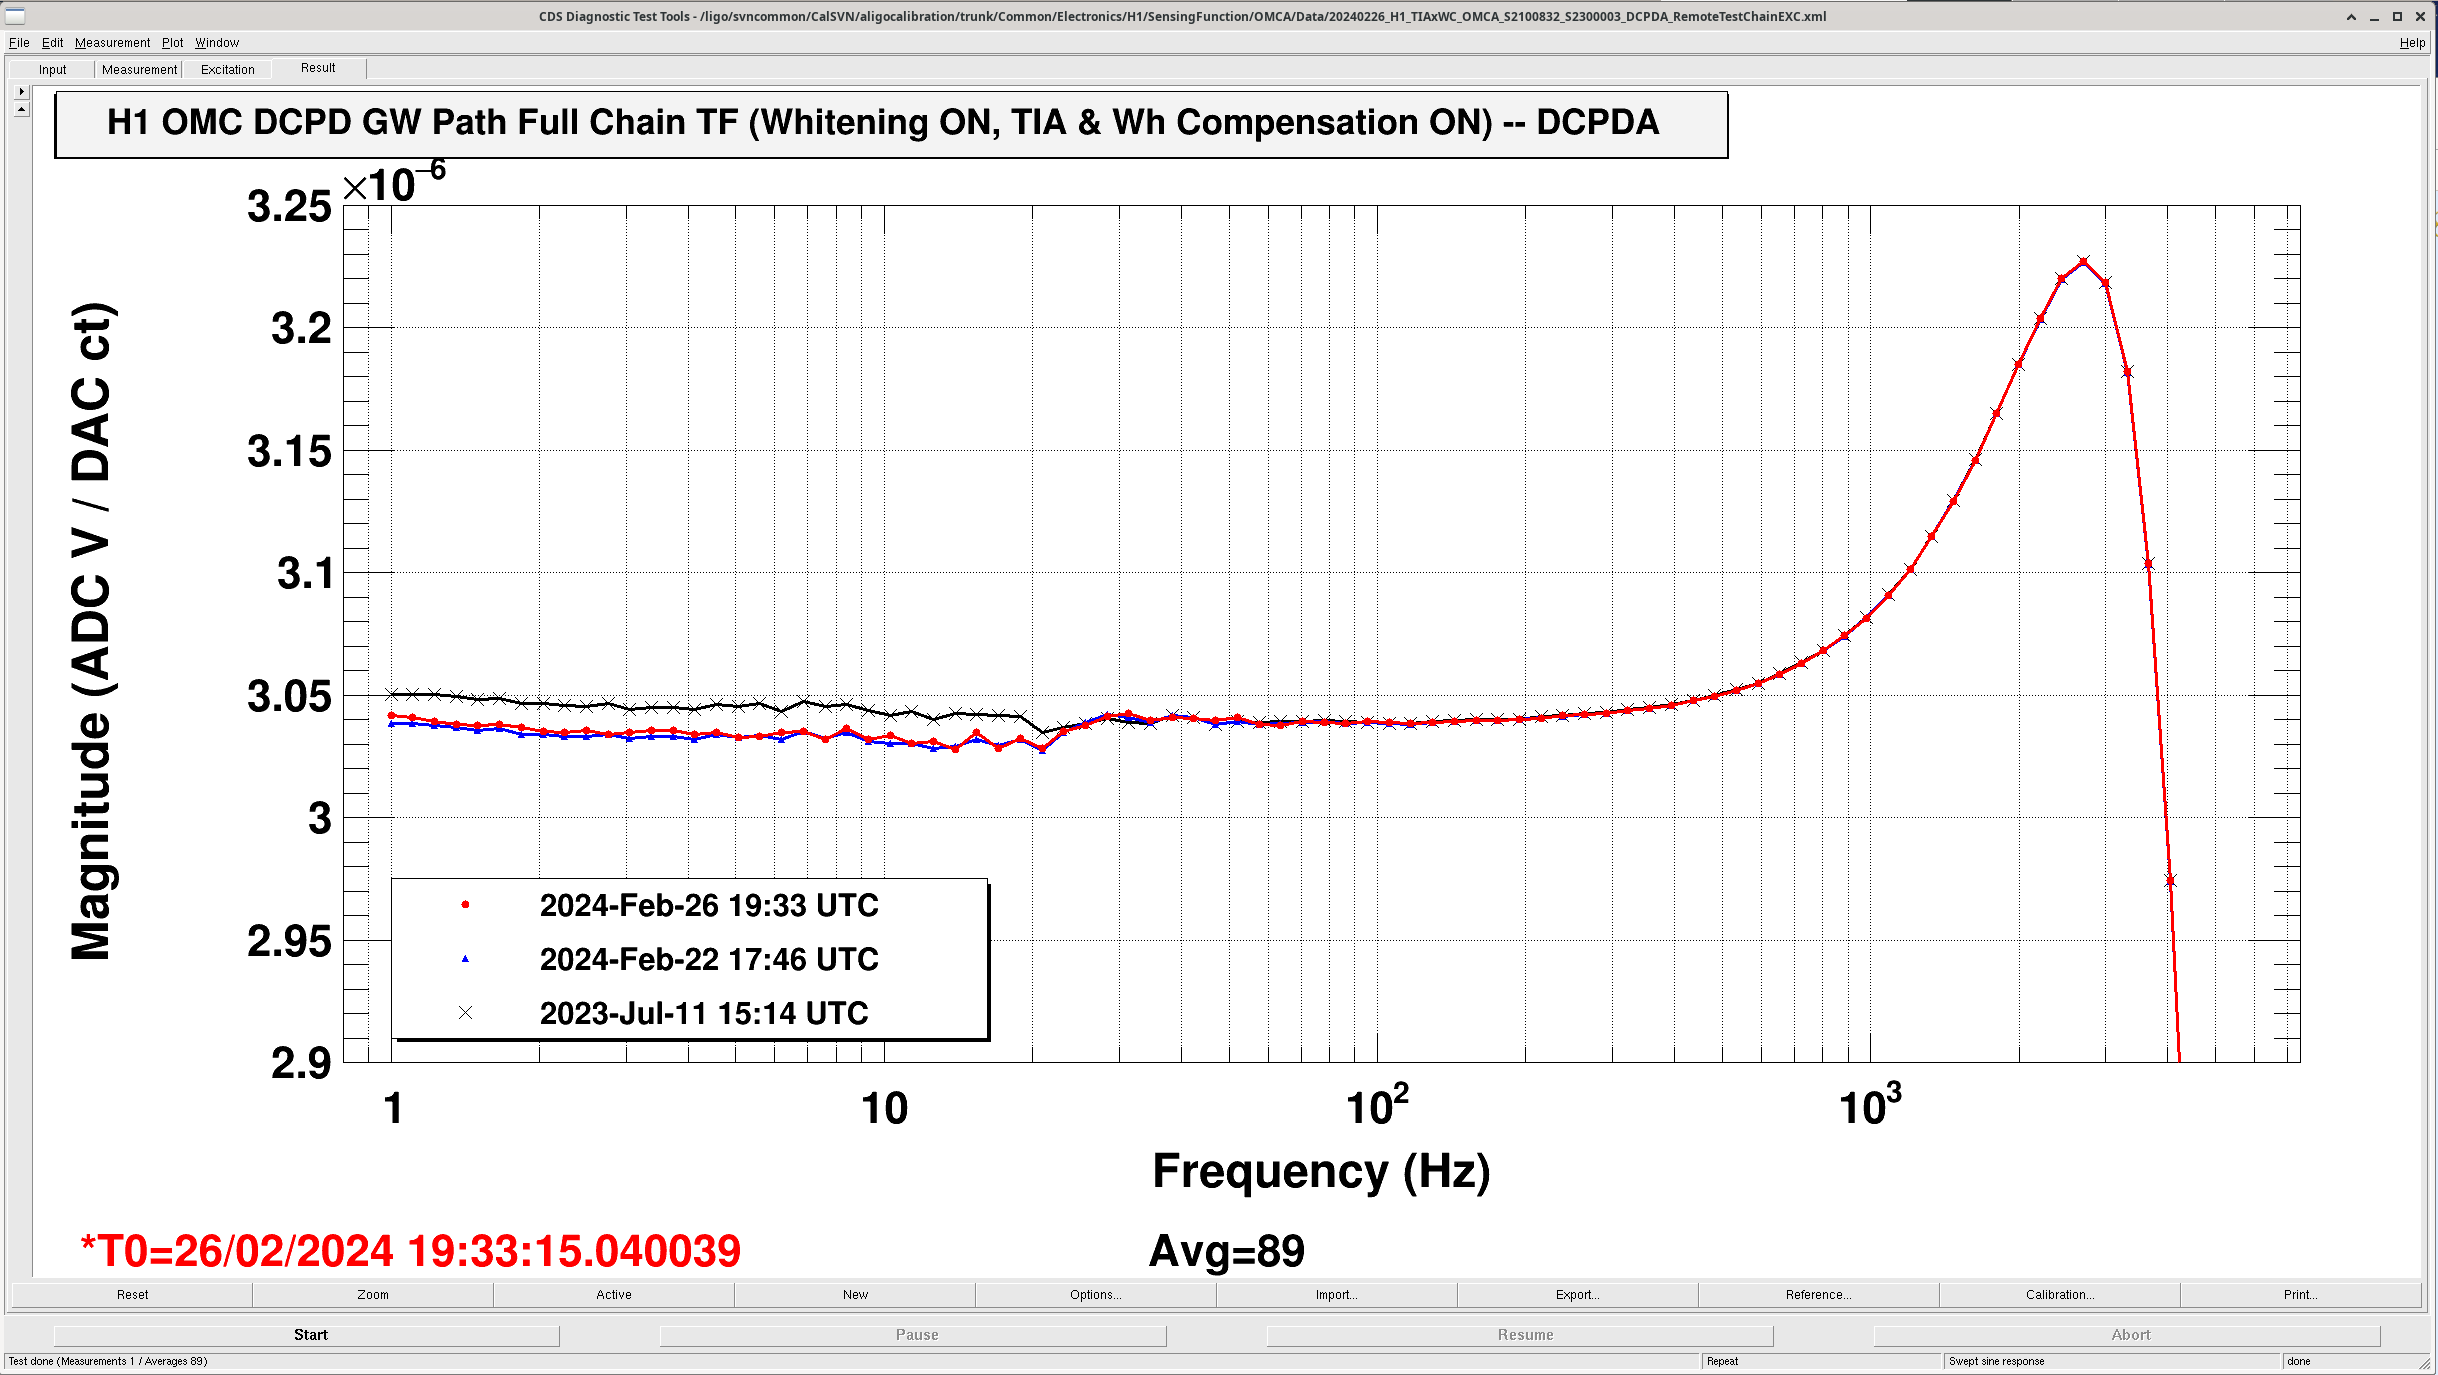
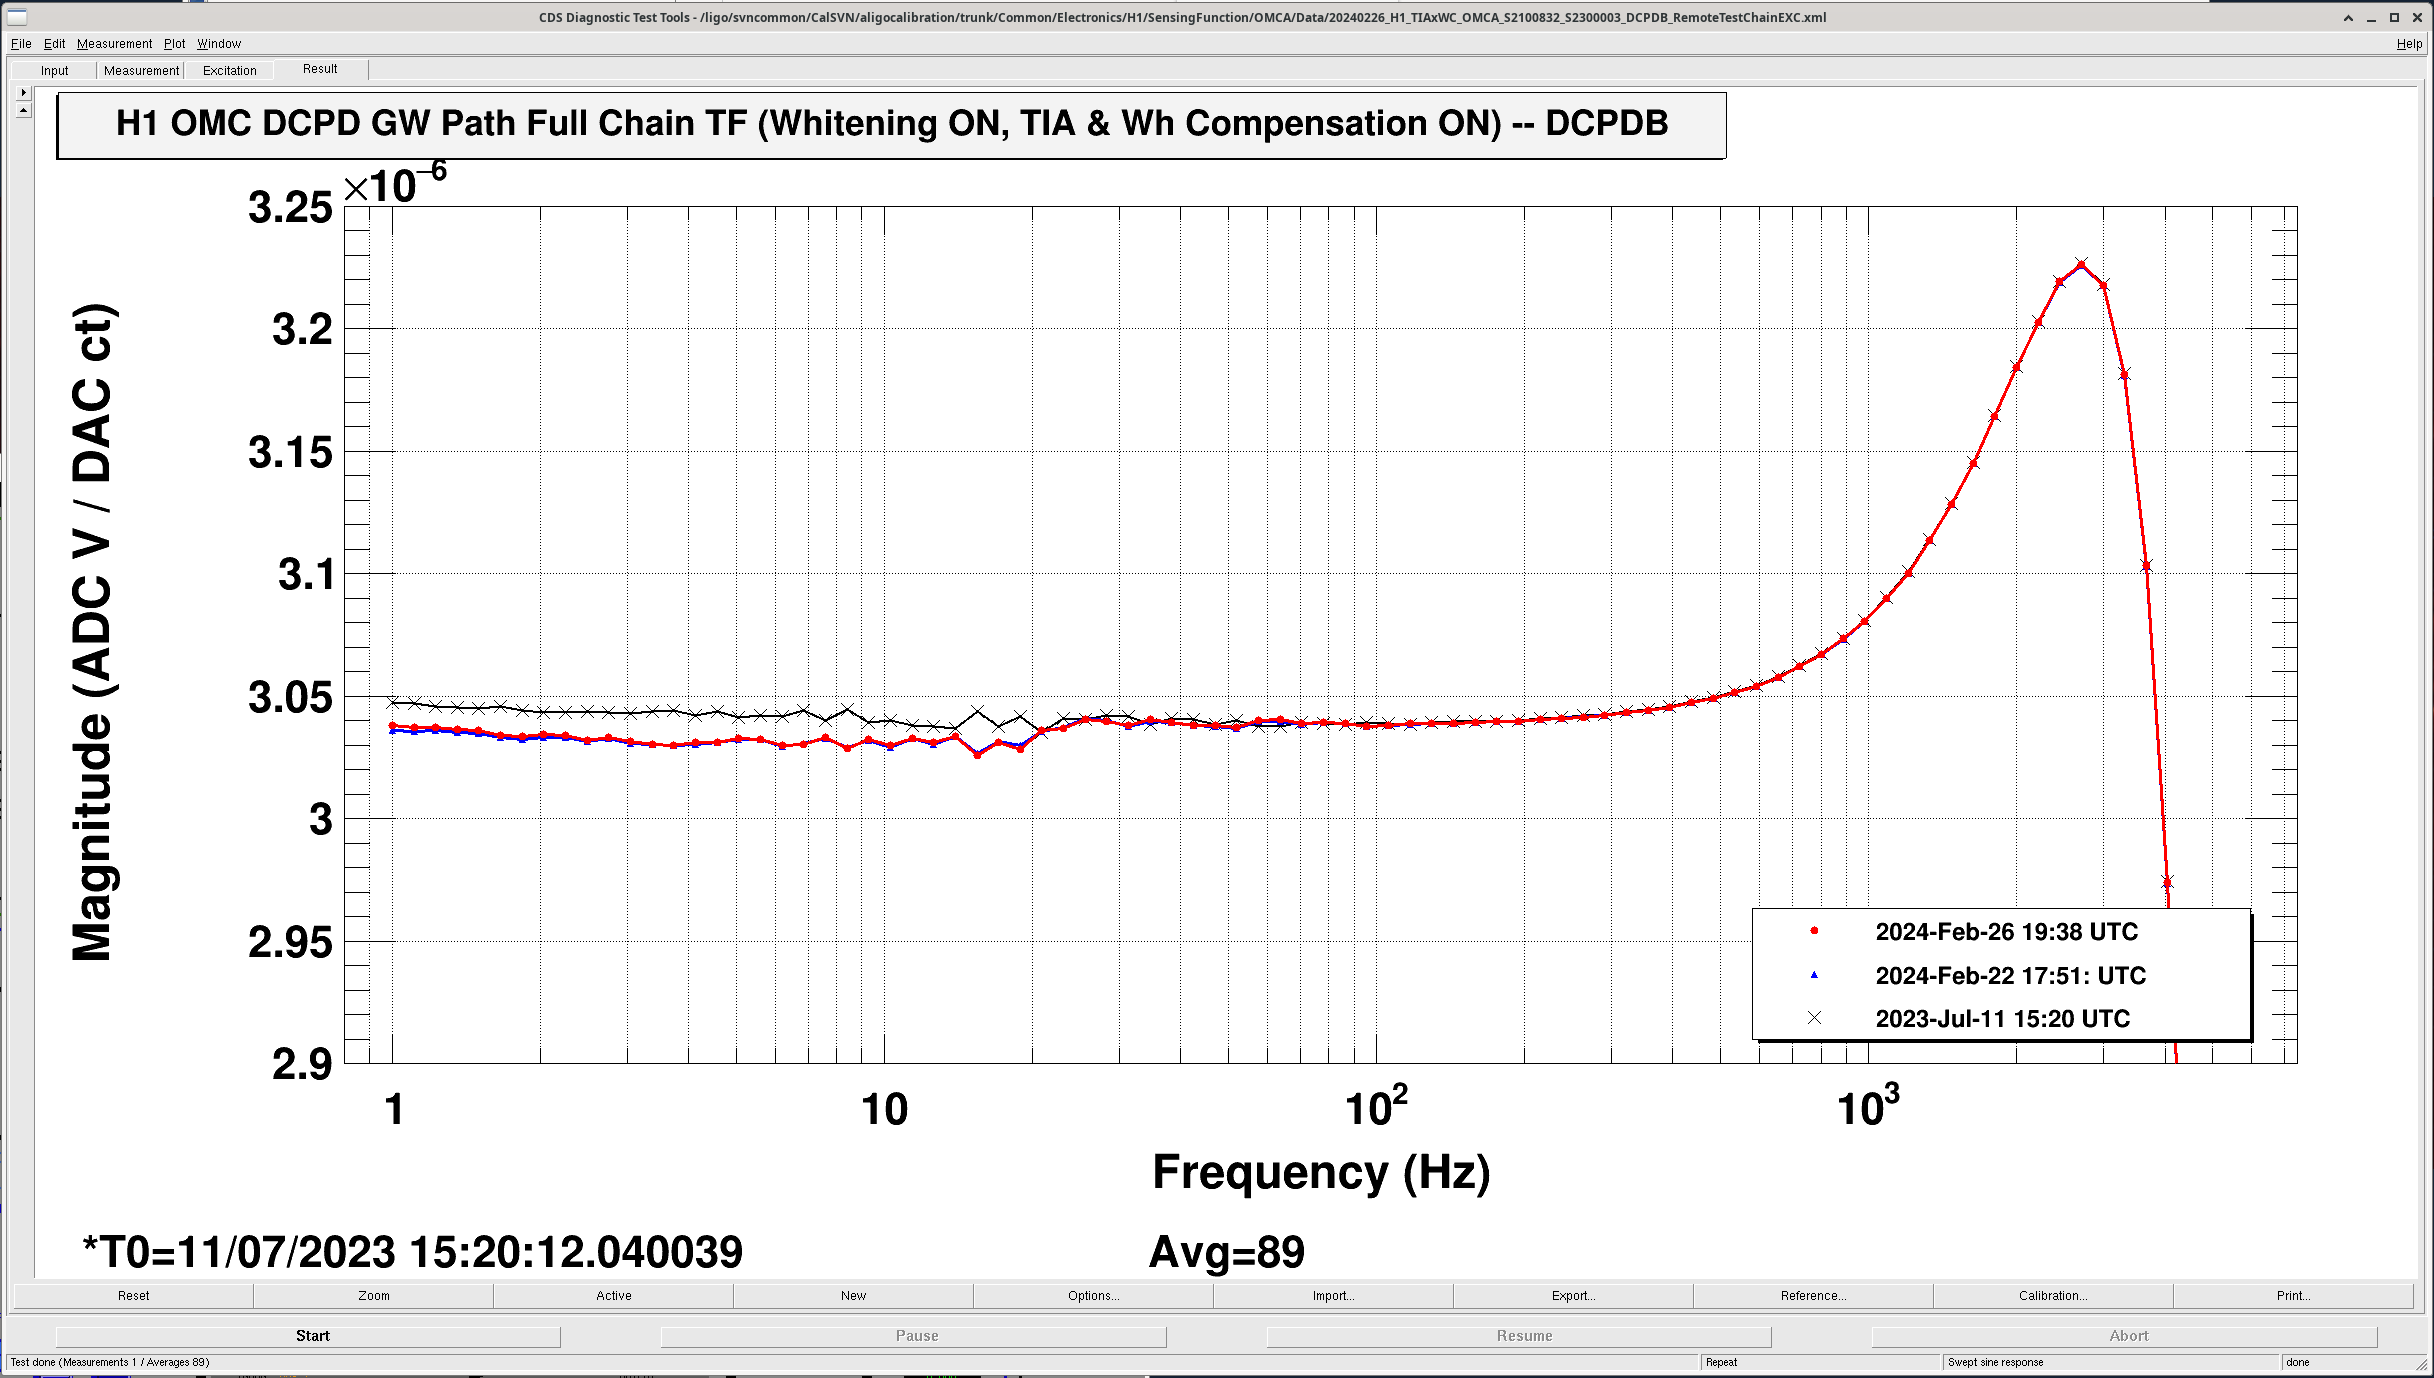
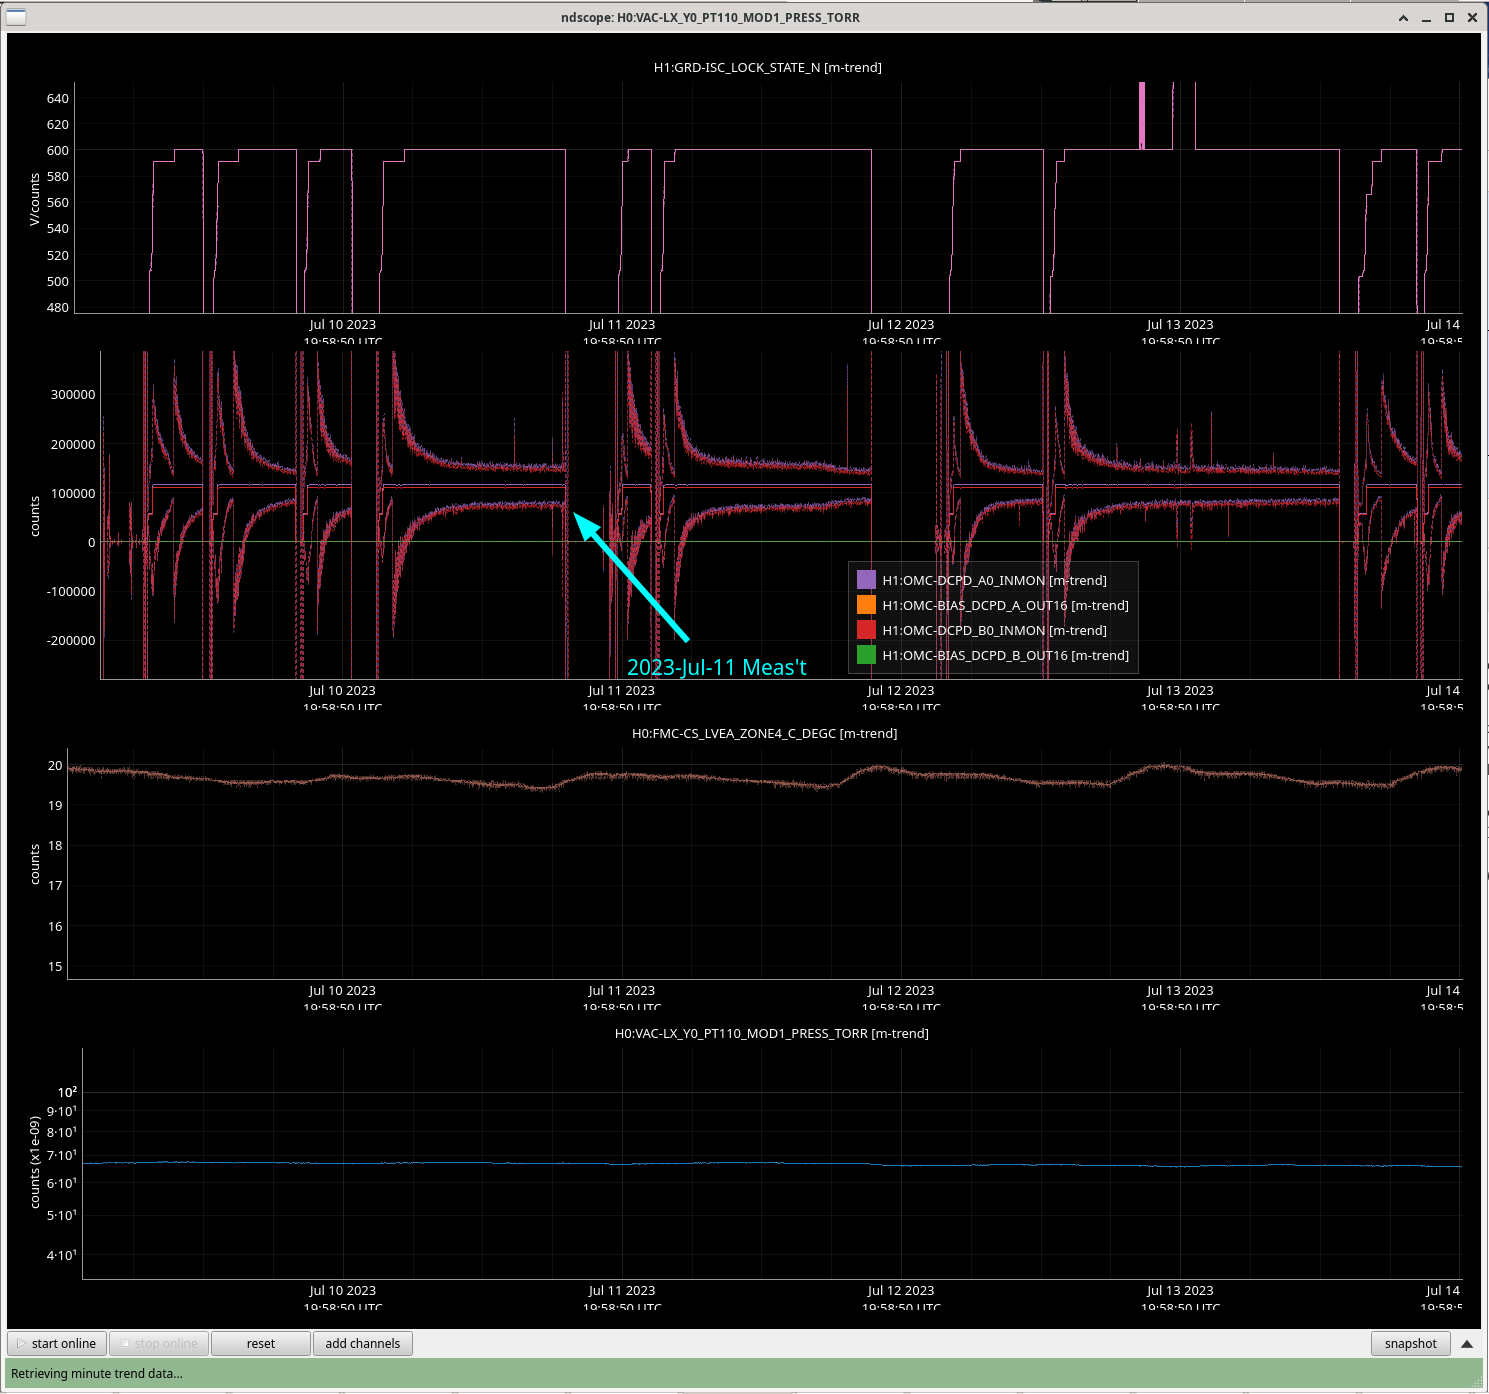
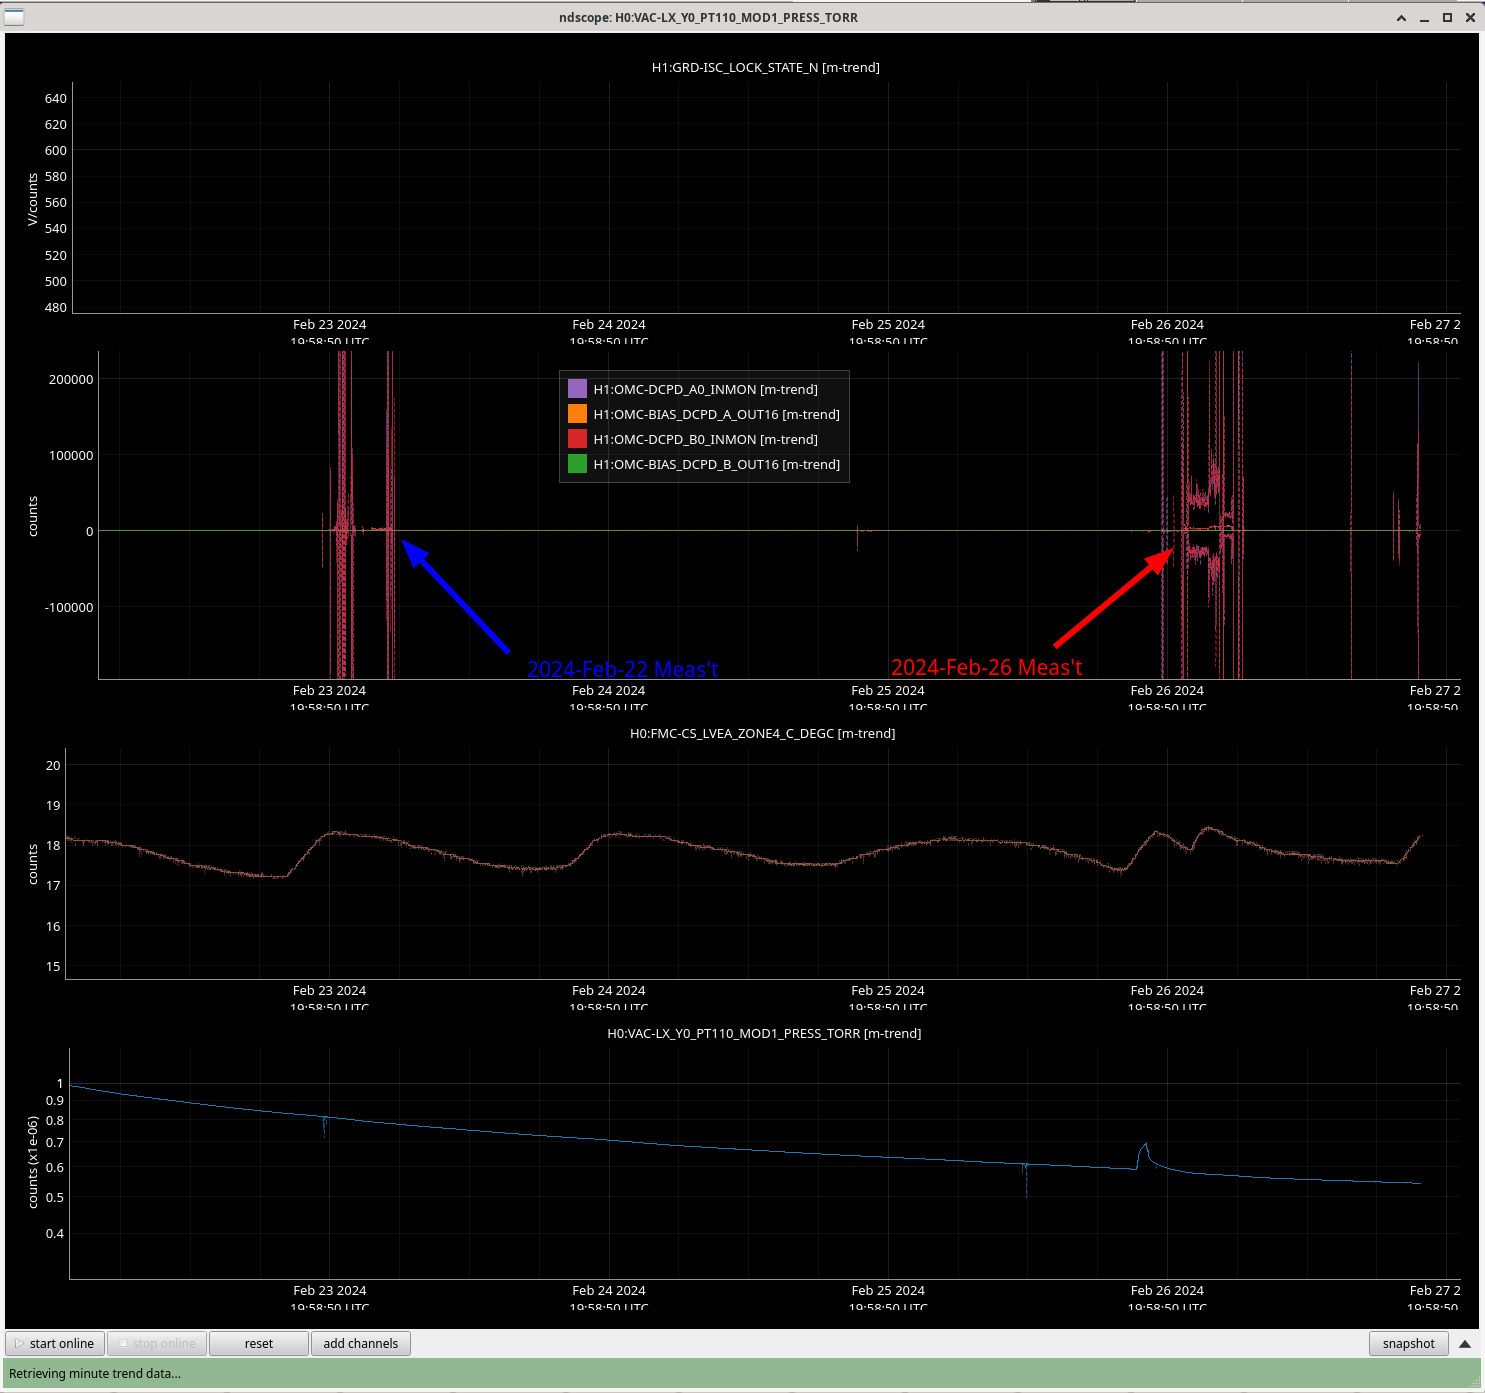
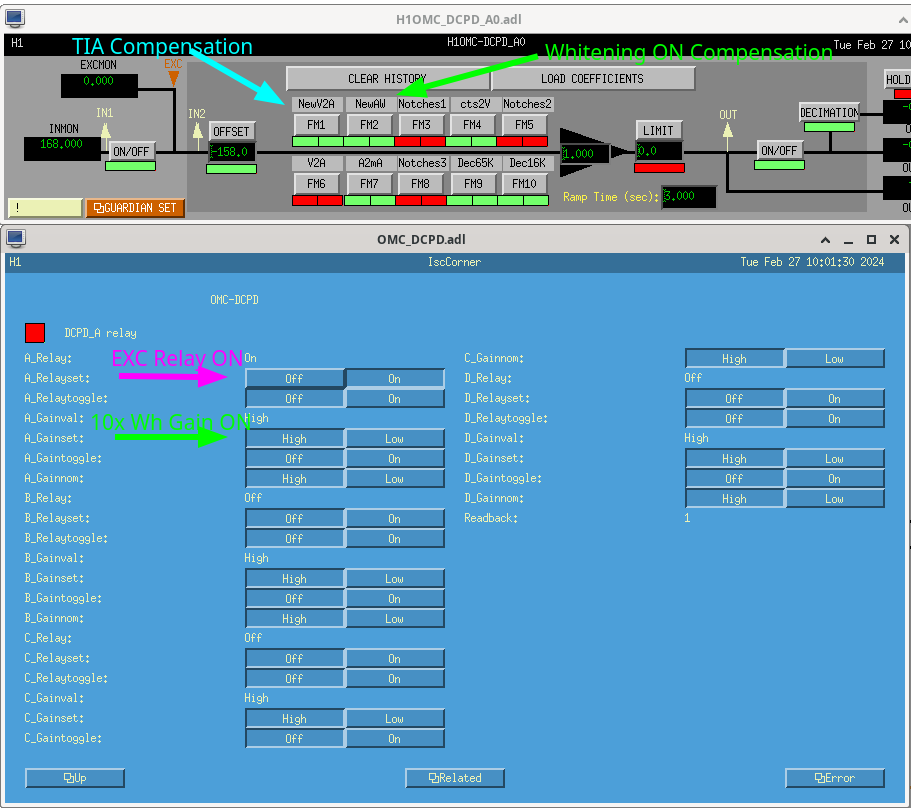
J. Kissel, L. Dartez

%%%%% Executive Summary %%%%%%
Remeasured OMC DCPD electronics chain electronics, including compensation, post Jan/Feb OMC swap. There's a small, 0.3% drop in magnitude below 25 Hz. The first line of suspicion is that the environmental or electrical conditions surrounding the new style of transimpedance amplifier, even though the circuit and enclosure itself hasn't changed, but the investigation has just started.

%%%%% More Info %%%%%%

As y'all know, we swapped out the OMC in Jan / Feb 2024 (see highlights in LHO:75529).
That means we have brand new gravitational wave DCPDs. However, it's *only* the DCPDs that have changed in the GW path. Remember, as of O4, the PD's transimpedance amplifier (TIA) is now inside a separate podded electronics box () that encloses a brand-new style of TIA (see T1900676 and G2200551). This need not -- and hasn't -- changed with the swap, where it used to need be changed because the TIA was built in to DCPDs in pre-O4 OMCs.

So, in principle, we've "just" disconnected the old PDs, and reconnected the new PDs, to the same electronics. As such we don't *expect* the frequency response of the signal paths to change.

However, Keita reports, for the first time in history, that there're no electrical issues with the OMC sensors after the OMC swap in January (LHO:75684). While there have not been issues with the DCPDs themselves, per se, recall, for example, problems in the past including issues with shorts to electrical ground of the OMC's PZTs (IIET:12445). Keita did report that, during this Jan/Feb 2024 vent that he found and mitigated some grounding issues with the preamp though -- the 3 MHz SQZ side-band pick off of the gravitational wave DCPDs had shown some signs of electrical short to ground. Quoted from LHO:75684:
    Inside the chamber on the in-vac preamp, the DB25 shell is connected to the preamp body (which is isolated from the ISI via PEEK spacer). At first DB25 shell and the preamp body was shorted to the ISI table, but this turns out to be via 3MHz cable ultimately connected to the in-air chassis. As soon as both of the 3MHz cables were discunnected from the in-air chassis, preamp body as well as the DB25 shell weren't conducting to the ISI table any more.
I interpret this to mean that there's a *potential* that the electrical grounding on board the OMC and in the GW signal path of the TIA *has* changed from "there used to be an issue" to "now there is no issue."

So with uber-careful, precision calibration group hat on, I repeated the remote, full-chain measurements of the OMC DCPD GW path -- including the digital compensation for their frequency response -- that I took on July 11 2023 -- see LHO:71225.

Attached are the results -- the magnitude of the transfer function -- for DCPD A and DCPD B. There are three traces:
    - The former measurement with the previous OMC DCPDs, on 2023 Jul 11.
    - The first measurement with the new OMC DCPDs connected, on 2024 Feb 22 (last week Thursday)
    - The second measurement with the new OMC DCPDs connected, on 2024 Feb 26 (yesterday, 4 days later)

We do see some small change ([3.05e6 / 3.04e6 - 1]*100 = 0.3% reduction) in the magnitude below about 25 [Hz].

Preliminary investigations cover a few things that might cause this. Because of where the "wiggle of change" is happening at 25 [Hz] -- right at the RLC complex poles, I immediately suspect the environmental sensitivity of giant ~2.4 [Henry] inductors and/or the electrical grounding situation surrounding the TIA.

Regarding the environmental situation:
    - The OMC and HAM6 are back mostly at ultra high vacuum (~1e-6 [Torr], when its typically 1e-7 [Torr]) :: (so, any physical distortions of the enclosure that would change the geometry of inductor should be similar)
    - The TIA has been powered on for several days even prior to the 2024 Feb 22 measurement :: (so the dominant thermal load on the circuit -- the bias voltage -- should have had time to thermalize), and
    - LVEA temperatures are stable, albiet 2 [deg C] cooler  :: (I'm not sure if a 2 [deg C] in the external environment will have such an impact on the PDs)

Of course, it's an odd coincidence that both DCPDs chain response changed in the same direction and magnitude -- maybe this is a clue.
The fact that the 2024-Feb-22 and 2024-Feb-26 measurements agree indicate that:
    - The change is stable across a few days, implying that
    - The TIA circuit has been on for a while, and circuit is thermalized

Also attached are trends of these environmental conditions during the 2023-Jul-11 and both 2024-Feb measurements.

Also also attached are the two relevant MEDM screens showing the OMC DCPD A0 filter bank configuration during the DCPD A measurement (OMC DCPD B0 is the same), and the Beckhoff switch states for the excitation relay in the TIA and the whitening gain relay in the whitening chassis.

%%%%% What's next? %%%%%%
    (1) Ask Keita / Koji / Ali some details about the DCPD chain that I've missed having been out.
        (a) Are you sure you plugged in the transmitted PD into DCPD A and the reflected PD into DCPD B, the configuration we'd had with the previous OMC?
        (b) When were the electronics powered on?
        (c) Can you confirm that other than the DCPDs and the cable connecting them to the TIA, no electronics have changed?

    (2) Using the same remote measurement, configure the system to measure the TIA response by itself to see if there's a change and if so if it matches this overall chain change.

    (3) If (2) doesn't work, use the remote measurement tool to measure the TIA and the Whitening together, take the ratio of (3)/(2) to see if the whitening chassis response has somehow changed.

    (4) If the answers to (1), (2), or (3) don't solve the mystery, or provide a path forward, then we ask "does this *matter*?" A reminder -- any change in the frequency dependence of the OMC DCPD GW path electronics that's not compensated is immediate and direct systematic error in the overall DARM calibration if not accounted for. So the question is does 0.3% error below 25Hz matter, or is it beneath the uncertainty on the systematic error in calibration that's present already for other reasons? To answer this question, we'll resurrect code from G2200551, LHO:67018, and LHO:67114 which creates an estimate of the impact on the calibration's *response* function systematic error, i.e. creating an "eta_R."

    (5) If the resulting estimate of eta_R is big compared with the rest of systematic error budget, then it matters, and we're left no other course of action than to out to the HAM6 ISC racks with our trusty SR785, remeasure the analog electronics from scratch, fit the data, and update the compensation filters a la LHO:68167.
Here's the debrief I received from Koji and Keita:

(a) Are you sure you plugged in the transmitted PD into DCPD A and the reflected PD into DCPD B, the configuration we'd had with the previous OMC?

Koji says ::
    The now installed OMC is so-called Unit 1.
    - 40m eLOG 18069 covers the PD installation
        . The PD in transmission is B1-22
        . The PD in reflection   is B1-23
    - PD datasheet vendor provided can be found in E1500474

    - Test Results for the OMC and its PDs can be found in E1800372

(b) When were the electronics powered on?

Keita says "The TIA was only briefly powered down and disconnected from its in-air whitening chassis while I was checking for connection to electrical ground. Otherwise it has been powered on."

Given that doors were closed on 2024-Feb-07 (see LHO:75811 and LHO:75810), the TIA would have been powered on for at least 15 days prior to my first measurement on 2024-Feb-22.
So we can rule out that this discrepancy might have been because the electronics had not yet have been at thermal equilibrium.

(c) Can you confirm that other than the DCPDs and the cable connecting them to the TIA, no electronics have changed?

According to Appendix D of T1500060 (P180) the former, now de-installed, H1 OMC from Aug 4, 2016 (aka Unit 3) had the onboard cable twisted.
Comparing this with the past LLO unit (aka Unit 1, now installed to LHO), I expect that the role of DCPD A and B are now swapped from the previous OMC (Unit 3).
I. Abouelfettouh, J. Kissel, O. Patane, B. Weaver
Executive Summary: The first article BBSS transfer functions look great. Though there is some confusion about the M1 P 2 P modeled transfer functions drastically disagreeing with the measured TFs, there is a consistent story between
- the adjustments to the mechanics that were made during construction and
- deviations from the "production" model parameter set that could re-create those construction adjustments.
Further discussion will be had with the assembly / design team as to the future course of action.
Kissel suggests that -- even as the first article stands now -- the resulting measured transfer functions with the mechanical adjustments would/should happily meet A+ O5 requirements.
%%%%%%%%%%% Begin kLOG (You missed these...) %%%%%%%%%%%%%%
I got a debrief yesterday from Betsy, Oli, and Ibrahim of the comparison between
- measured transfer function results from the first article construction and
- what had been deemed the production model parameter set for the BBSS,
i.e. what's discussed in LHO:75787.
The existing "production" model parameter set starts from Mark's update to the BBSS parameter set post-final-design after adjusting for the production wire thicknesses (see TripleLite2_mark.barton_20211212bbss_production_triplep.m, changed at rev 11625, circa Sep 2023). Oli successfully copied over to the usual matlab formating to create bbssopt.m (created at rev 11734, circa Jan 2024).
At the start of the debrief, there were (only!!) 3 outstanding issues / questions they had:
(1) The overall magnitude scale for all DOFS for all measured transfer functions was a consistent factor of ~3.15x more than the model estimates,
(2) After browsing through the EULER-basis drive to OSEM-basis response plots, and some of the off-diagonal EULER-basis showed little-to-no coherence, and
(3) The measured M1 Pitch to Pitch transfer function's frequency response was significantly different than the model.
For (1), this is typically a sign of a mis-calibration of the data. We reviewed the calibration of the measured data from the processing script, plotBBSS_dtttfs_M1.m, created by Oli and Ibrahim in Nov 2023. The DTT templates that measure the transfer function use the pre-calibrated output of the sensors for response channels i.e. the channels come in units of microns and microradians, so they only need a factor of 1e-6 [meters / micrometers]. The only substantial thing that needs calibrated into physical units during post-processing is the excitation. The review of the calibration of the exciation revealed nothing suspicious in the script based on our current expected knowledge of chain
- the test stand electronics (an 18-bit DAC = 20 / 2^18 [V/ct]),
- BBSS coil driver (a TTOP coil driver, coupled with a BOSEM coil = 11.9 [mA/V]),
- 10x10 magnet strength (1.694 [N/A]).
- (lever arms and numbers of actuators are pre-calibrated out via the EUL2OSEM matrix, generated by make_susbbss_projections..m, and installed in EPICs)
The above factors result in an overall calibration of 1 / 1.5405 [(m/N) / (um/DAC ct) or (rad/N.m) / [urad/DAC ct]] that's displayed in the legend of each of the plots from LHO:75787.
In the end, we were more interested in understanding (2) and (3) rather than getting to the bottom of the calibration. Further, the test stand is some old, pre-aLIGO concoction whose records and modifications are unclear. So we figure we just move on, accepting that we need to fudge the data by the extra factor of 3.15x. We'll get serious about figuring it out if there's still such a discrepancy after moving the BBSS over to the production H1 system.
For (2), all concerns can we waived off with expectations.
(a) The first plot of concern was the P to F1F2F3 plot (page 17 of 2024-01-05_1000_X1SUSBS_M1_ALL_TFs.pdf), in that the magnitude of the F2 and F3 TFs were low and/or noisy. This is expected because F2 and F3 OSEMs are along the (center of mass / axis of pitch rotation) of the BBSS's top mass. So they see no pitch by construction (for better or worse).
(b) The second collection of plots of concern were the off-diagonal DOFs,
(i) showing noise and/or
(ii) the opposite -- showing well-resolved cross-coupling in DOFs that we *don't* want cross-coupled.
We shouldn't be mad about (i) -- e.g. page 7 showing incoherence between L response to V drive and V response to L drive. What power is resolved in those transfer functions -- typically on/around resonances -- is because the TFs were taken undamped an in air. So there's just a ton of movement that an FFT might / cross-correlation might *think* is coherent with the drive, but it's really not.
We looked closer at any of the off-diagonal TFs that *were* resolved, (ii) -- e.g. page 9 showing well-resolved cross-coupling between R response to V drive and V response to R drive. In each of these TFs, we found that the magnitude of the cross-coupling, off-diagonal TF was less, if-not-MUCH less that the on-diagonal TF, which is good. Where it was close, it sort-of "is what it is." Little attention has been typically paid to mitigating the off-diagonal transfer functions during the design phase of LIGO suspensions to-date. Further, they often are a result of the unique construction of each individual instantiation of the suspension type. There's no much we can do about it post construction, and what we *do* do if it proves problematic to the detector, is dance around the problem with fancy controls techniques if needed.
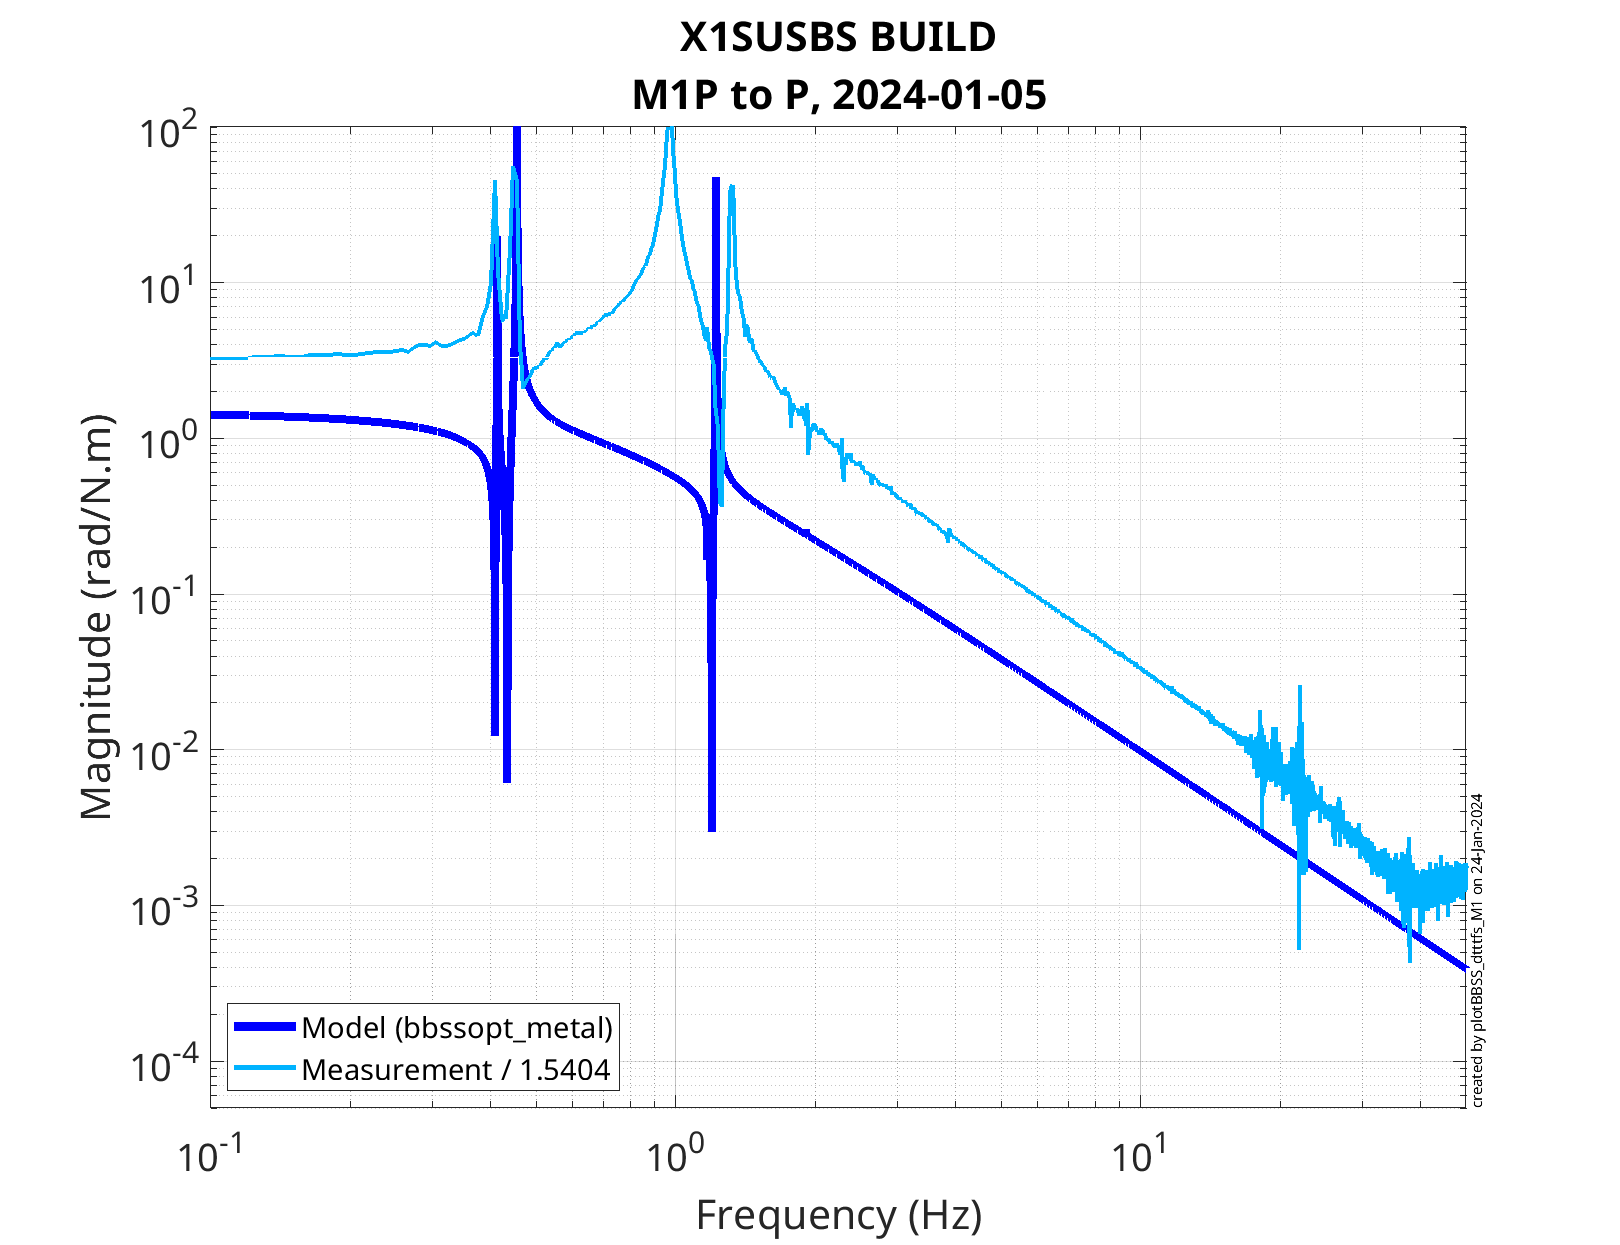
For (3), we arrive at the meat of this aLOG :: The *model* of the M1 Pitch to Pitch transfer function looked very weird to me. Betsy mentions the during the construction of the first article they
(a) found a discrepancy between the fastener model vs. measured mass budget that resulted in an unclear relationship between the center of mass of each stage and their suspension points (typically called the "d" parameters)
(b) acknowledged there would be uncertainty in the location of the suspension point for the bottom mass / dummy optic given the wire-loop + optic prism system since the final distances between masses have not been measured.
This, coupled with the fact that no *other* DOFs disagreed with the model besides P to P, led me to suspect the model parameters that only impact the pitch dynamics may be incorrect:
(i) each stages' separation between suspension point and center of mass, the "d" parameters, and
(ii) the pitch moments of inertia.
For a reminder of the physical meaning of all of the triple suspension parameters, see T040072.
As such, using the bbssopt.m "production" or "Final Design" (FD) parameter set as starting point, we tweaked these parameters by 10%-ish or factors of 2 to gather intuition of of how it would impact the response of the P to P transfer function. As a result, we have come to the conclusion that, in order to explain the data, we need to
- increase "d1" by + 5 [mm]. This is the separation between the top (M1) mass center of mass and it's M1 to to M2 blade tip heights. In the absolute sense, this is increasing the "physical" d1 from -0.5 [mm] to +4.5 [mm], and
- increase "d4" by 1.5 [mm]. This is the separation between the bottom (M3) mass / dummy optic center of mass and the wire/prism break-off point. In the absolute sense, this is increasing the "physical" d4 from +2.6 [mm] to +4.1 [mm].
Check out the attached plots which demonstrate this.
Citing discussion of overall scale (1) from above, all *measured* transfer functions have been scaled to the model by a factor of (1 / 3.15). This just makes comparing model to measured frequency response a lot more clear.
First attachment :: comparison between the final design model parameters and a variety of reasonable deviations of d1 between *decreased* by 2.5 [mm] and *increased by 5 [mm]. You'll notice that once d1 surpasses +1.0 [mm], the transfer function starts to look more like a standard triple suspension's transfer funtion. a d1 of FD + 5.0 [mm] lines up well with the upper two resonances of the measured data, but reduces the frequency of the lowest two L and P modes to below the data.
Second attachment :: comparison between the final design model parameters and a variety of reasonable deviations of d4. You'll notice that d4 really only have an impact on the lowest two L and P modes.
Third attachment :: comparison between the final design model parameters and a variety of reasonable deviations of the top (M1) mass' moment of inertia, the I1y parameter.
Fourth attachment :: comparison between the final design model parameters and a variety of reasonable deviations of the middle (M2) mass' moment of inertia, the I2y parameter.
Fifth attachment :: comparison between the final design model parameters and a variety of reasonable deviations of the bottom (M3) mass' moment of inertia, the I3y parameter.
None of the modeled changes to the moment of inertia -- shown in the third, fourth, and fifth attachments -- show promise in reproducing the measured results.
Sixth and Final attachment :: comparison between the final design model parameters and one with only d1 increased by +5 [mm], and d4 increased by +1.5 [mm].
The modified model in this last attachment fits the data the best, so we conclude that the issues with mechanical construction (3a) and (3b) are consistent with the measured data :: the reconfigured mass budget needed from fastener issues resulted in a deviation from design value for d1, and the imprecision of the mass-to-mass distances and wire-loop / prism system resulted in a roughly ~2 [mm] slop for this assembly.
%%%%%%%%%%% End kLOG (You missed these...) %%%%%%%%%%%%%%
Big Picture Systems Level Commentary by Jeff :: If these measured transfer functions end up being the reality of the final frequency response of the BBSS -- this will be totally fine. The pitch isolation one gets above the resonances (defined mostly by the moment of inertia) is the same, the lowest L and P modes are sufficiently low, and the details of where the rest of the resonances land are totally inconsequential / amenable to a damping and global control design.
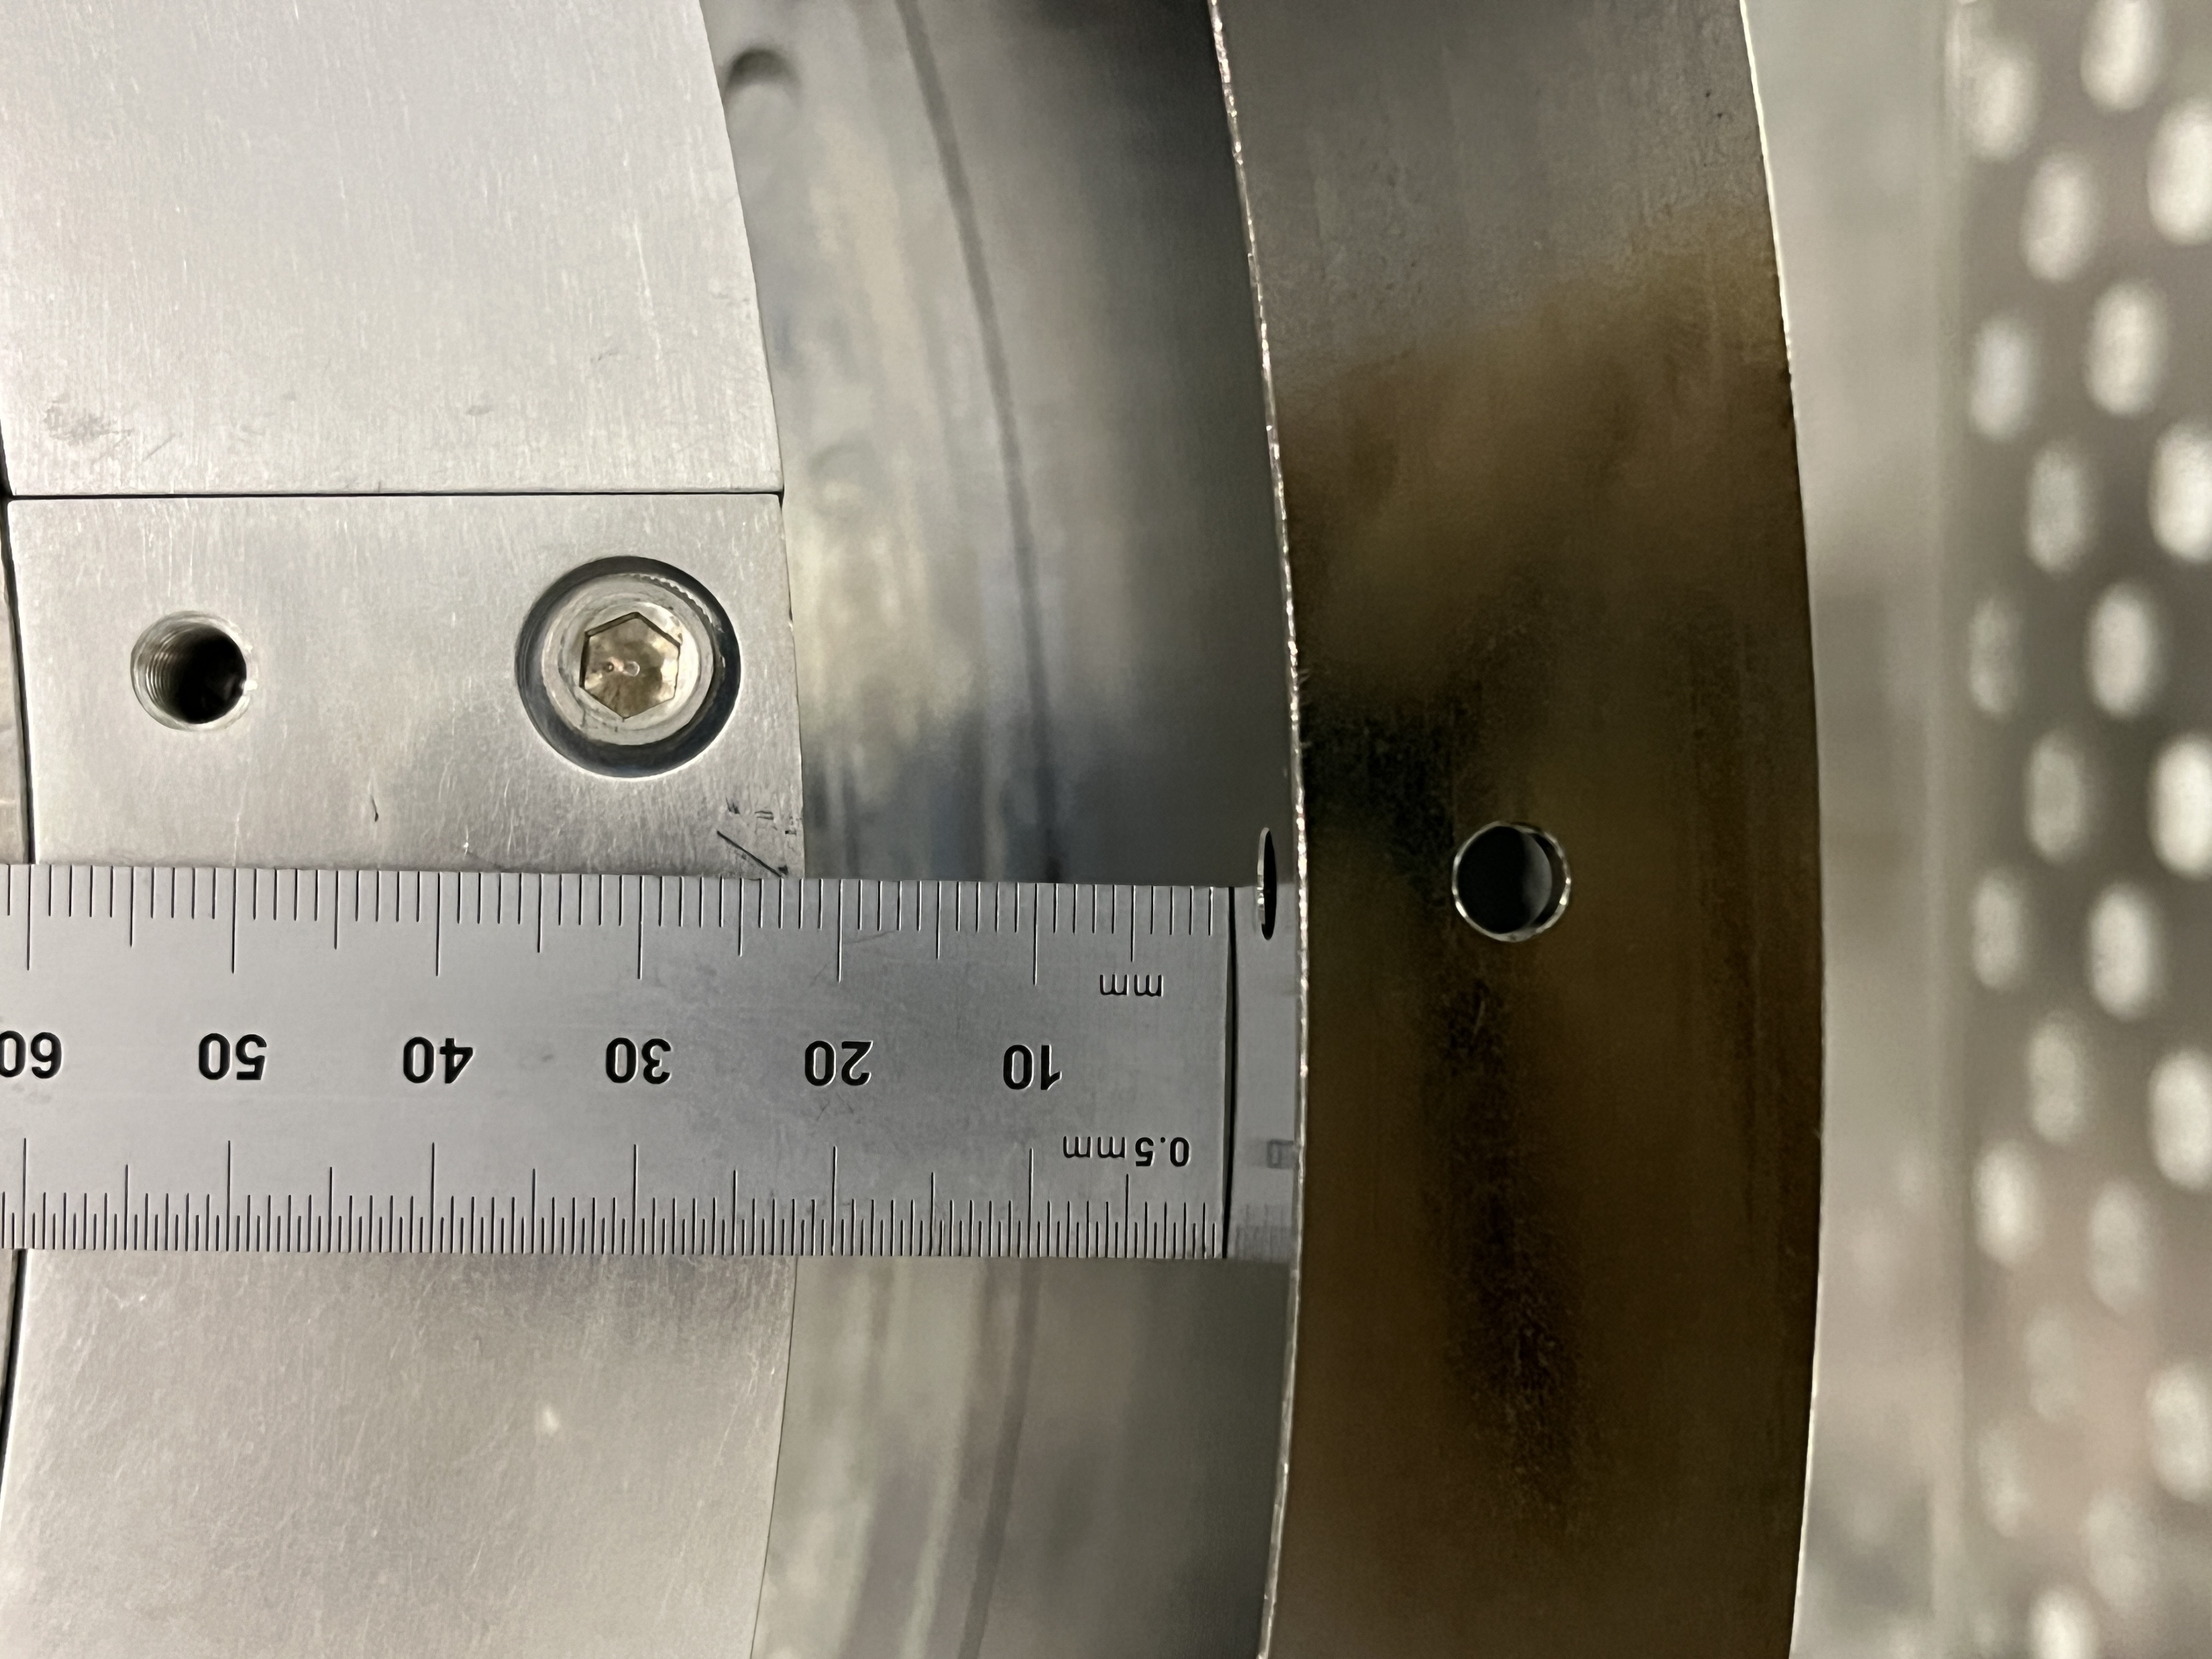
Today, Ibrahim and I made measurements of the BBSS Suspended masses compared to the dimensions shown on the various sheets of BBSS TOP LEVEL ASSEMBLY drawing D1900628. The BBSS is still nicely hung from the last RAL visit, very little pitch error by eye. It seems that all of the Top Mass, Penultimate Mass and Bottom Dummy Mass are 2mm low compared to the structure, together in the same direction, all ~2mm low. On the various sheets it shows reference nominal dimensions which we compared the as-built to (see attached). So, it seems that any overall height adjustment to the new suspension, if needed, would be in the upper stages.
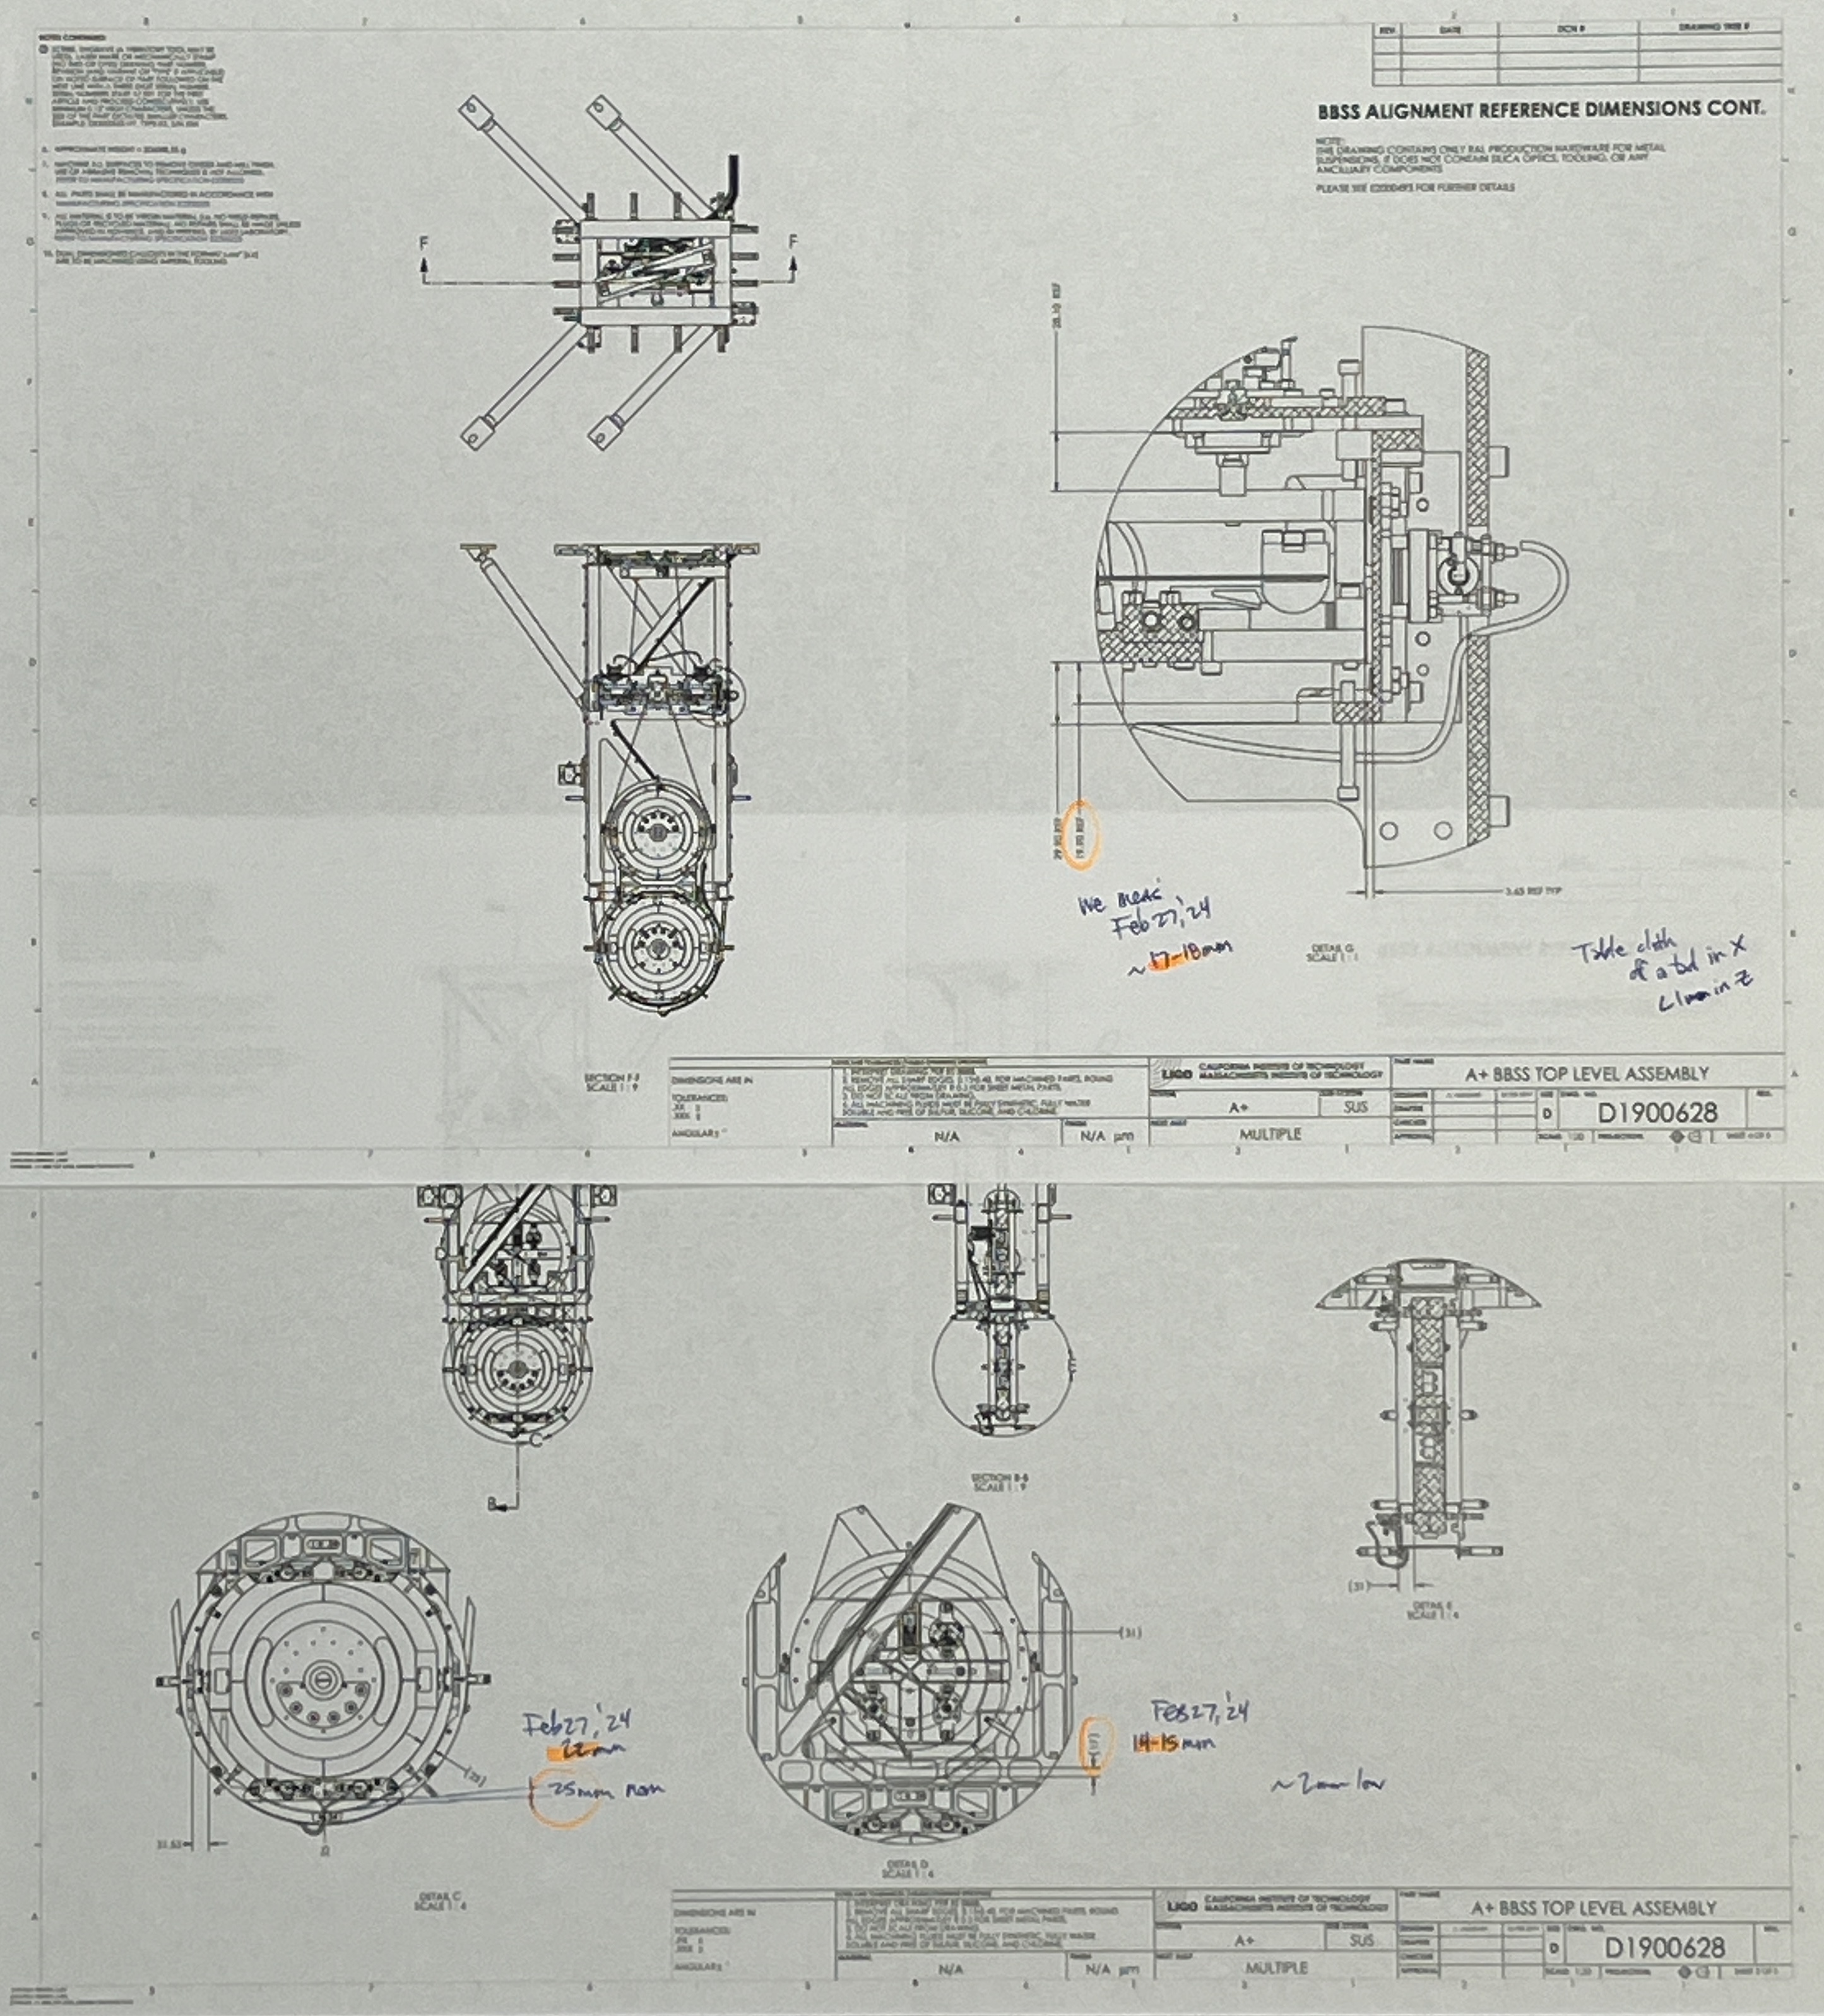
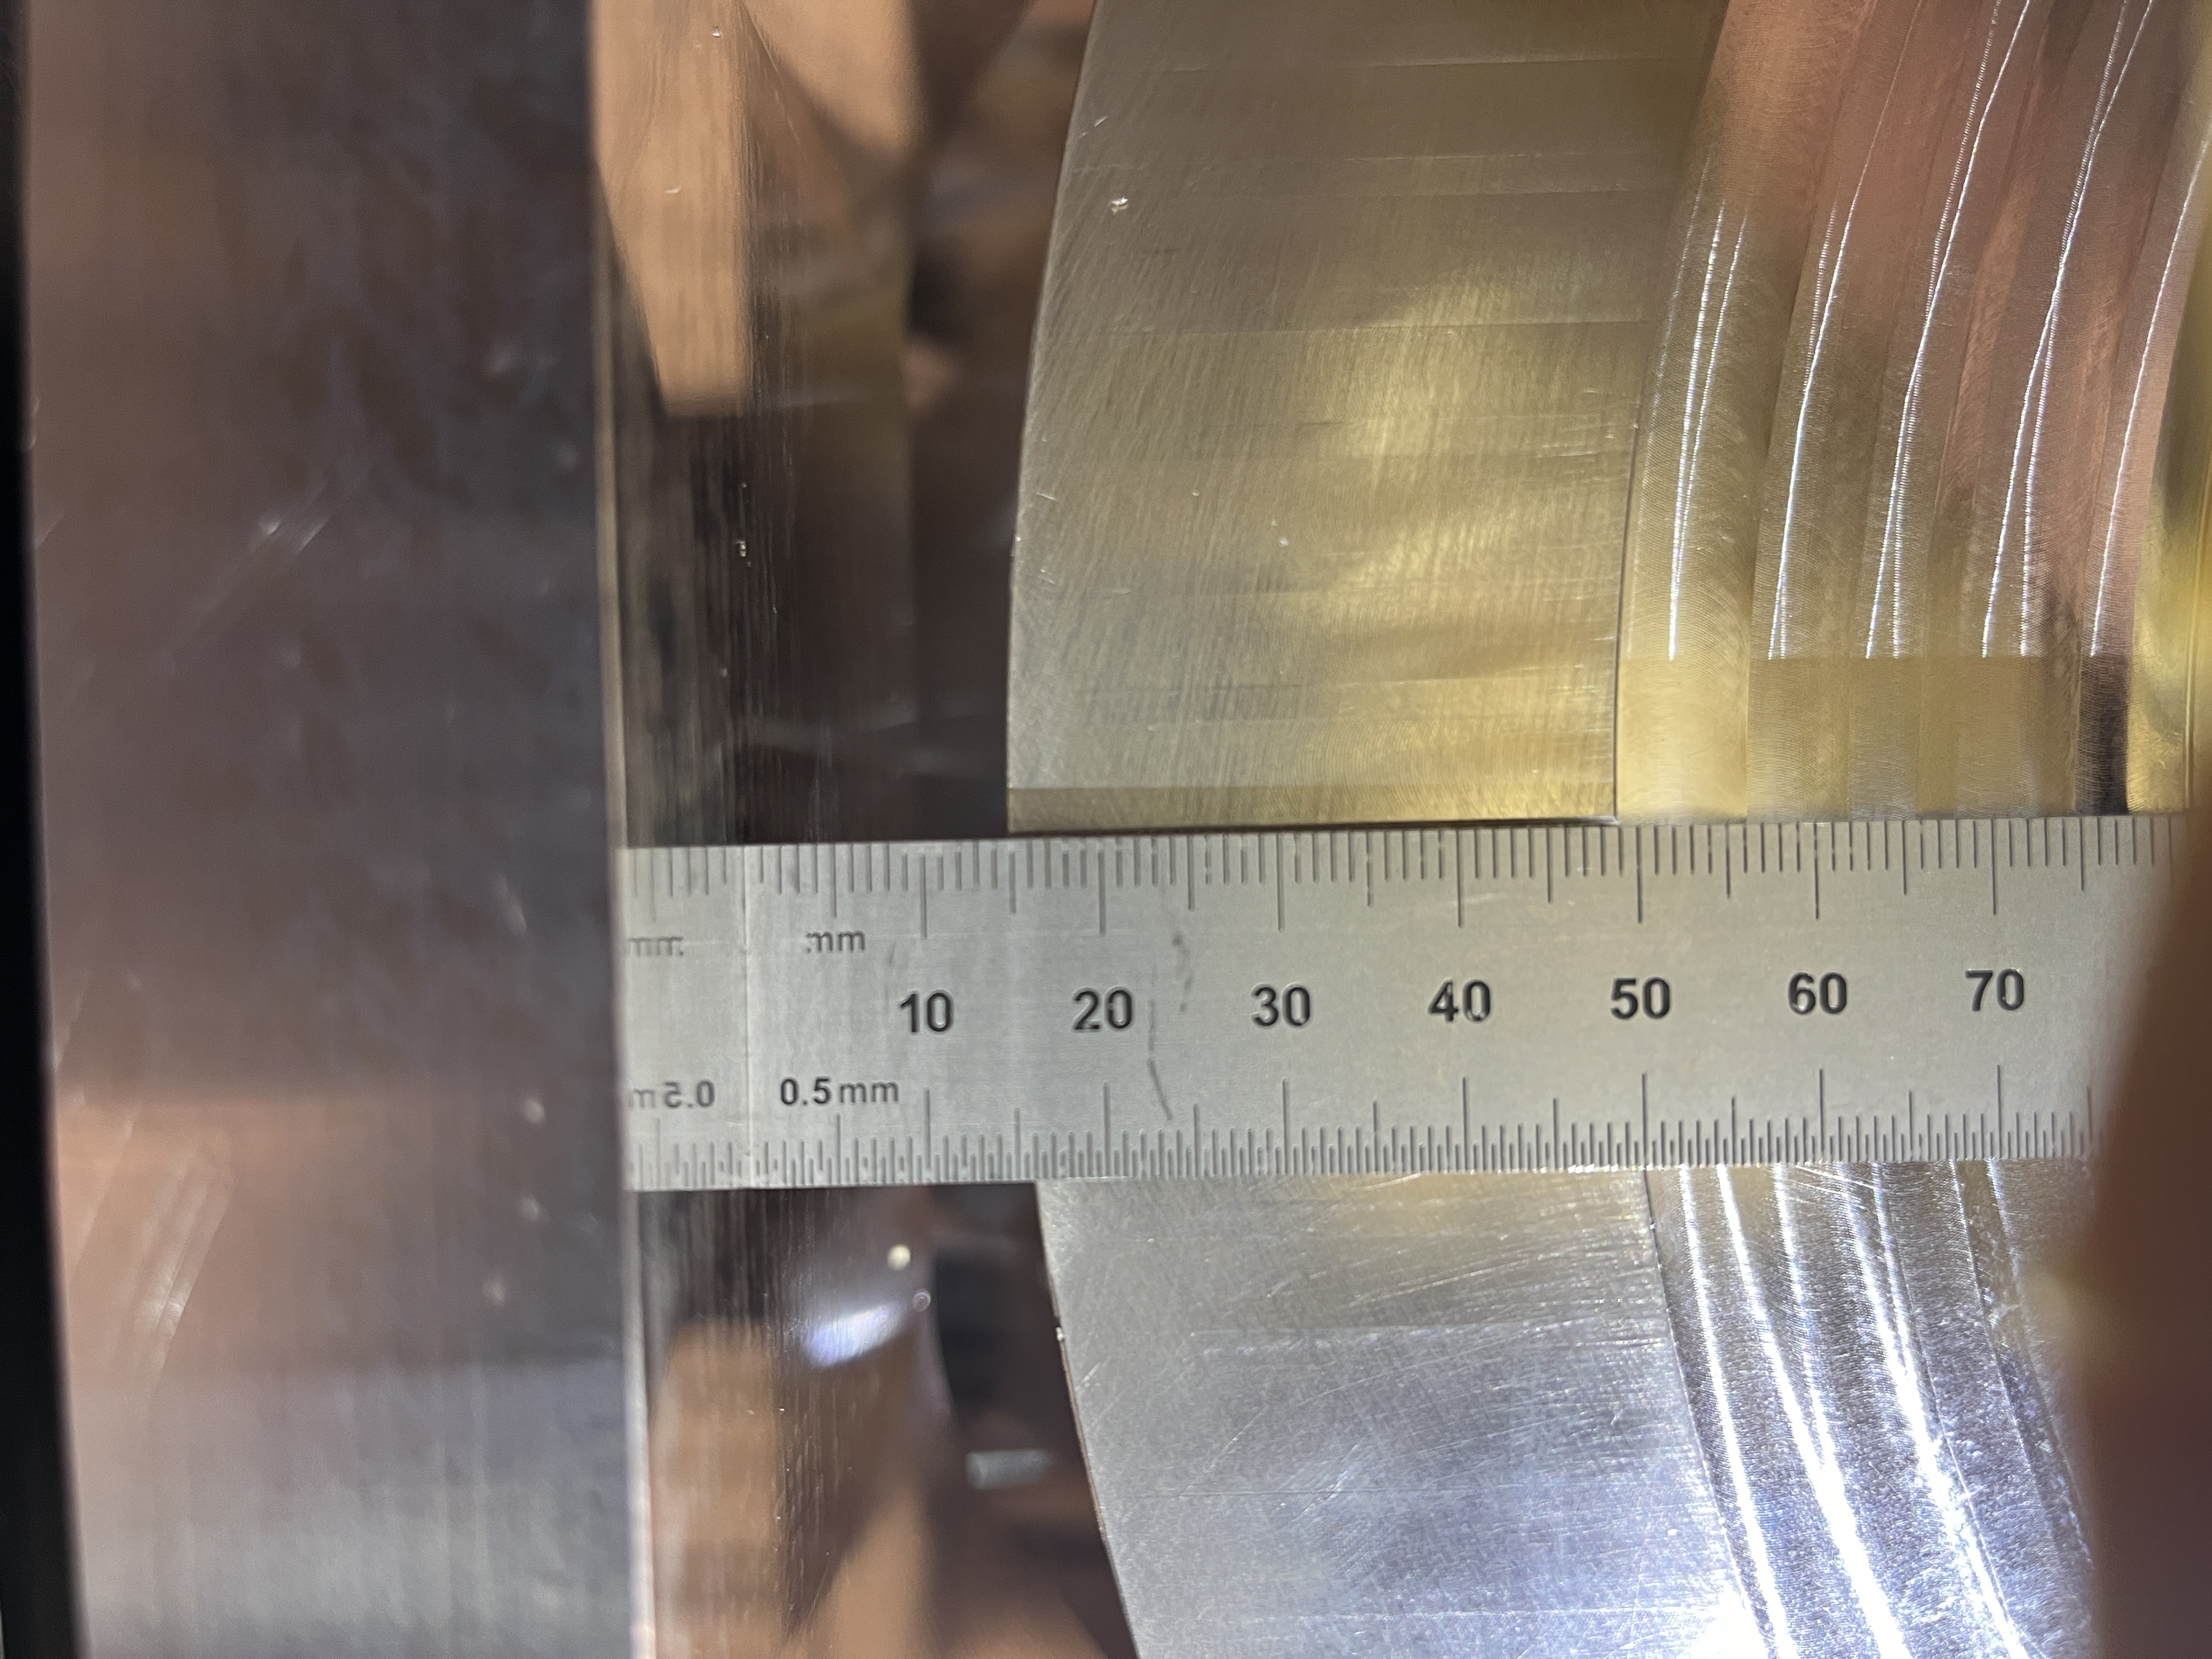
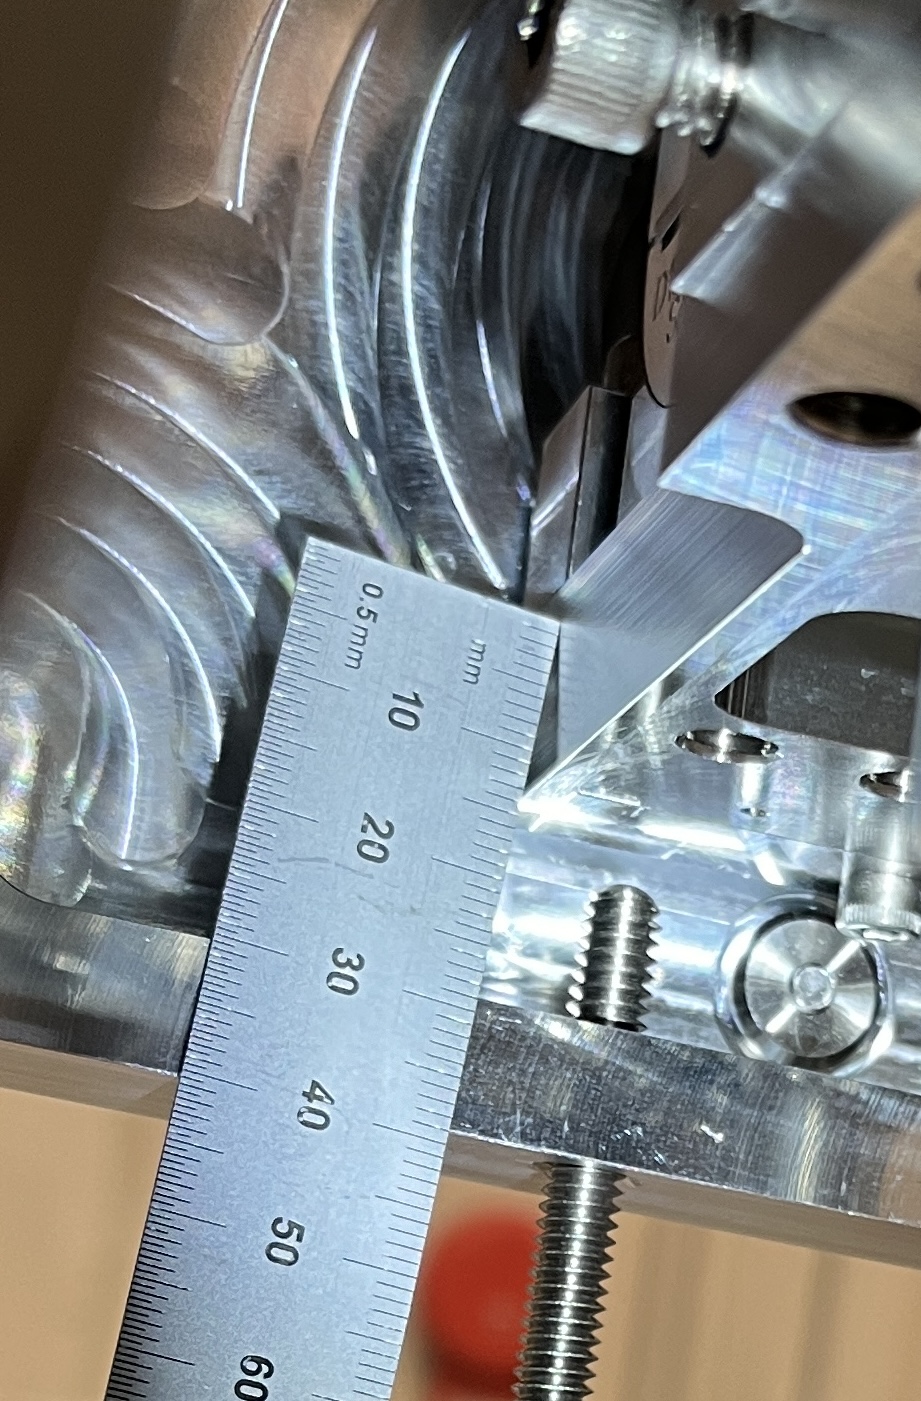
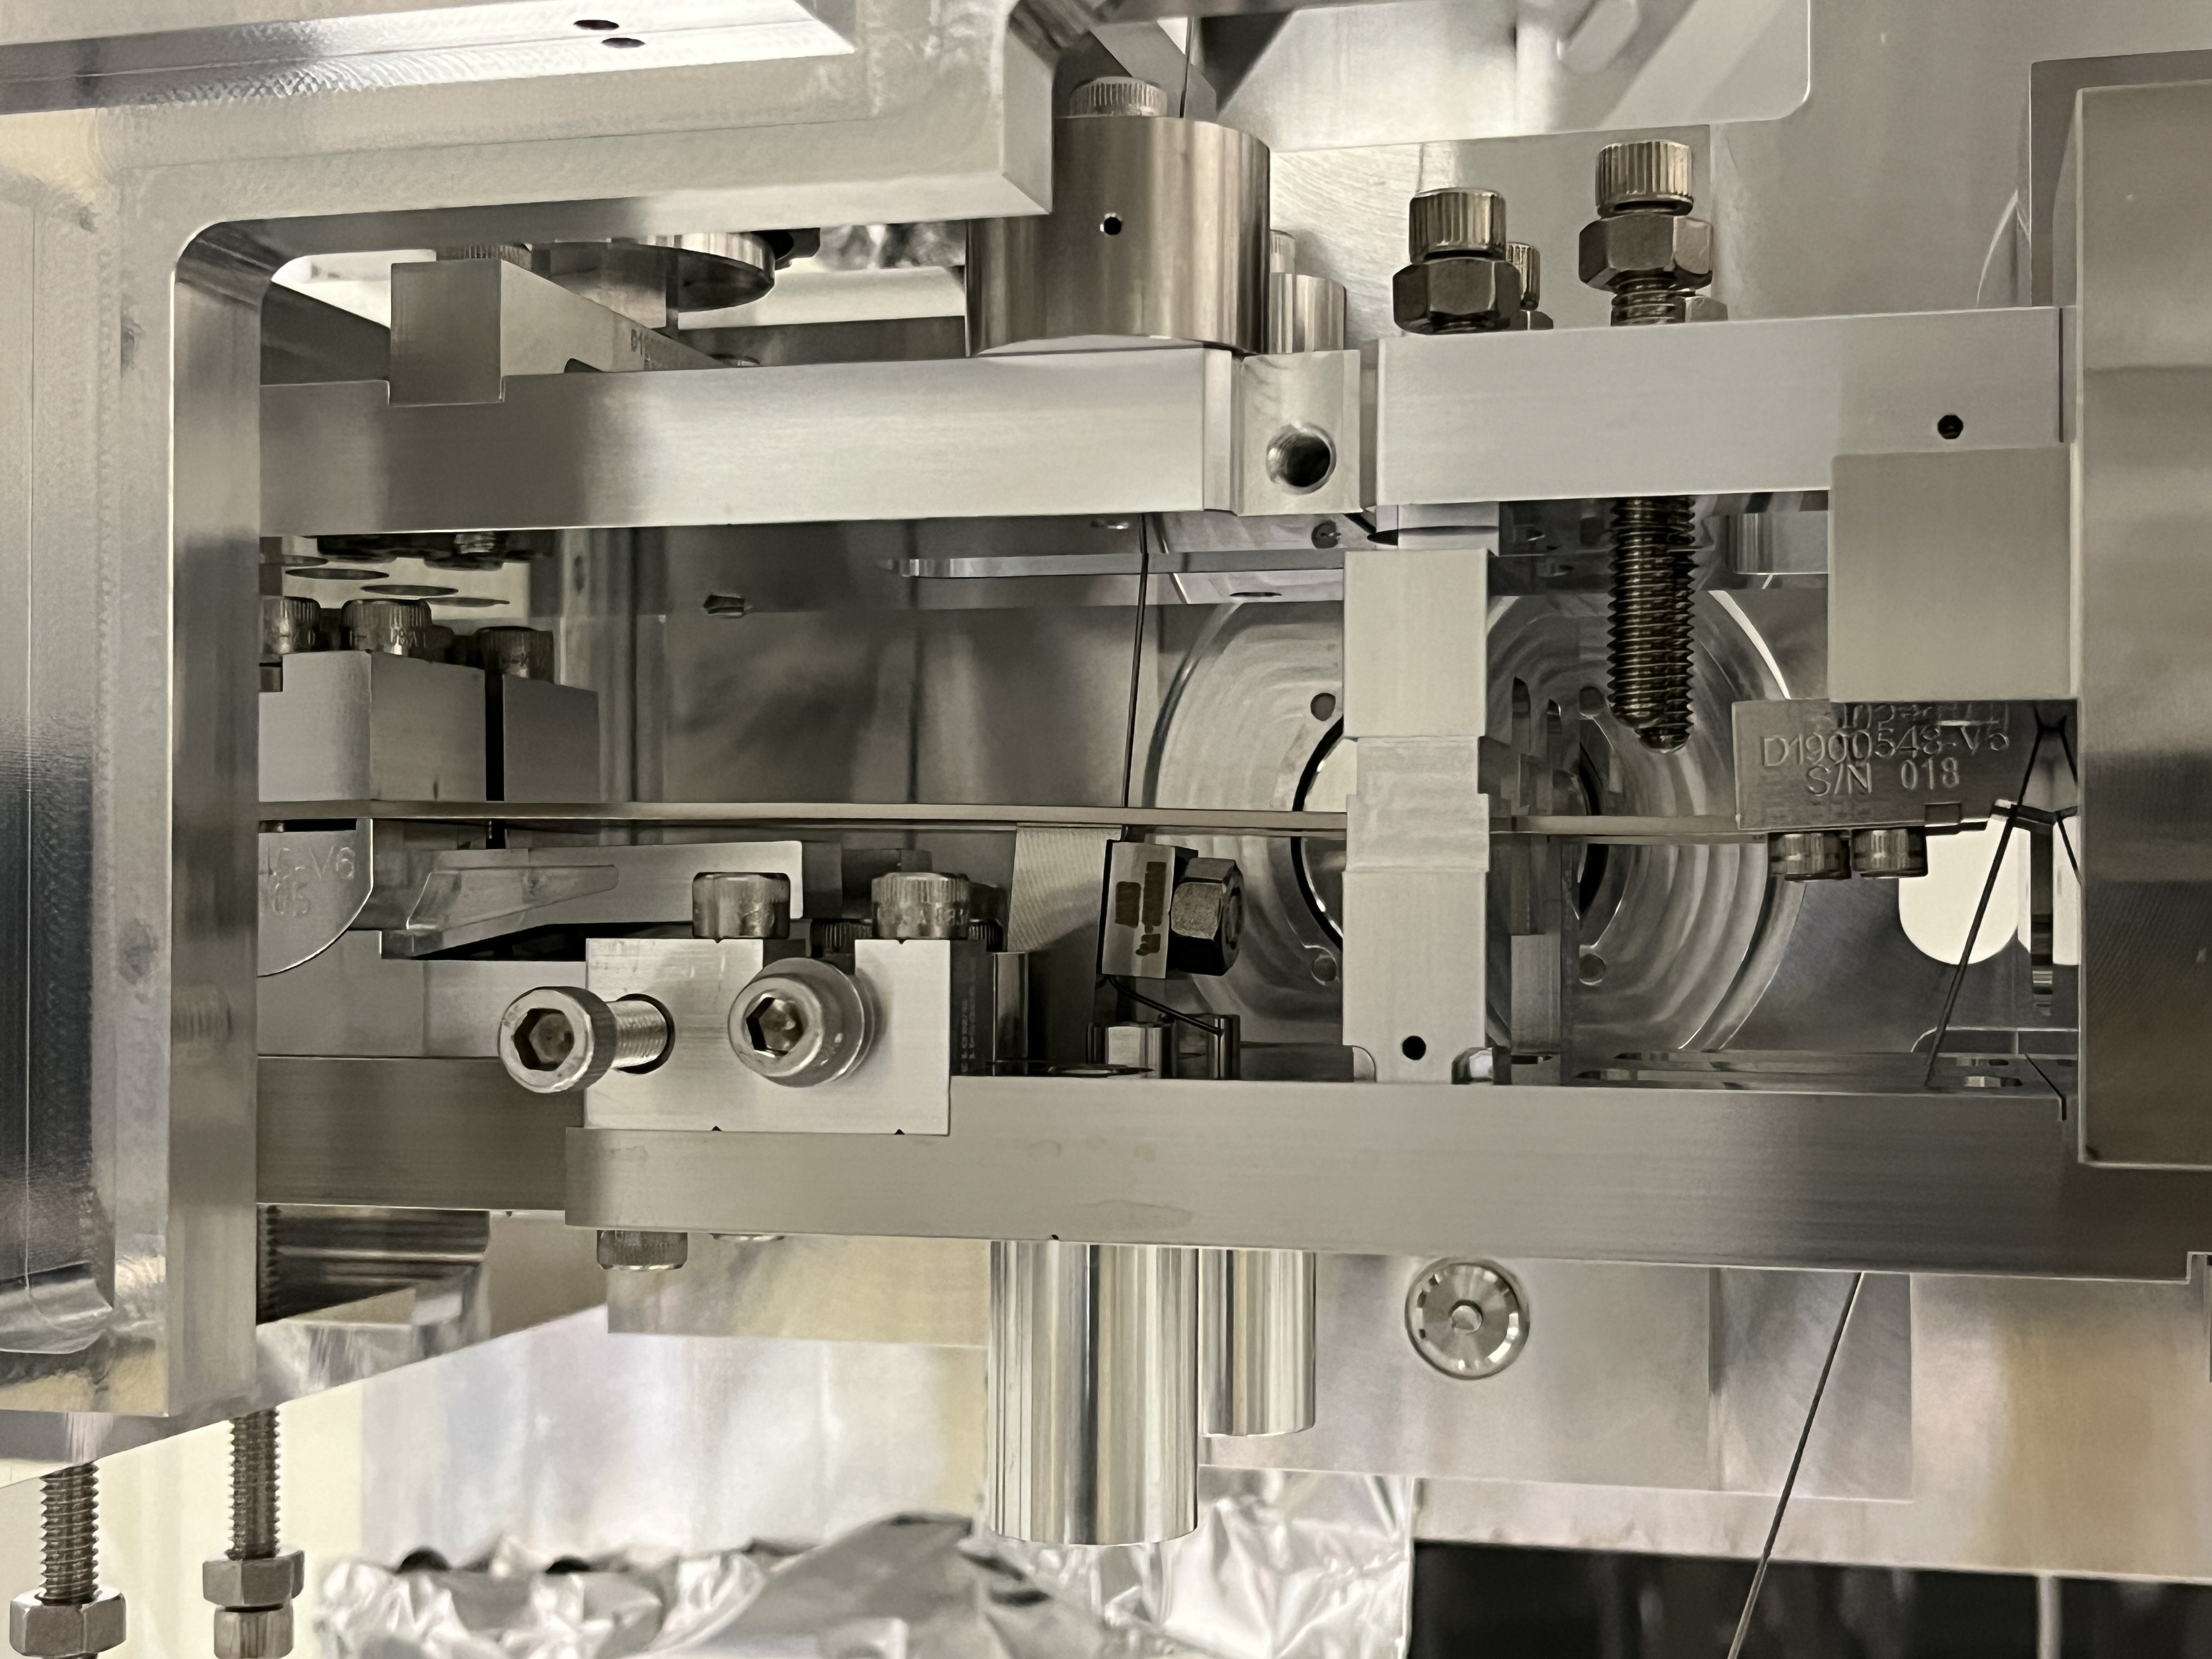
tagging EPO for BBSS pics.
Update on these results: 76071
Verification that the d4 value is correct: 82138
