Jeff, Oli, Jonathan, EJ, Erik, Dave:
On Thursday 15Jan2026 we installed Jeff and Oli's new models for:
h1susmc2, h1suspr2, h1sussr2, h1susbs
h1susitmx, h1susitmy, h1susitmpi
h1susauxb13, h1susauxb2h34
Several DAQ restarts were needed for these installs. The first DAQ restart also had an EDC restart to use updated SDF and CDSMON ini files incorporating the new model names.
The models in h1susb2h34 had two sets of restarts. After the first EJ found some IPC issues which he fixed by editing H1.ipc. All the models were then restarts a second time.
In the first block of restarts h1suspr2 had two starts, the second to fix a 18bit-DAC to 20bit-DAC change.
We had three instances of new models removing channels from the DAQ which were being sent to GDS via the broadcaster. Jonathan removed these from the broadcaster list we are working today on whether they should be added back, perhaps with a different name.
Here are the models and GDS channel lists:
h1susitmx (4):
H1:FEC-29_DAC_OVERFLOW_ACC_2_[4-7]
h1susitmy (4):
H1:FEC-30_DAC_OVERFLOW_ACC_2_[4-7]
h1susauxb2h34 (3):
H1:SUS-BS_M1_NOISEMON_F[1-3]_OUT_DQ
As Jonathan details in his alog, after the restart of h1susauxb2h34 the DAQ was running with duplicate BS-AUX channels which had been added to h1susauxb2h34 and were still running on h1susauxb13 (a temporary model I built on Wed). This was resolved when the new h1susauxb13 was installed.
Restart Log
Thu15Jan2026
LOC TIME HOSTNAME MODEL/REBOOT
12:32:41 h1susb2h34 h1susmc2 <<< First set of h1susb2h34 restarts
12:33:07 h1susb2h34 h1suspr2
12:36:07 h1susb2h34 h1sussr2
12:36:25 h1susb2h34 h1susbs
12:45:57 h1susb2h34 h1suspr2 <<< Fix 18bit-DAC issue
13:07:10 h1susb2h34 h1susmc2 <<< Second set of h1susb2h34 restarts with fixed IPC
13:07:29 h1susb2h34 h1suspr2
13:07:54 h1susb2h34 h1sussr2
13:08:12 h1susb2h34 h1susbs
13:32:14 h1daqdc1 [DAQ] <<< DAQ 1-leg, new models and new EDC
13:32:25 h1daqfw1 [DAQ]
13:32:26 h1daqtw1 [DAQ]
13:32:29 h1daqnds1 [DAQ]
13:32:35 h1daqgds1 [DAQ]
13:32:51 h1susauxh56 h1edc[DAQ] <<< EDC restart
13:34:56 h1daqgds1 [DAQ] <<< GDS1 needed second restart
13:36:31 h1daqgds0 [DAQ] <<< DAQ 0-leg
13:36:39 h1daqfw0 [DAQ]
13:36:39 h1daqtw0 [DAQ]
13:36:40 h1daqnds0 [DAQ]
14:50:28 h1susb13 h1susitmx <<< New h1susb13 models
14:50:52 h1susb13 h1susitmy
14:51:13 h1susb13 h1susitmpi
14:57:31 h1daqdc1 [DAQ] <<< DAQ 1-leg restart for new models
14:57:41 h1daqfw1 [DAQ]
14:57:41 h1daqtw1 [DAQ]
14:57:43 h1daqnds1 [DAQ]
15:04:22 h1daqfw1 [DAQ] <<< FW1 spontaneous restart
15:07:00 h1daqgds1 [DAQ] <<< GDS1 manual start after missing channels removed
15:09:02 h1daqfw1 [DAQ] <<< 2nd FW1 spontaneous restart
15:17:02 h1daqgds0 [DAQ] <<< 0-leg restart
15:17:09 h1daqfw0 [DAQ]
15:17:09 h1daqtw0 [DAQ]
15:17:10 h1daqnds0 [DAQ]
15:50:54 h1susauxb2h34 h1susauxb2h34 <<< new model (unknowingly adding duplicate chans)
15:54:02 h1daqdc1 [DAQ] <<< DAQ restart for model change, 1-leg
15:54:11 h1daqfw1 [DAQ]
15:54:11 h1daqtw1 [DAQ]
15:54:15 h1daqnds1 [DAQ]
15:54:20 h1daqgds1 [DAQ]
16:02:39 h1daqgds0 [DAQ] <<< 0-leg
16:02:45 h1daqfw0 [DAQ]
16:02:46 h1daqnds0 [DAQ]
16:02:46 h1daqtw0 [DAQ] <<< At this point FW2 is unstable due to duplicate channels, not sure why 0-leg & 1-leg are running at this point
17:23:09 h1susauxb13 h1susauxb13 <<< new model (removed duplicate BS chans)
17:23:53 h1daqdc1 [DAQ] <<< 1-leg
17:24:03 h1daqfw1 [DAQ]
17:24:03 h1daqtw1 [DAQ]
17:24:07 h1daqnds1 [DAQ]
17:31:19 h1daqgds1 [DAQ] <<< GDS1 manual restart after removing GDS chans from broadcaster
17:33:22 h1daqgds0 [DAQ] <<< 0-leg restart
17:33:27 h1daqfw0 [DAQ]
17:33:28 h1daqnds0 [DAQ]
17:33:28 h1daqtw0 [DAQ]
17:37:55 h1daqfw0 [DAQ] <<< FW0 spontaneous restart


Friday, we recentered the beam onto the OPO pump fiber rejected PD.
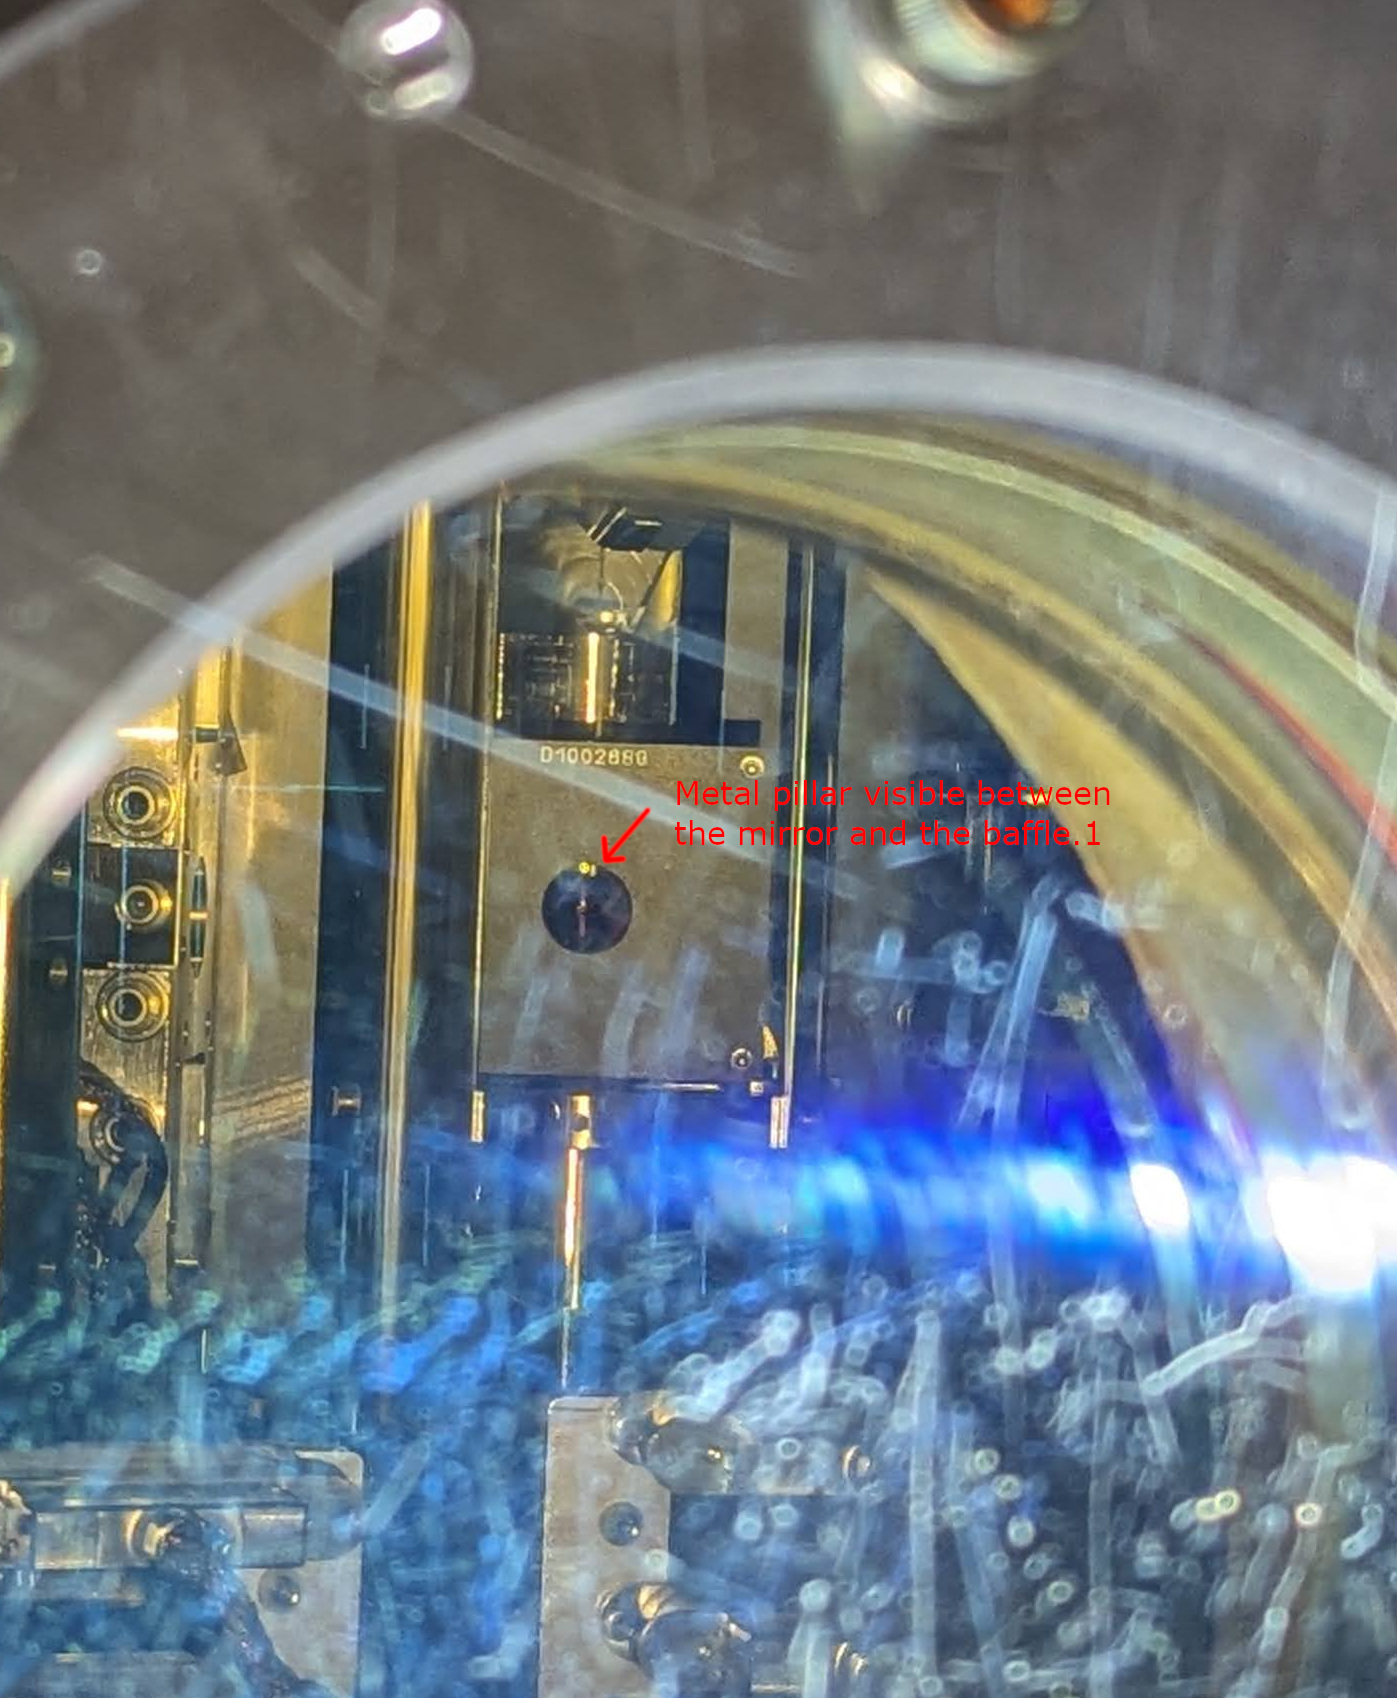
Robert and I also went to the chamber in laser safe in the afternoon and reattached the cable clamp to the pillar on the hard to reach side of the VIP, and took phots of the camble routhing and iris locations.
Since we adjusted the alignment of B:M4 while moving the beam location in SFI2, we had to realing the path to the FC QPDs as Kar Meng mentioned above. We did this using the seed beam because that beam can be seen on a card, but it saturated the QPDs. We walked the pointing until the beam was on both QPDs as seen by saturating all the quadrants, we will want to use the CLF beam to actually center on these QPDs so that we aren't saturating.
Still to do in HAM7 in laser hazard:
Not in laser hazard: