Patrick, Jonathan, Erik Dave:
While the fmcs ioc continues to be unstable, I wrote an auto-restart script which restarts the IOC if its EPICS values flatline for more than 9 minutes.
In order to control the IOC code we moved it from a screen environment to a procServ, and converted the code to a systemd service.
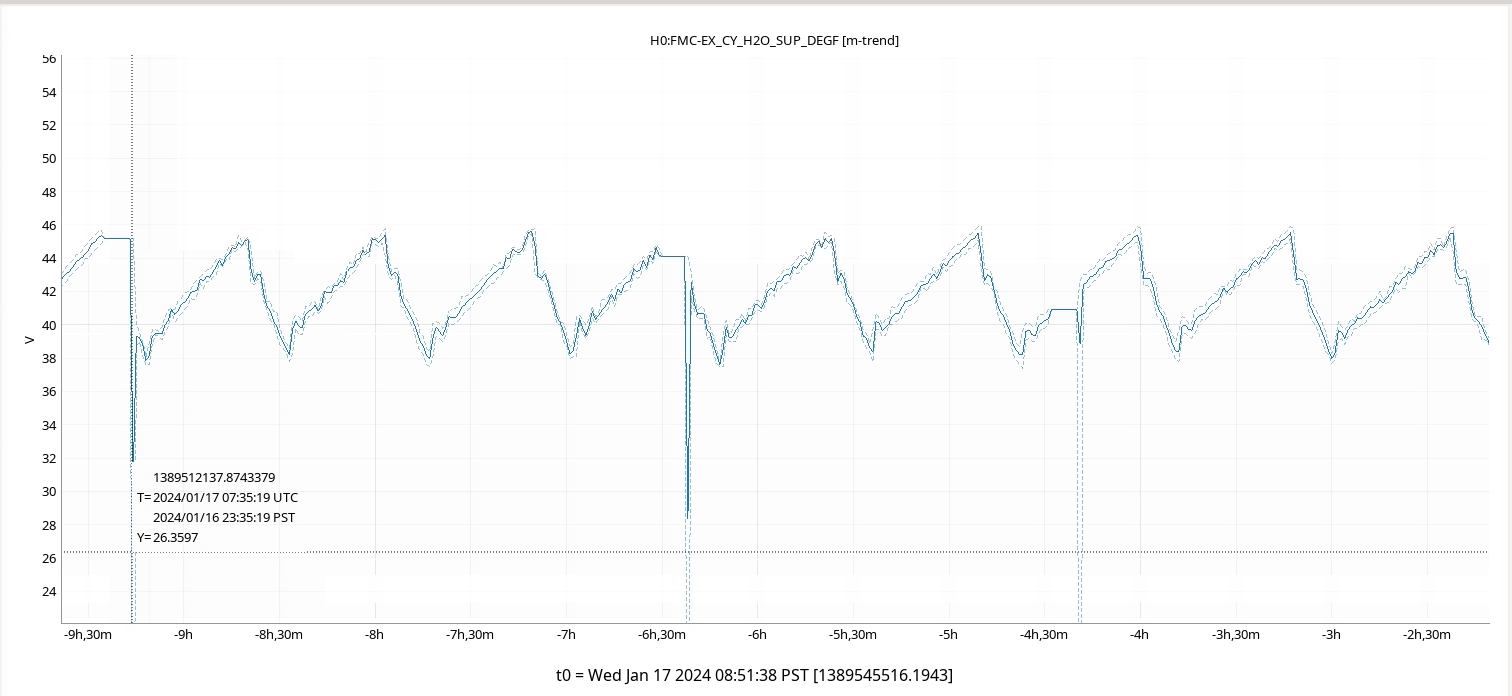
The auto-restart code runs as david.barker on cdsmanager. Every minute it gets the value of the EX chiller yard water temperature channel H0:FMC-EX_CY_H2O_SUP_DEGF.
If the value of this channel does not change for 9 successive minutes, the code restarts the fmcs_ioc.service on fmcs-epics-cds
ssh root@fmcs-epics-cds 'systemctl restart fmcs_ioc.service'
I started the auto-restart code at 23:12 PST Tue night, since that time there have been 3 auto-restarts
Tue 16 Jan 2024 11:35:41 PM PST
Wed 17 Jan 2024 02:29:52 AM PST
Wed 17 Jan 2024 04:32:58 AM PST
Full details can be found in the wiki page h0fmcsbacnet