erik.vonreis@LIGO.ORG - posted 06:27, Tuesday 02 January 2024 (75121)
Workstations were updated
Workstations were updated and rebooted. This was an OS update. Conda packages were not updated.
Workstations were updated and rebooted. This was an OS update. Conda packages were not updated.
TITLE: 01/02 Eve Shift: 00:00-08:00 UTC (16:00-00:00 PST), all times posted in UTC
STATE of H1: Corrective Maintenance
INCOMING OPERATOR: Tony
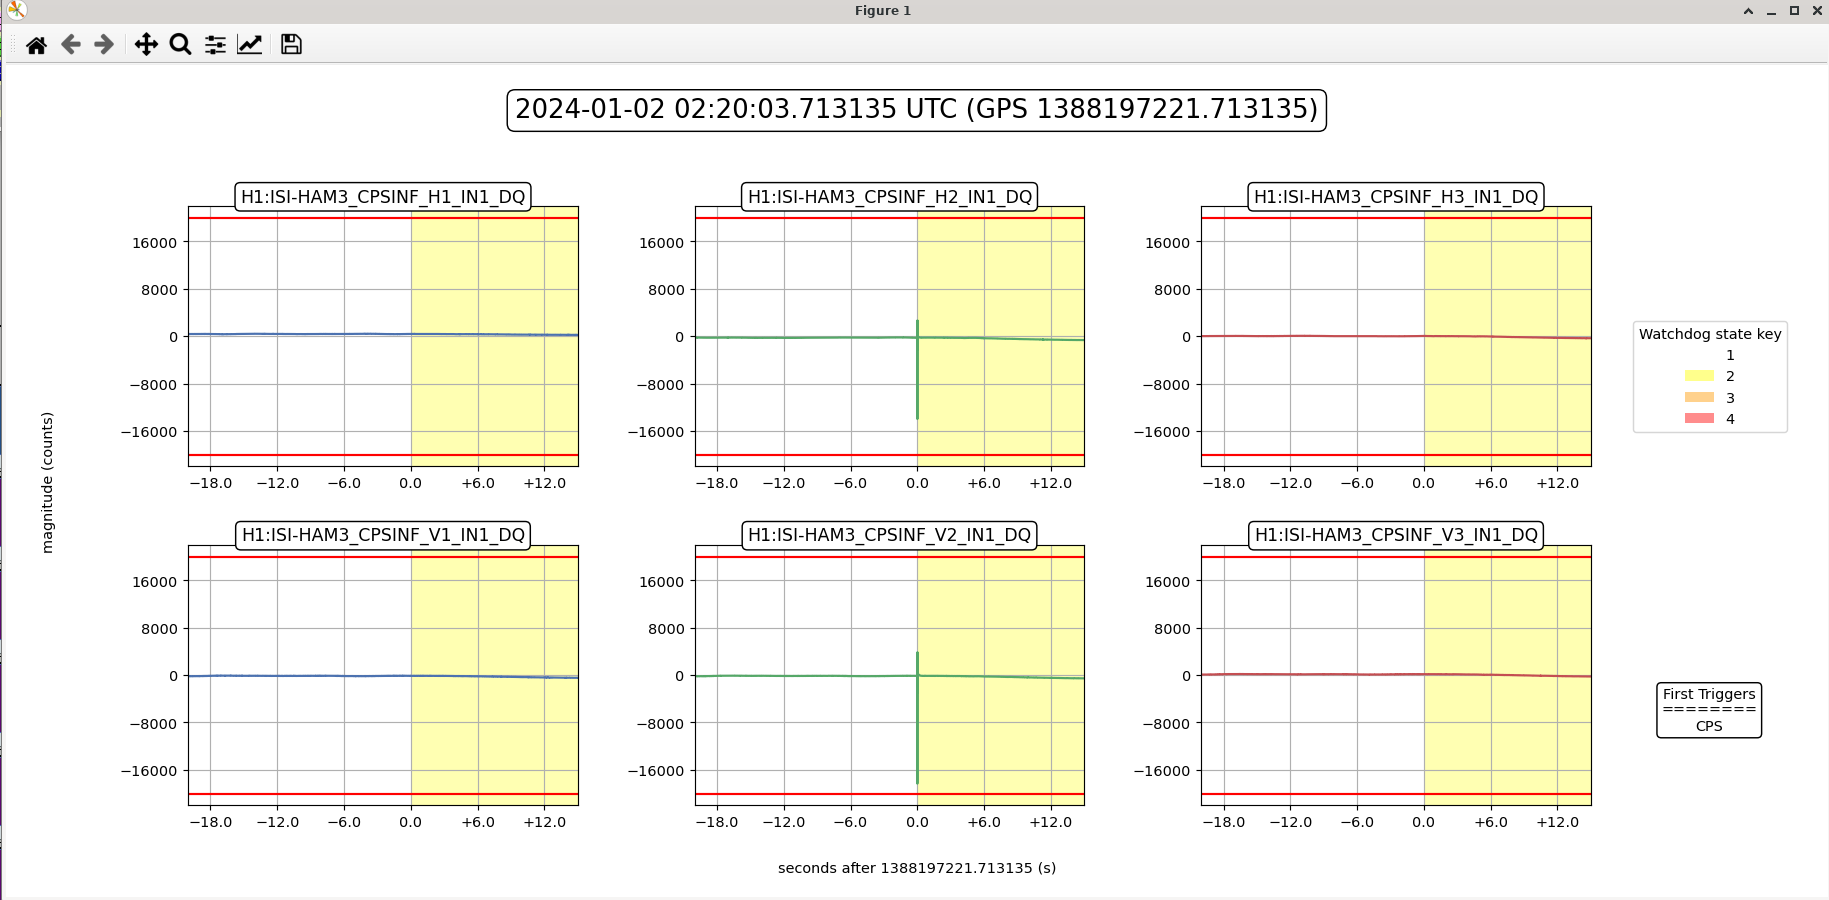
SHIFT SUMMARY: We lost lock once during the shift from the HAM3 ISI watchdog tripping from the CPS sensor. It then kept tripping the ISI so we're holding in down with the IMC offline and HAM3 in damped until the problem can be addressed in the morning during maintenance.
02:20 Lockloss alog75114
03:20 Back into observing, pretty quick automated relock
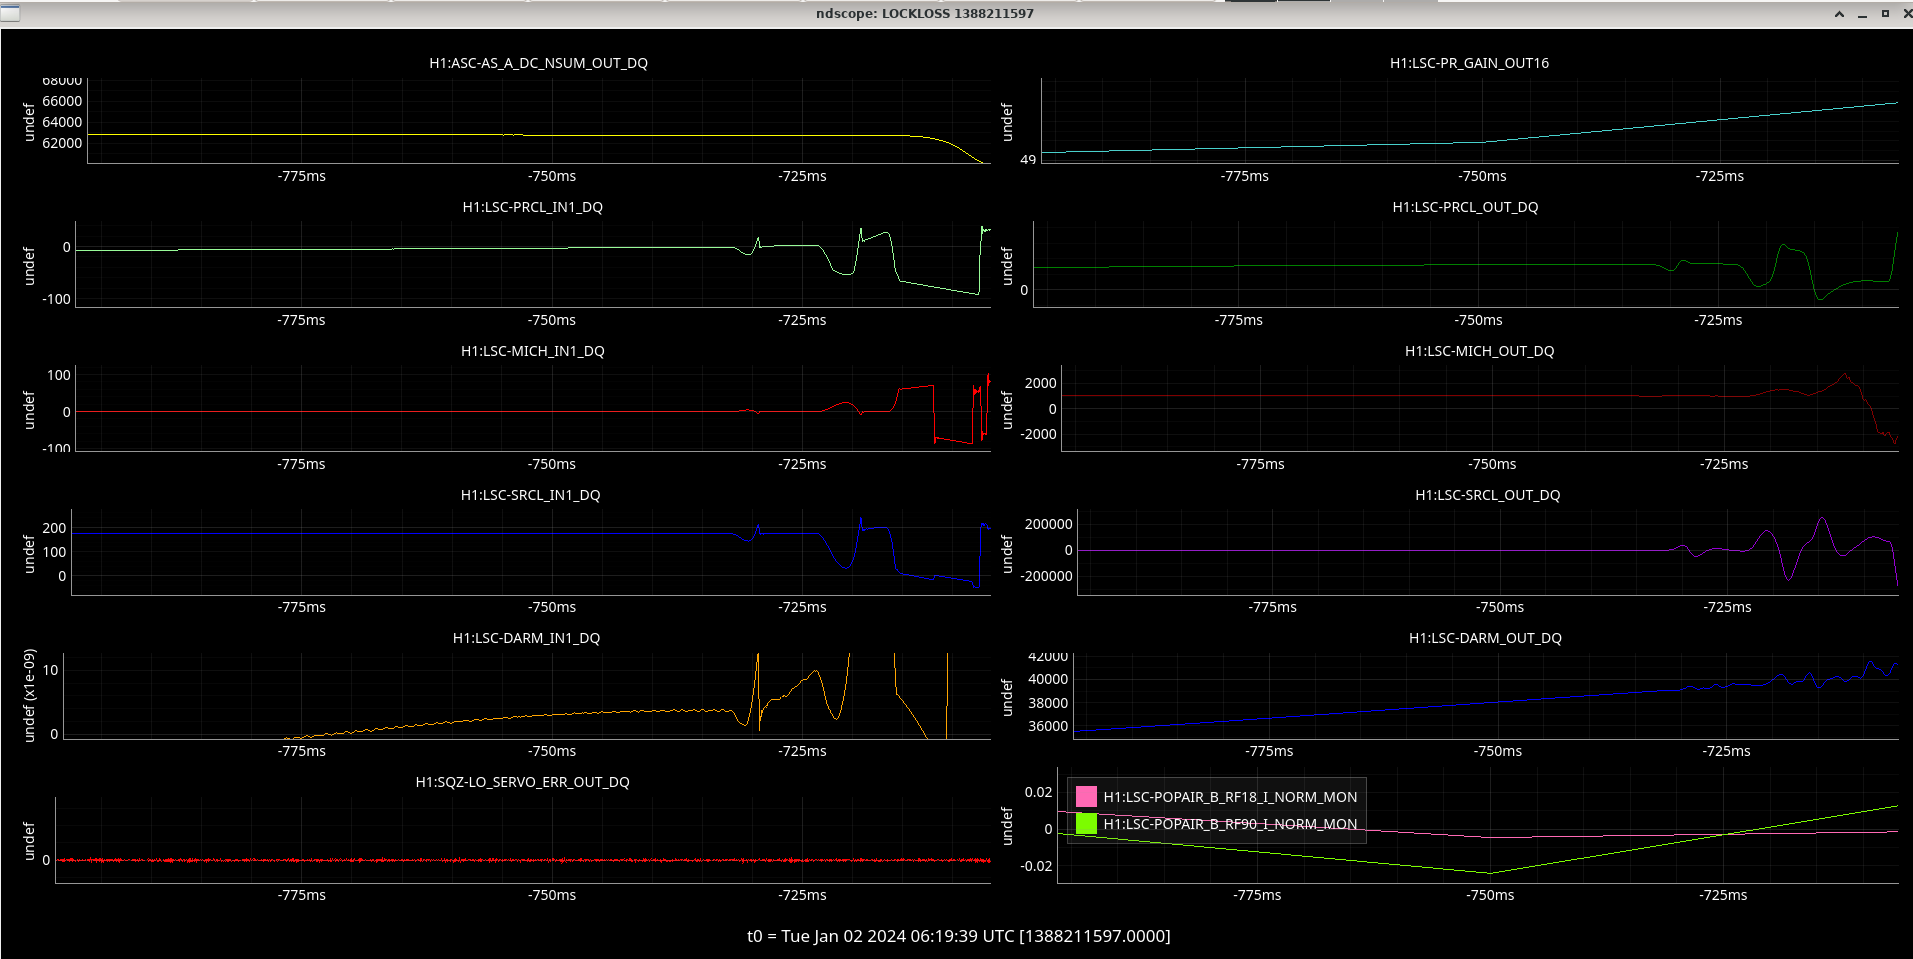
06:19 lockloss alog75119
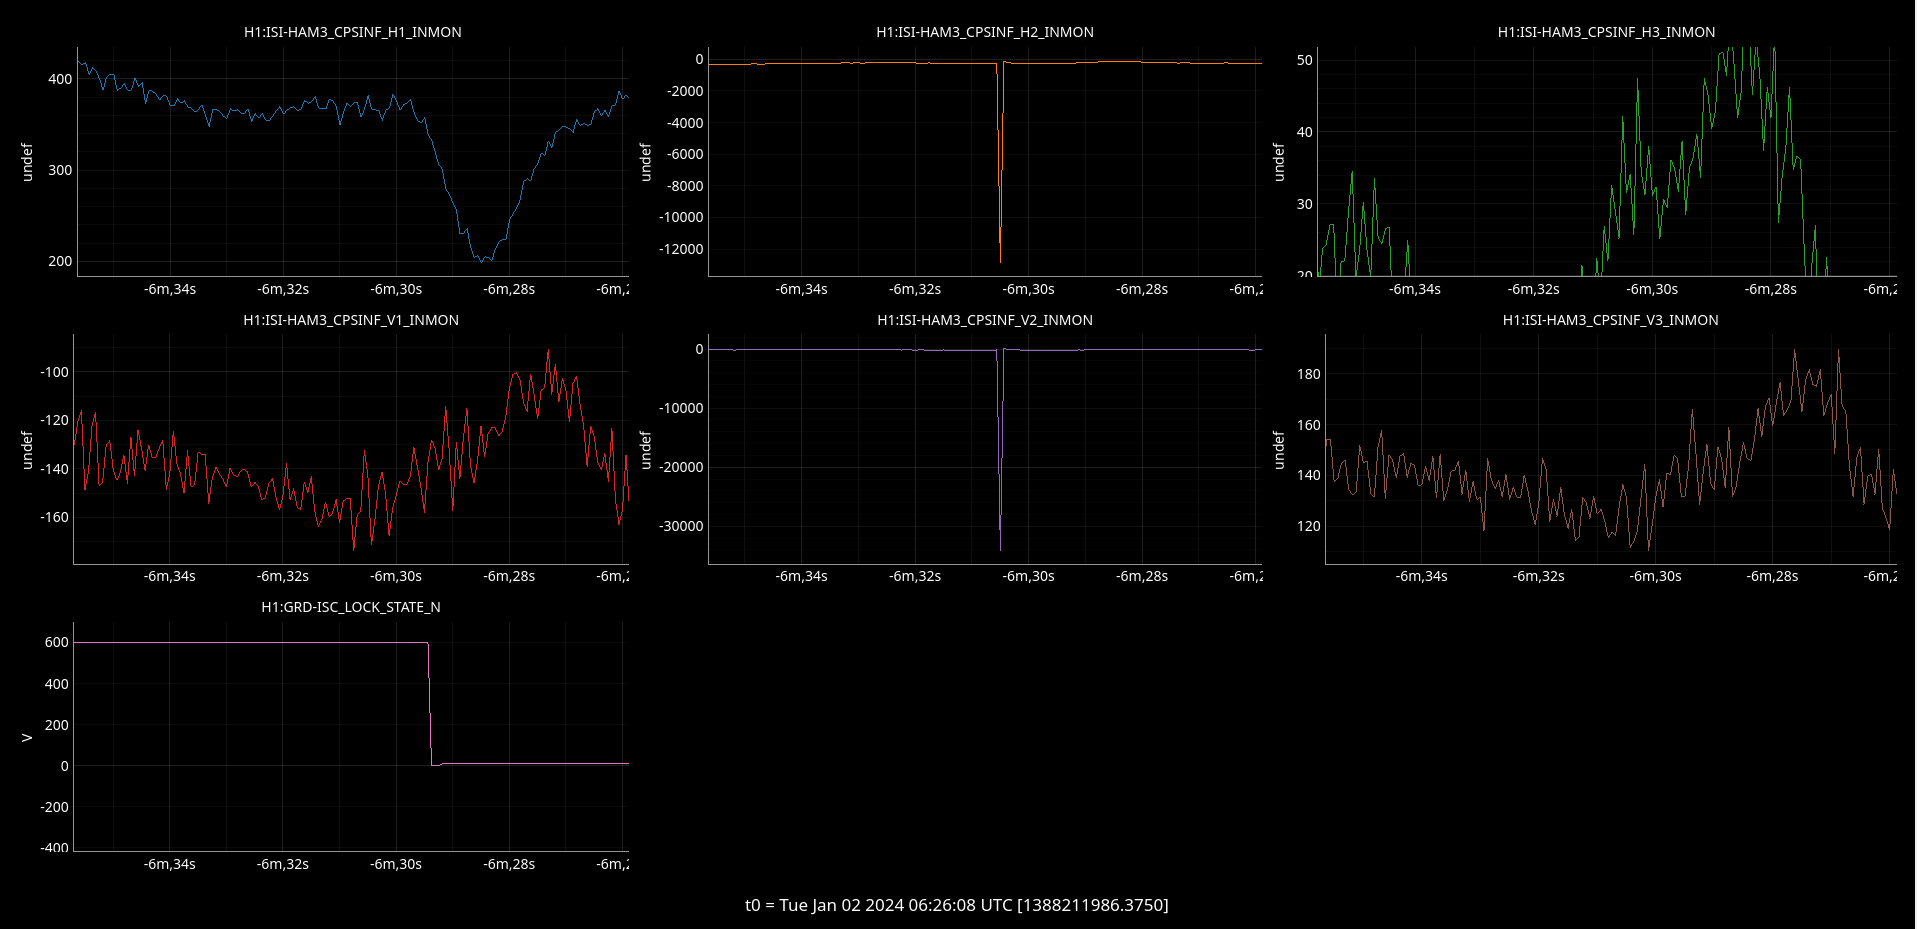
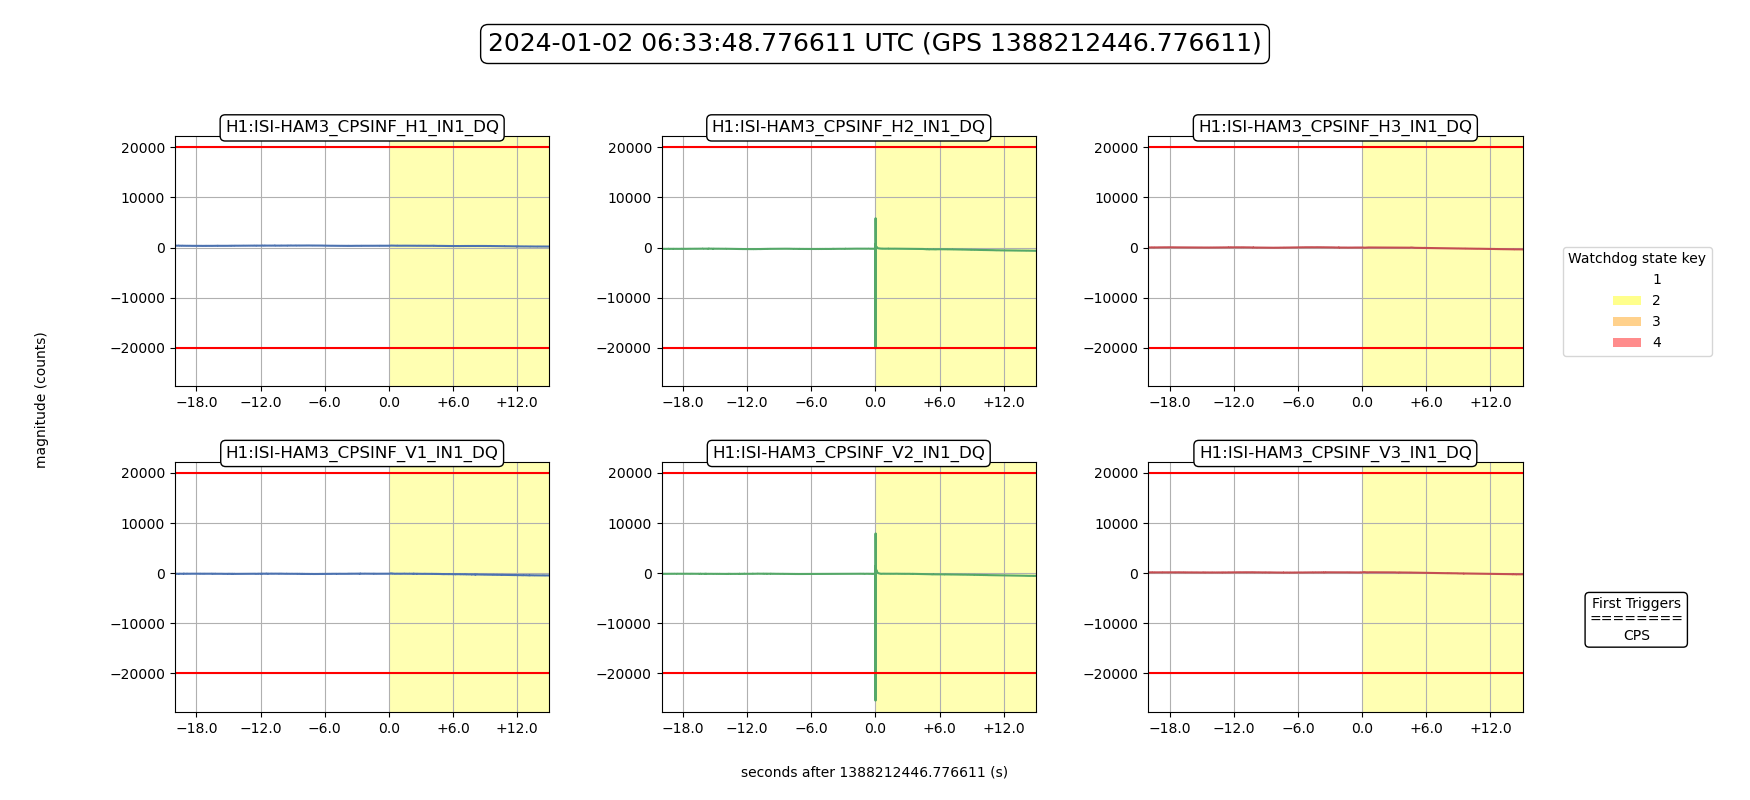
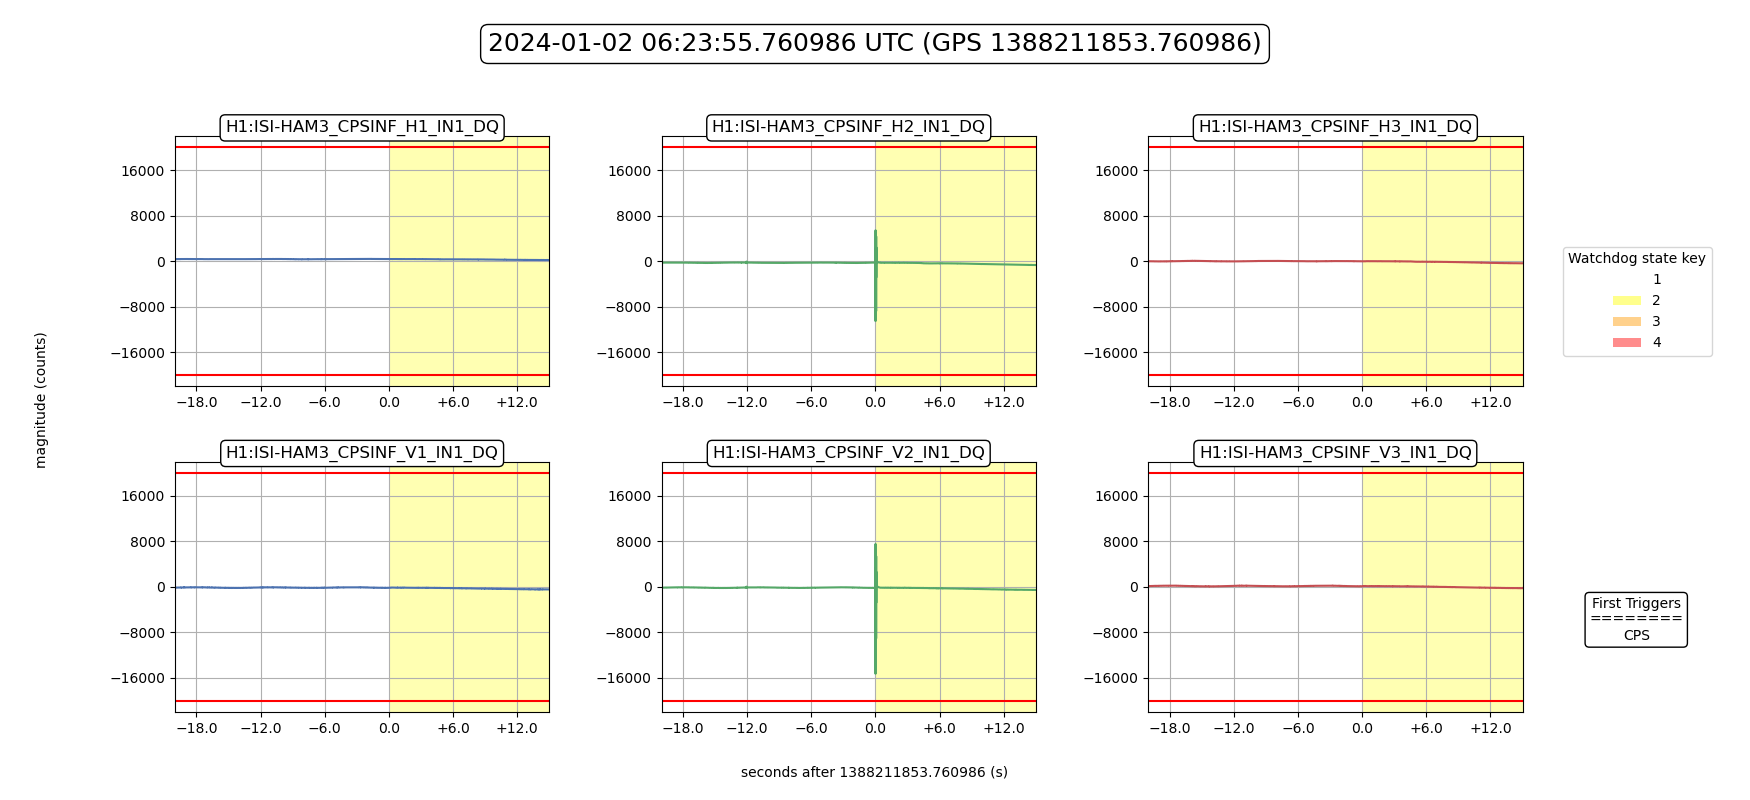
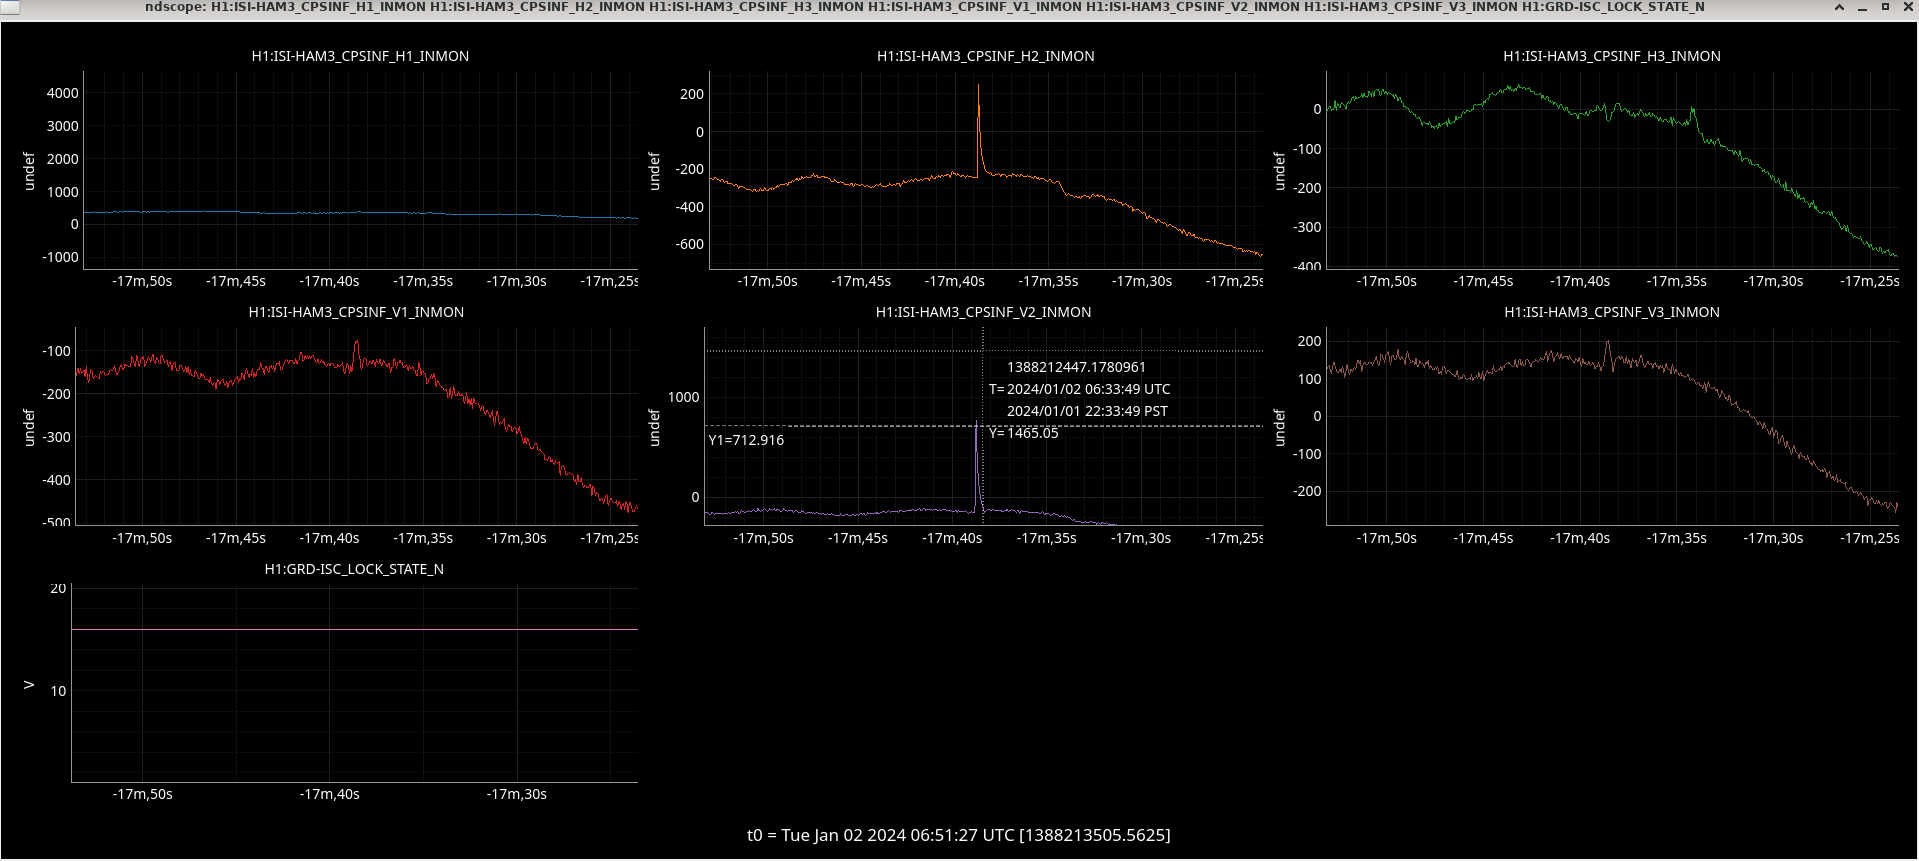
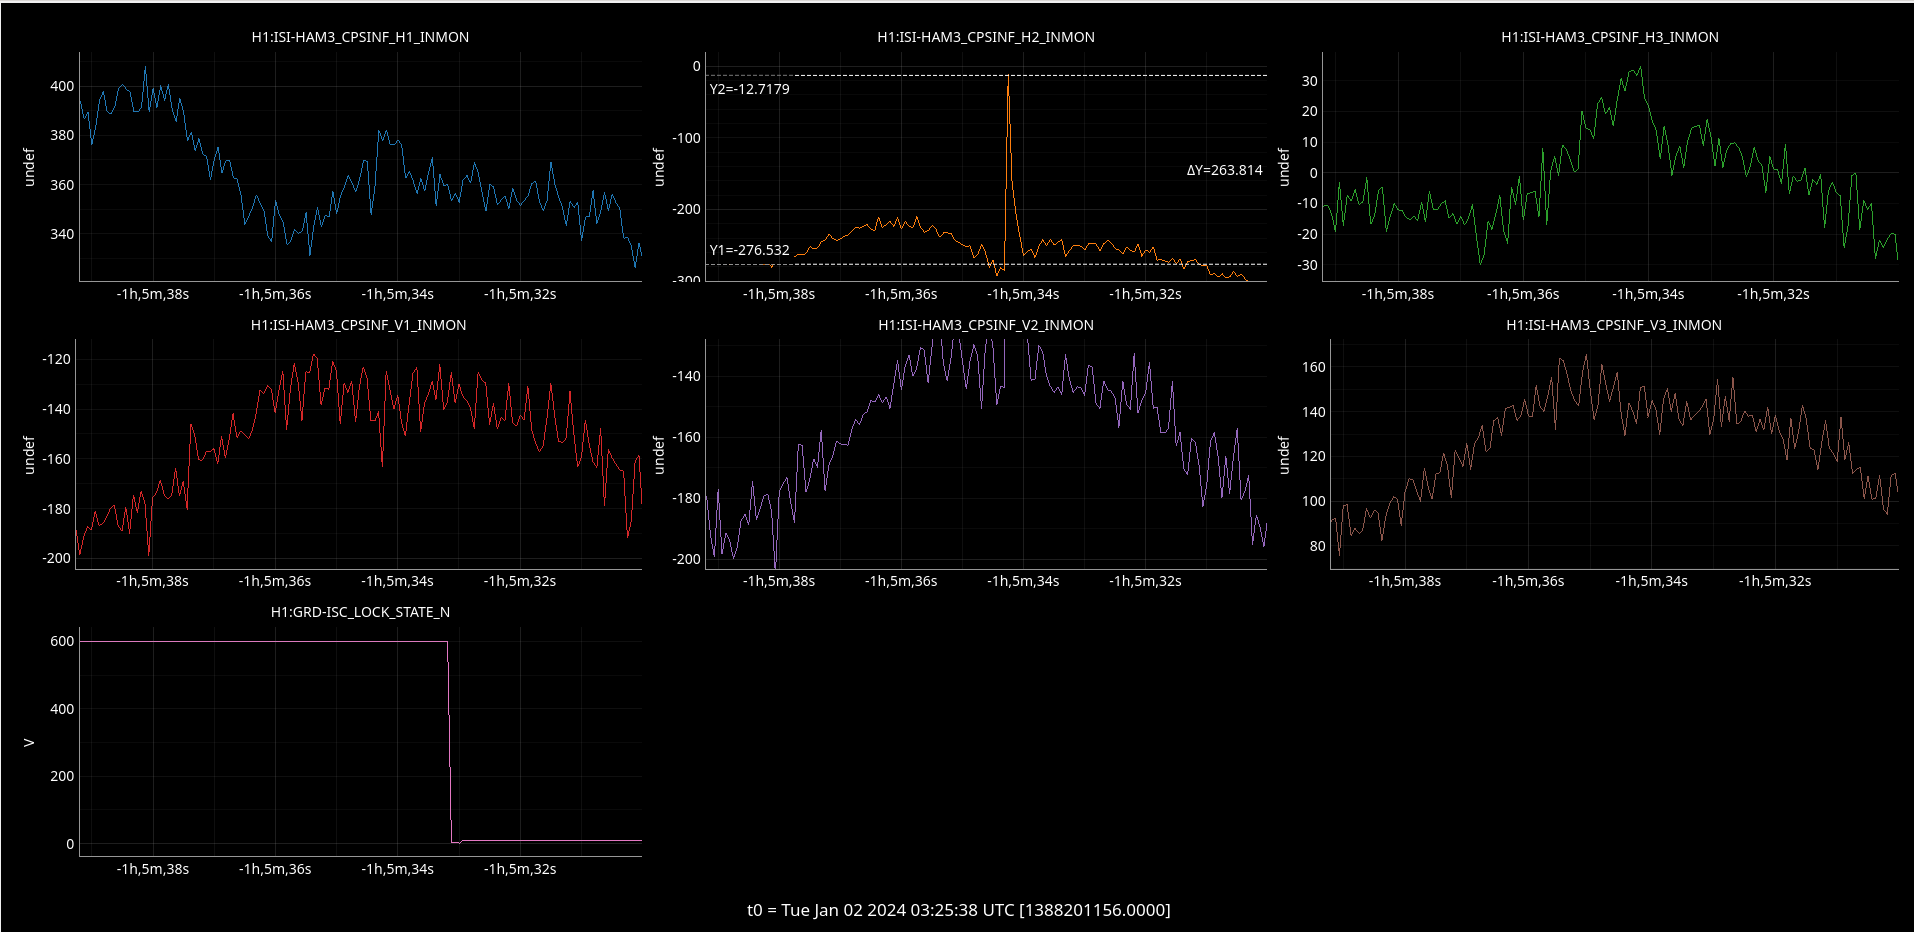
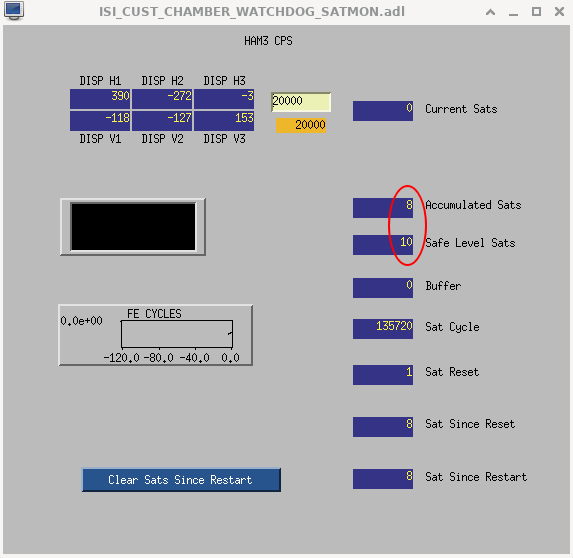
06:24 the HAM3 ISI tripped from a CPS glitch it seems? Then 10 minutes later it tripped with a larger glitch at 06:34
DIAG_MAIN reports
Lockloss
We've been locked just under an hour
We lost lock at 02:20UTC, relocking was straightforward, back to NLN at 03:14 in observing at 03:20.
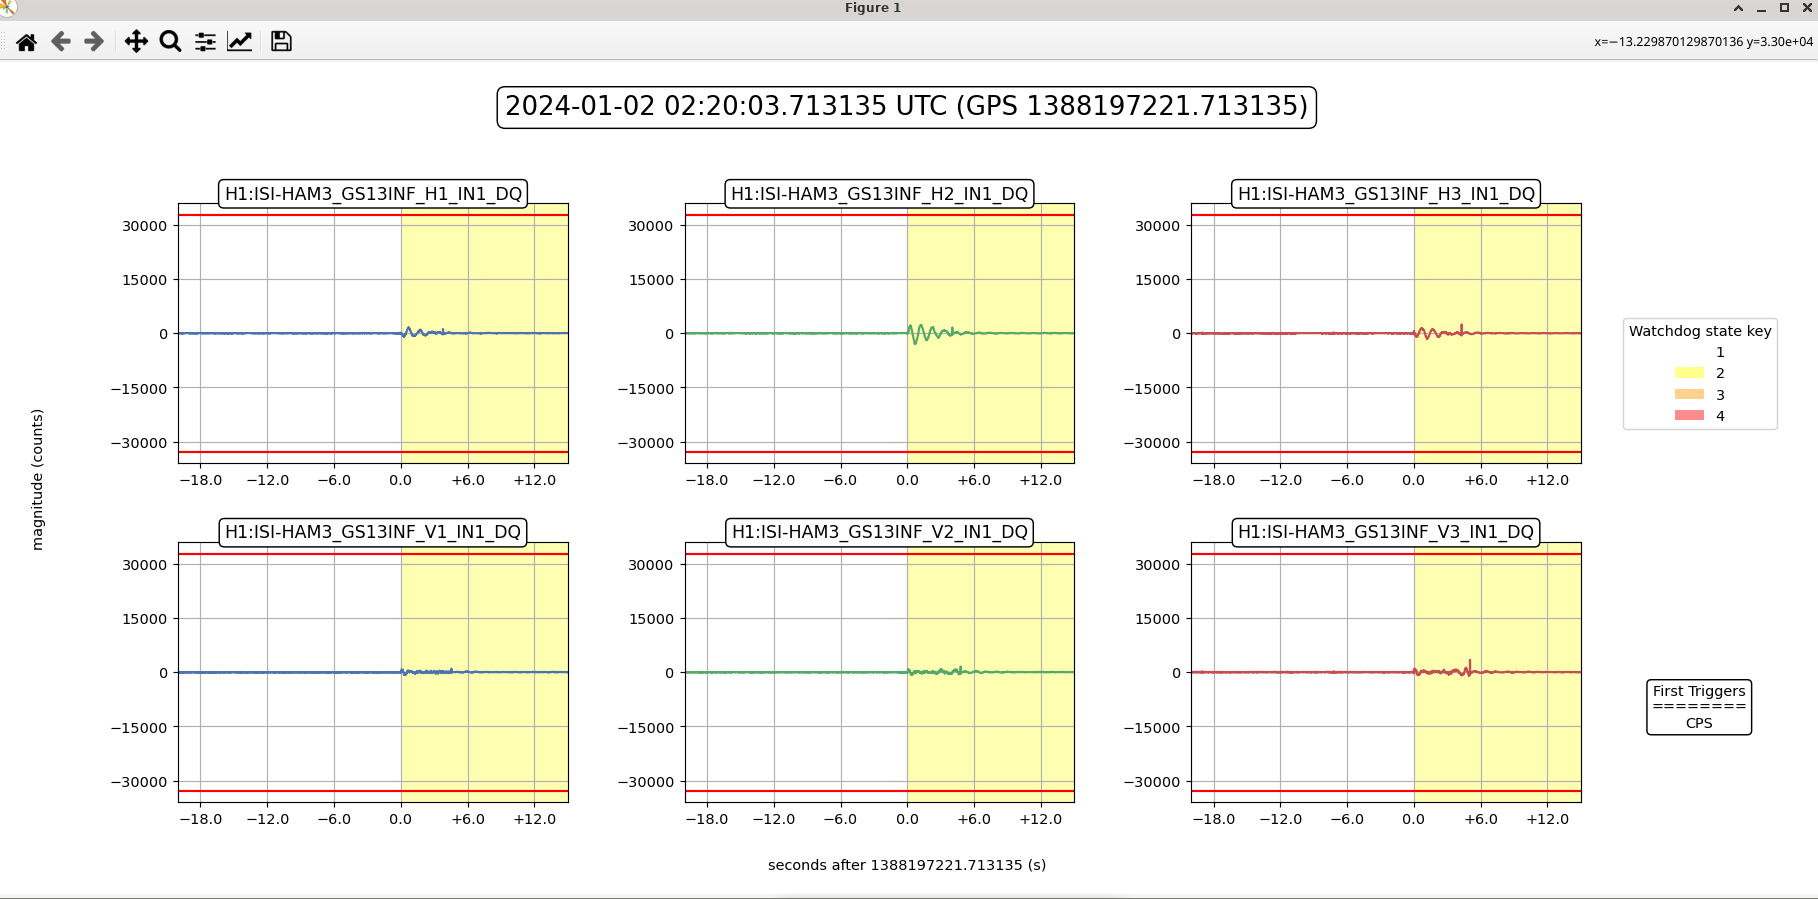
Lockloss at 02:20UTC, HAM3 ISI watchdog trip from the cps sensors? Seismic motion was increasing at the time. CPS_H2 sees a big spike which presumably was the trip.
Back into observing at 03:20UTC
This looks like a CPS glitch, H2 and V2 sensor see coincident spikes not seen on other sensors. I think these sensors are both in their own box, corner 1 and 3 are in the other chassis, I will take a look during maintenance tomorrow.
TITLE: 01/01 Eve Shift: 00:00-08:00 UTC (16:00-00:00 PST), all times posted in UTC
STATE of H1: Observing at 150Mpc
OUTGOING OPERATOR: Ryan S
CURRENT ENVIRONMENT:
SEI_ENV state: CALM
Wind: 6mph Gusts, 4mph 5min avg
Primary useism: 0.03 μm/s
Secondary useism: 0.38 μm/s
QUICK SUMMARY:
TITLE: 01/01 Day Shift: 16:00-00:00 UTC (08:00-16:00 PST), all times posted in UTC
STATE of H1: Observing at 154Mpc
INCOMING OPERATOR: Ryan C
SHIFT SUMMARY: Mostly quiet shift with just one lockloss with an unknown cause. H1 has now been locked and observing for 4.5 hours and the ITMX HWS camera is still stuck ON (alog75106).
LOG:
Lockloss @ 18:23 UTC - no obvious cause.
LSC-DARM showed the first motion, as usual for these types of locklosses.
Back to observing at 19:31 UTC
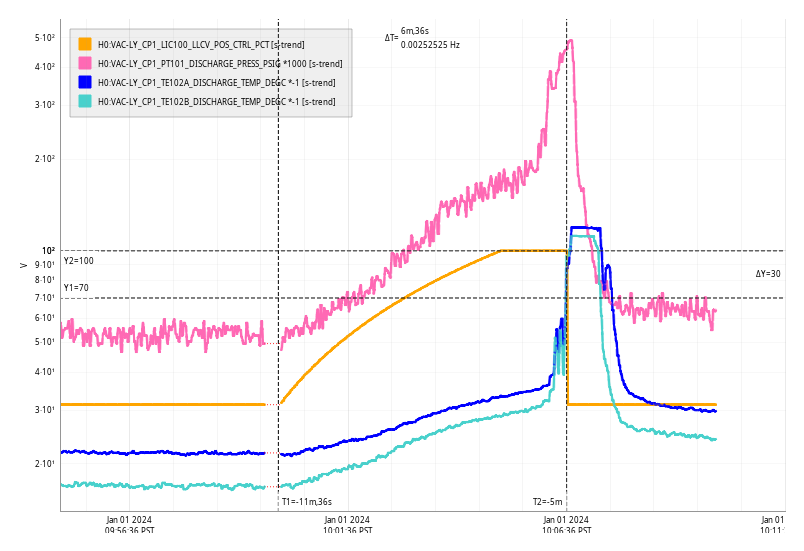
Mon Jan 01 10:06:36 2024 INFO: Fill completed in 6min 32secs
At 23:37 Sun 31 Dec 2023 PST the h1hwsmsr computer crashed. At this time: EDC disconnect count went to 88, Slow Controls SDF (h1tcshwssdf) discon_chans count = 15, GRD DIAG_MAIN cannot connect to HWS channel
The main impact on the IFO is that the ITMX HWS camera cannot be controlled and is stuck in the ON state (taking images at 7Hz).
Time line for camera control:
| 23:22 Sun 31 Dec 2023 PST | Lock Loss, ITMX and ITMY cams = ON |
| 23:37 Sun 31 Dec 2023 PST | h1hwsmsr computer crash, no ITMX cam control |
| 04:37 Mon 01 Jan 2024 PST | H1 lock, ITMY cam = OFF, ITMX stuck ON |
Tagging DetChar in case the 7Hz comb reappears since the ITMX HWS camera was left on for the observing stretch starting this morning at 12:41 UTC.
I also removed ITMX from the "hws_loc" list in the HWS test in DIAG_MAIN and restarted the node at 18:08 UTC so that DIAG_MAIN could run again and clear the SPM diff (tagging OpsInfo). This did not take H1 out of observing.
Similar to what I did on 23 Dec 2023 when we lost h1hwsex, I have created a temporary HWS ITMX dummy IOC which is running under a tmux session on cdsioc0 as user=ioc. All of its channels are zero except for the 15 being monitored by h1tcshwssdf which are set to the corresponding OBSERVE.snap values.
EDC and SDF are back to being GREEN.
The H1:PEM-CS_MAG_LVEA_OUTPUTOPTICS_Y_DQ channel 74900 shows the 7Hz has been present since 07:37UTC 01 Jan 2024 when the h1hwsmsr computer crashed. Plan to restart the code turning the camera off during locks 74951 during commisioning today.
In 75124 Jonathan, Erik and Dave replaced the computer and today we were again able to communicate with the camera (needed to use the alias init_hws_cam='/opt/EDTpdv/initcam -f /opt/EDTpdv/camera_config/dalsa_1m60.cfg'). At 18:25-18:40UTC we adjusted from 7Hz to 5Hz, off and left back at 7Hz. We'll plan to stop Dave's dummy IOC and restart the code later today. Once this is successful, the CDS team will look at replacing the h1hwsex 75004 and h1hwsey 73906. Erik has WP 11598
From 23:35UTC these combs are gone, 75159.
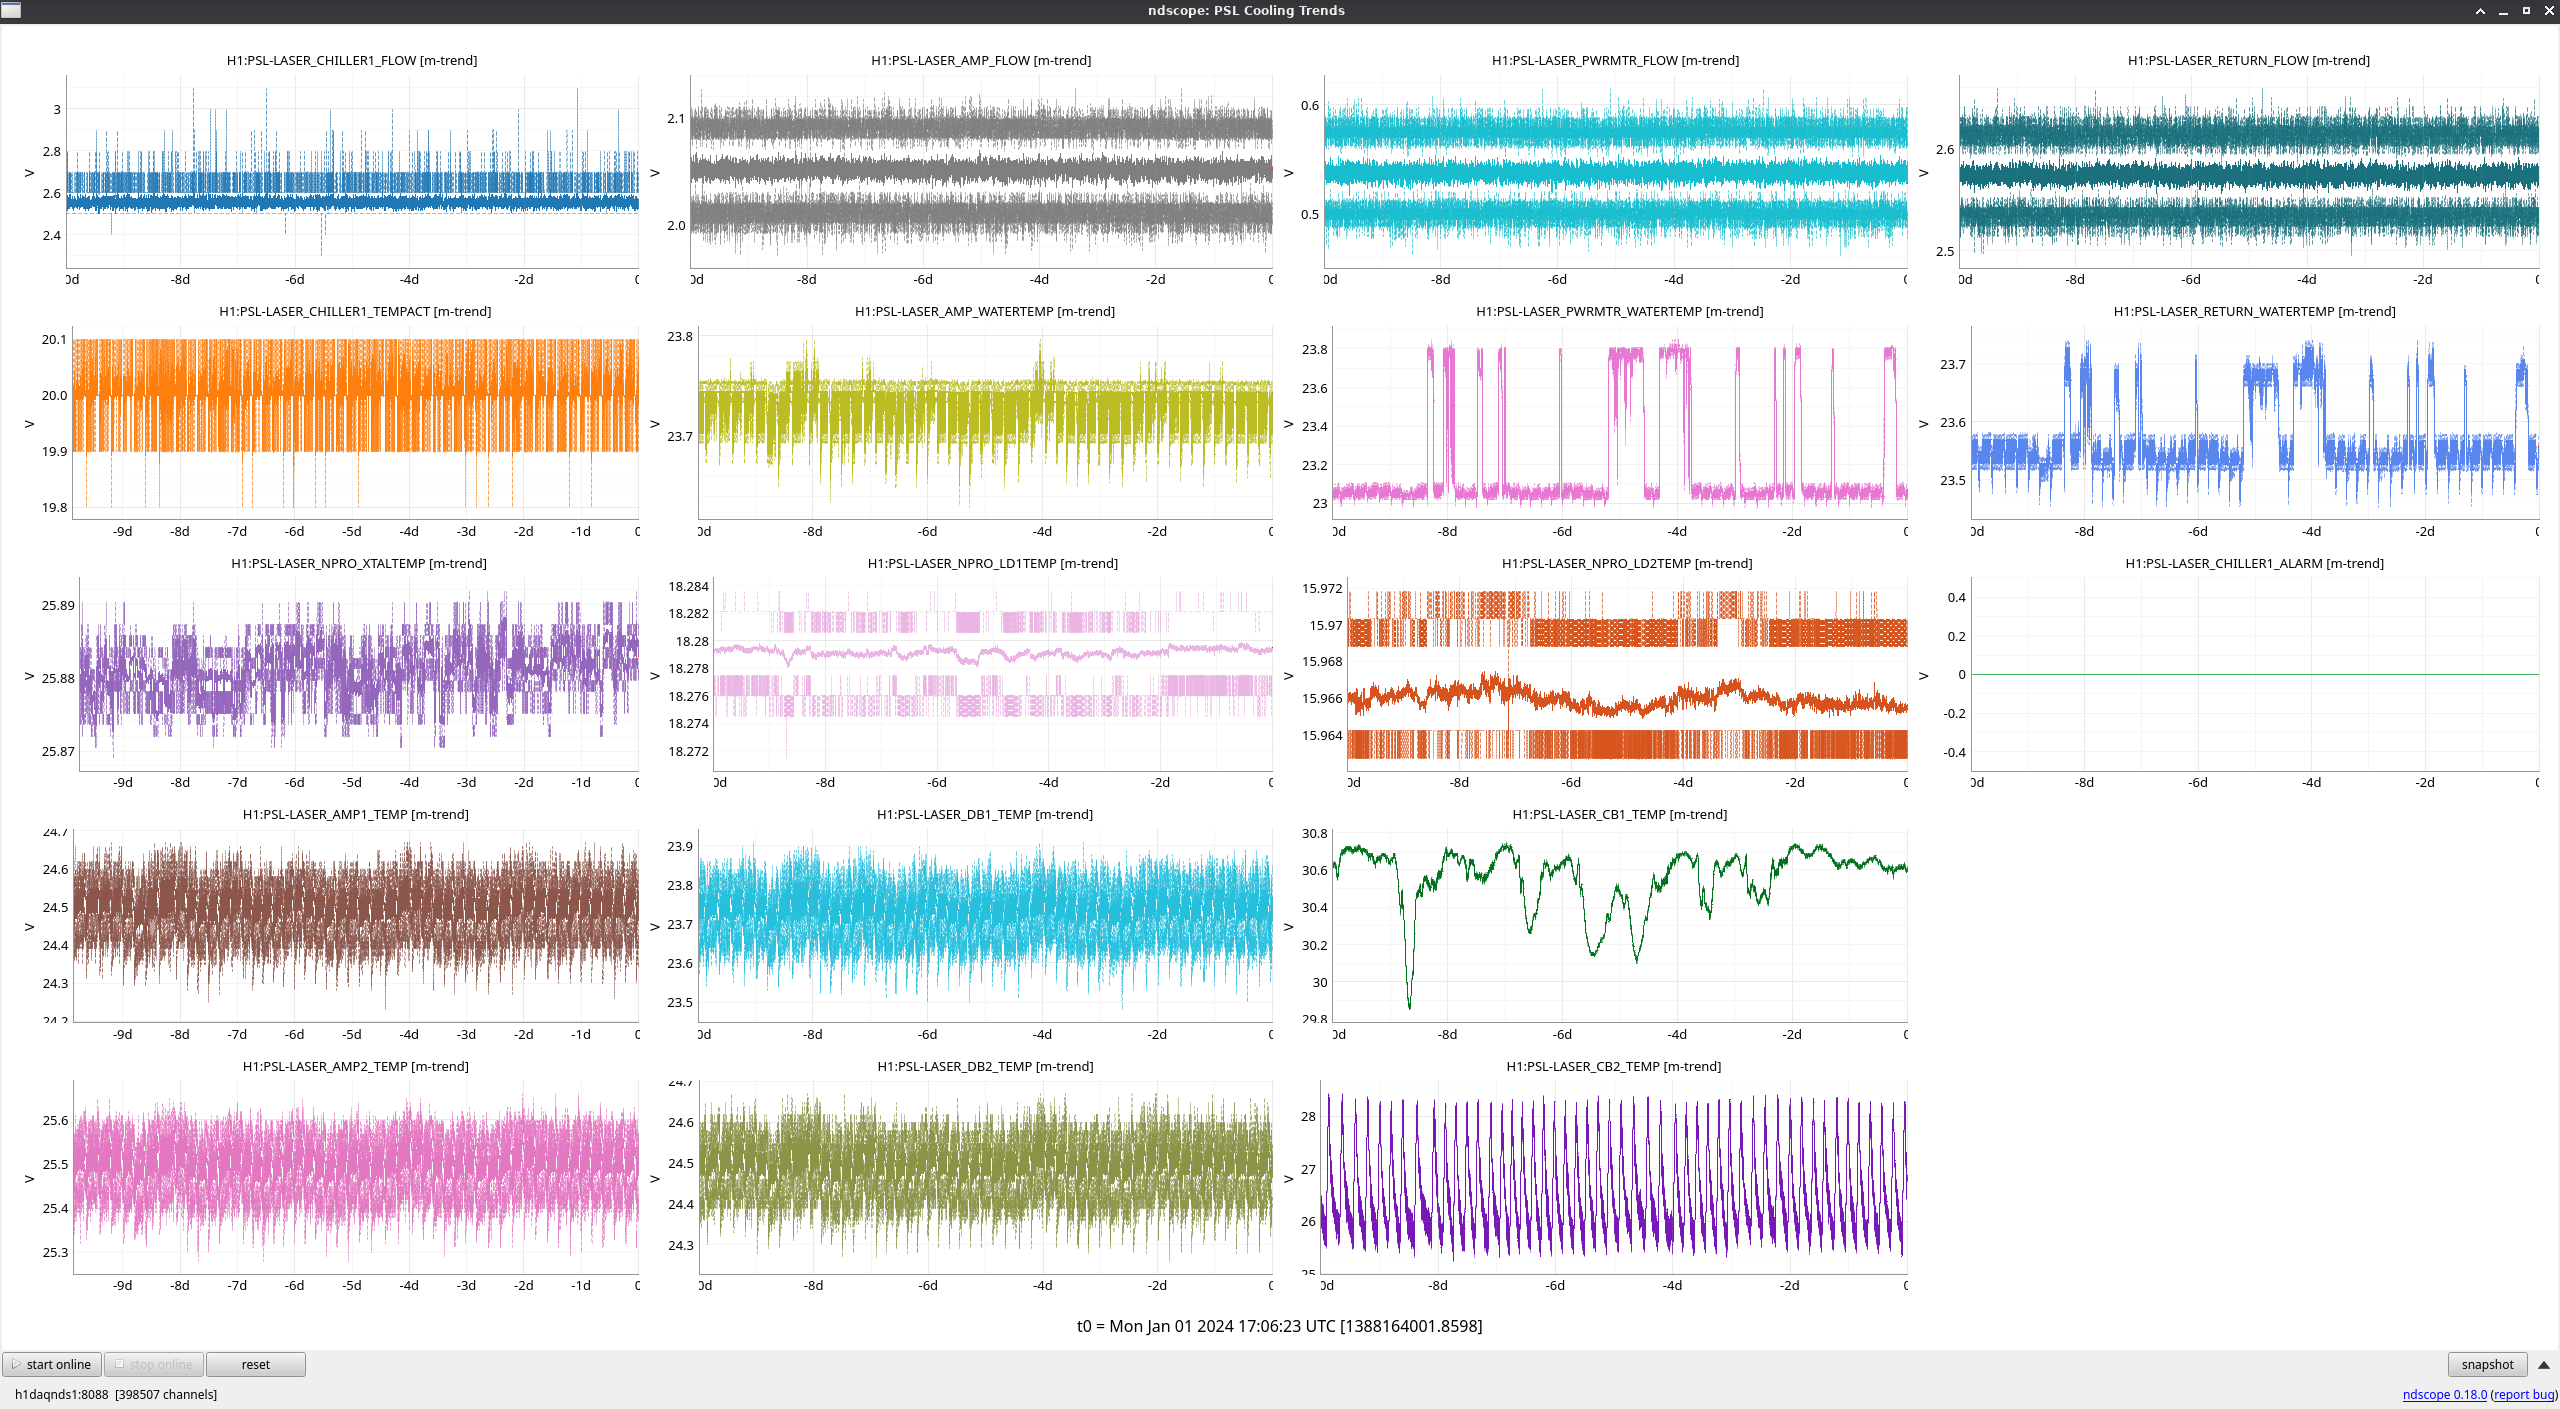
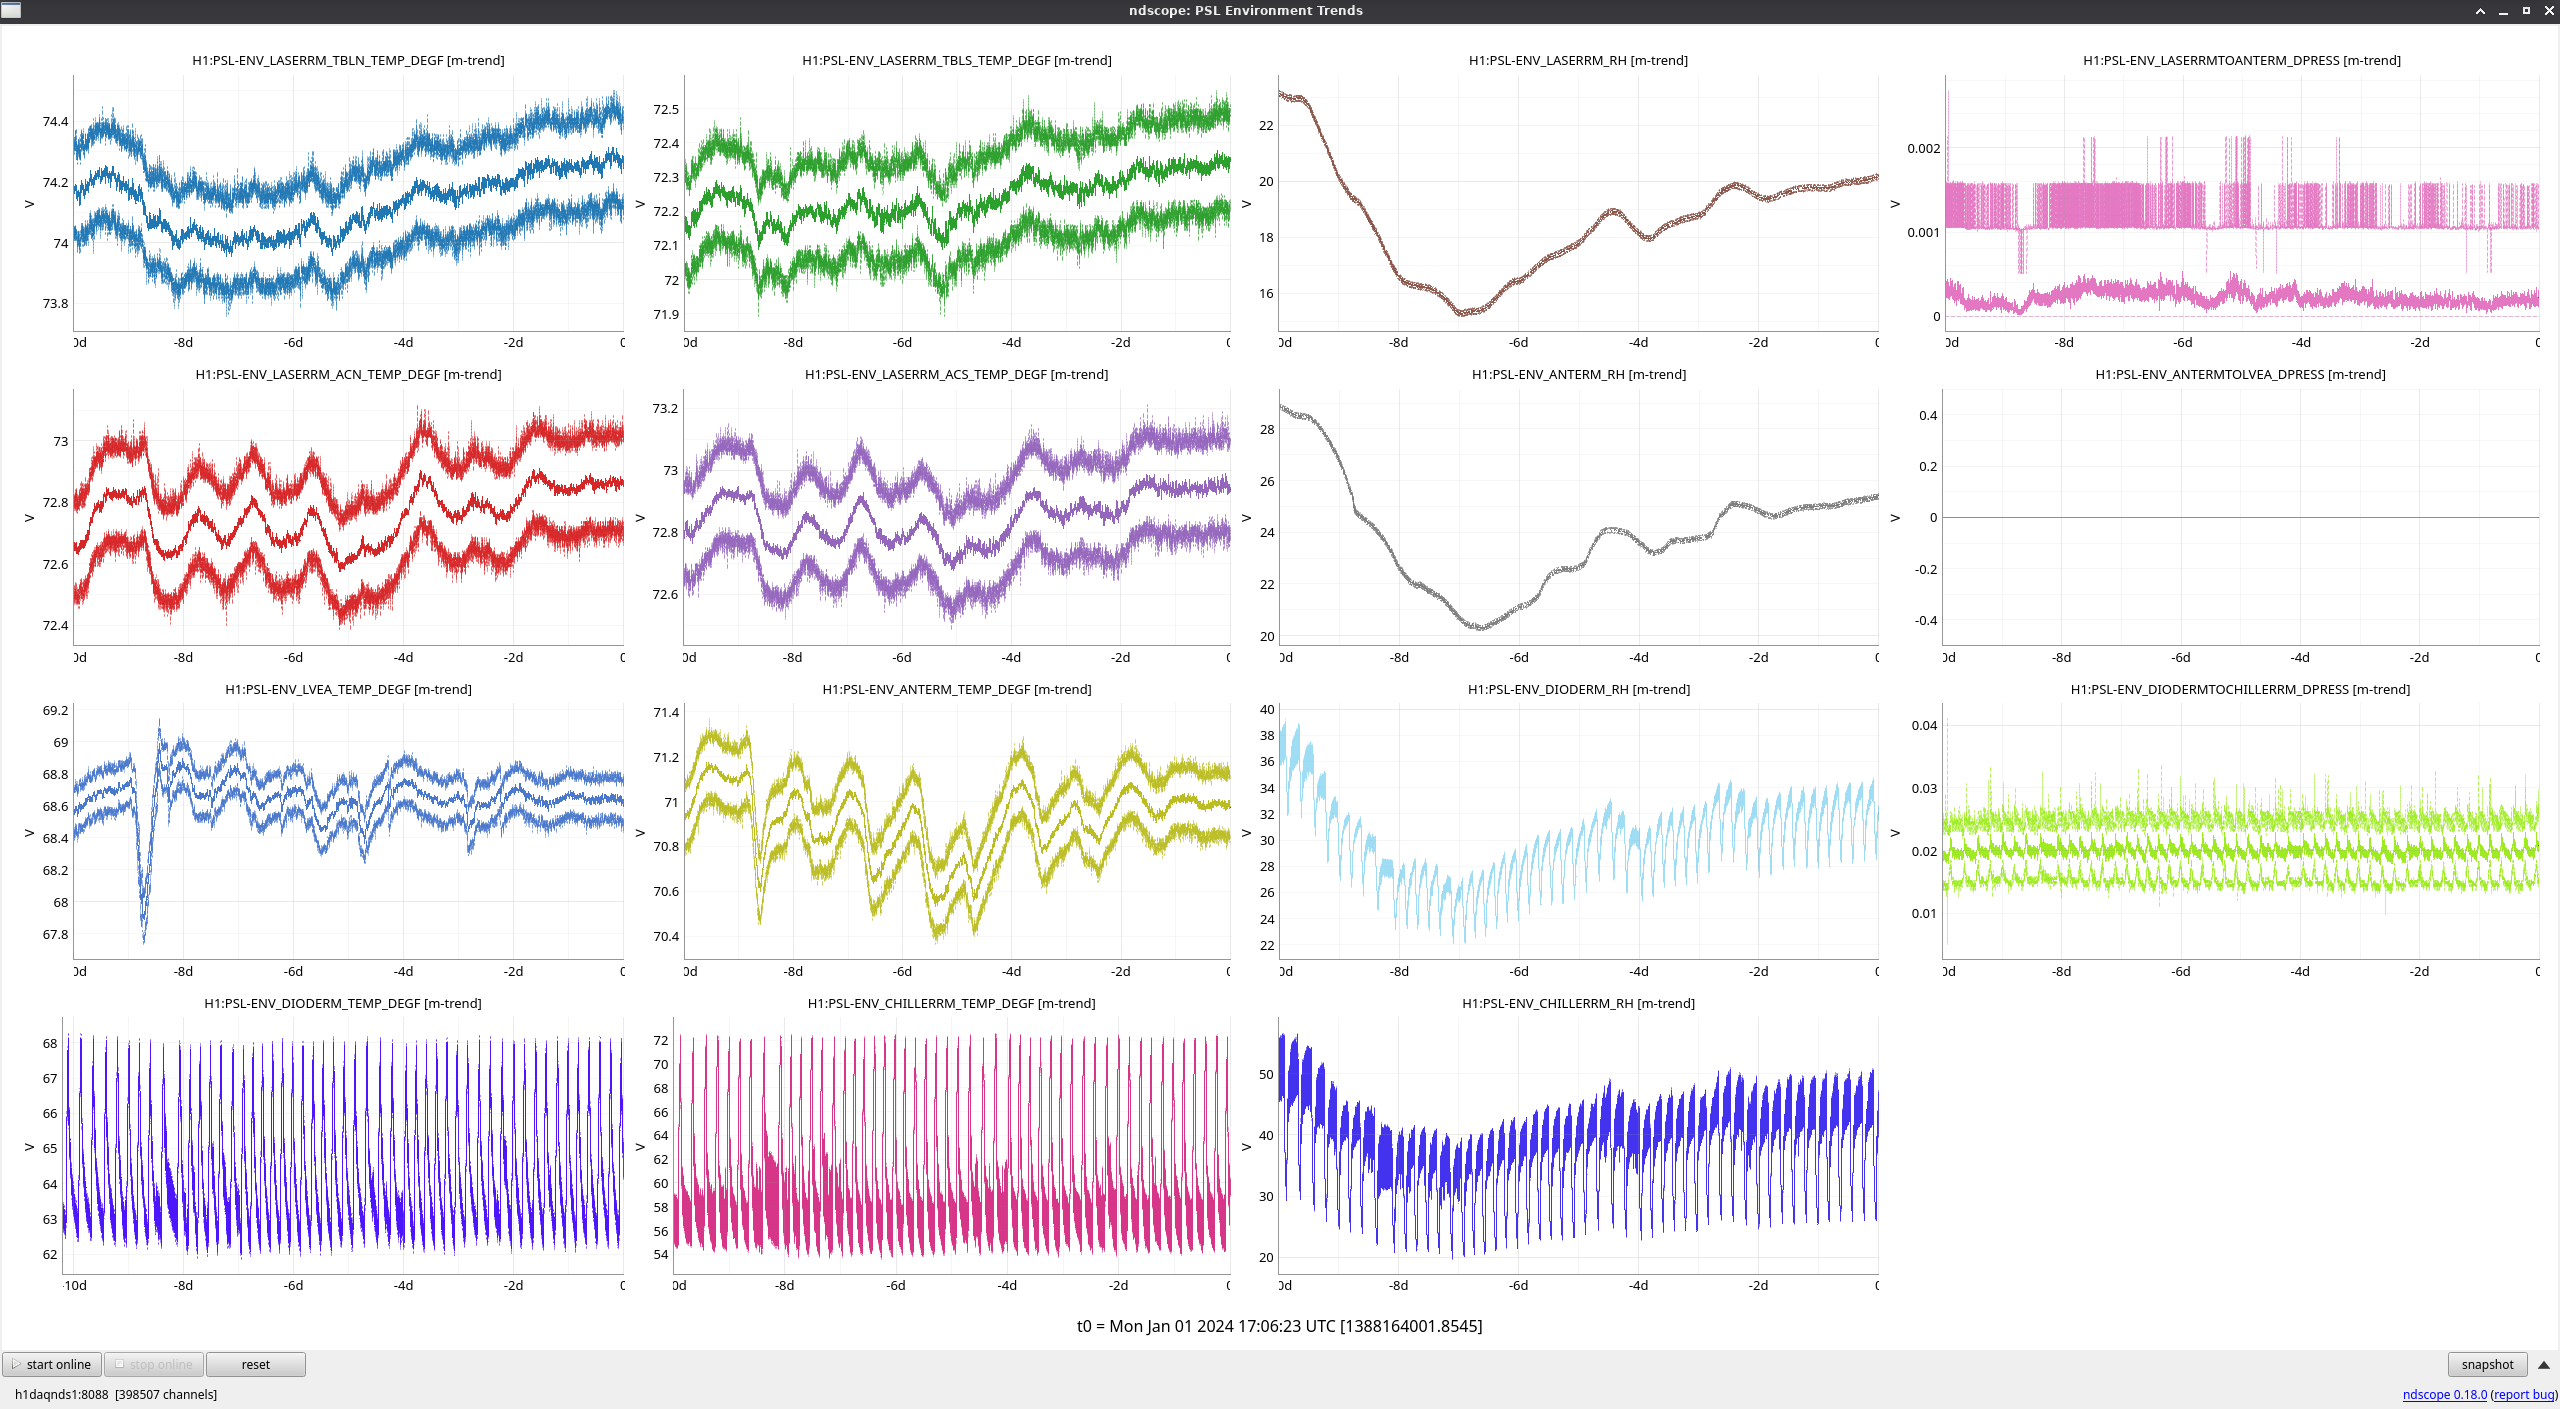
FAMIS 19969
pH of PSL chiller water was measured to be between 10.0 and 10.5 according to the color of the test strip.
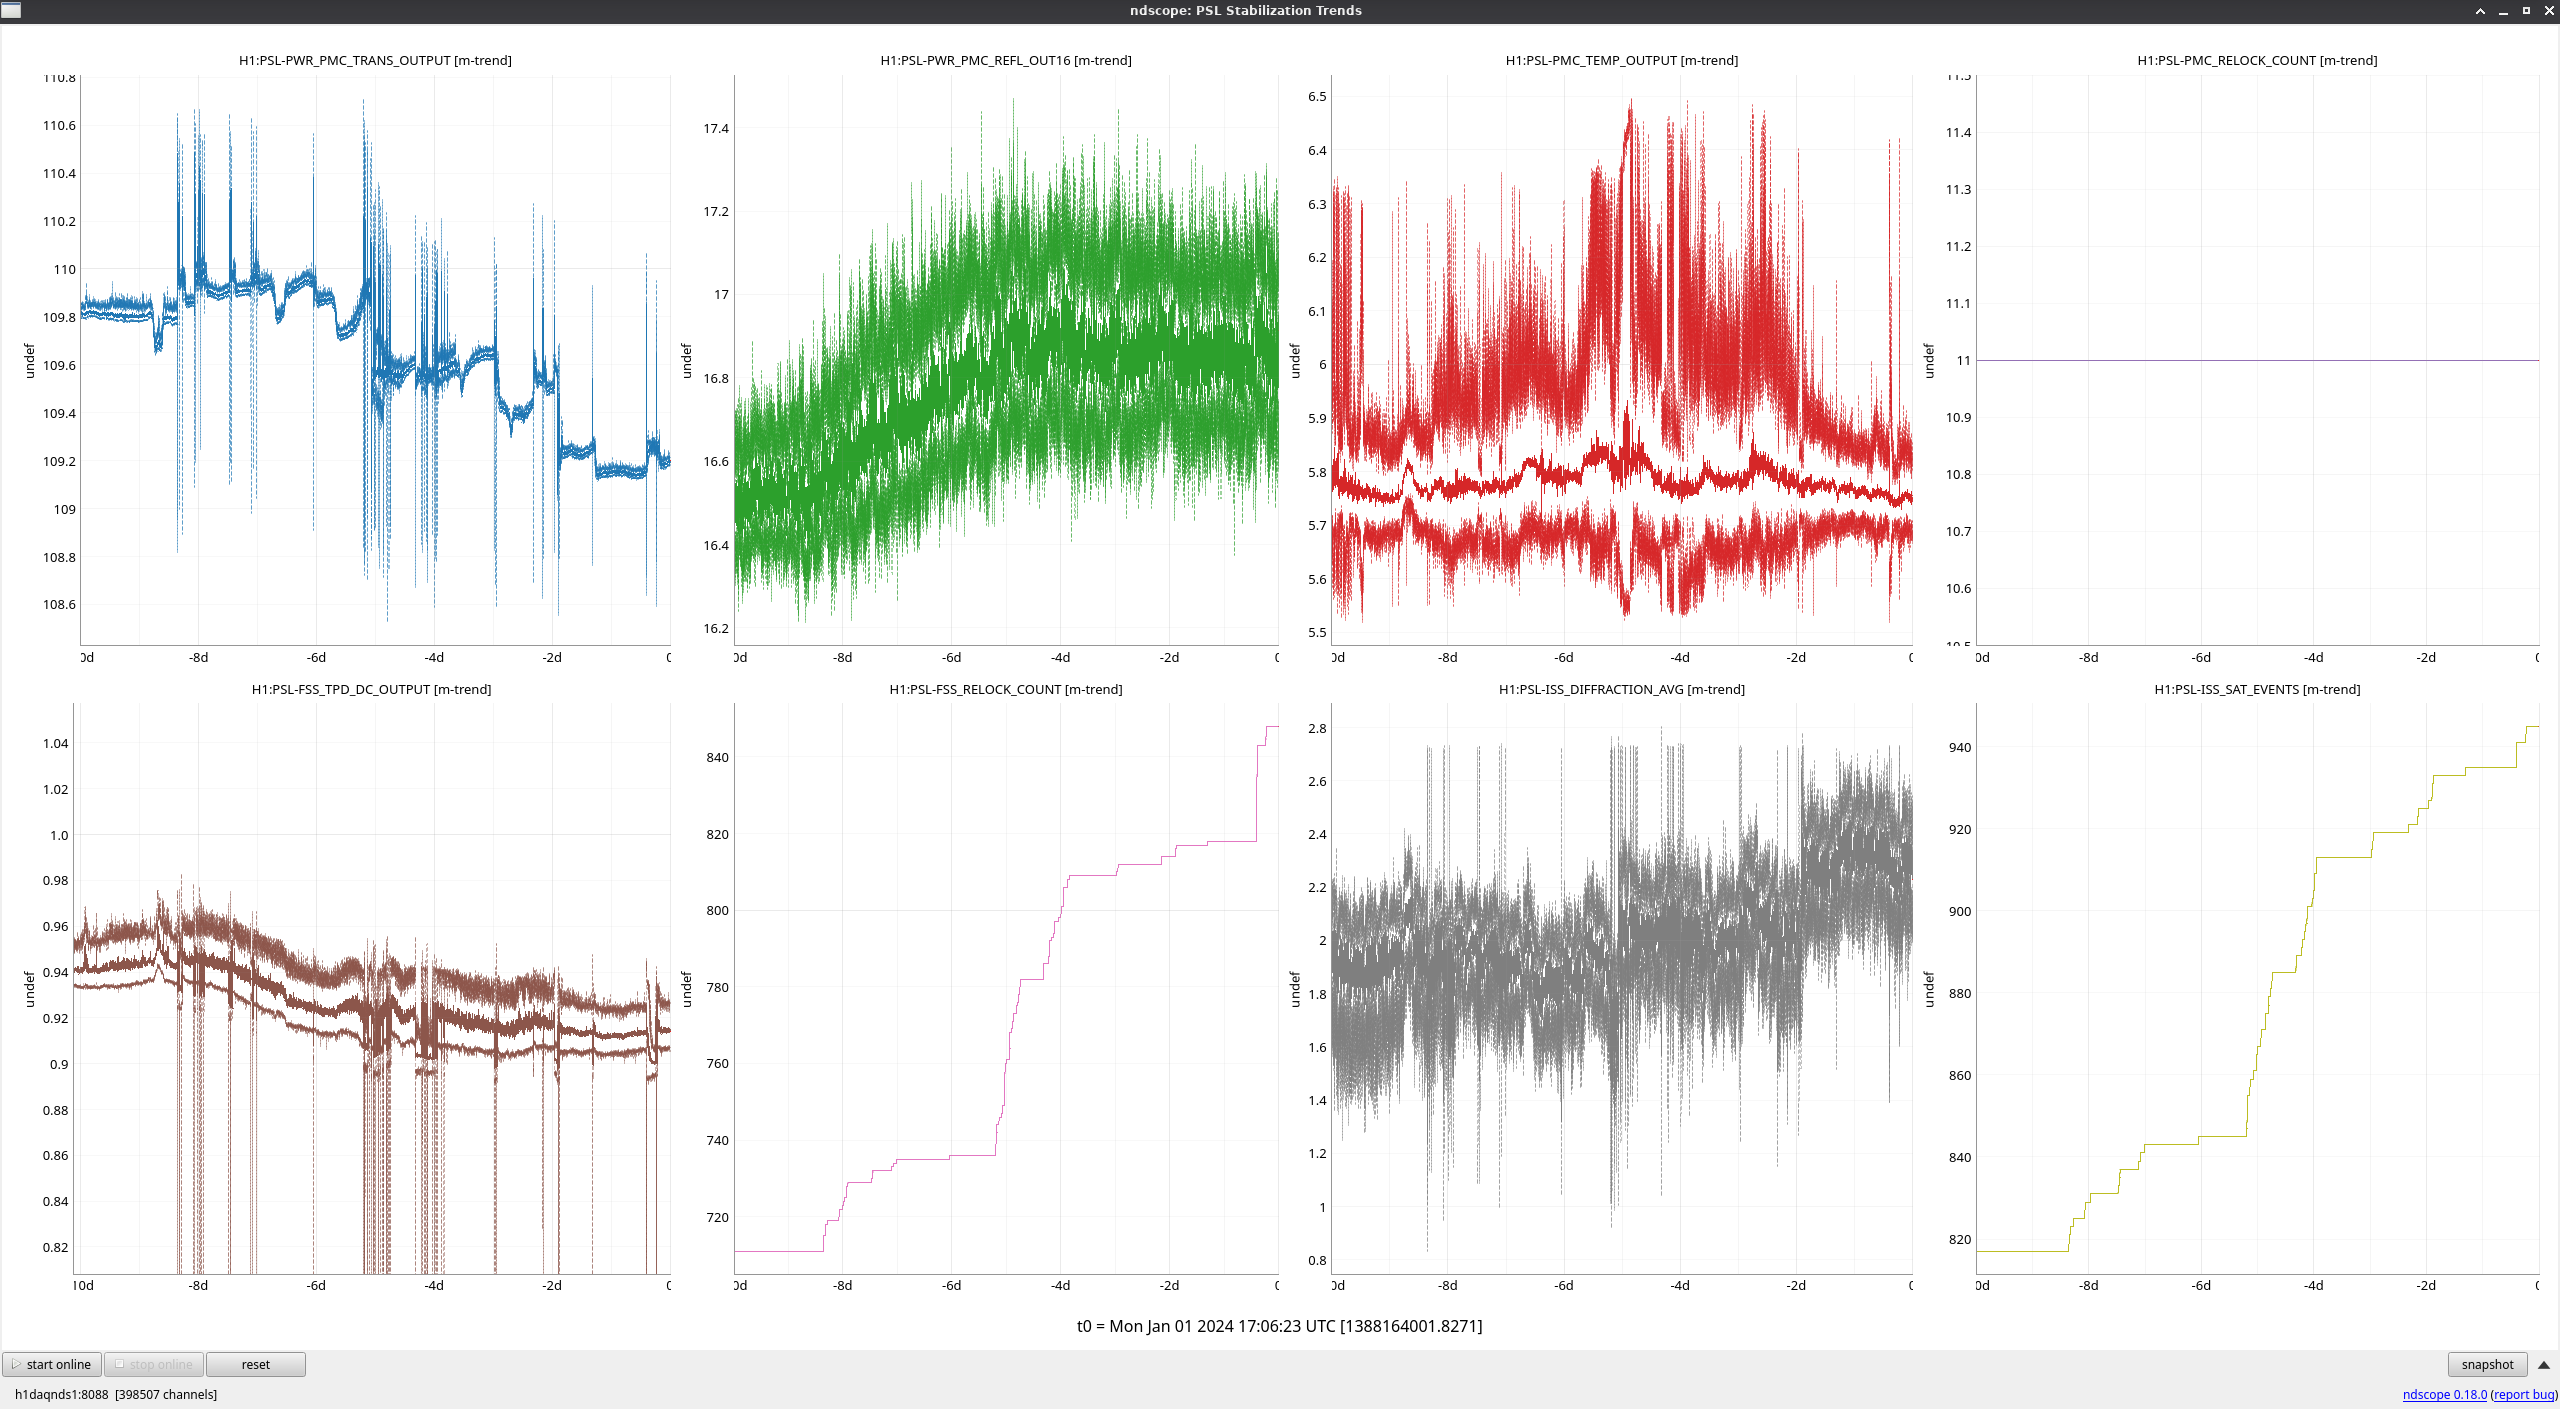
FAMIS 20009
PMC transmitted power has decreased by almost 1W over the past week and reflected power has increased by ~0.5W over the same time period.
TITLE: 01/01 Day Shift: 16:00-00:00 UTC (08:00-16:00 PST), all times posted in UTC
STATE of H1: Observing at 153Mpc
OUTGOING OPERATOR: TJ
CURRENT ENVIRONMENT:
SEI_ENV state: CALM
Wind: 6mph Gusts, 4mph 5min avg
Primary useism: 0.03 μm/s
Secondary useism: 0.36 μm/s
QUICK SUMMARY:
H1 has been locked and observing for 3 hours after being down most of the night following the M7.5 quake in Japan
DIAG_MAIN is showing an error from being unable to connect to channel H1:TCS-ITMX_HWS_LIVE_ACQUISITION_GPSTIM (likely shortened name on SPM diffs screen; tagging TCS and CDS)
All other systems look good. Welcome to 2024!
TITLE: 01/01 Eve Shift: 00:00-08:00 UTC (16:00-00:00 PST), all times posted in UTC
STATE of H1: Earthquake
INCOMING OPERATOR: TJ
SHIFT SUMMARY: Locked for most of the shift until the lockloss at 07:21UTC from a 7.4 from Japan, holding in down while the ground settles and probably will be for another hour.
I ran a cal measurement when I saw LLO was down and doing an Initial Alignment. Starting at 01:37UTUC finishing at 02:02UTC.
Lockloss from a large earthquake (7.4 by Japan). Holding ISC_LOCK in down till the ground motion resides.