Rahul, Fil, Oli
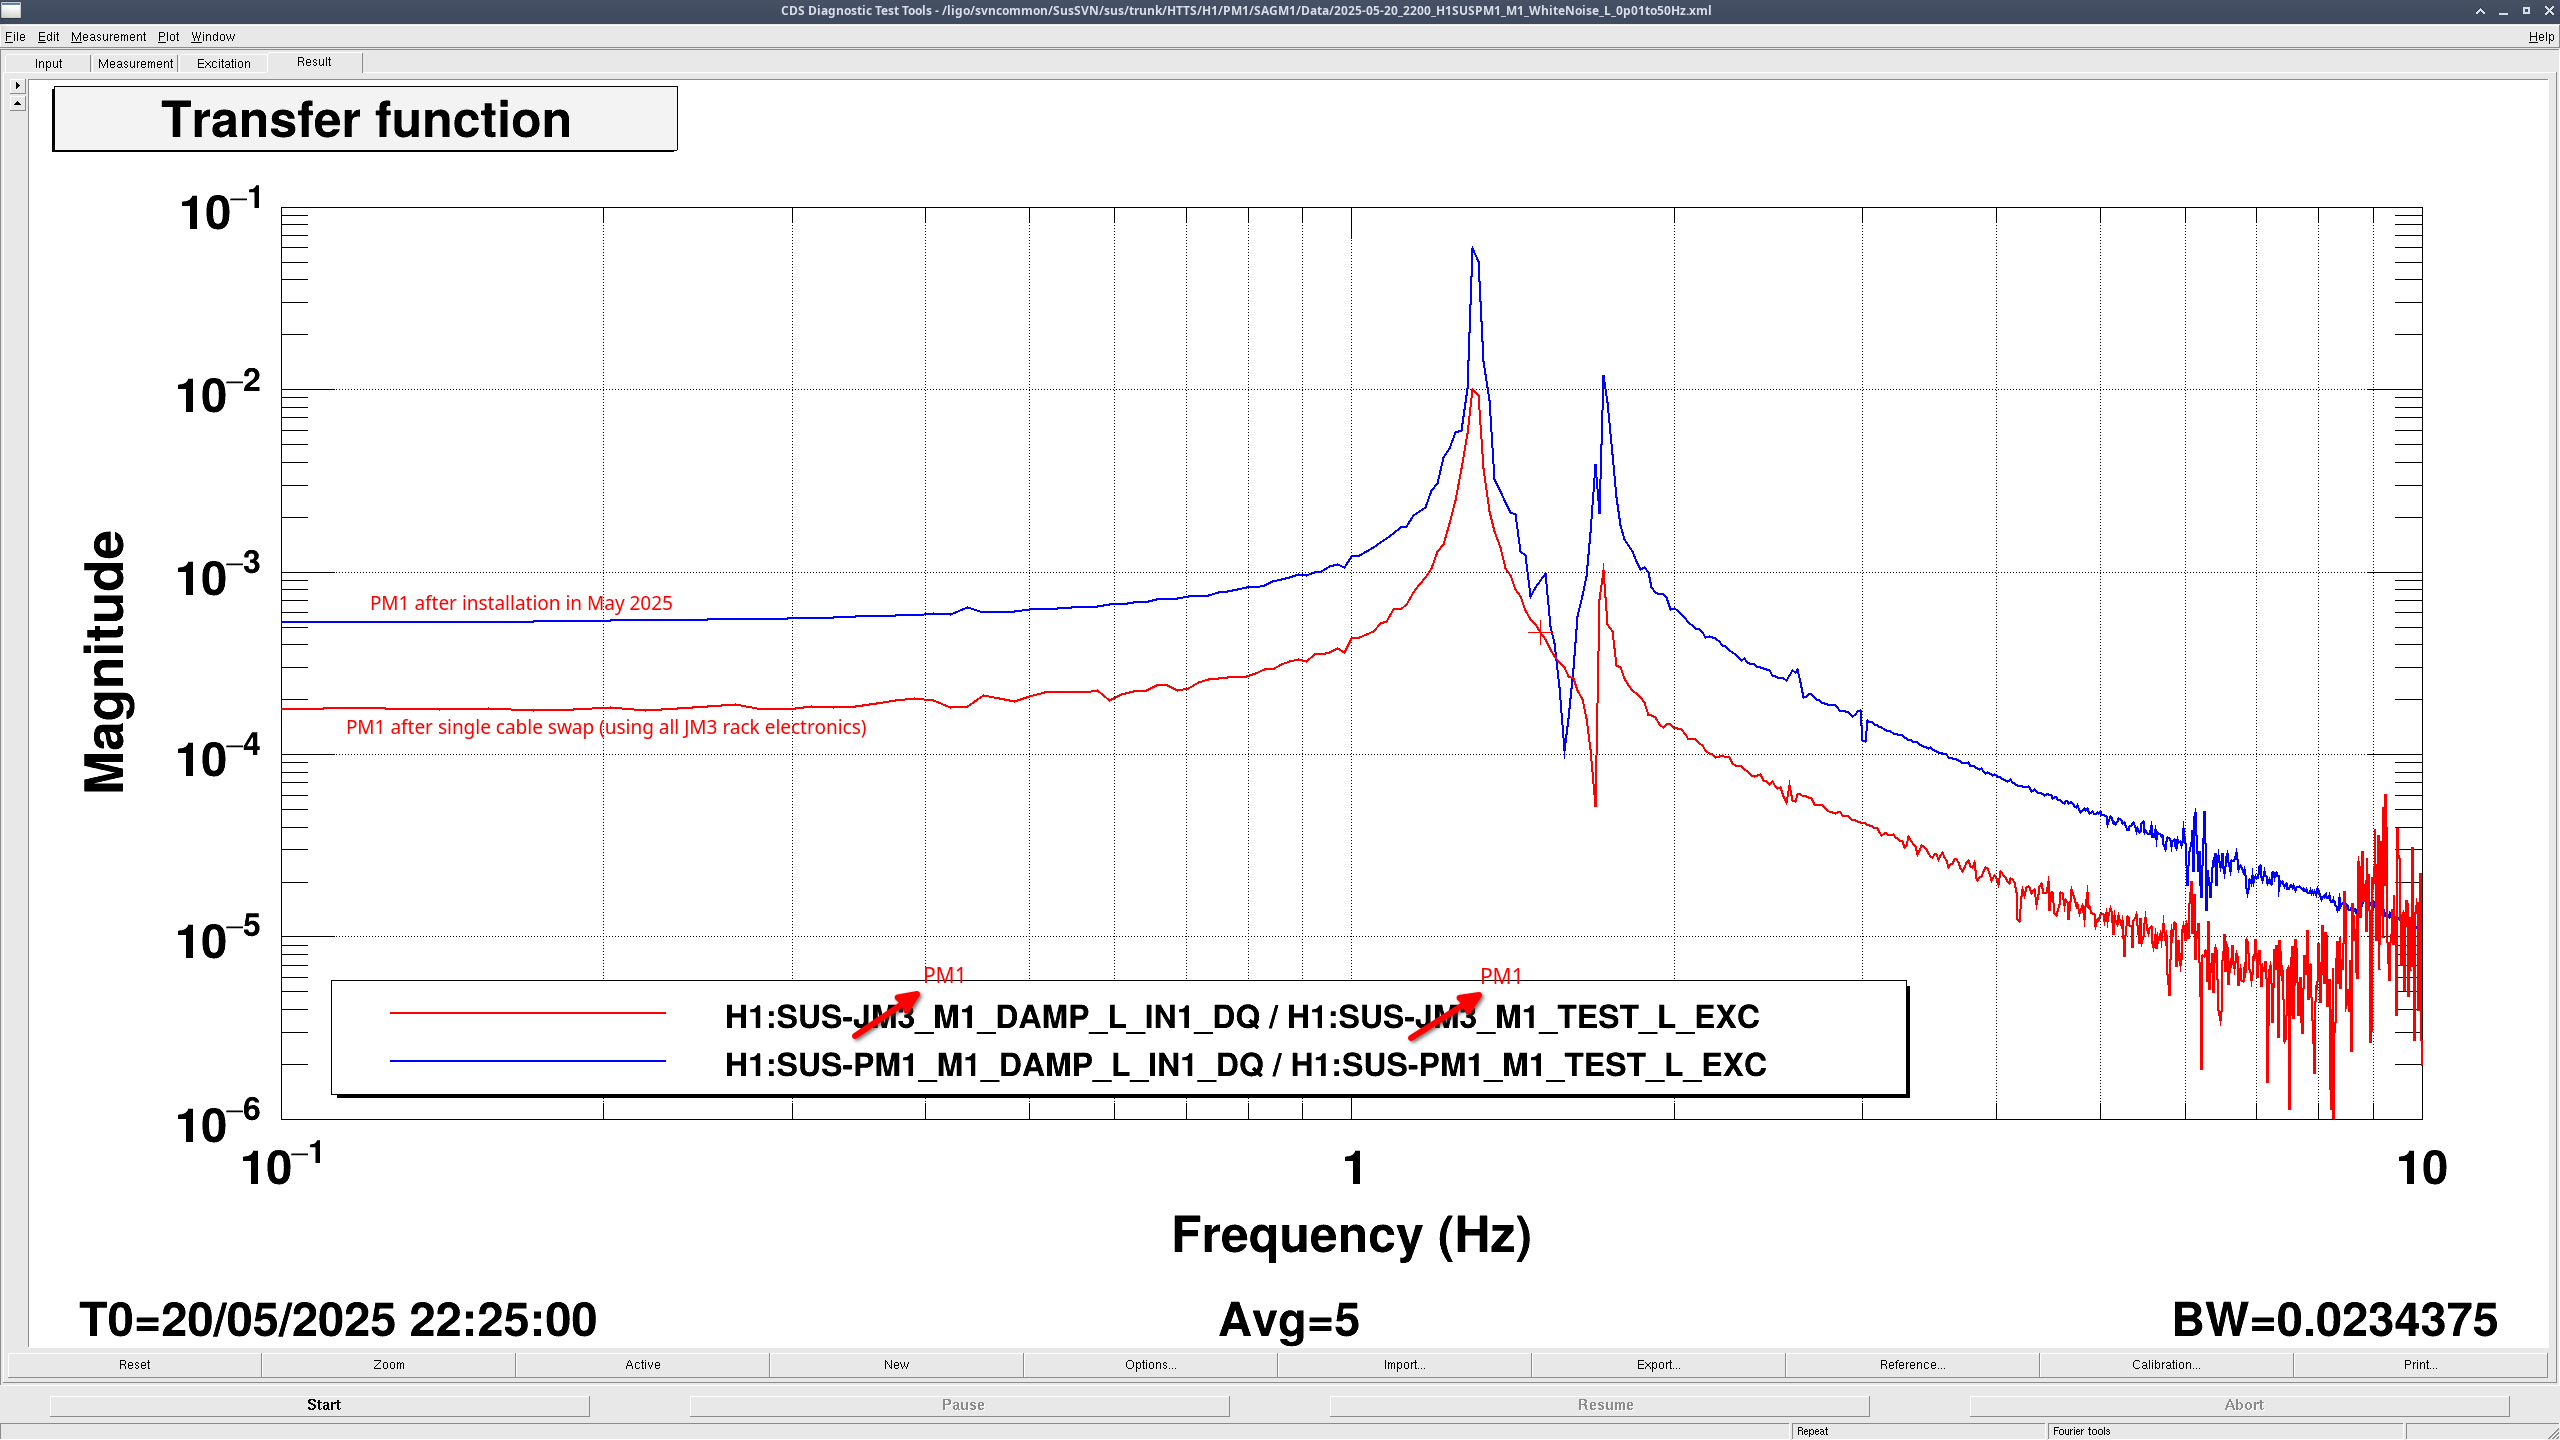
We still don't know why PM1 looks different now than it did when we installed it back in May 2025. Currently, we've nailed it down to two possibillities: (1) there's an issue with PM1 somewhere between the satamp and the in-chamber stuff, or (2) the December 2025 satamp swap to a modified satamp changed the magnitude of PM1 (we are not sure if this makes sense).
Here are some measurements we took yesterday and the things we've looked at so far.
Satamp
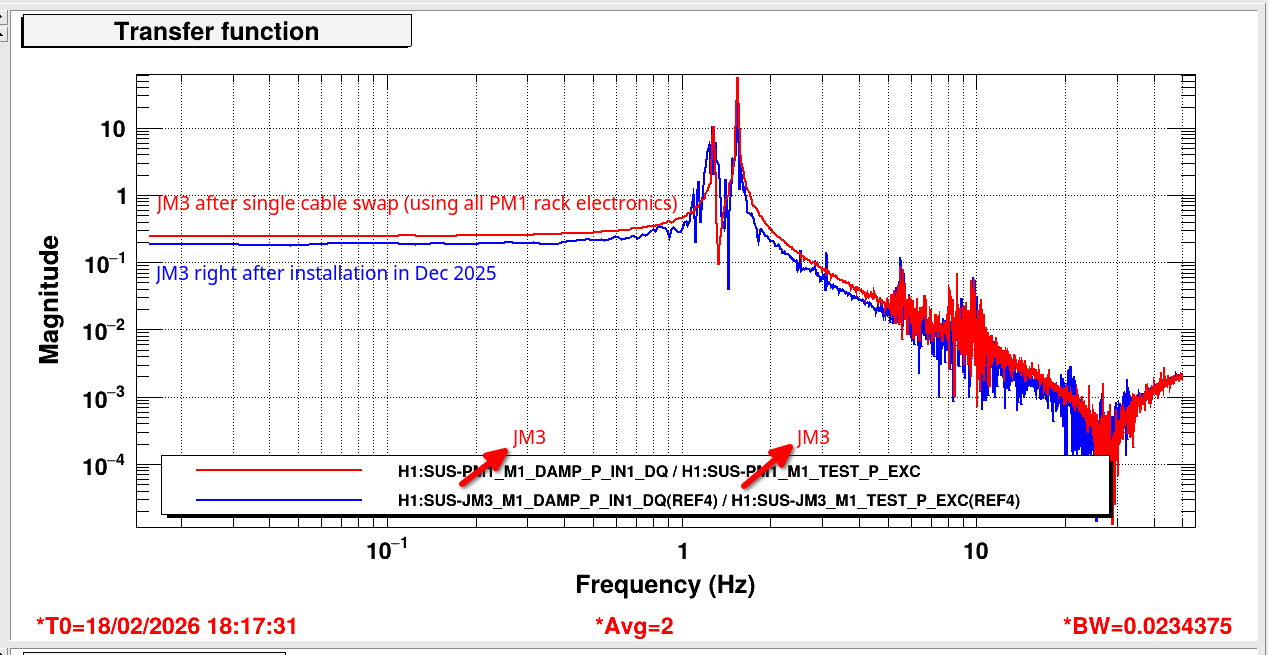
We were worried about the satamp, which is a dual satamp, swapped in in December 2025 (88590), with JM3 taking up the other half, so I took some transfer functions yesterday morning for both PM1 and JM3. I compared JM3 now to how it looked when we first installed it in December 2025, and it looks exactly the same, no drop in magnitude for JM (JM3 Dec2025 vs Feb 2026), and no increase in magnitude for PM1 (PM1 May 2025 vs Feb 2026).
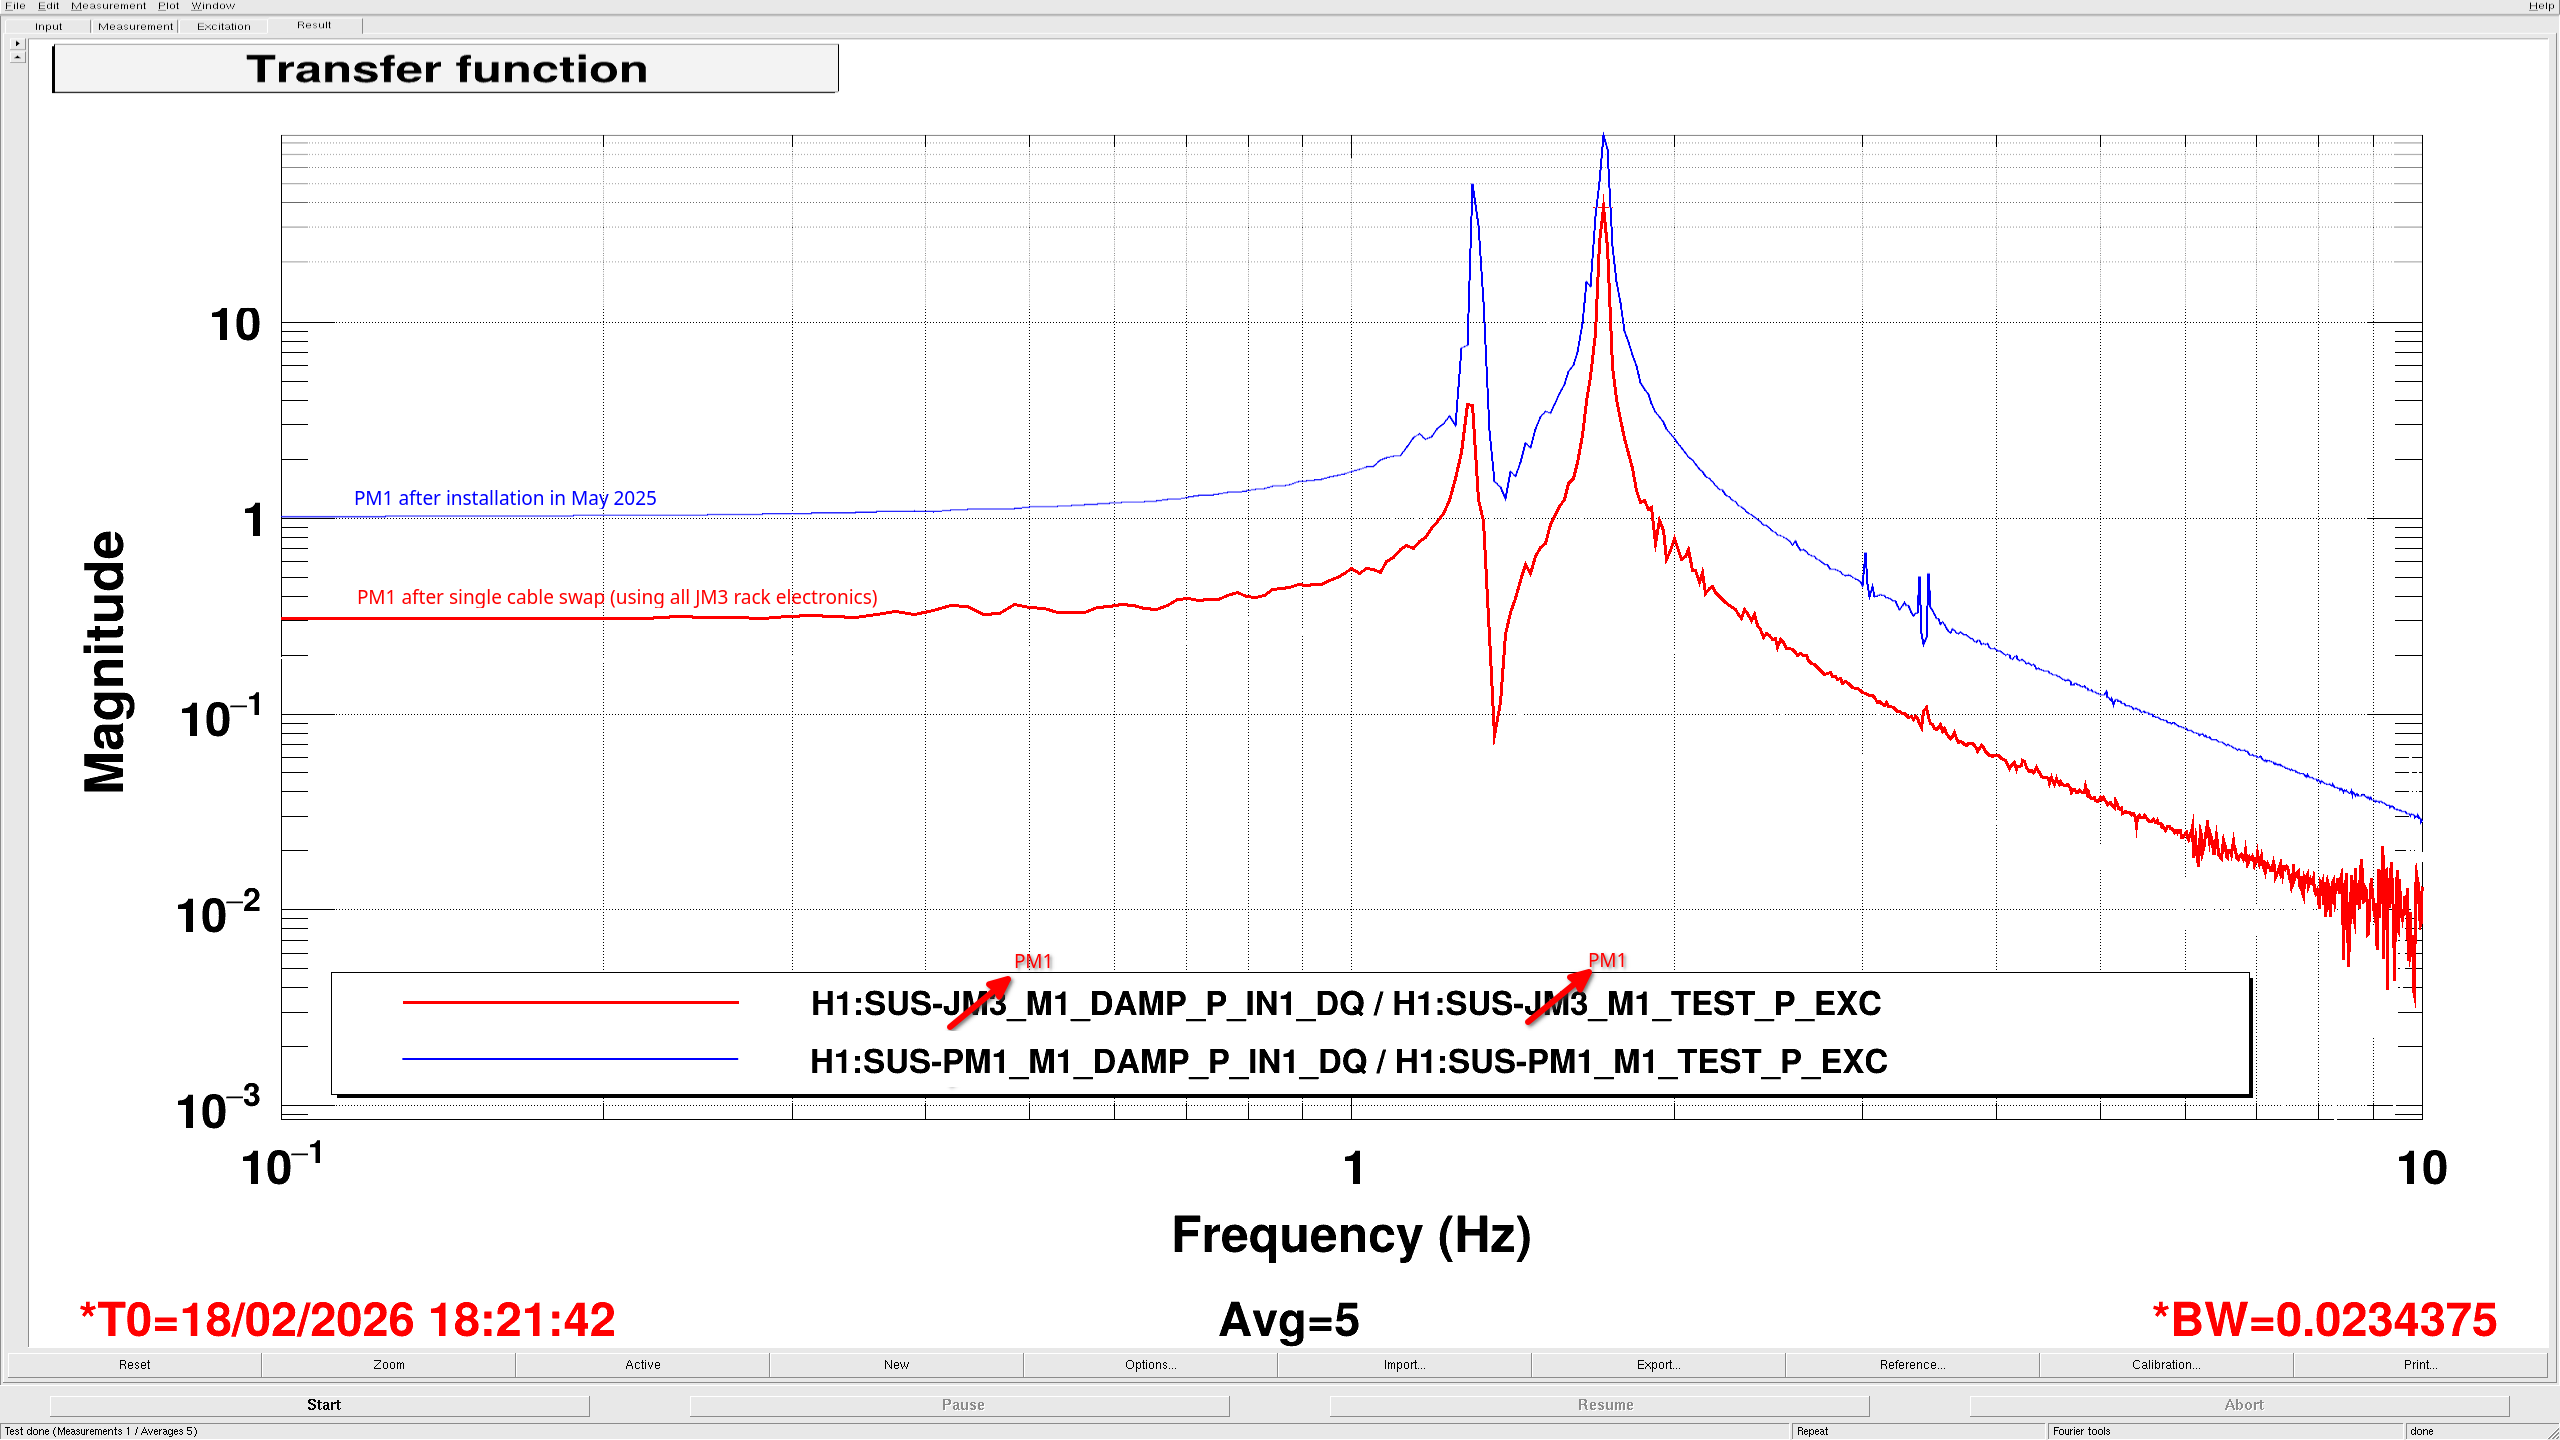
Fil then swapped all the PM1 cables on the satamp with all the JM3 cables on the satamp. This made it so the only difference between the previous and these measurements is the part of the satamp used. These measurements for PM1 and JM3 still looked the same as the earlier measurement, so it's not the satamp (PM1 JM3 comparison). These comparison plots really show how much PM1 changed compared to JM3.
All other in-air electronics
The only other difference from the measurements last May for PM1 should be the coil driver, since the other one failed (88998). The new coil driver is modified, just like the old one, and is being correctly compensated for in the coil drive filter banks. To check this, as well as the rest of the in-air electronics, Fil swapped everything back to nominal EXCEPT for the cables that run from the sat amp out to the chamber. This way, JM3 is using the in-air electronics from PM1, and PM1 is using the in-air electronics from JM3. I did a few transfer functions looking for any difference but both suspensions and electronics chains still look the same(PM1 L, PM1 P, JM3 P). This could mean that the issue with PM1 is due to something in the satamp-to-chamber cable or in vacuum.
OSEMs
We checked the spectra for the PM1 BOSEMs but we did it while the purge air was up, so they're very noisy and not very useful.
Satamp question
The only other thing we can think of that could've changed the magnitude of PM1 but not affect what we're seeing in JM3 would be due to the satamp swap in December. The new modified satamp was hooked up to PM1 and JM3 on December 18, 2025 (88588). JM3 was first tested the next day, and obviously we never got a measurement of JM3 with an unmodified satamp, so if it's possible for the satamp to change the magnitude of PM1, that might be what is happening. I haven't had time yet to check whether other suspensions show anything like that.
Measurement info
PM1
2026-02-18 1600
- ISI Locked
- alignment offsets OFF
- DAMP OFF for measured DOF, ON for other DOFs
Data:
/ligo/svncommon/SusSVN/sus/trunk/HTTS/H1/PM1/SAGM1/Data/2026-02-18_1600_H1SUSPM1_M1_WhiteNoise_{L,P,Y}_0p02to50Hz.xml
12905
Results:
/ligo/svncommon/SusSVN/sus/trunk/HTTS/H1/PM1/SAGM1/Results/2026-02-18_1600_H1SUSPM1_M1_ALL_TFs.pdf
12909
2026-02-18 1715
- satamp inputs swapped with JM3 (tfs look the same)
- ISI Locked
- alignment offsets OFF
- DAMP OFF
Data:
/ligo/svncommon/SusSVN/sus/trunk/HTTS/H1/PM1/SAGM1/Data/2026-02-18_1715_H1SUSPM1_M1_WhiteNoise_{L,P,Y}_0p02to50Hz.xml
12906
Results:
/ligo/svncommon/SusSVN/sus/trunk/HTTS/H1/PM1/SAGM1/Results/2026-02-18_1715_H1SUSPM1_M1_ALL_TFs.pdf
12909
JM3
2026-02-18 1600
- ISI Locked
- DAMP OFF
- alignment offsets OFF
- DAMP OFF for measured DOF, ON for other DOFs
Data:
/ligo/svncommon/SusSVN/sus/trunk/HTTS/H1/JM3/SAGM1/Data/2026-02-18_1600_H1SUSJM3_M1_WhiteNoise_{L,P,Y}_0p02to50Hz.xml
r12904
Results:
/ligo/svncommon/SusSVN/sus/trunk/HTTS/H1/JM3/SAGM1/Results/2026-02-18_1600_H1SUSJM3_M1_ALL_TFs.pdf
r12908
2026-02-18 1730
- satamp inputs swapped with PM1 (tfs look the same)
- ISI Locked
- alignment offsets OFF
- DAMP OFF
Data:
/ligo/svncommon/SusSVN/sus/trunk/HTTS/H1/JM3/SAGM1/Data/2026-02-18_1730_H1SUSJM3_M1_WhiteNoise_{L,P,Y}_0p02to50Hz.xml
12907
Results:
/ligo/svncommon/SusSVN/sus/trunk/HTTS/H1/JM3/SAGM1/Results/2026-02-18_1730_H1SUSJM3_M1_ALL_TFs.pdf
r12908
Comparisons
PM1 May 2025 vs PM1 Feb 18 2026
/ligo/svncommon/SusSVN/sus/trunk/HTTS/Common/Data/allhttss_2026-02-18_PM1_May2025vsFeb182026_ALL_TFs.pdf
r12911
JM3 Dec 2025 vs JM3 Feb 18 2026
/ligo/svncommon/SusSVN/sus/trunk/HTTS/Common/Data/allhttss_2026-02-18_JM3_Dec2025vsFeb182026_ALL_TFs.pdf
r12912
JM3 Dec 2025 vs JM3 Feb 18 2026 vs PM1 May 2025 vs PM1 Feb 18 2026
/ligo/svncommon/SusSVN/sus/trunk/HTTS/Common/Data/allhttss_2026-02-18_PM1_JM3_PM1looksdifferent_ALL_TFs.pdf
r12910