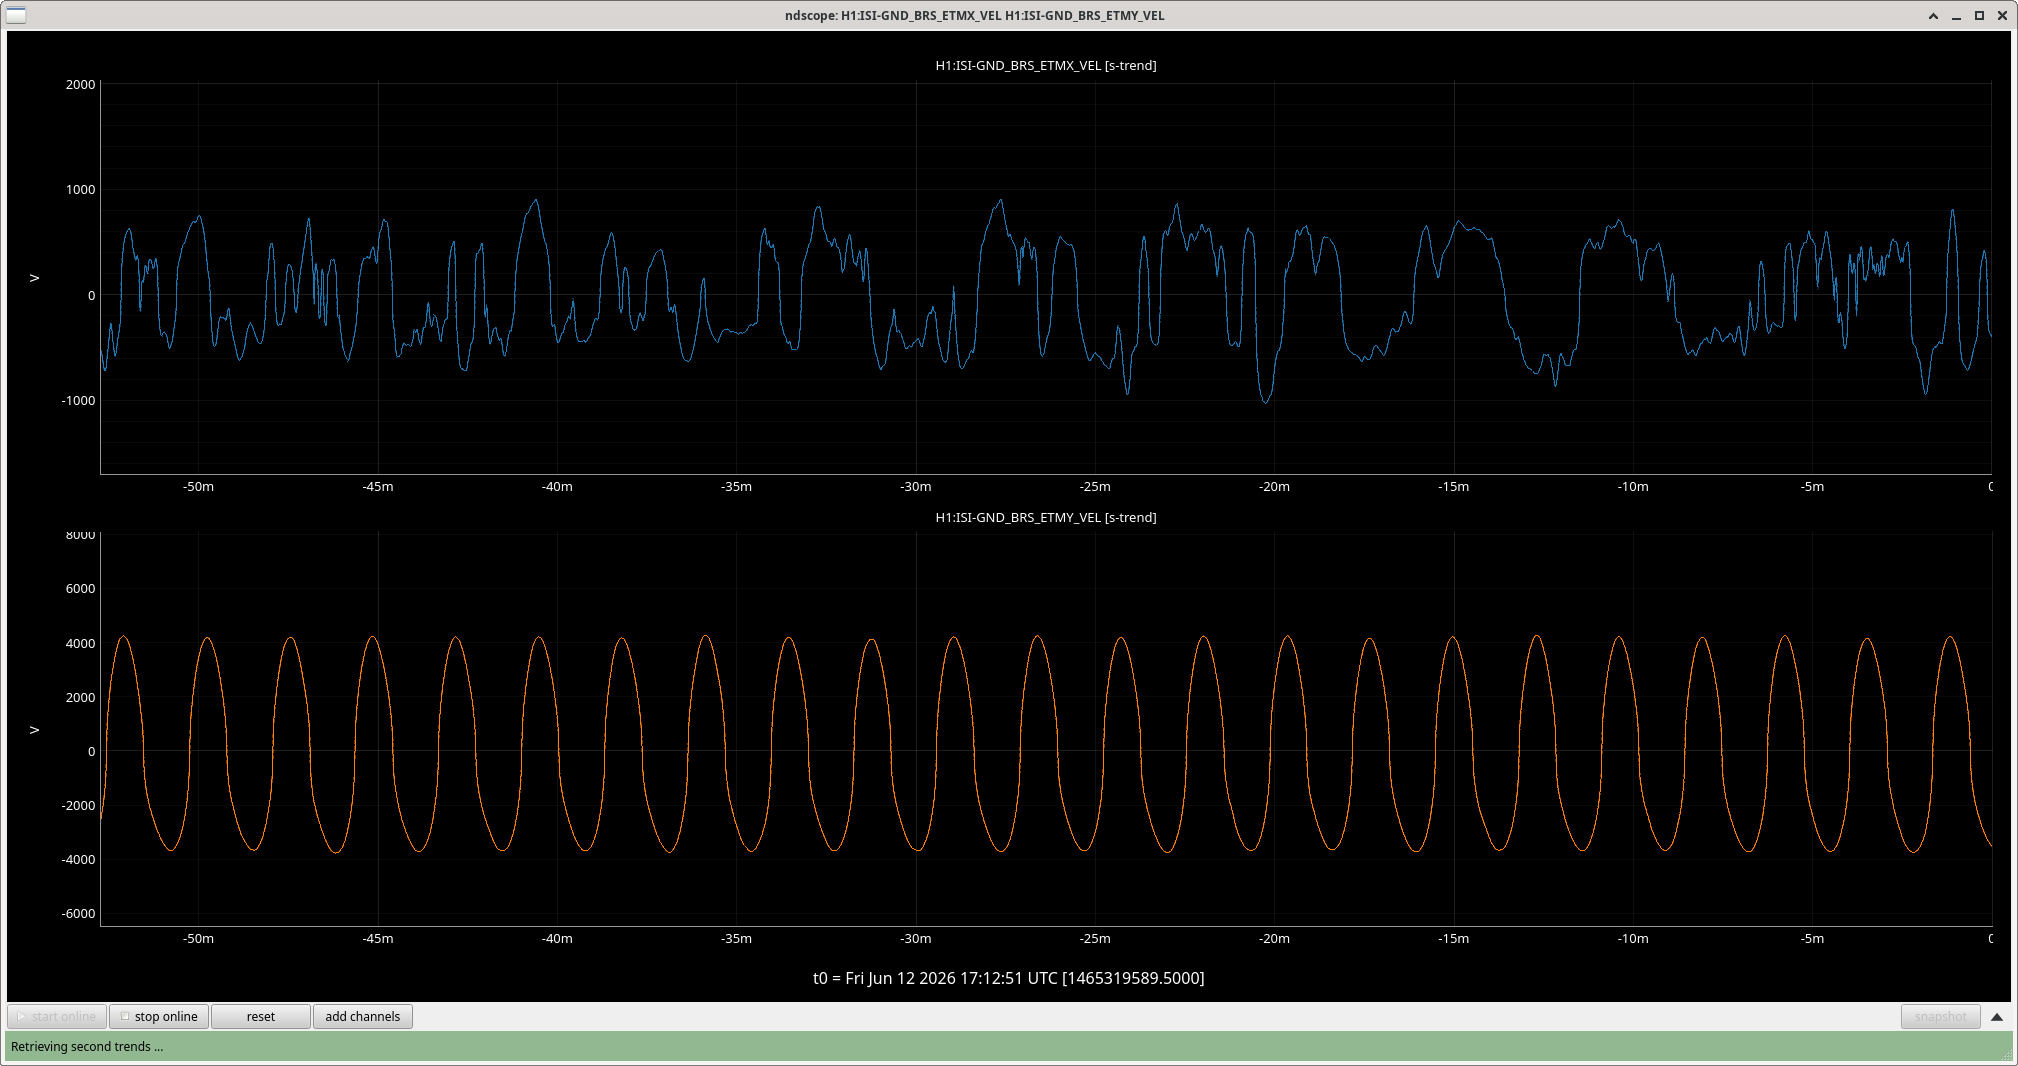
The ETMY BRS seems to be continuously ringing up. I've tried to make the changes to the thresholds which was the previous fix outlined in 87634 for the same BRS, and will check back in on it later to see if just increasing the thresholds helped at all.
Changed thresholds:
H1:ISI-GND_BRS_ETMY_LOWTHRESHOLD 800-->2000
H1:ISI-GND_BRS_ETMY_HIGHTHRESHOLD 2000-->4000 Changed
Additonally I changed the ETMX BRS drift control to 6.00V and the ETMY BRS to 2.00V to try and better center them
[Shoshana, Jim]
Shut off the damping for ~2 hours hoping it would damp down somewhat but the ringing just got worse
Jim recaptured the ETMY BRS frame to see if that would solve the problem, but it did not.
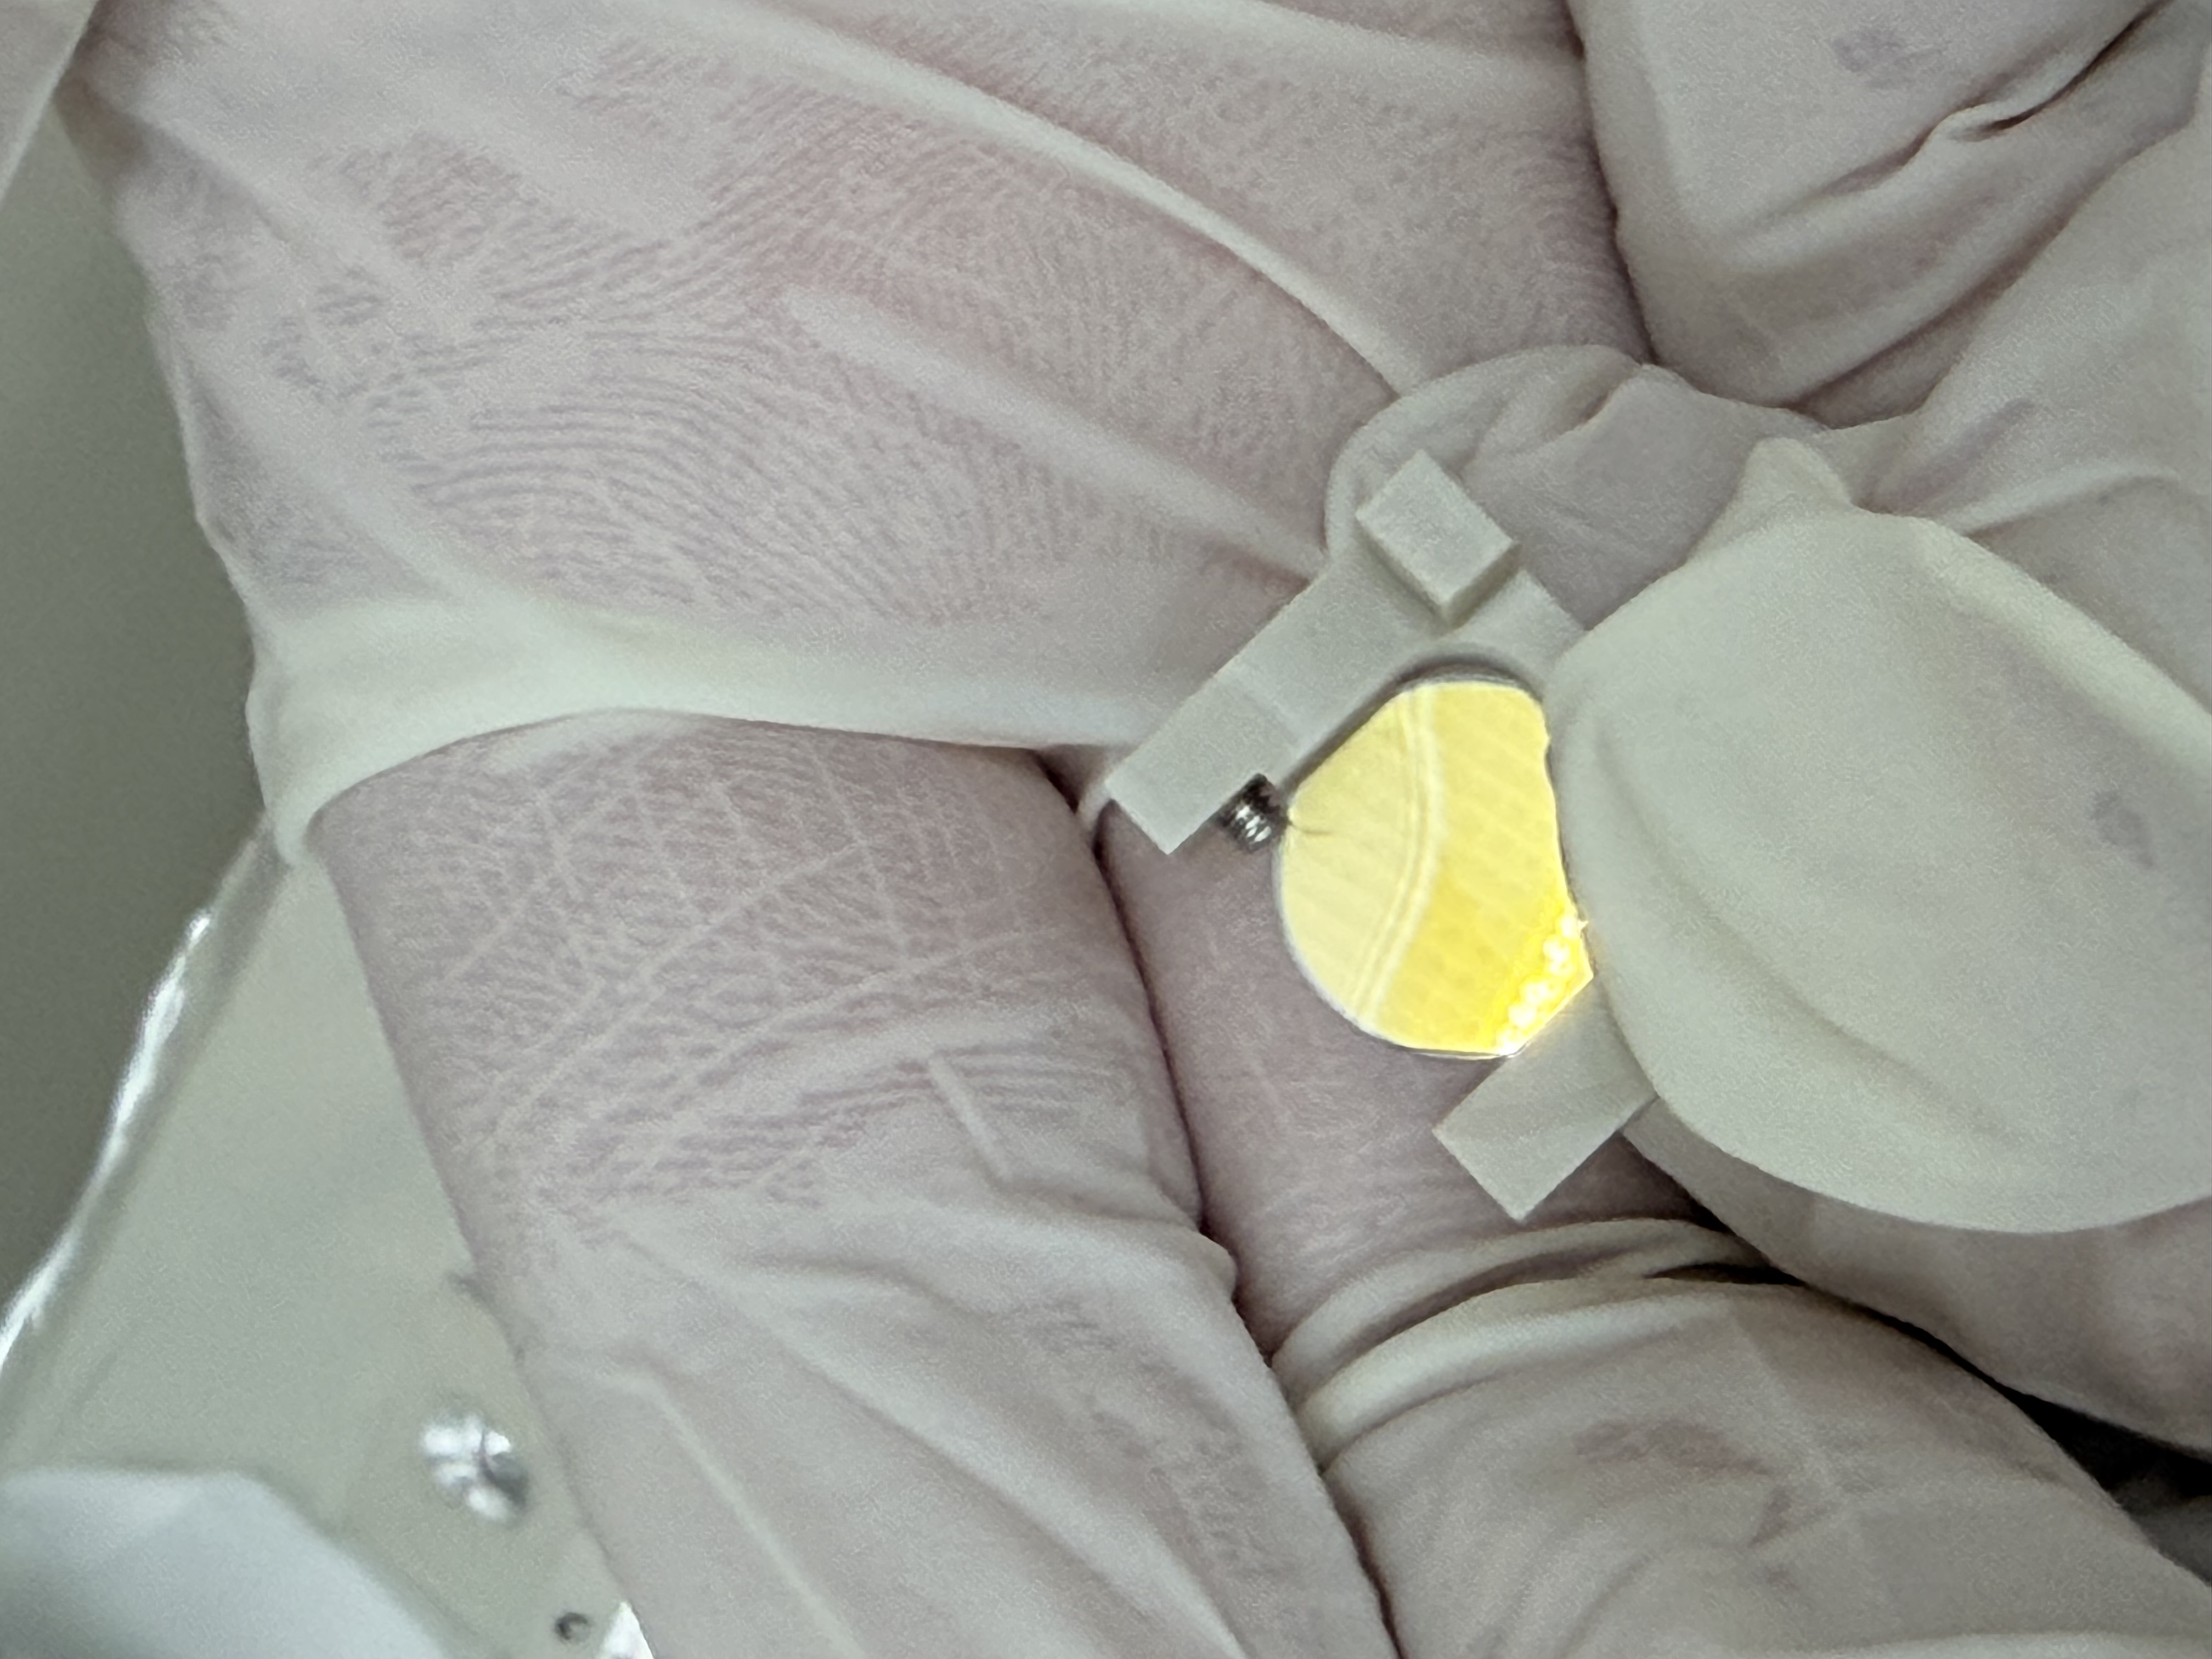
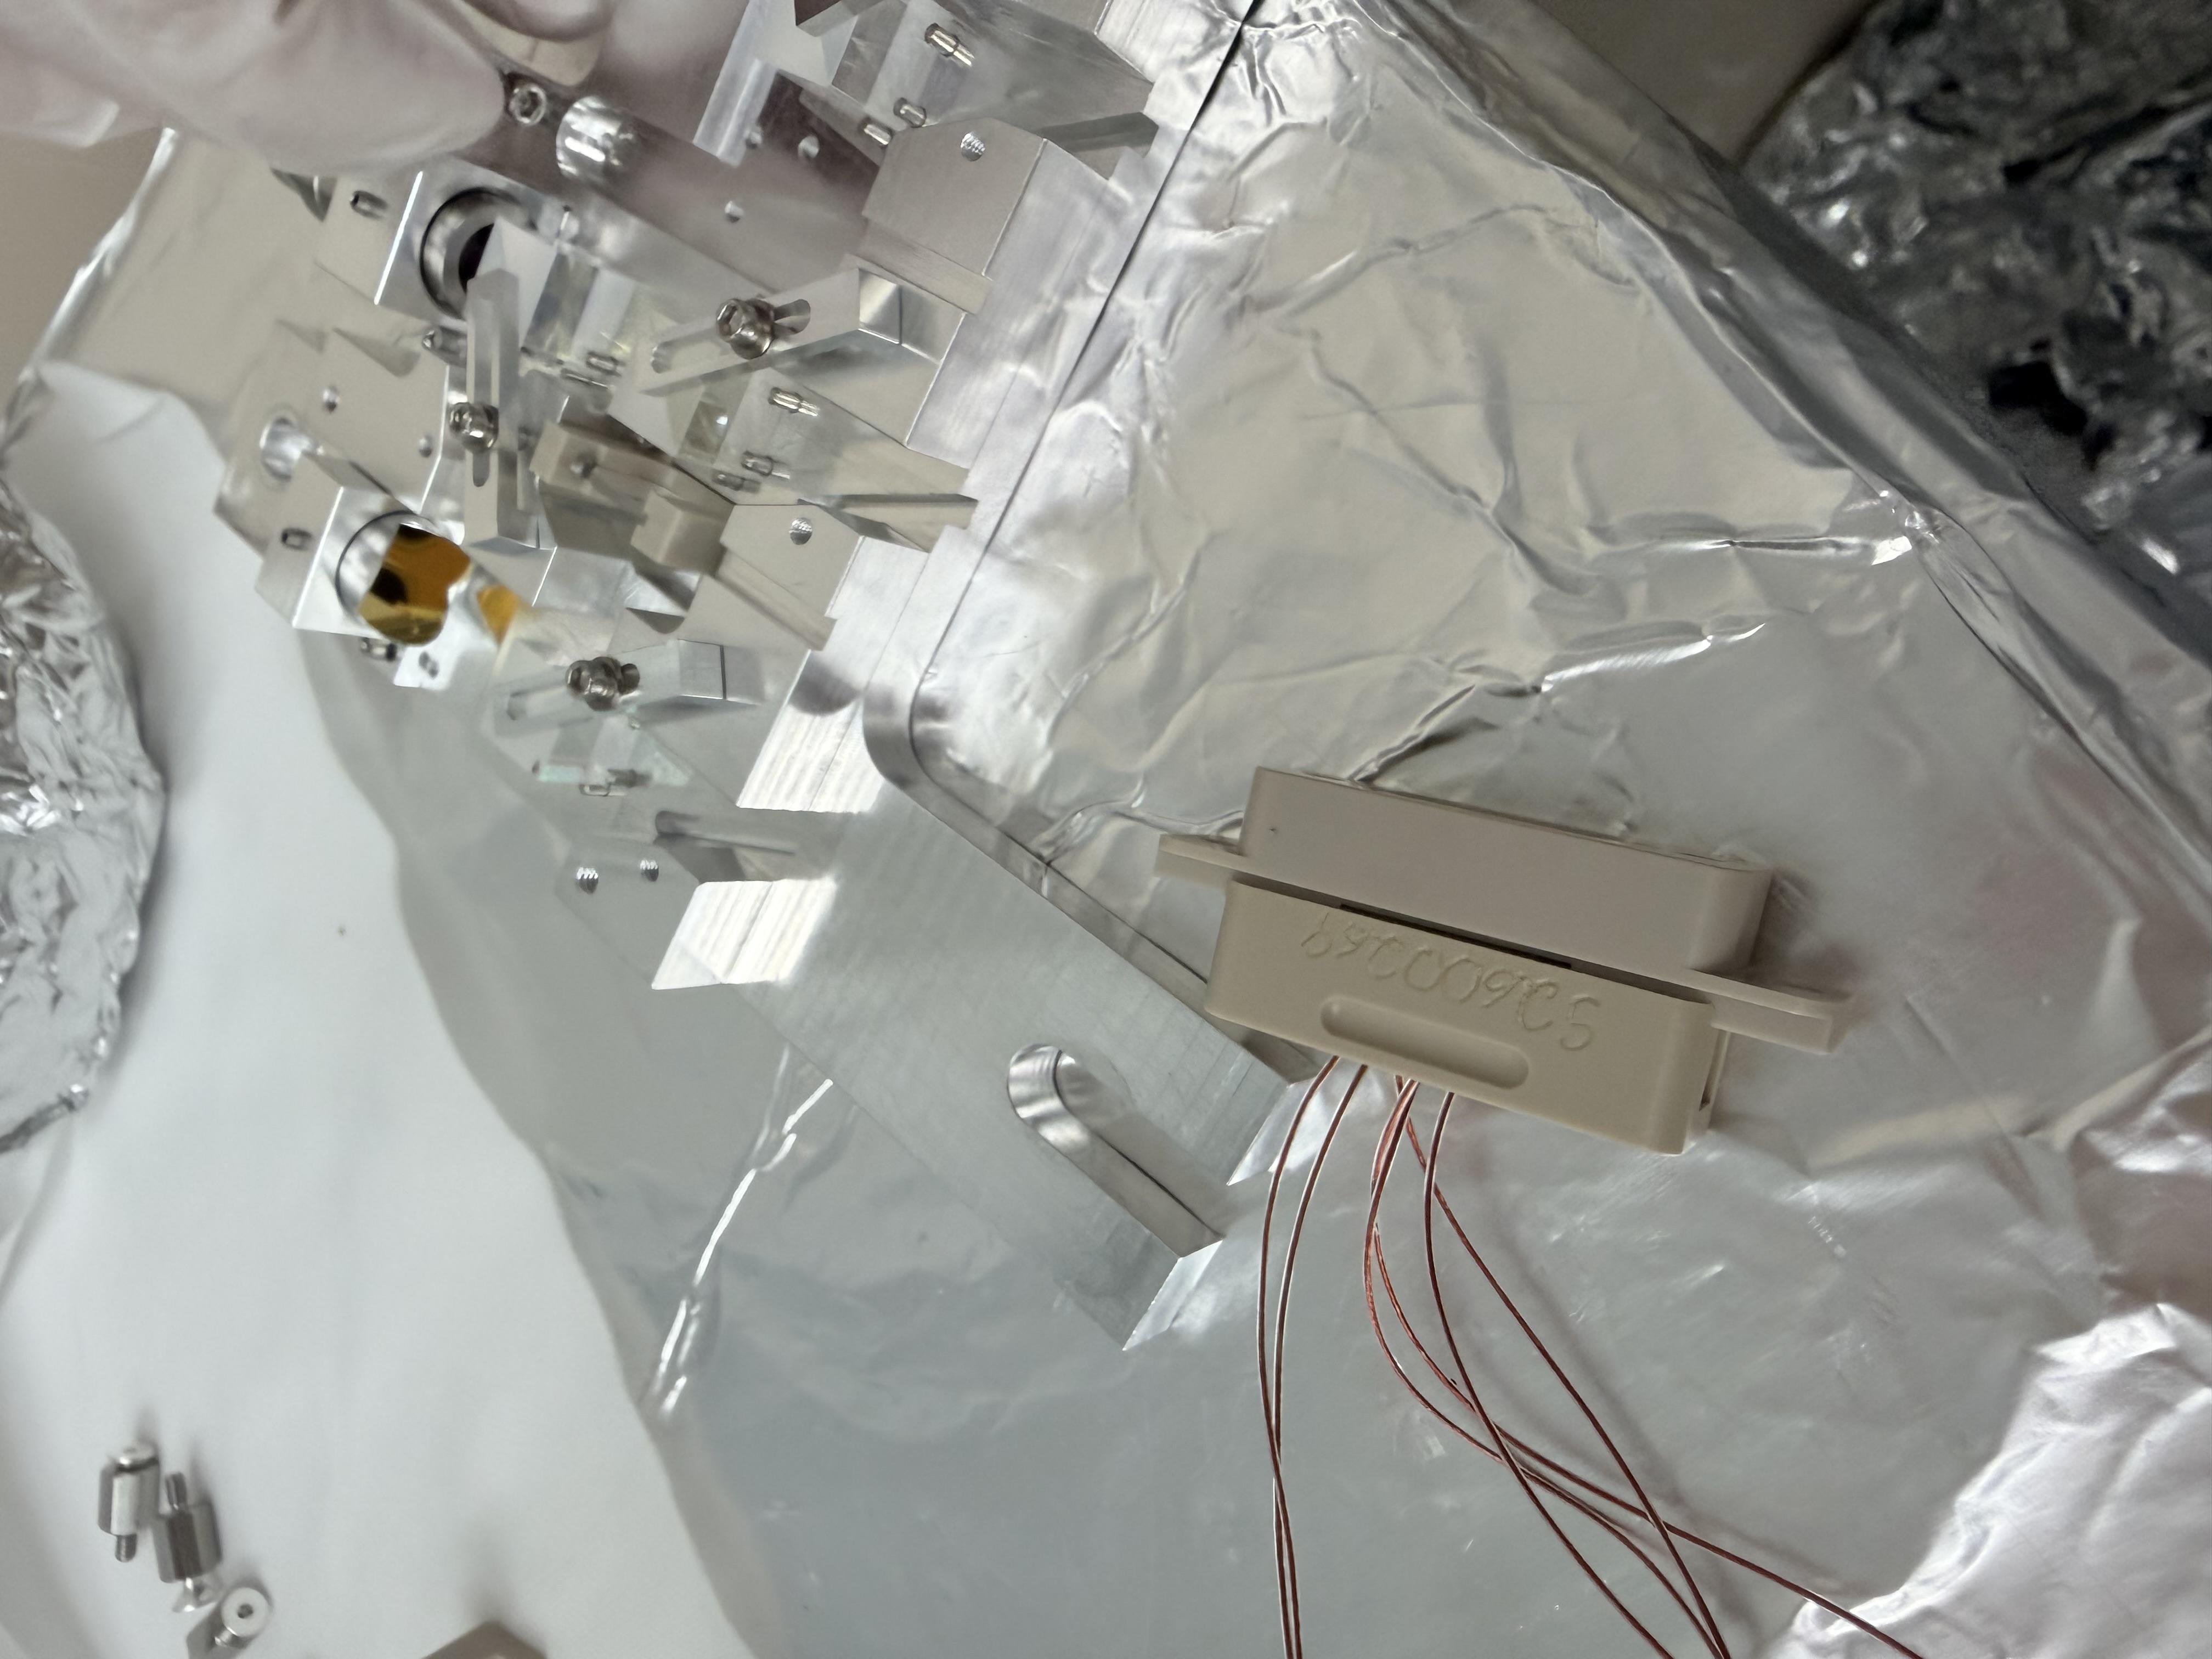
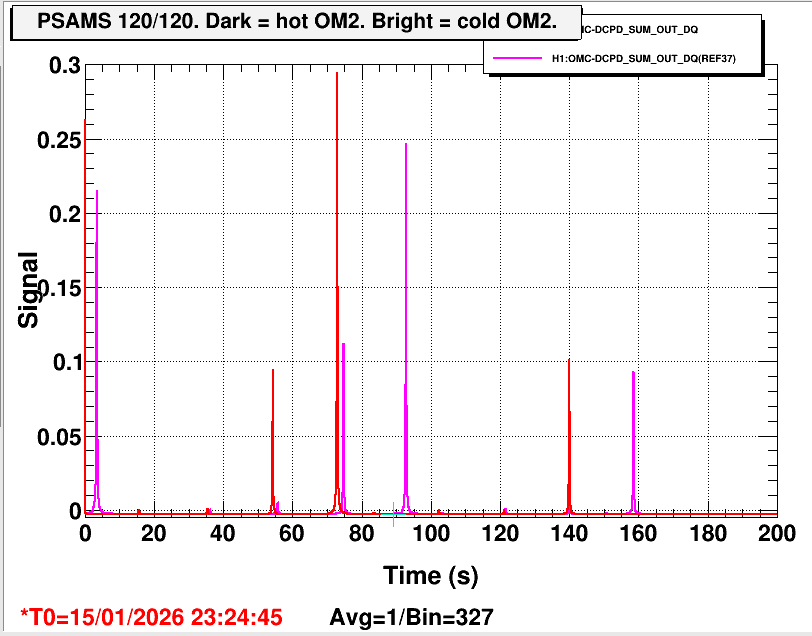
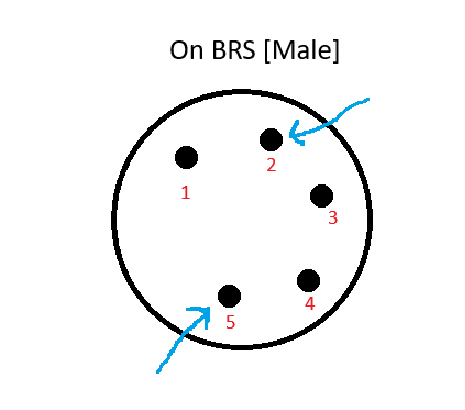
We went down to the BRS to test if the dampers were wired correctly/making contact. We checked the voltage going through and applied a voltage directly to the dampers to make sure the wires in vacuum were connected to the plates. We found that the 2 pin (+ direction) and 5 pin (- direction) (diagram below) were the pins which applied voltage to the dampers, were applying voltage as expected (maxing out at around 2.9V). It looks like applying a voltage directly made the BRS move as expected (we applied 3V to each pin one at a time in order to ring it up or damp it down), so we don't think there is an issue with the connection, and voltage was making it through the cable.
After watching the signal and the voltage going through the cable for a while, my best guess is that the + damping doesn't turn off fast enough when the BRS switches directions which causes it to continuously oscillate, but switches off eventually so it doesn't continue ringing up?
Michael Ross (who wrote the Beckhoff code) will be here next week, so we will ask him to take a look at it.
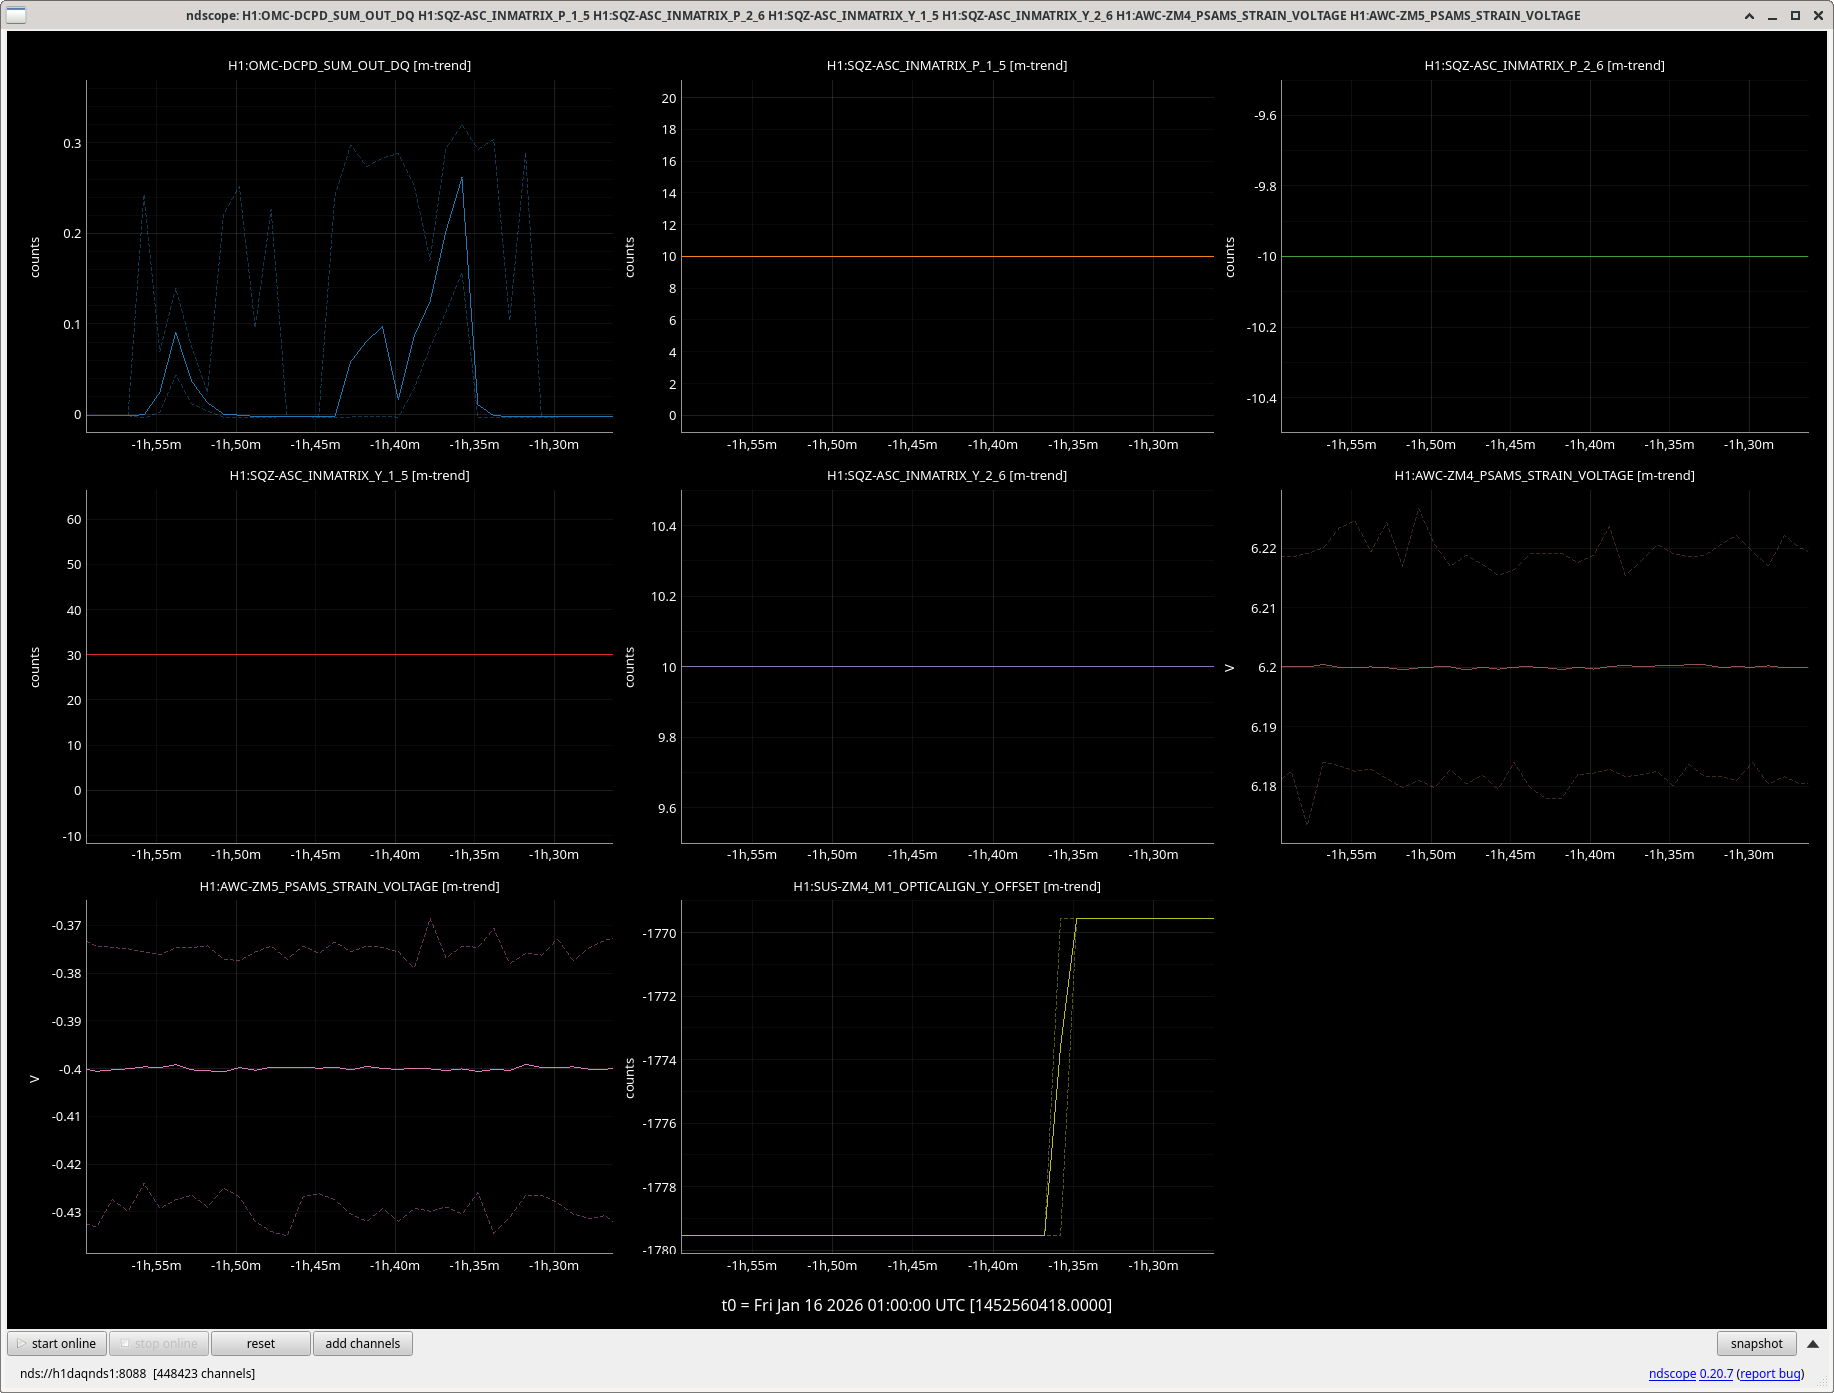
Michael is in this week and fixed the EMTY BRS by raising the upper threshold (H1:ISI-GND_BRS_ETMY_HIGHTHRESHOLD) from 4000-->8000 for 20 minutes, see 90693
Current Thresholds:
H1:ISI-GND_BRS_ETMY_HIGHTHRESHOLD: 4000
H1:ISI-GND_BRS_ETMY_LOWTHRESHOLD: 2000
Looking through ndscope it the same changes were made to the ETMX BRS, raising the thresholds