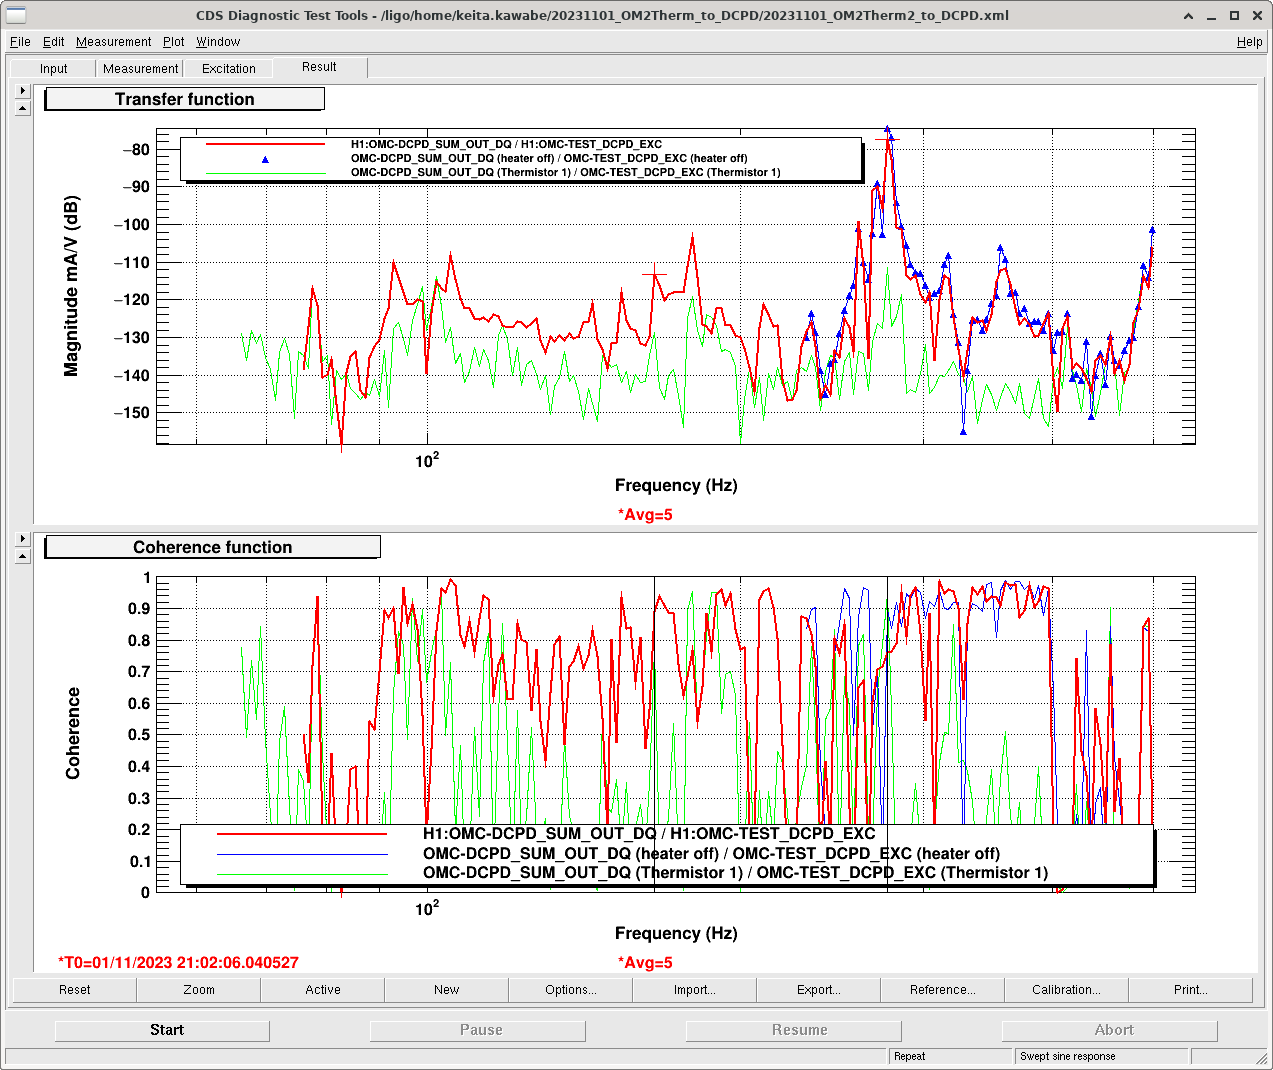
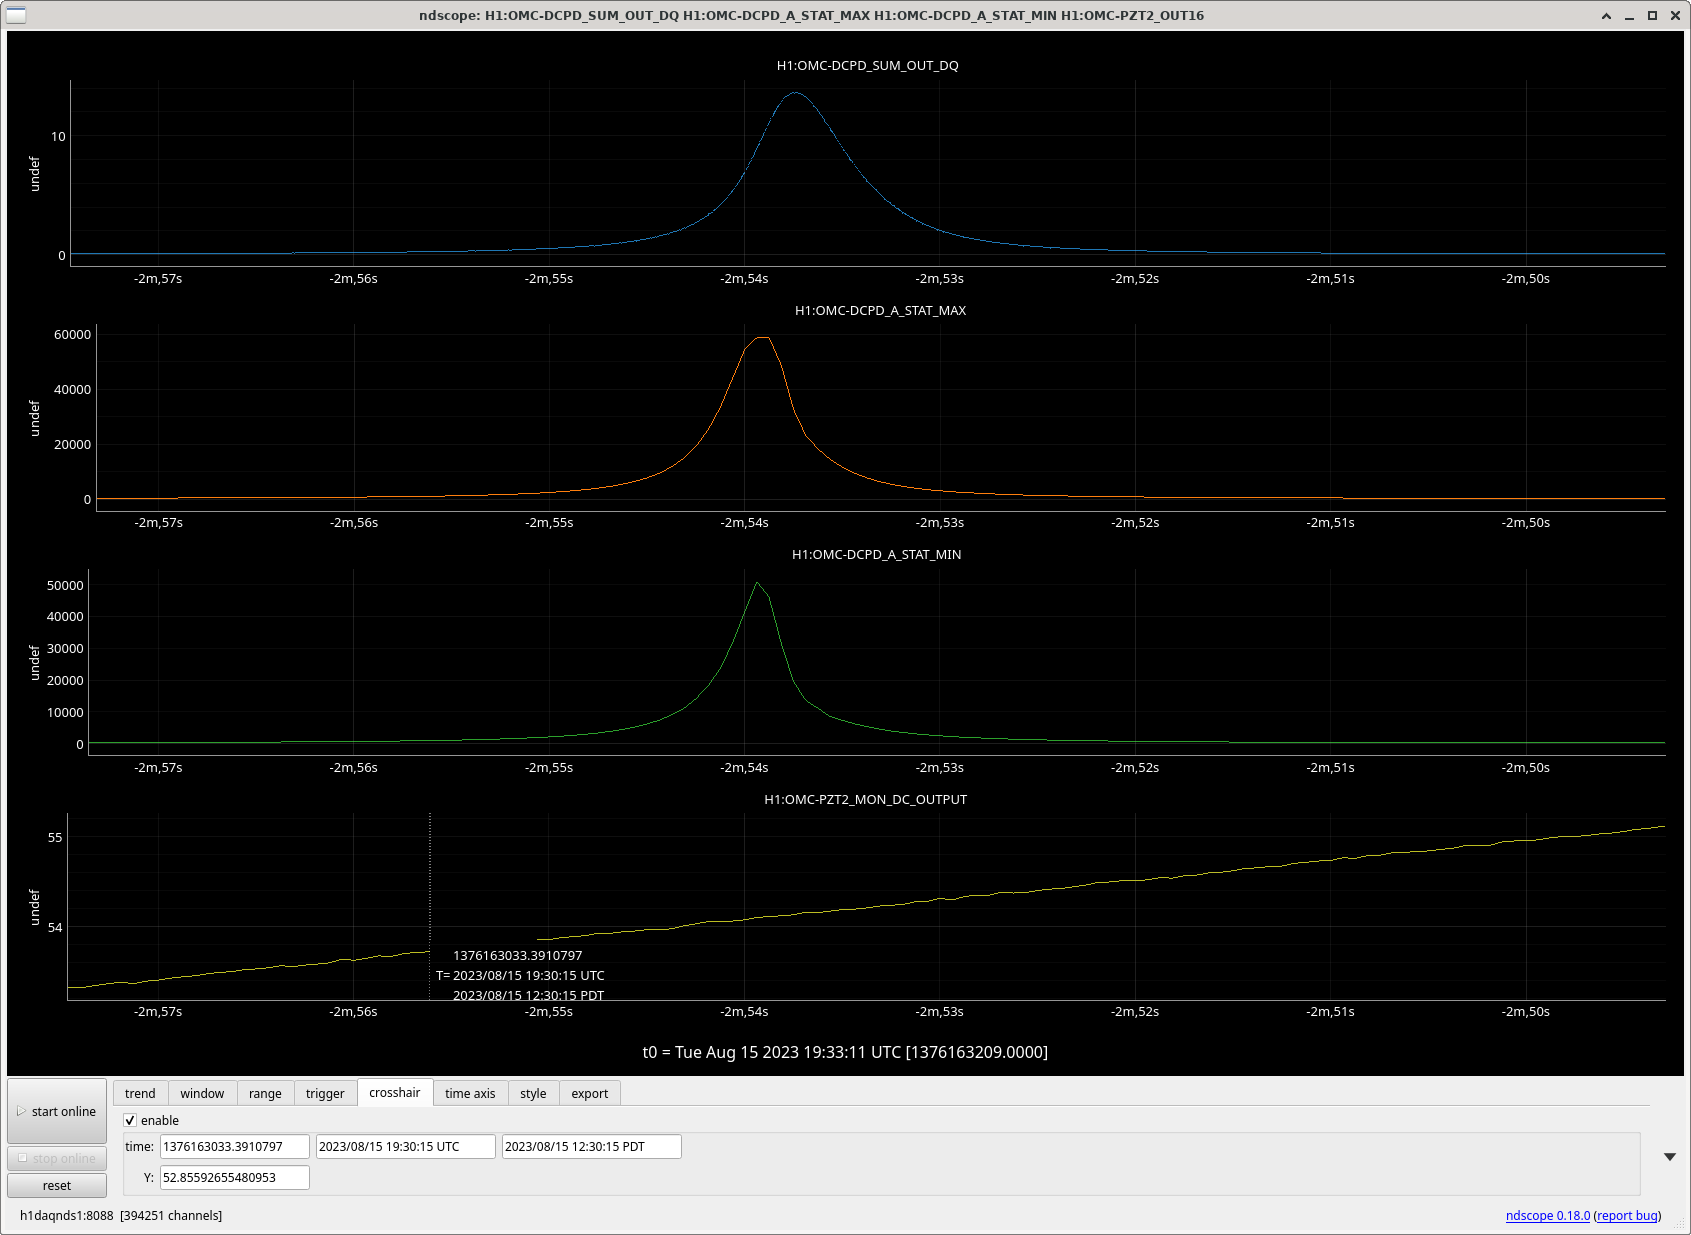
We've done three measurements assess OMC loss, but we've found that there's something weird about DCPD transient response (will attach another alog, but it seems as if something is railing inside the chamber, or maybe the OMC DCPD inductor is responding nonlinearly causing some kind of soft saturation, or maybe it's just a whitening-dewhitening mismatch).
Because of this, Measurement 1 below is suspect, Measurement 2 is definitely OK, Measurement 3 is probably OK too.
Analysis will come later.
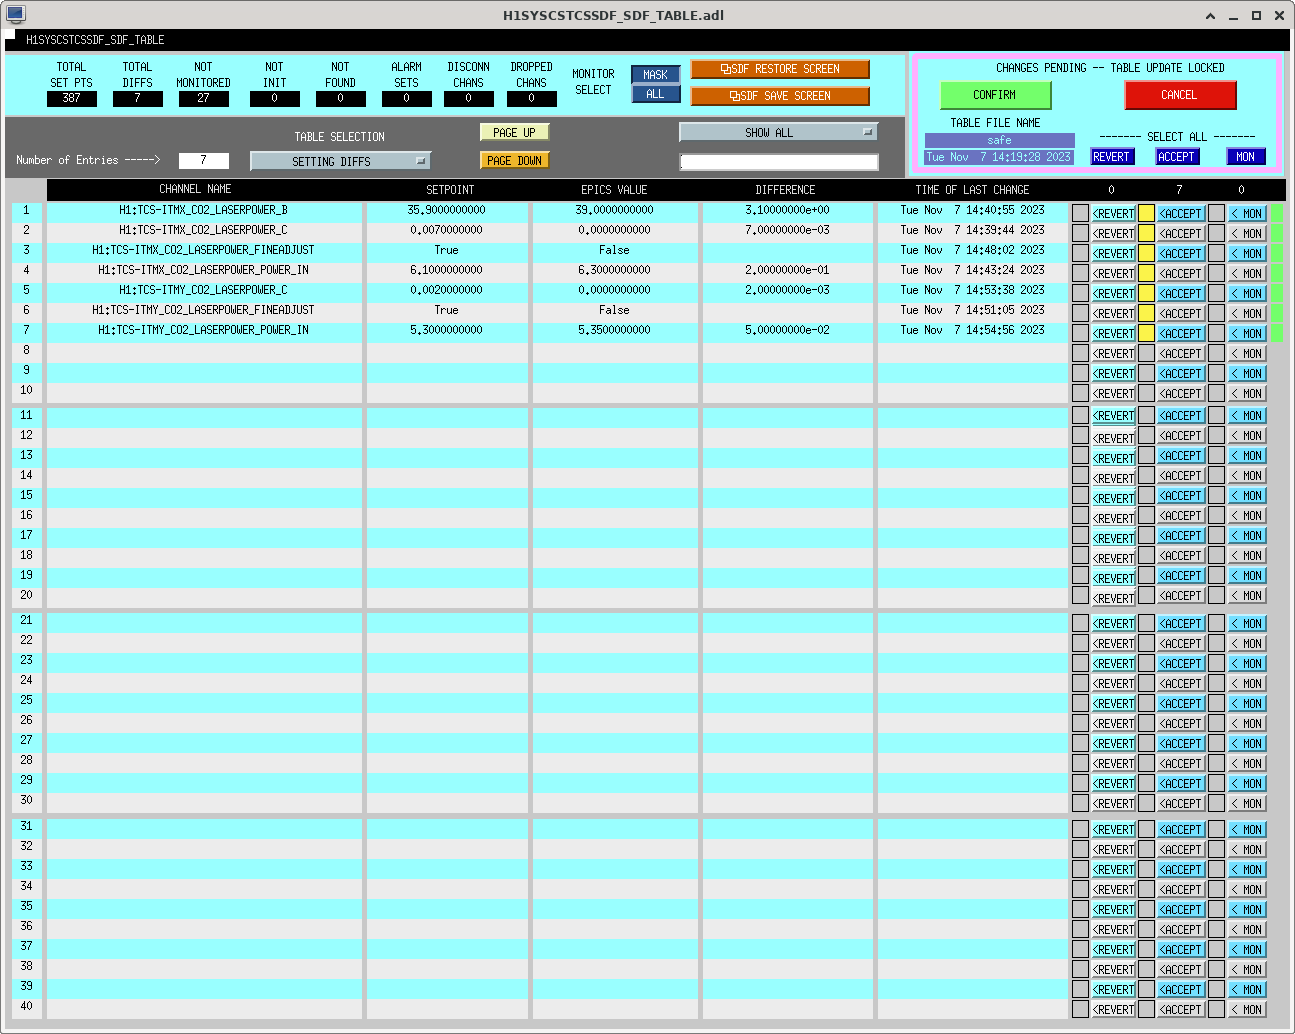
Throughout the measurement, RF sidebands (9, 45 and 118) were OFF, H1:OMC-DCPD_A_GAINSET and B were set to low (a factor of 10 smaller than nominal), and IMC-PWR_IN was 10W.
Measurement 1. Scan OMC PZT and measure the MM loss.
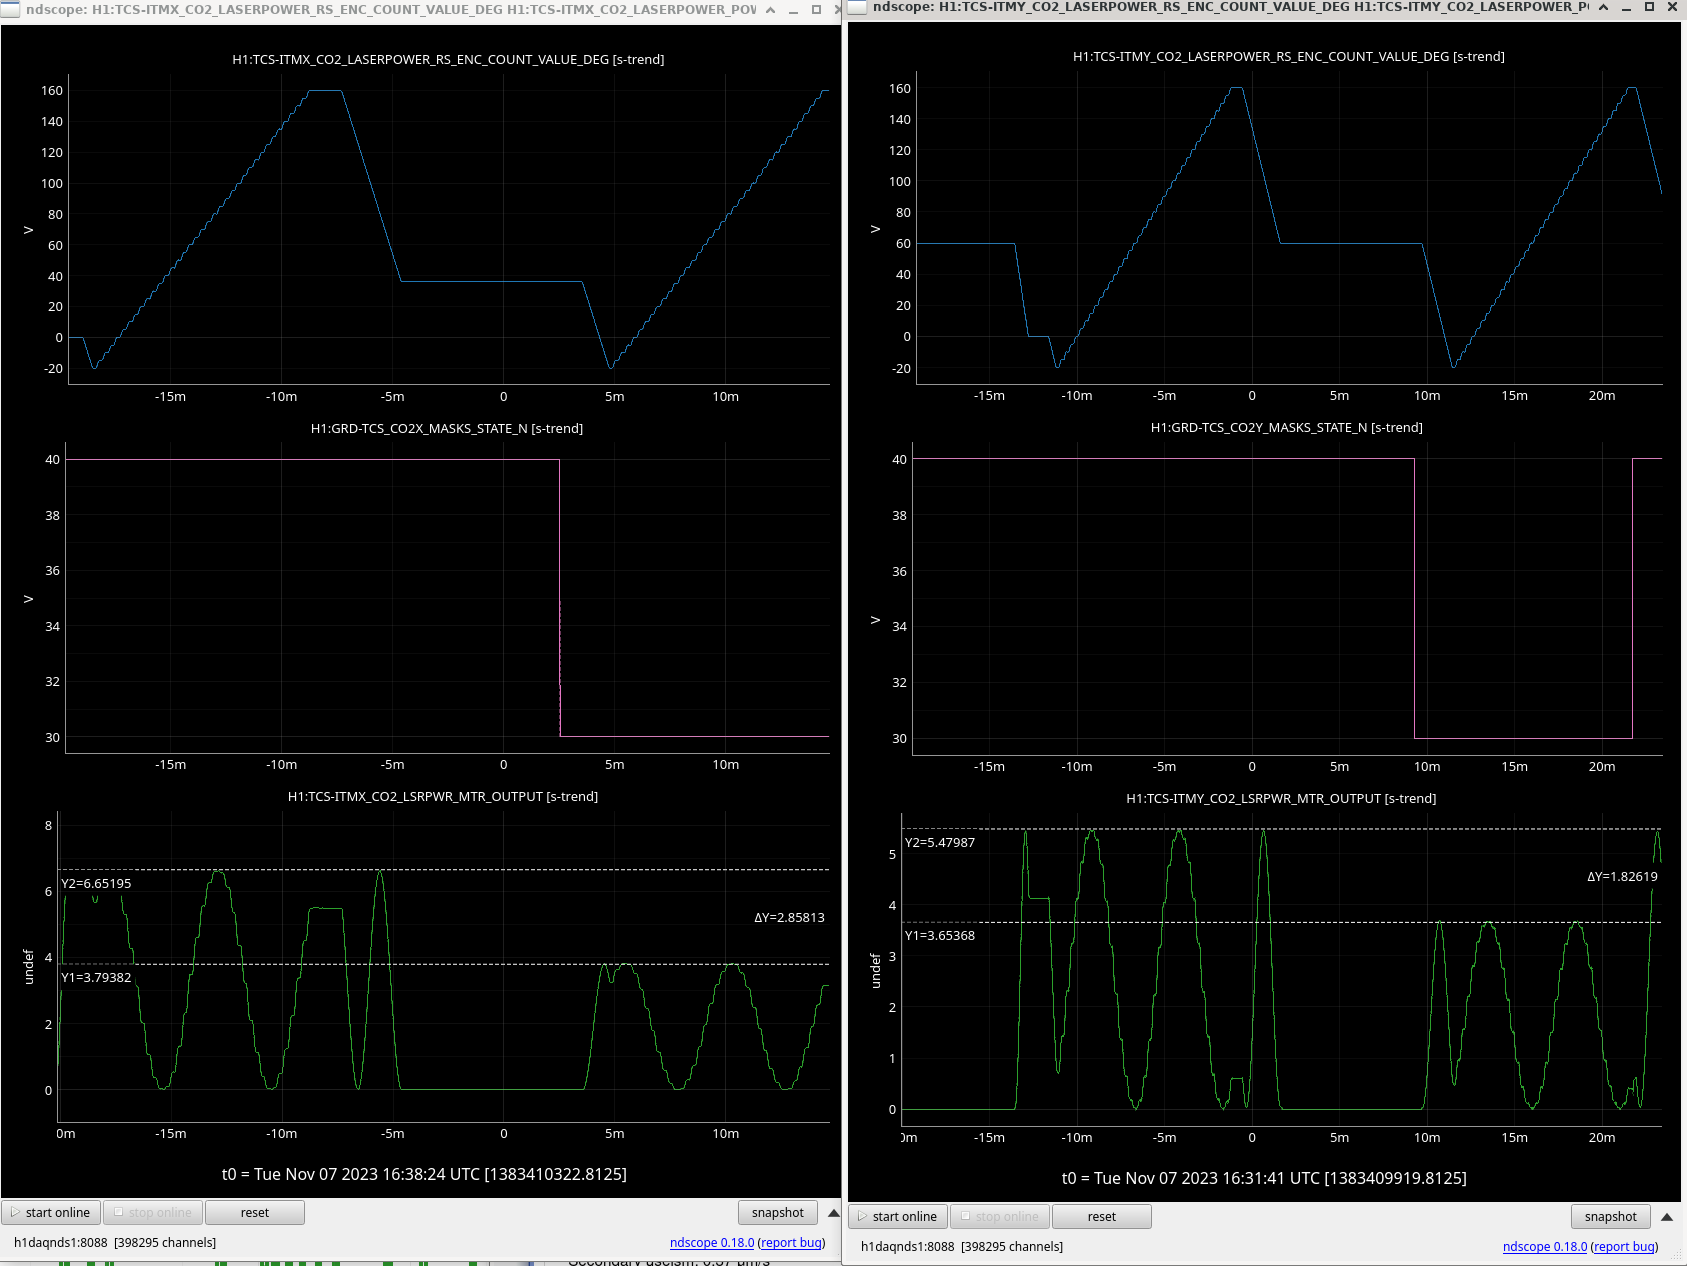
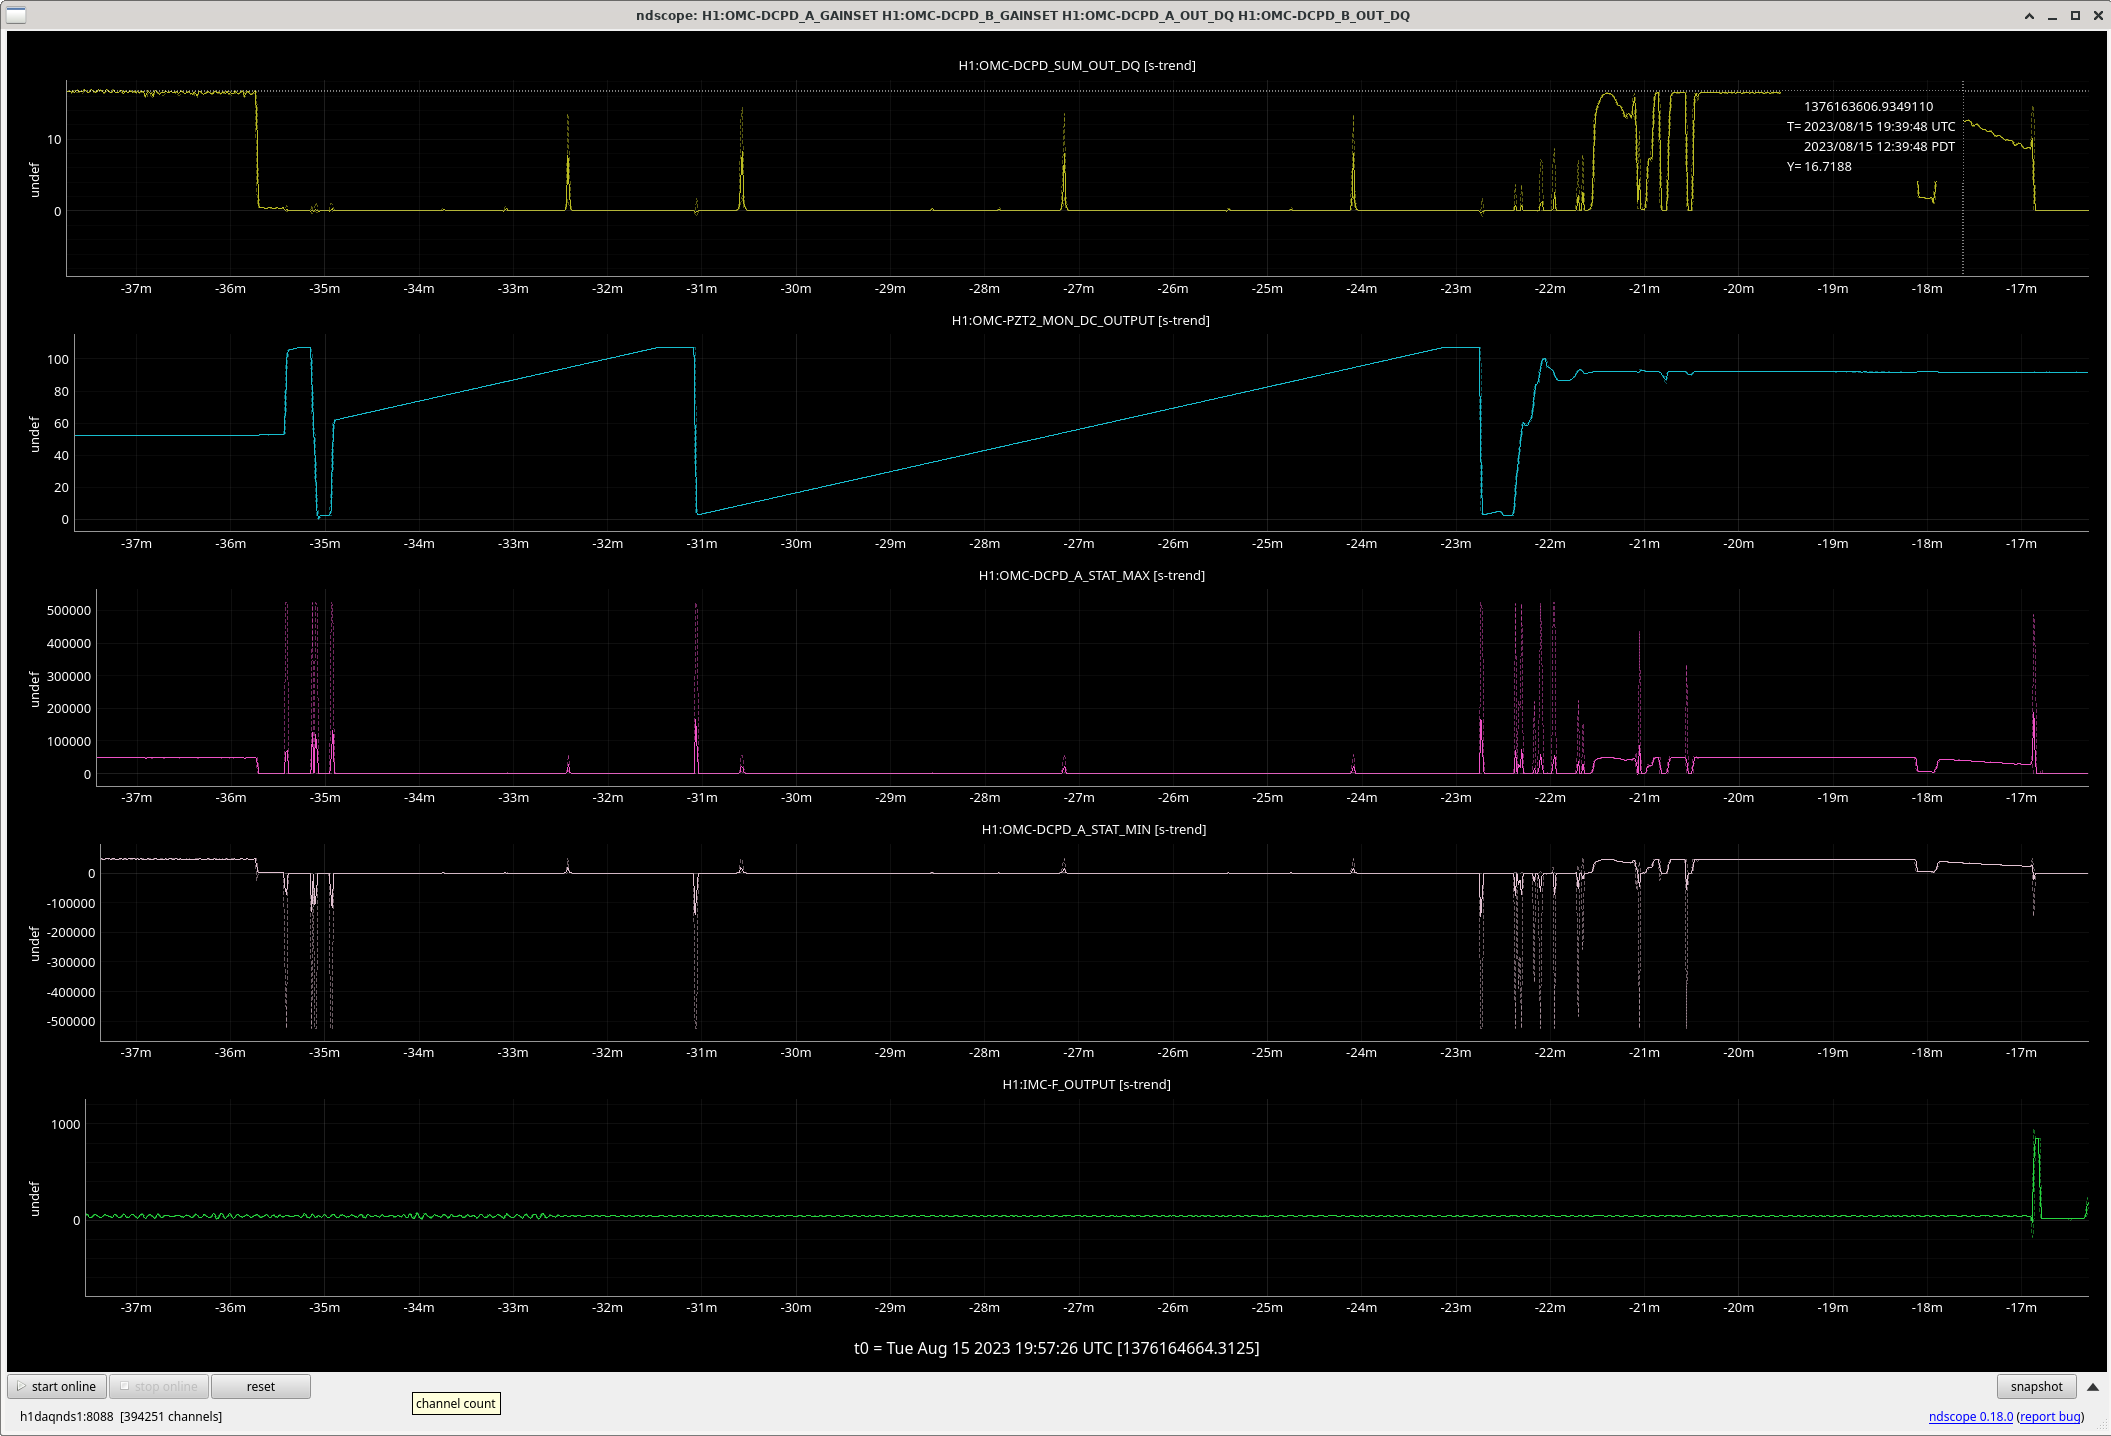
Lock OMC, align OMC reasonably well, unlock, scan the PZT slowly. The best scan is between 19:26:25 and 19:34:44 UTC (t=[-31m,-23m] in the 1st attachment).
"Align reasonably well" was a challenge as we were using the OMC QPD for OMC ASC, changing alignment meant changing QPD offset, and doing so frequently railed OMC suspension. While changing the offsets, maximum DCPD_SUM I could reach was 16.9, but I kept bumping OMCS so I gave up (sensor correction was off for the first half of this effort and that didn't help). In the end, usable data was obtained with default offset that gave us ~16.6 when locked, but we know that that was NOT the best alignment.
As you can see, the peaks in DCPD_SUM during the scan are all about ~14, much smaller than 16-something. (At t=-36m, the OMC was held at resonance and DCPD_SUM was ~16.6. After the scan at t=-20m, DCPD_SUM was ~16.45. So the alignment drift wasn't much of a problem.)
It turns out that we had to scan slower than this even though this was REALLY slow (~8 minutes for one cycle) and/or lower the laser power.
Measurement 2. OMC throughput.
Lock the OMC to 00 resonance (19:37:27-19:38:28 UTC, roughly t=[-20m, -19m] on the 1st attachment).
Measure DCPD_SUM, input power (via ASC-OMC_A and ASC-OMC_B SUM) and reflected power (via OMC-REFL_A).
With the same alignment into OMC, find the time where the OMC was off-resonance (DCPD transmission was minimal 19:25:58-19:26:20 UTC), and measure DCPD_SUM, input power and reflected power.
Calculate the throughput.
Measurement 3. OMC Finesse
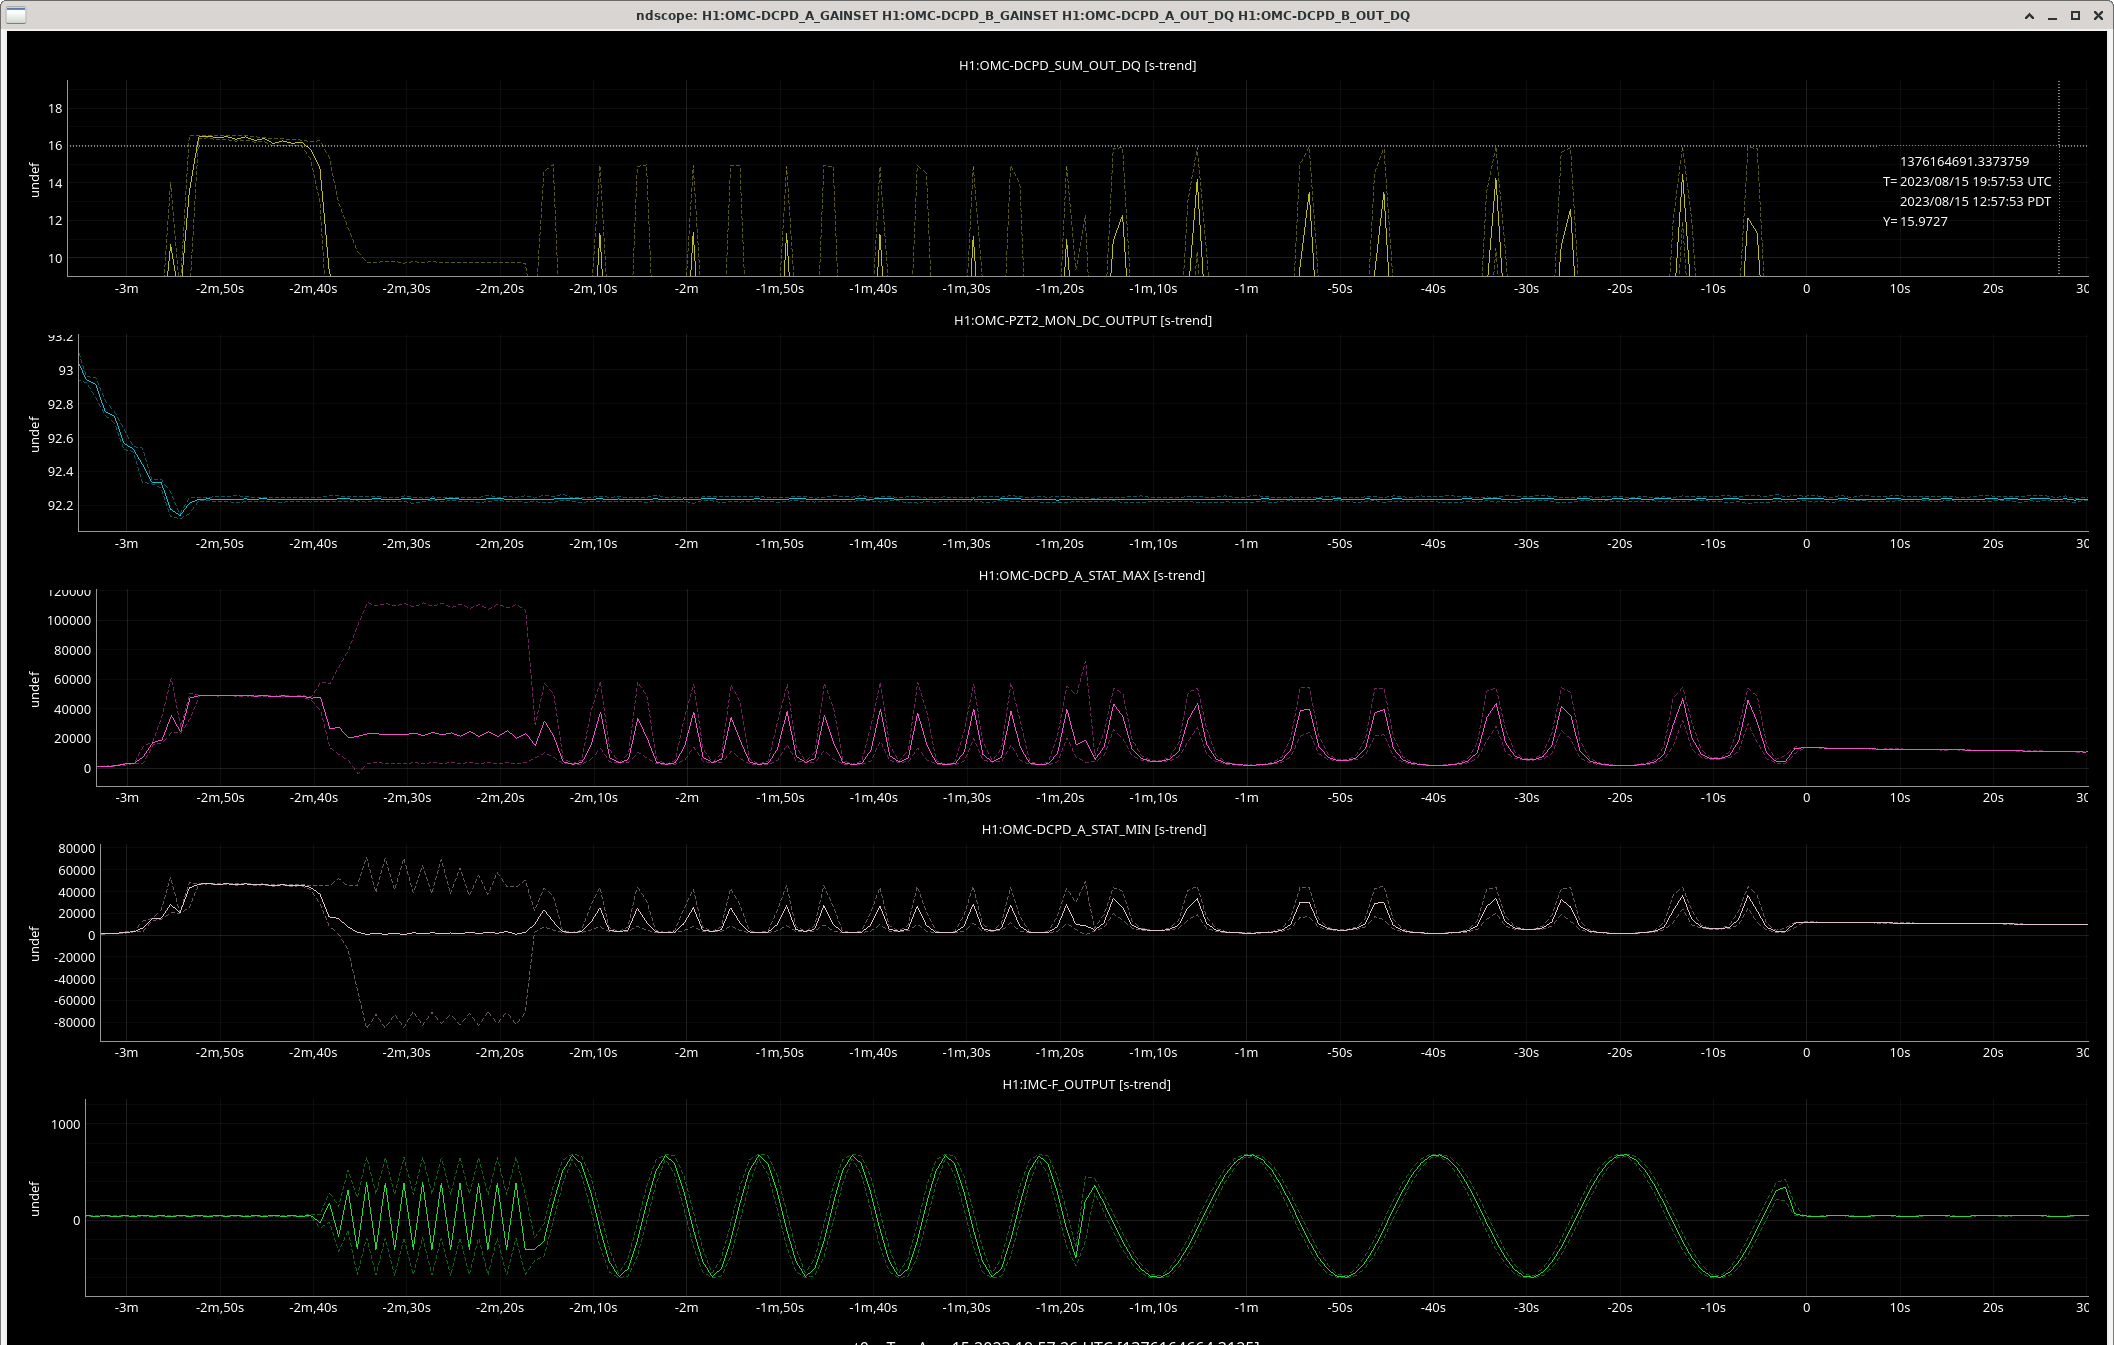
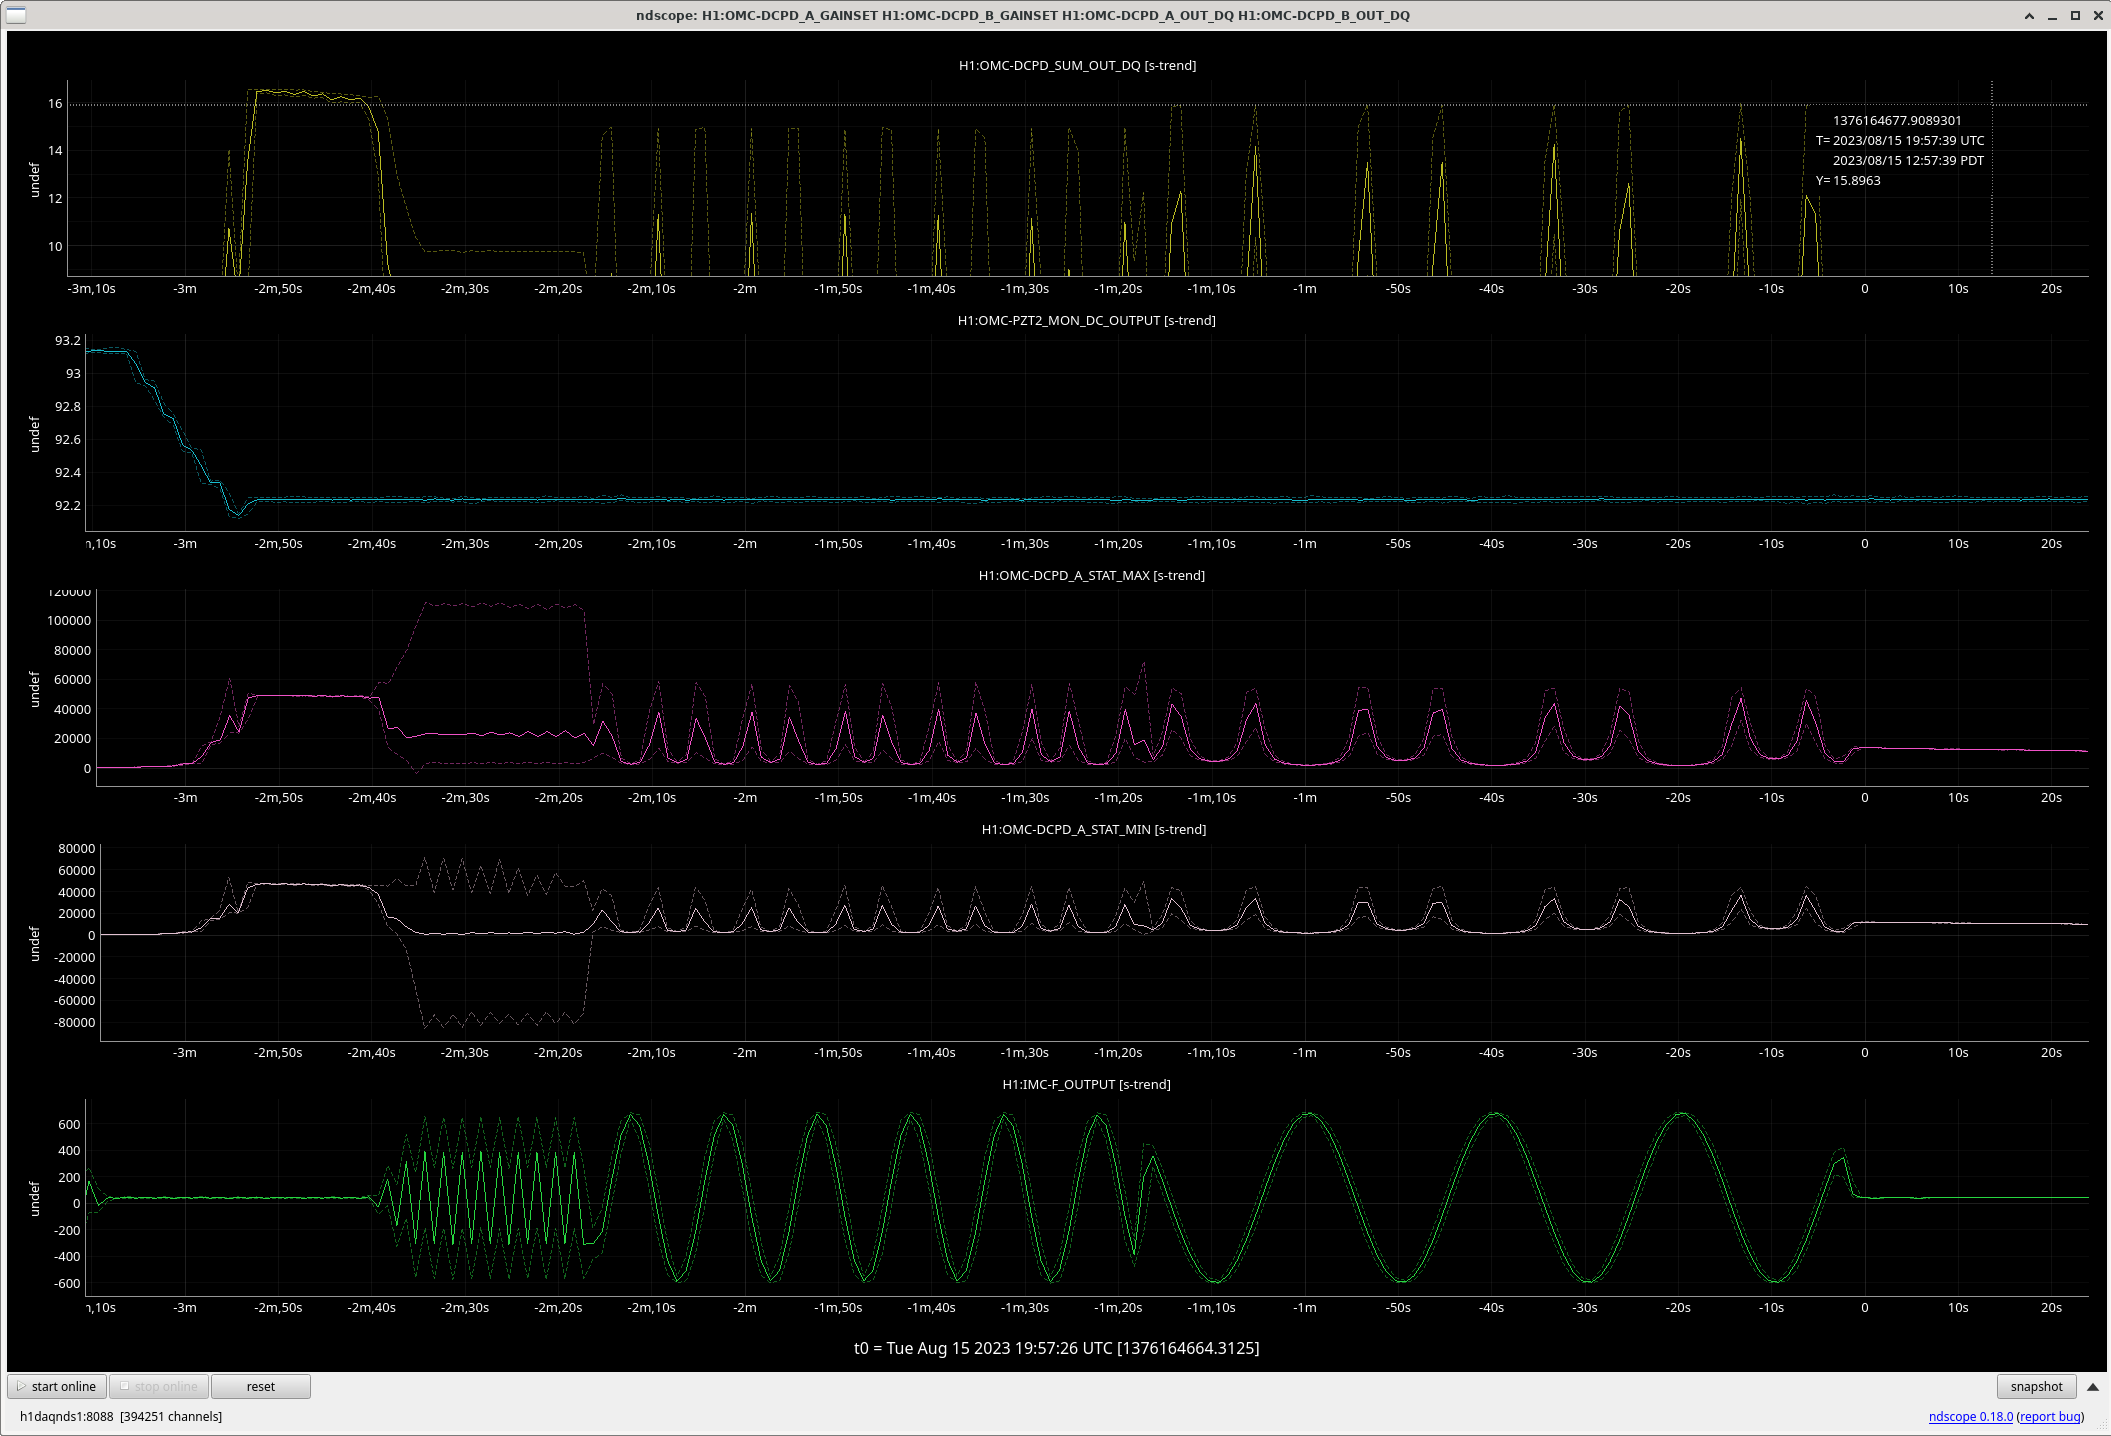
I roughly kept the OMC at resonance by adjusting pzt voltage. DCPD_SUM was slowly drifting but it was about 16.0.
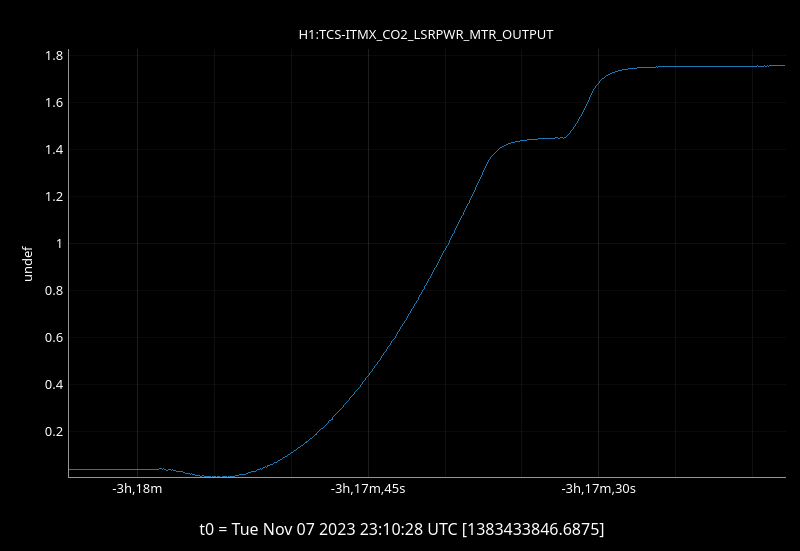
I started injecting into PSL frequency with an amplitude of ~+-600kHz (1.2MHzpp) via IMC-L_EXC. I slowed down the injection frequency until the peak value gets back to 16.0. (Second attachment.)
Best scan data is obtained 19:56:20-19:57:20 UTC.


A new h1sqz model with updated channel names for SHG_TRANS_RF24 was also installed.
The EtherCAT Squeezer 5 (PMC) installed in SQZ-C1 U slots 1-3.
Serial Number: S2300256