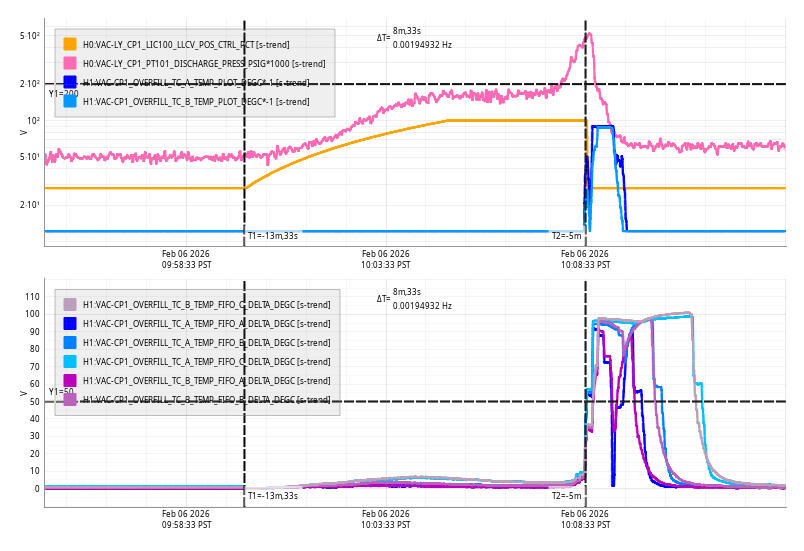
david.barker@LIGO.ORG - posted 10:34, Saturday 07 February 2026 (89074)
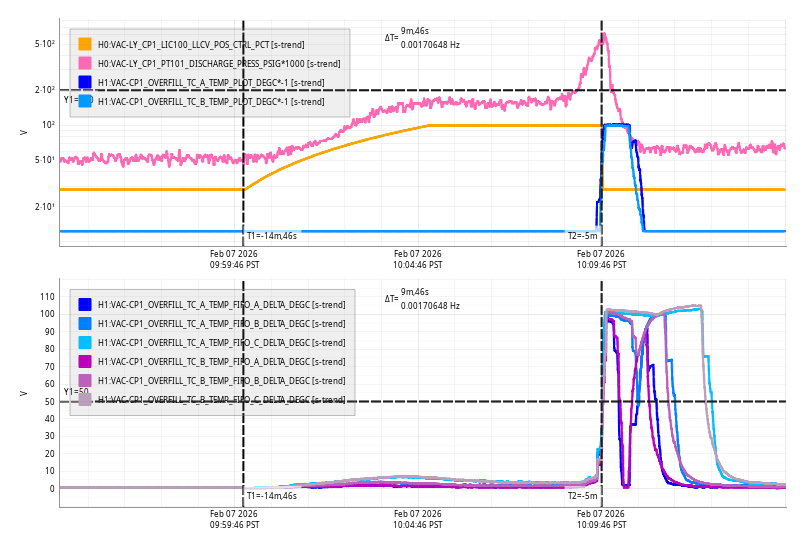
Sat CP1 Fill
Sat Feb 07 10:09:46 2026 INFO: Fill completed in 9min 42secs
Images attached to this report
Sat Feb 07 10:09:46 2026 INFO: Fill completed in 9min 42secs
Summary of investigation into the vertically split beam from the EOM
First, we confirmed that the vertical beam splitting observed yesterday originates from the EOM itself. To check the possibility of multiple reflections from lenses, we inspected the back-reflection port of the JAC output mirror. Two reflected beams were observed, most likely originating from the planar and curved surfaces of the lens, and they were mainly separated in yaw. Since the space between the EOM and the lens was blocked during this test, these reflections were conclusively identified as lens reflections. No vertically split beams were observed from this source.
A knife-edge–like test was performed by slowly lowering a metal ruler from the top at both the EOM input and output. At the EOM input, the entire beam disappeared simultaneously, whereas at the output the beam disappeared gradually from the top. This behavior confirmed that the vertical splitting is generated inside the EOM.
To accurately determine the beam positions at the EOM input and output, beam positions were measured from photographs. Taking refraction and geometry into account, it was found that the beam is slightly displaced in the horizontal direction. Details of this analysis will be documented in Keita’s alog.
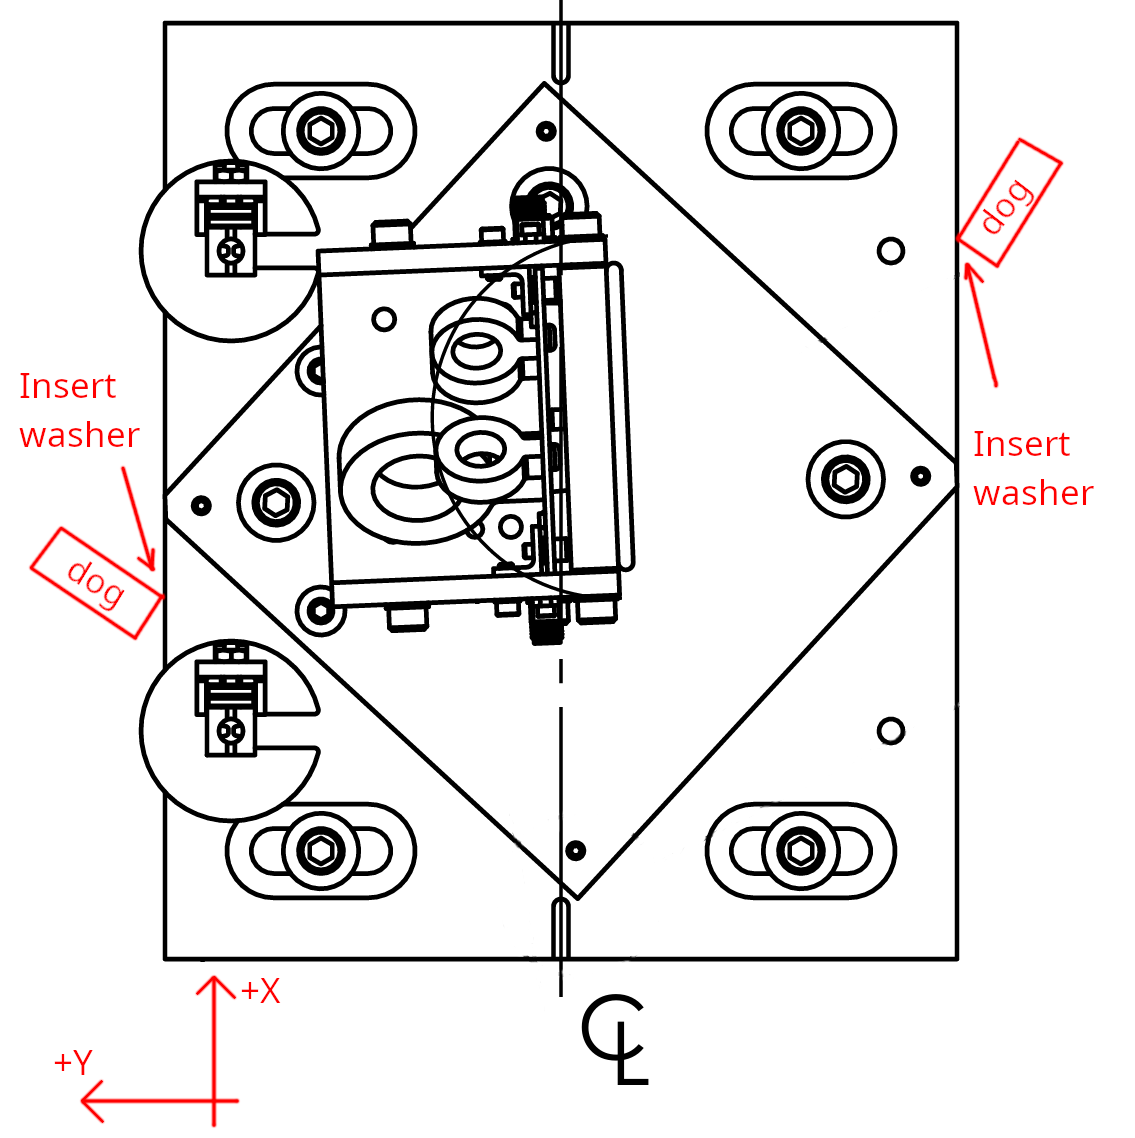
Based on this result, the EOM was rotated in yaw. Dog clamps were placed at the ±y projection points of the EOM input and output, in contact with the base plate. One 0.5-mm shim was inserted between the base plate and each dog clamp to rotate the EOM counterclockwise. However, the beam pattern did not change. Additional shims were tested, but no significant change was observed. The EOM was fixed with one 0.5-mm shim at each position.
Next, pitch adjustments were explored. The original shim configuration (two shims on the +y side and one on the −y side) was changed by moving shims to the +x side (one location at center) and the −x side (two locations, upper and lower). Each location initially had two shims, and by adding or removing shims, it was observed that the vertical positions of the split beams changed. When the +x (downstream) side was raised, the vertically split beams appeared in the upper part of the beam profile (approximately 5–7 beams; Keita will upload photos). Conversely, when shims were added to raise the −x side, the split beams moved toward the lower part of the beam. With the downstream side lowered by approximately 0.25 mm, about two beams were observed in the upper part and one in the lower part.
1W input power shows 6 or more beams, but 2-3 beams can be observed even with 100mW.
With the last configuration, we proceeded the IMC scan measurement after alignment. The 2nd order mode peak was the same level as we observed when we sim up the EOM first time.
In summary, the EOM shows highly questionable and nontrivial behavior. Possible causes include diffraction due to crystal defects or multiple reflections at the AR-coated surfaces. However, identifying the exact mechanism is challenging at this stage.
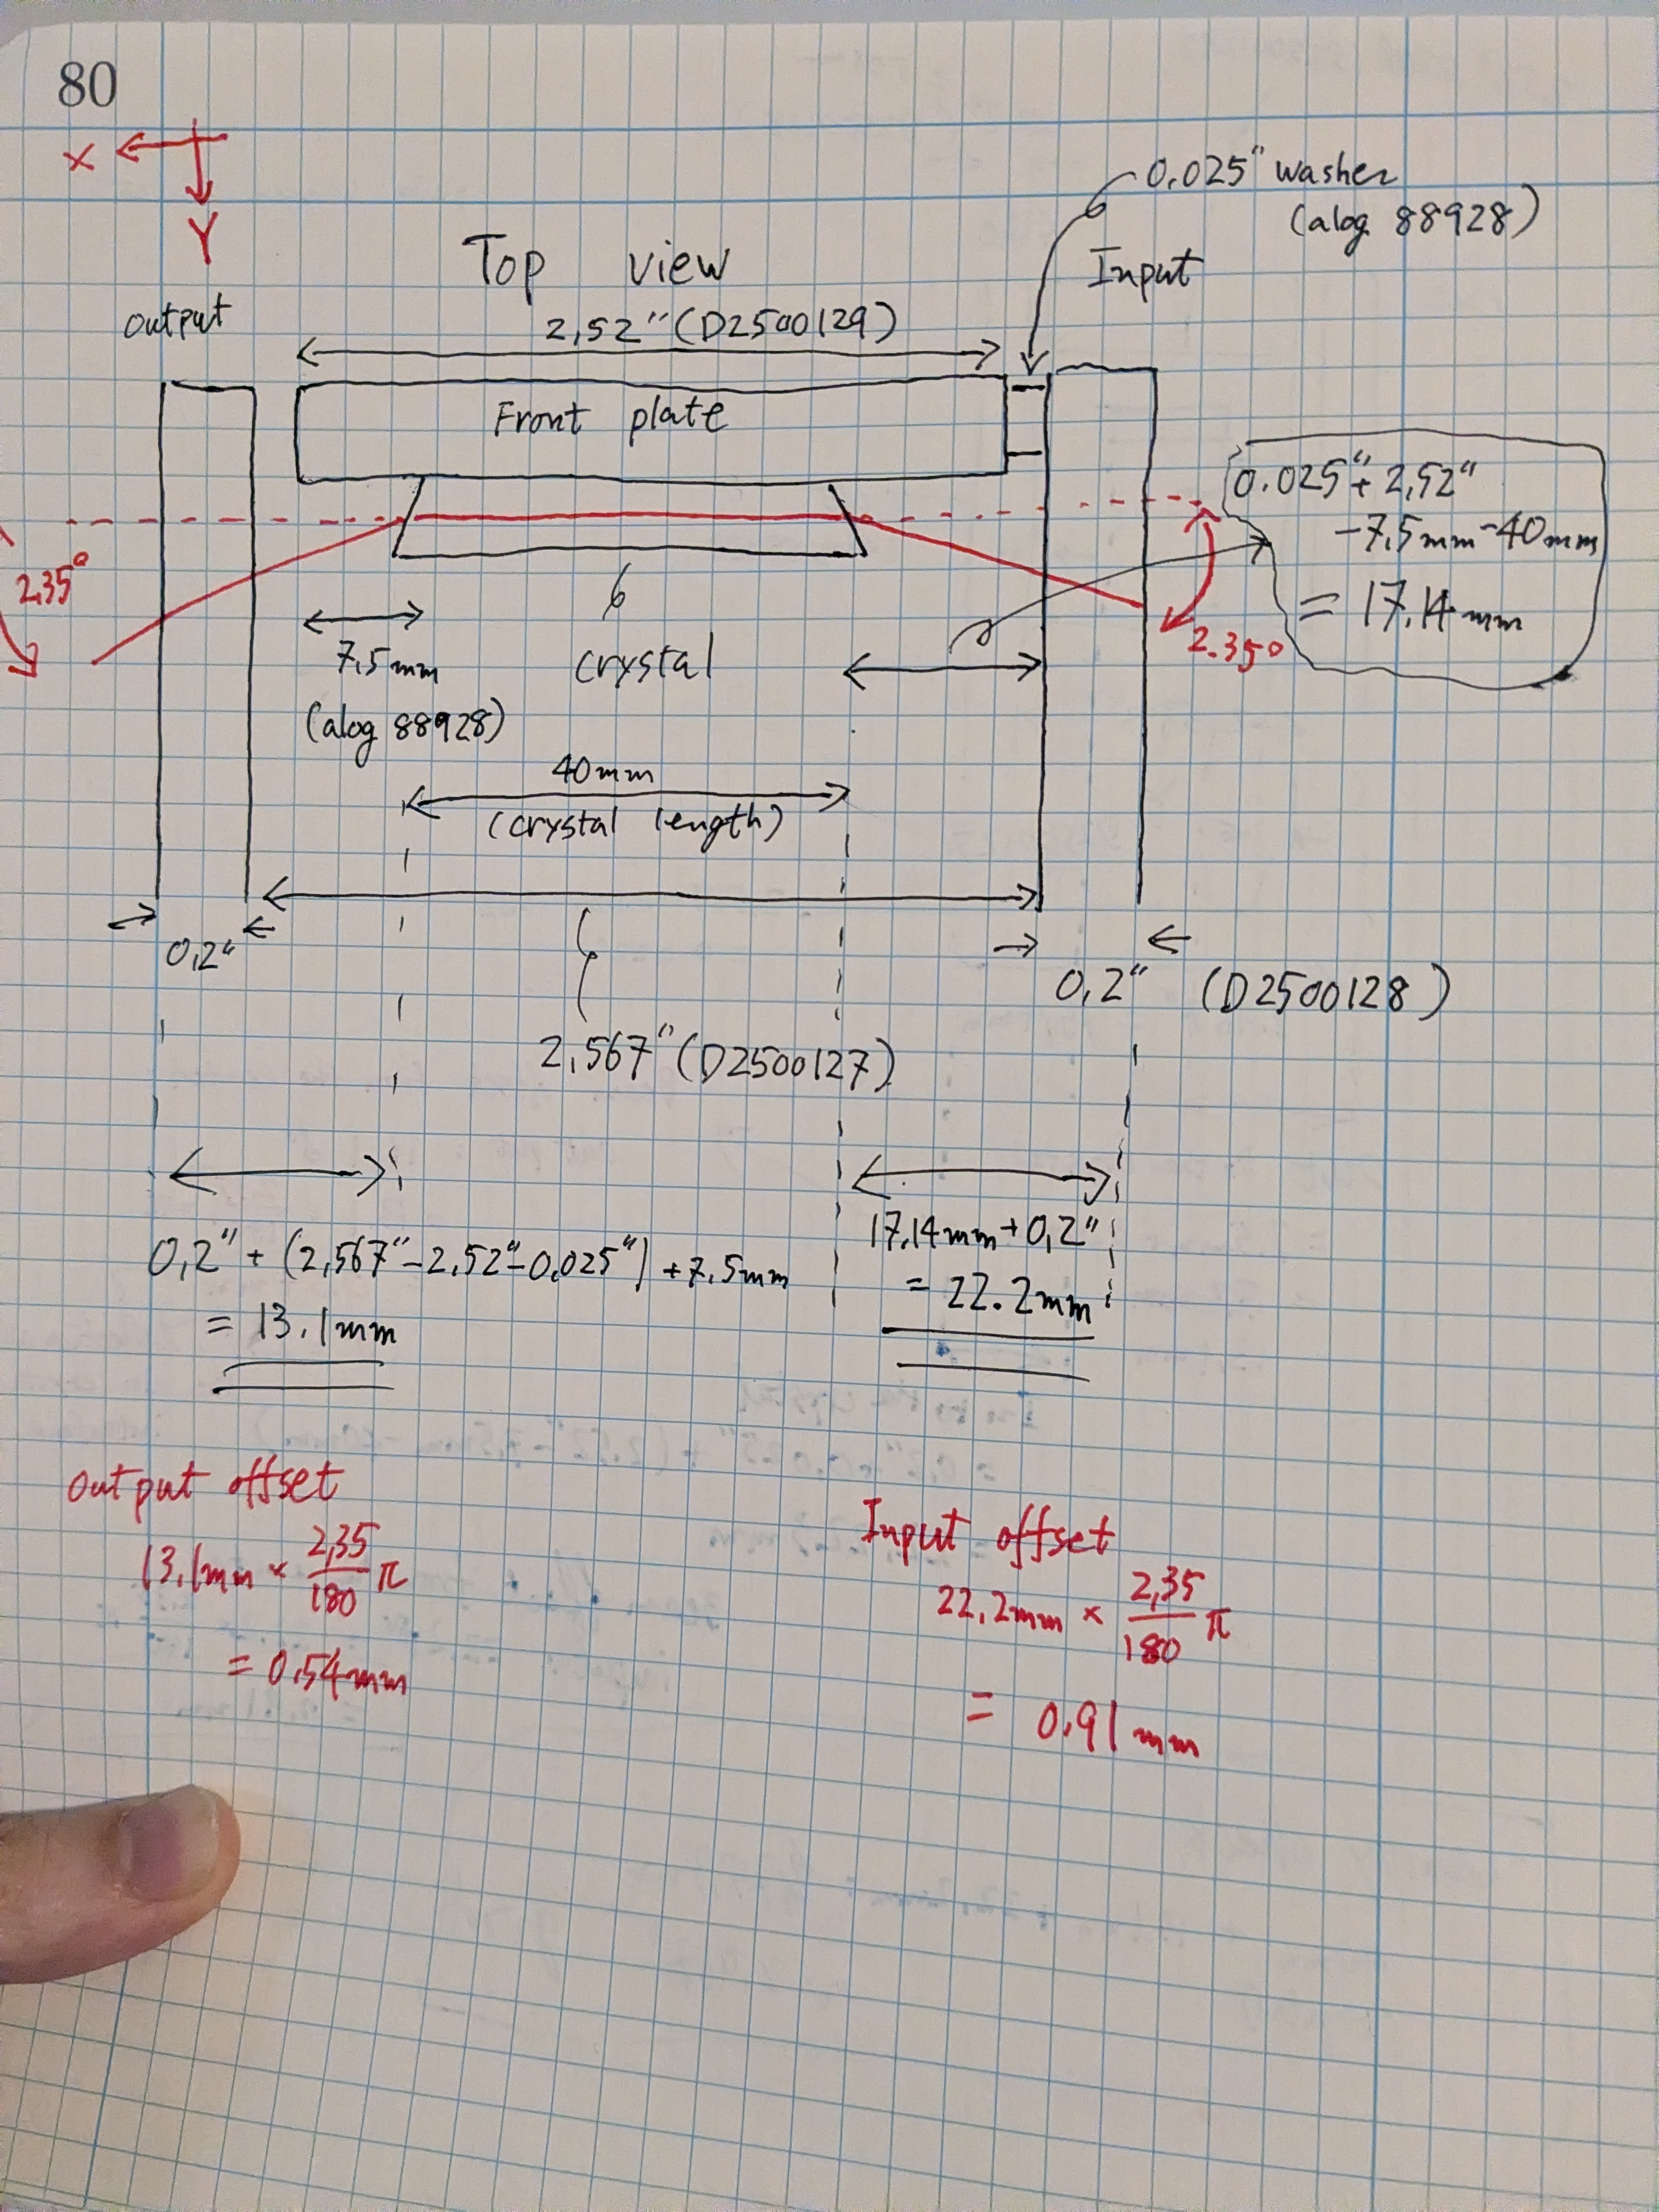
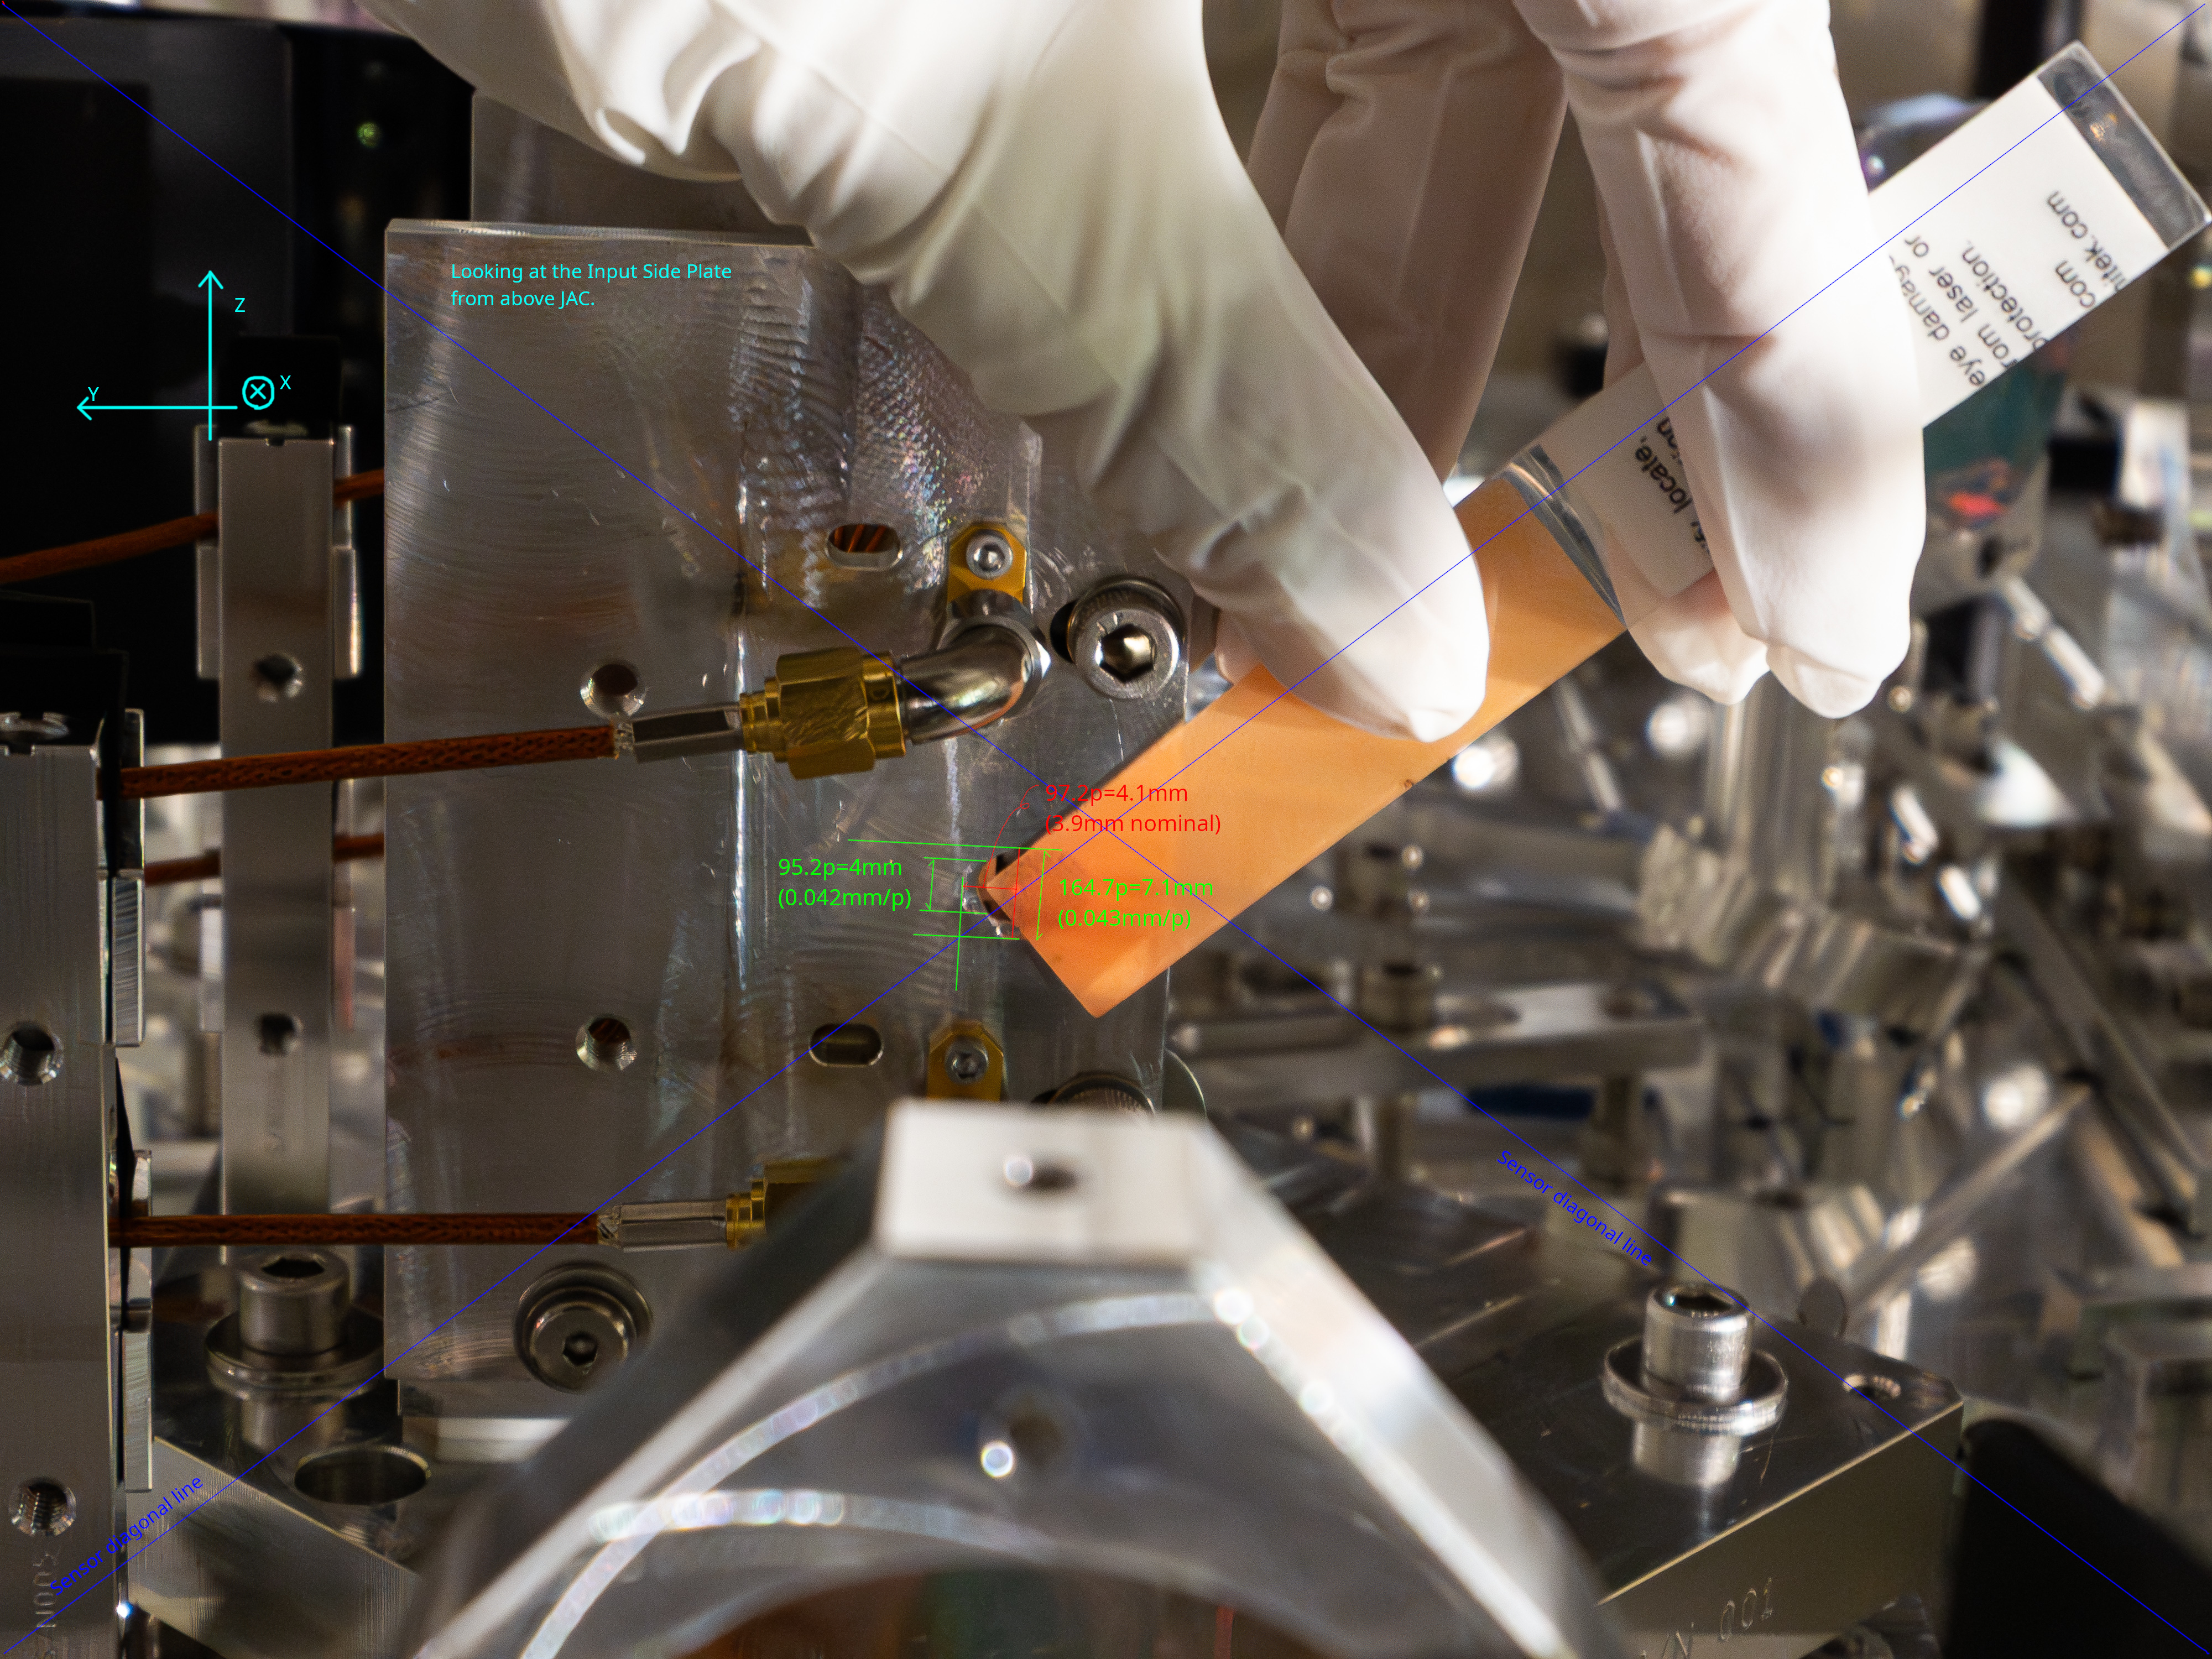
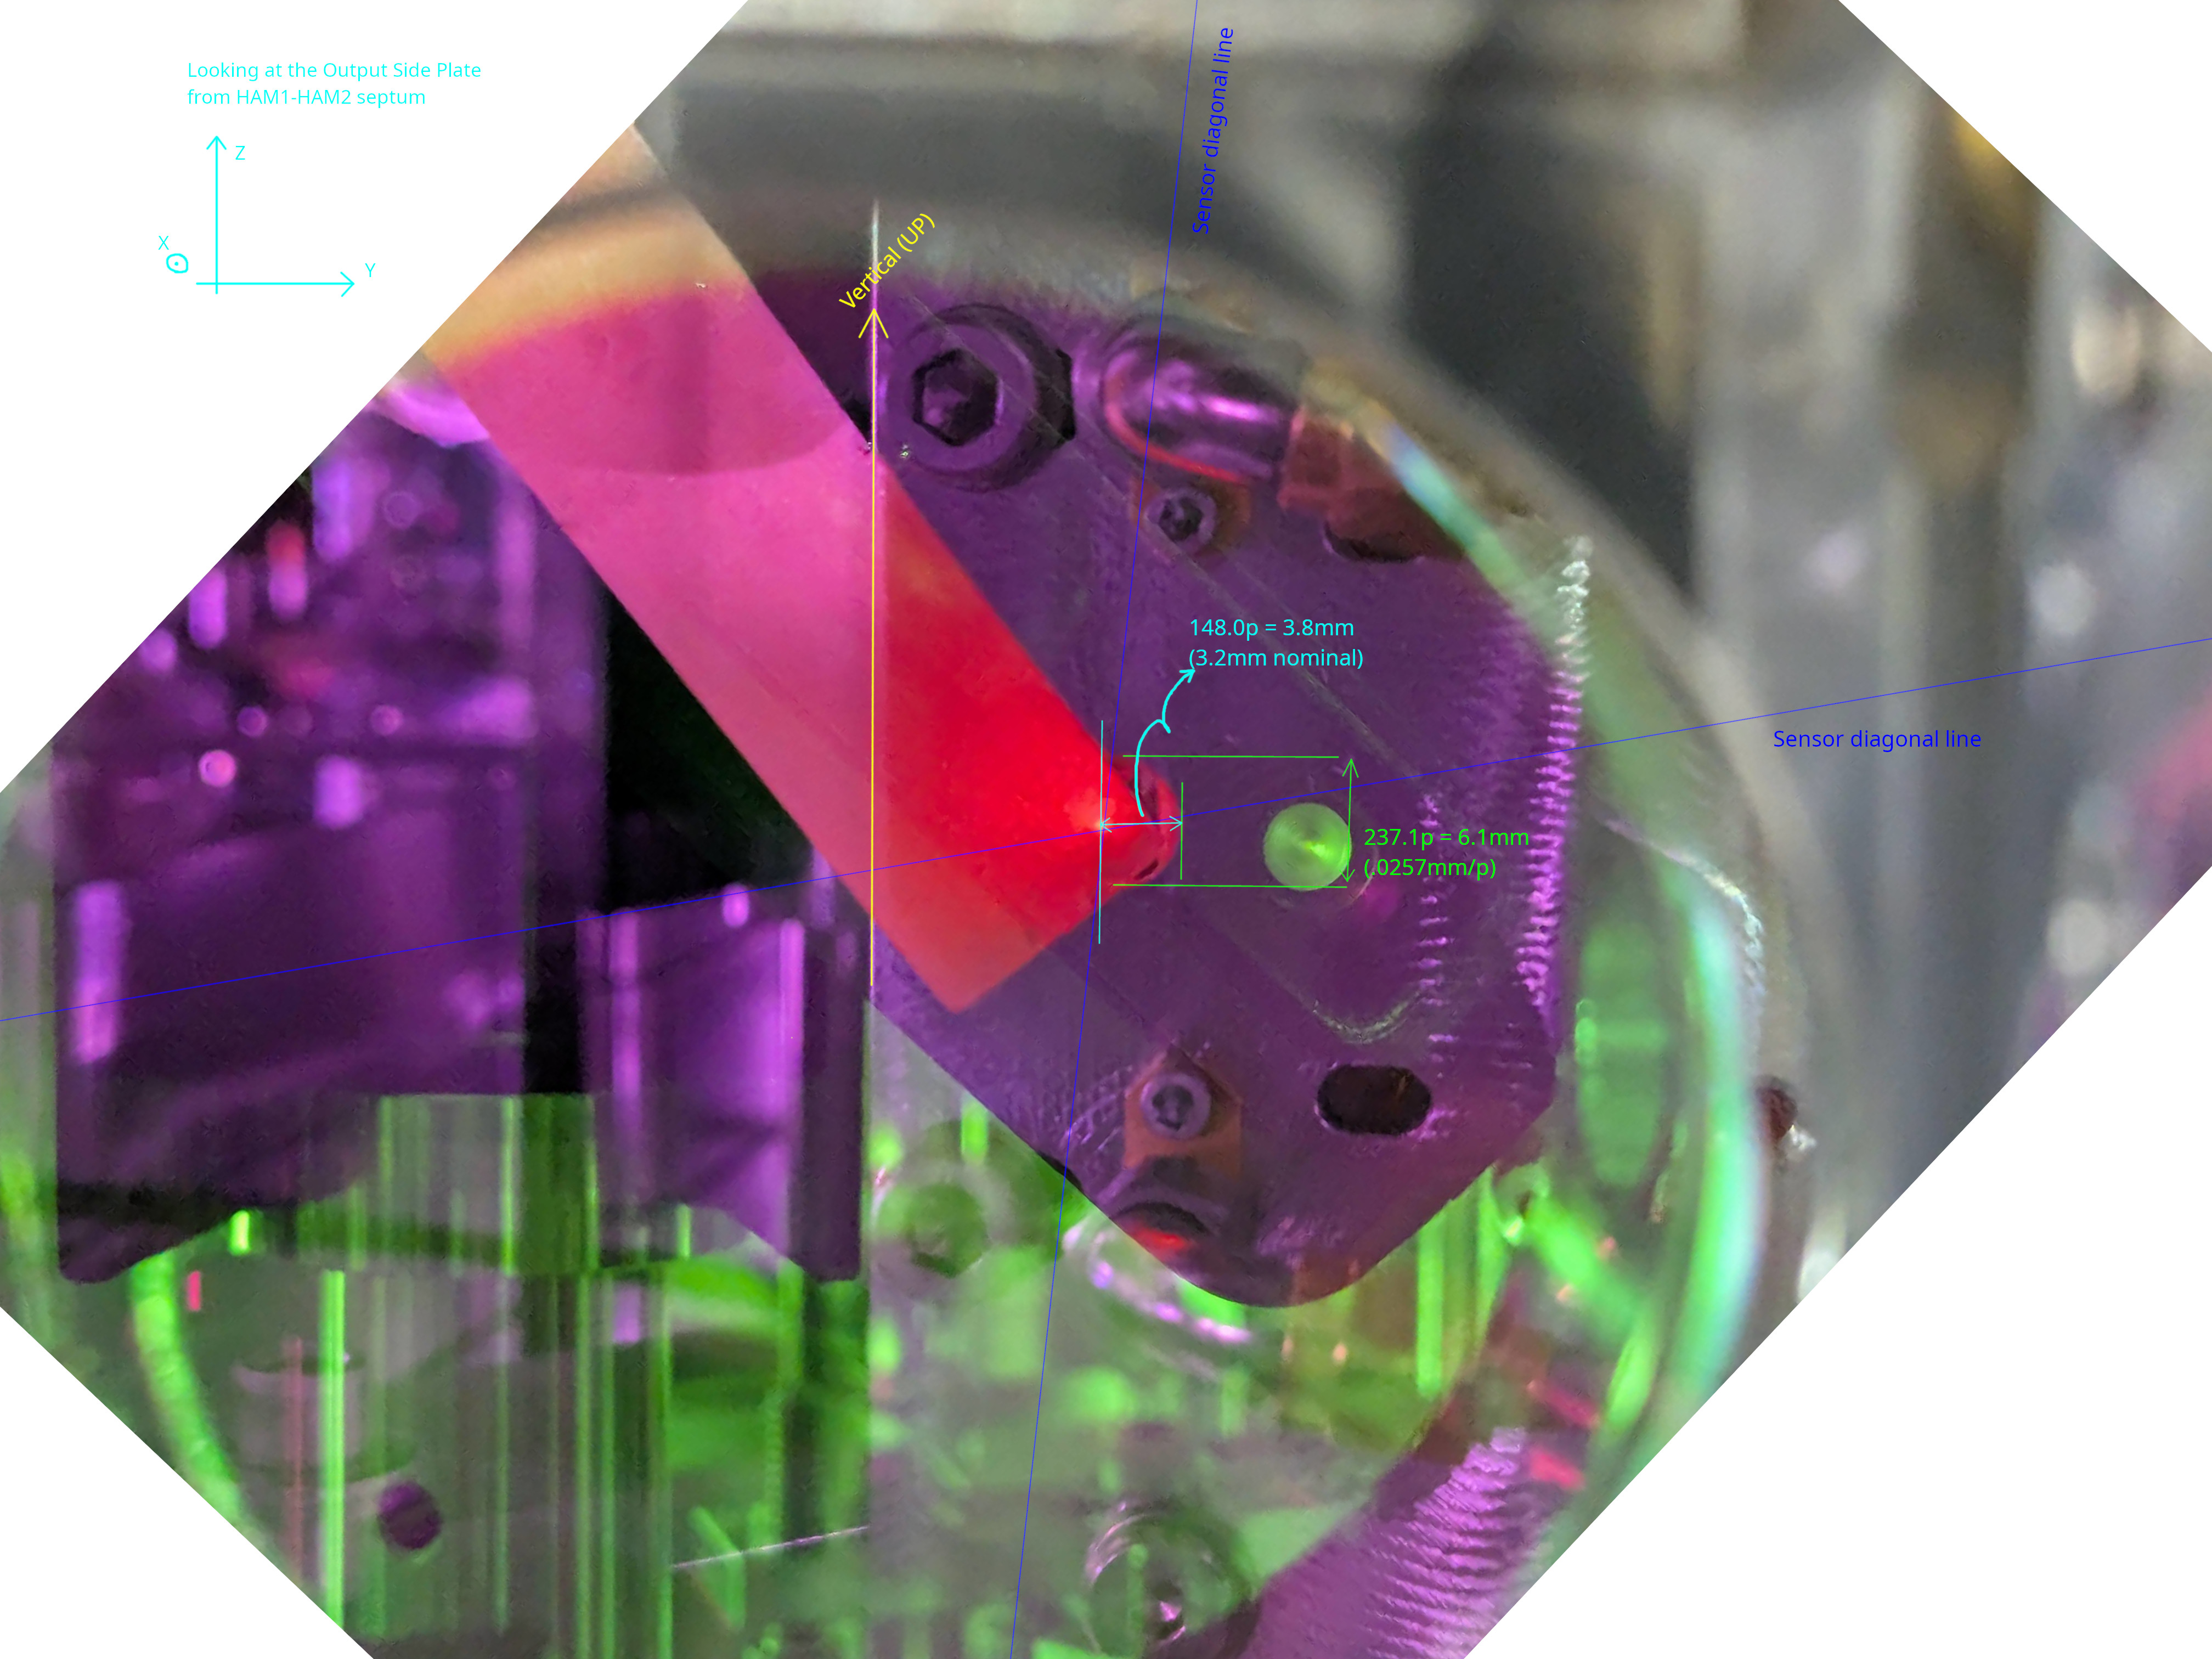
Horizontal beam position offset on the EOM input and output aperture on the side plates.
We realized that the nominal beam position on the EOM input and output aperture is NOT centered on the crystal cross section projected onto the side plate face, the beam is horizontally offset in +Y direction.
Look at the first cartoon (cartoon.jpg) and references therein. The beam spot offsets are 0.91mm on the input side plate and 0.54mm on the output side plate, respectively, assuming that the beam deflection angle per surface of EOM is 2.35 degrees as implied in D2500130.
0.91mm is not a small offset, it's almost 1/4 of the crystal thickness (it's 4x4x40mm).
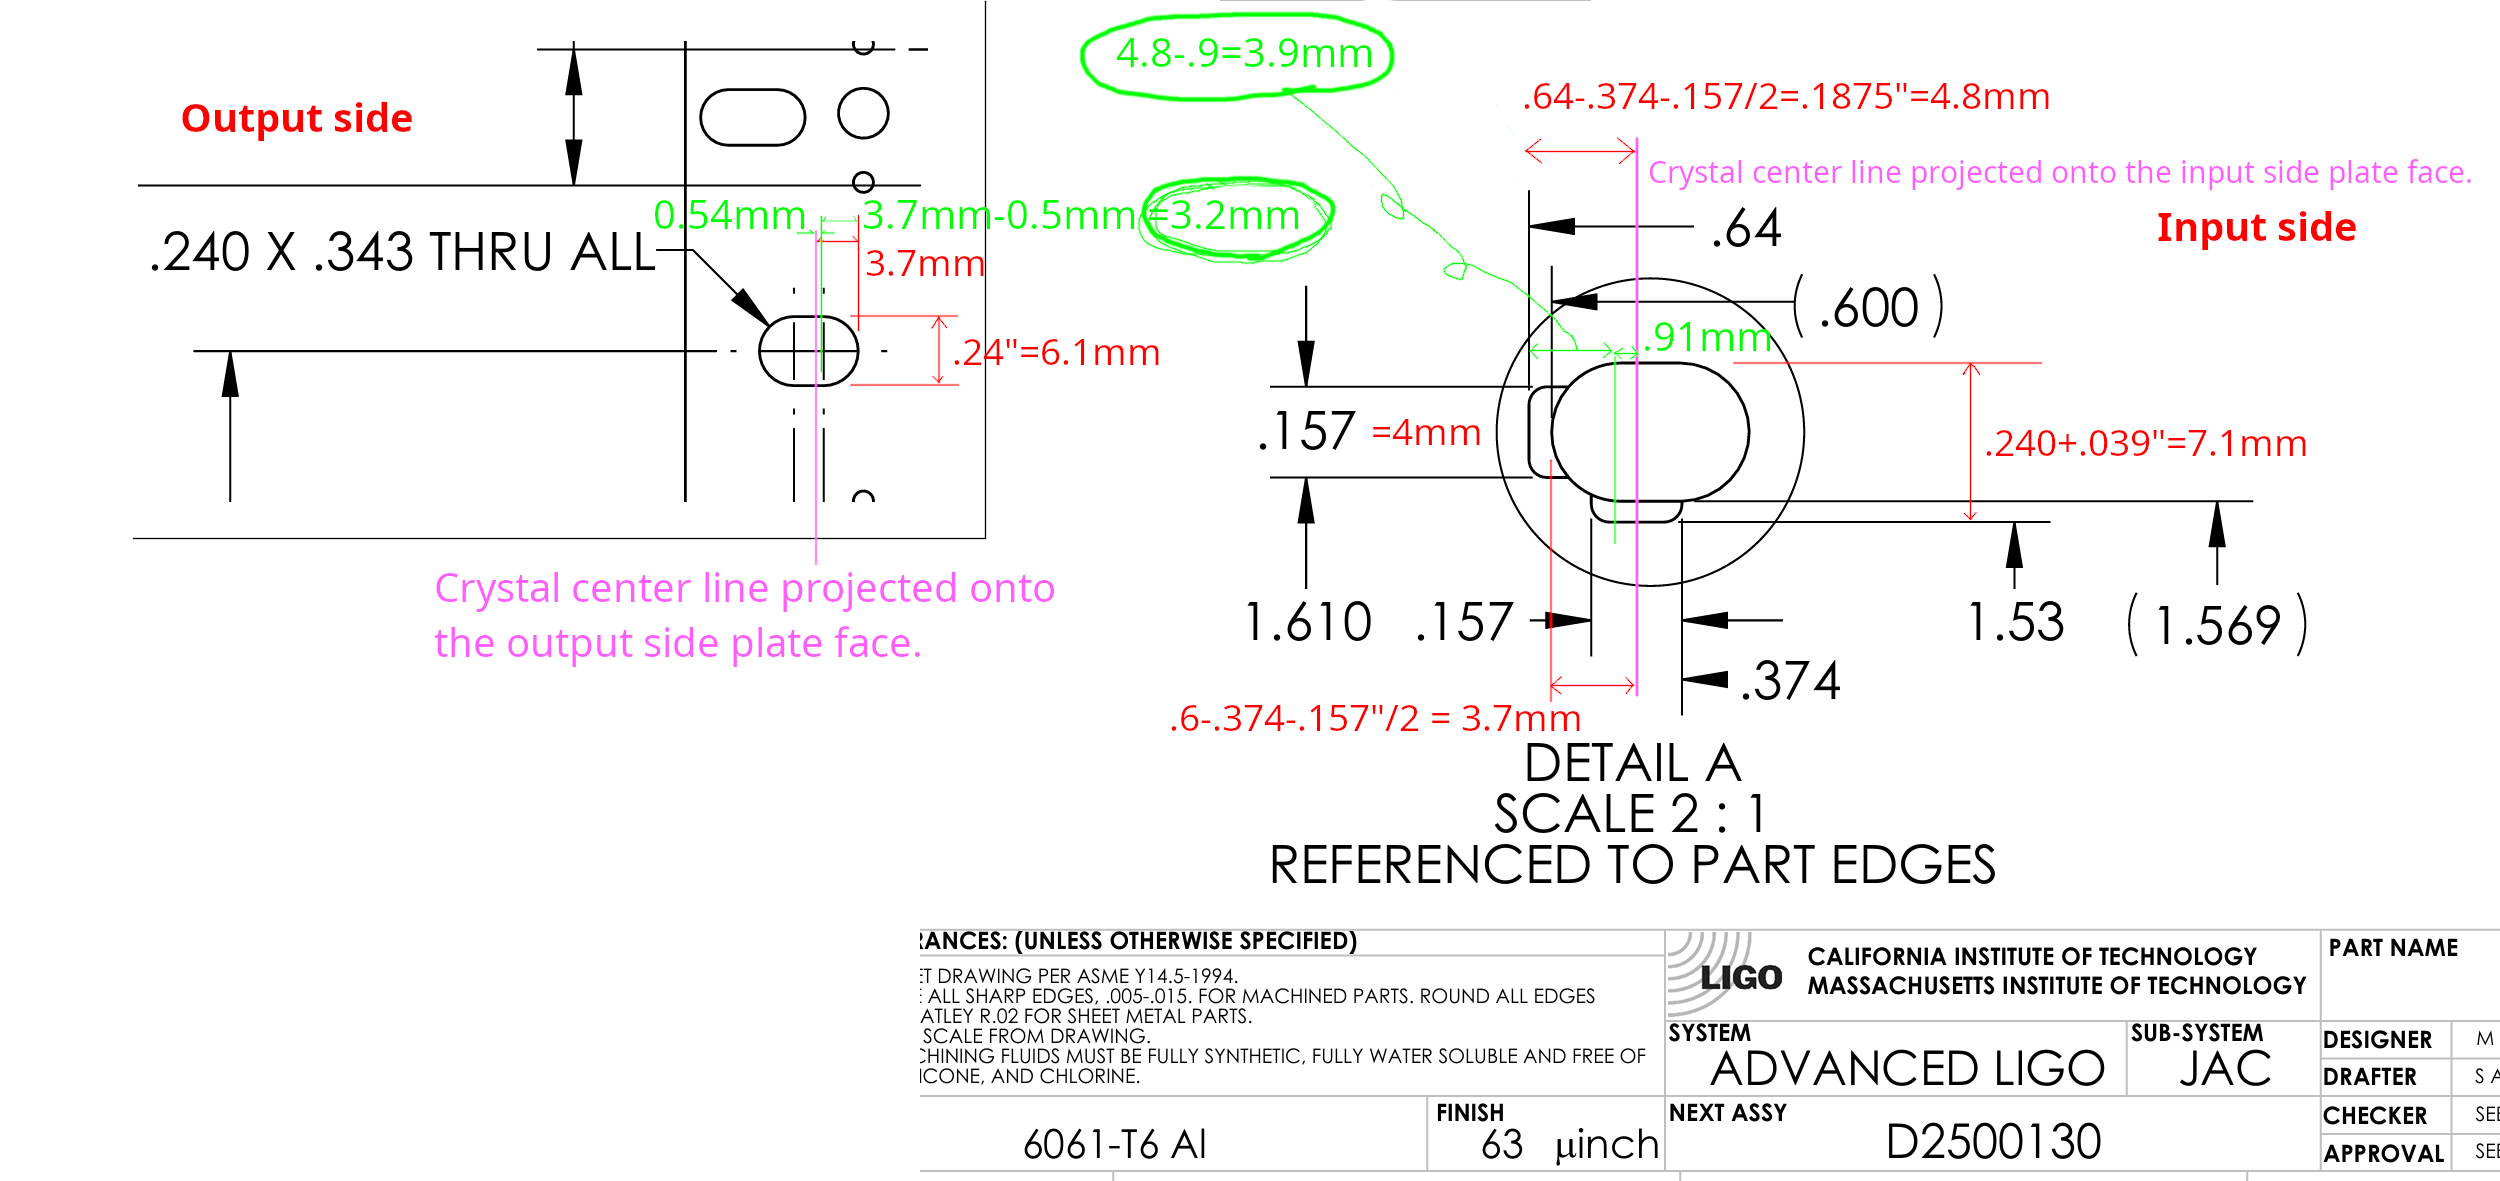
This means that the beam should be (see nominal_sideplate.png, note that the drawing scale of the input aperture in this is twice that of the output aperture):
~3.9mm from the left (+Y) edge of the visual alignment aid notch on the input side plate,
~3.2mm from the right (again +Y) edge of the aperture hole on the output side plate.
Measurements, adjustments and measurements made the beam closer to the nominal location.
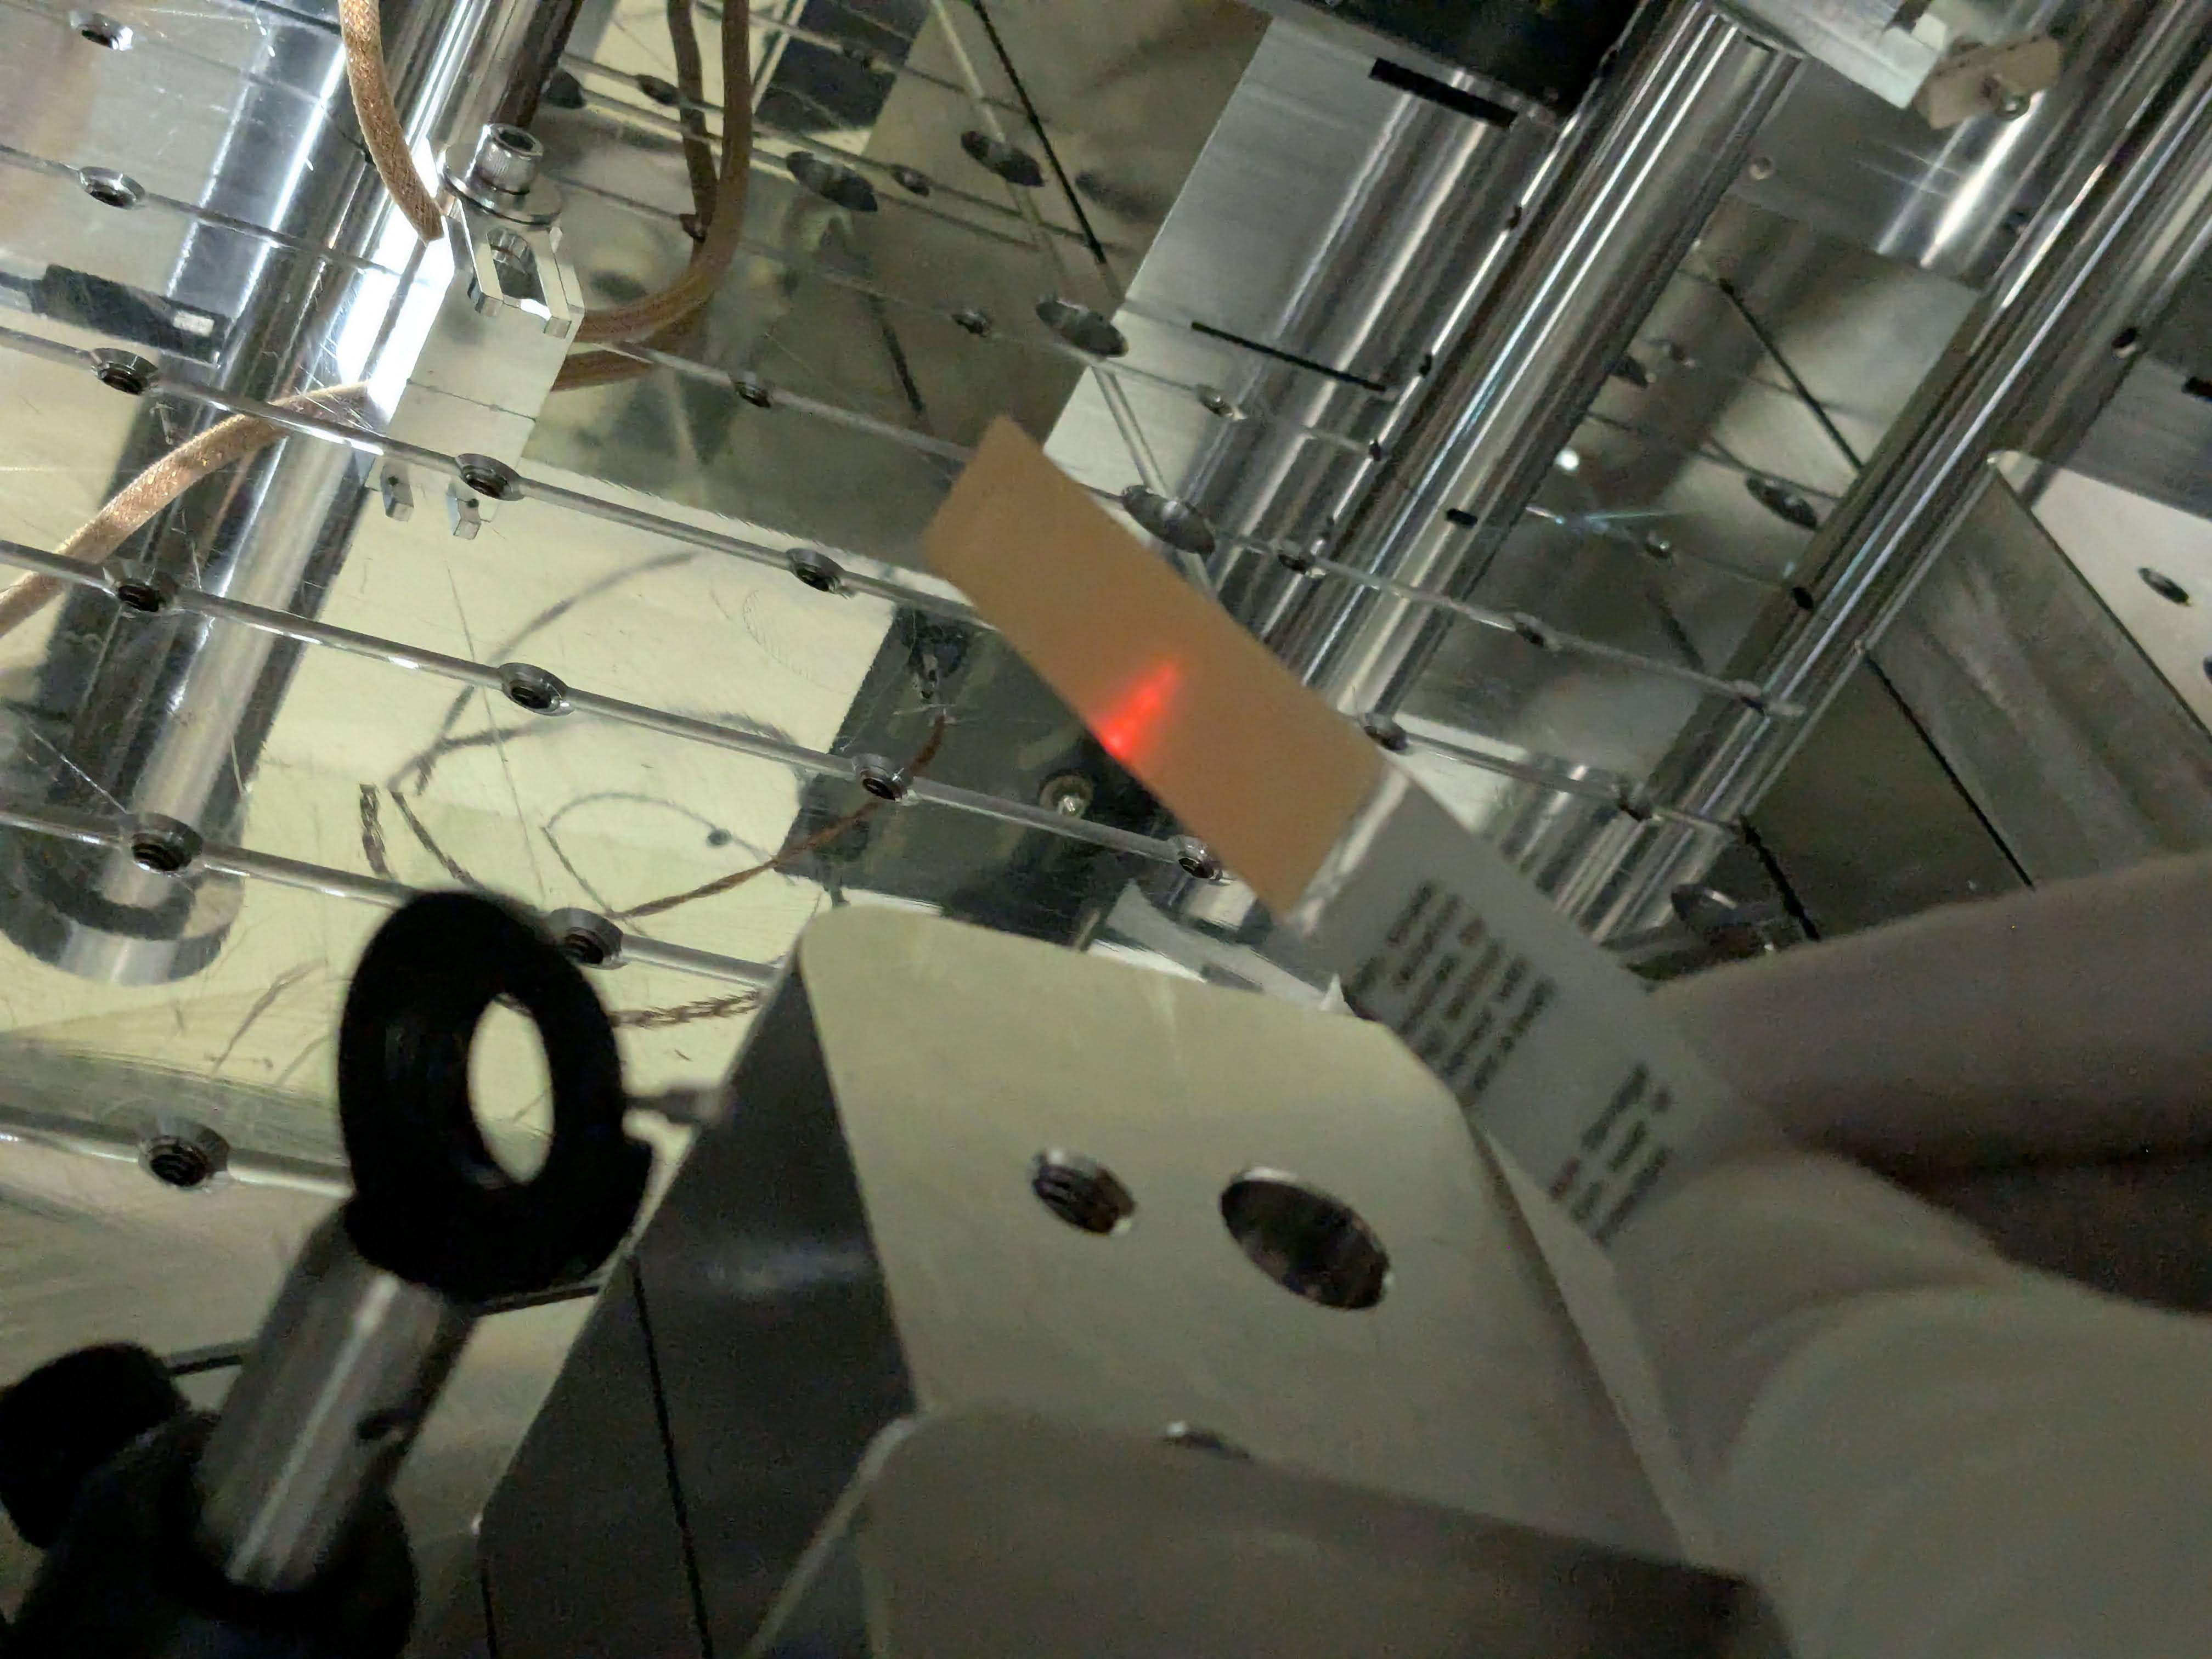
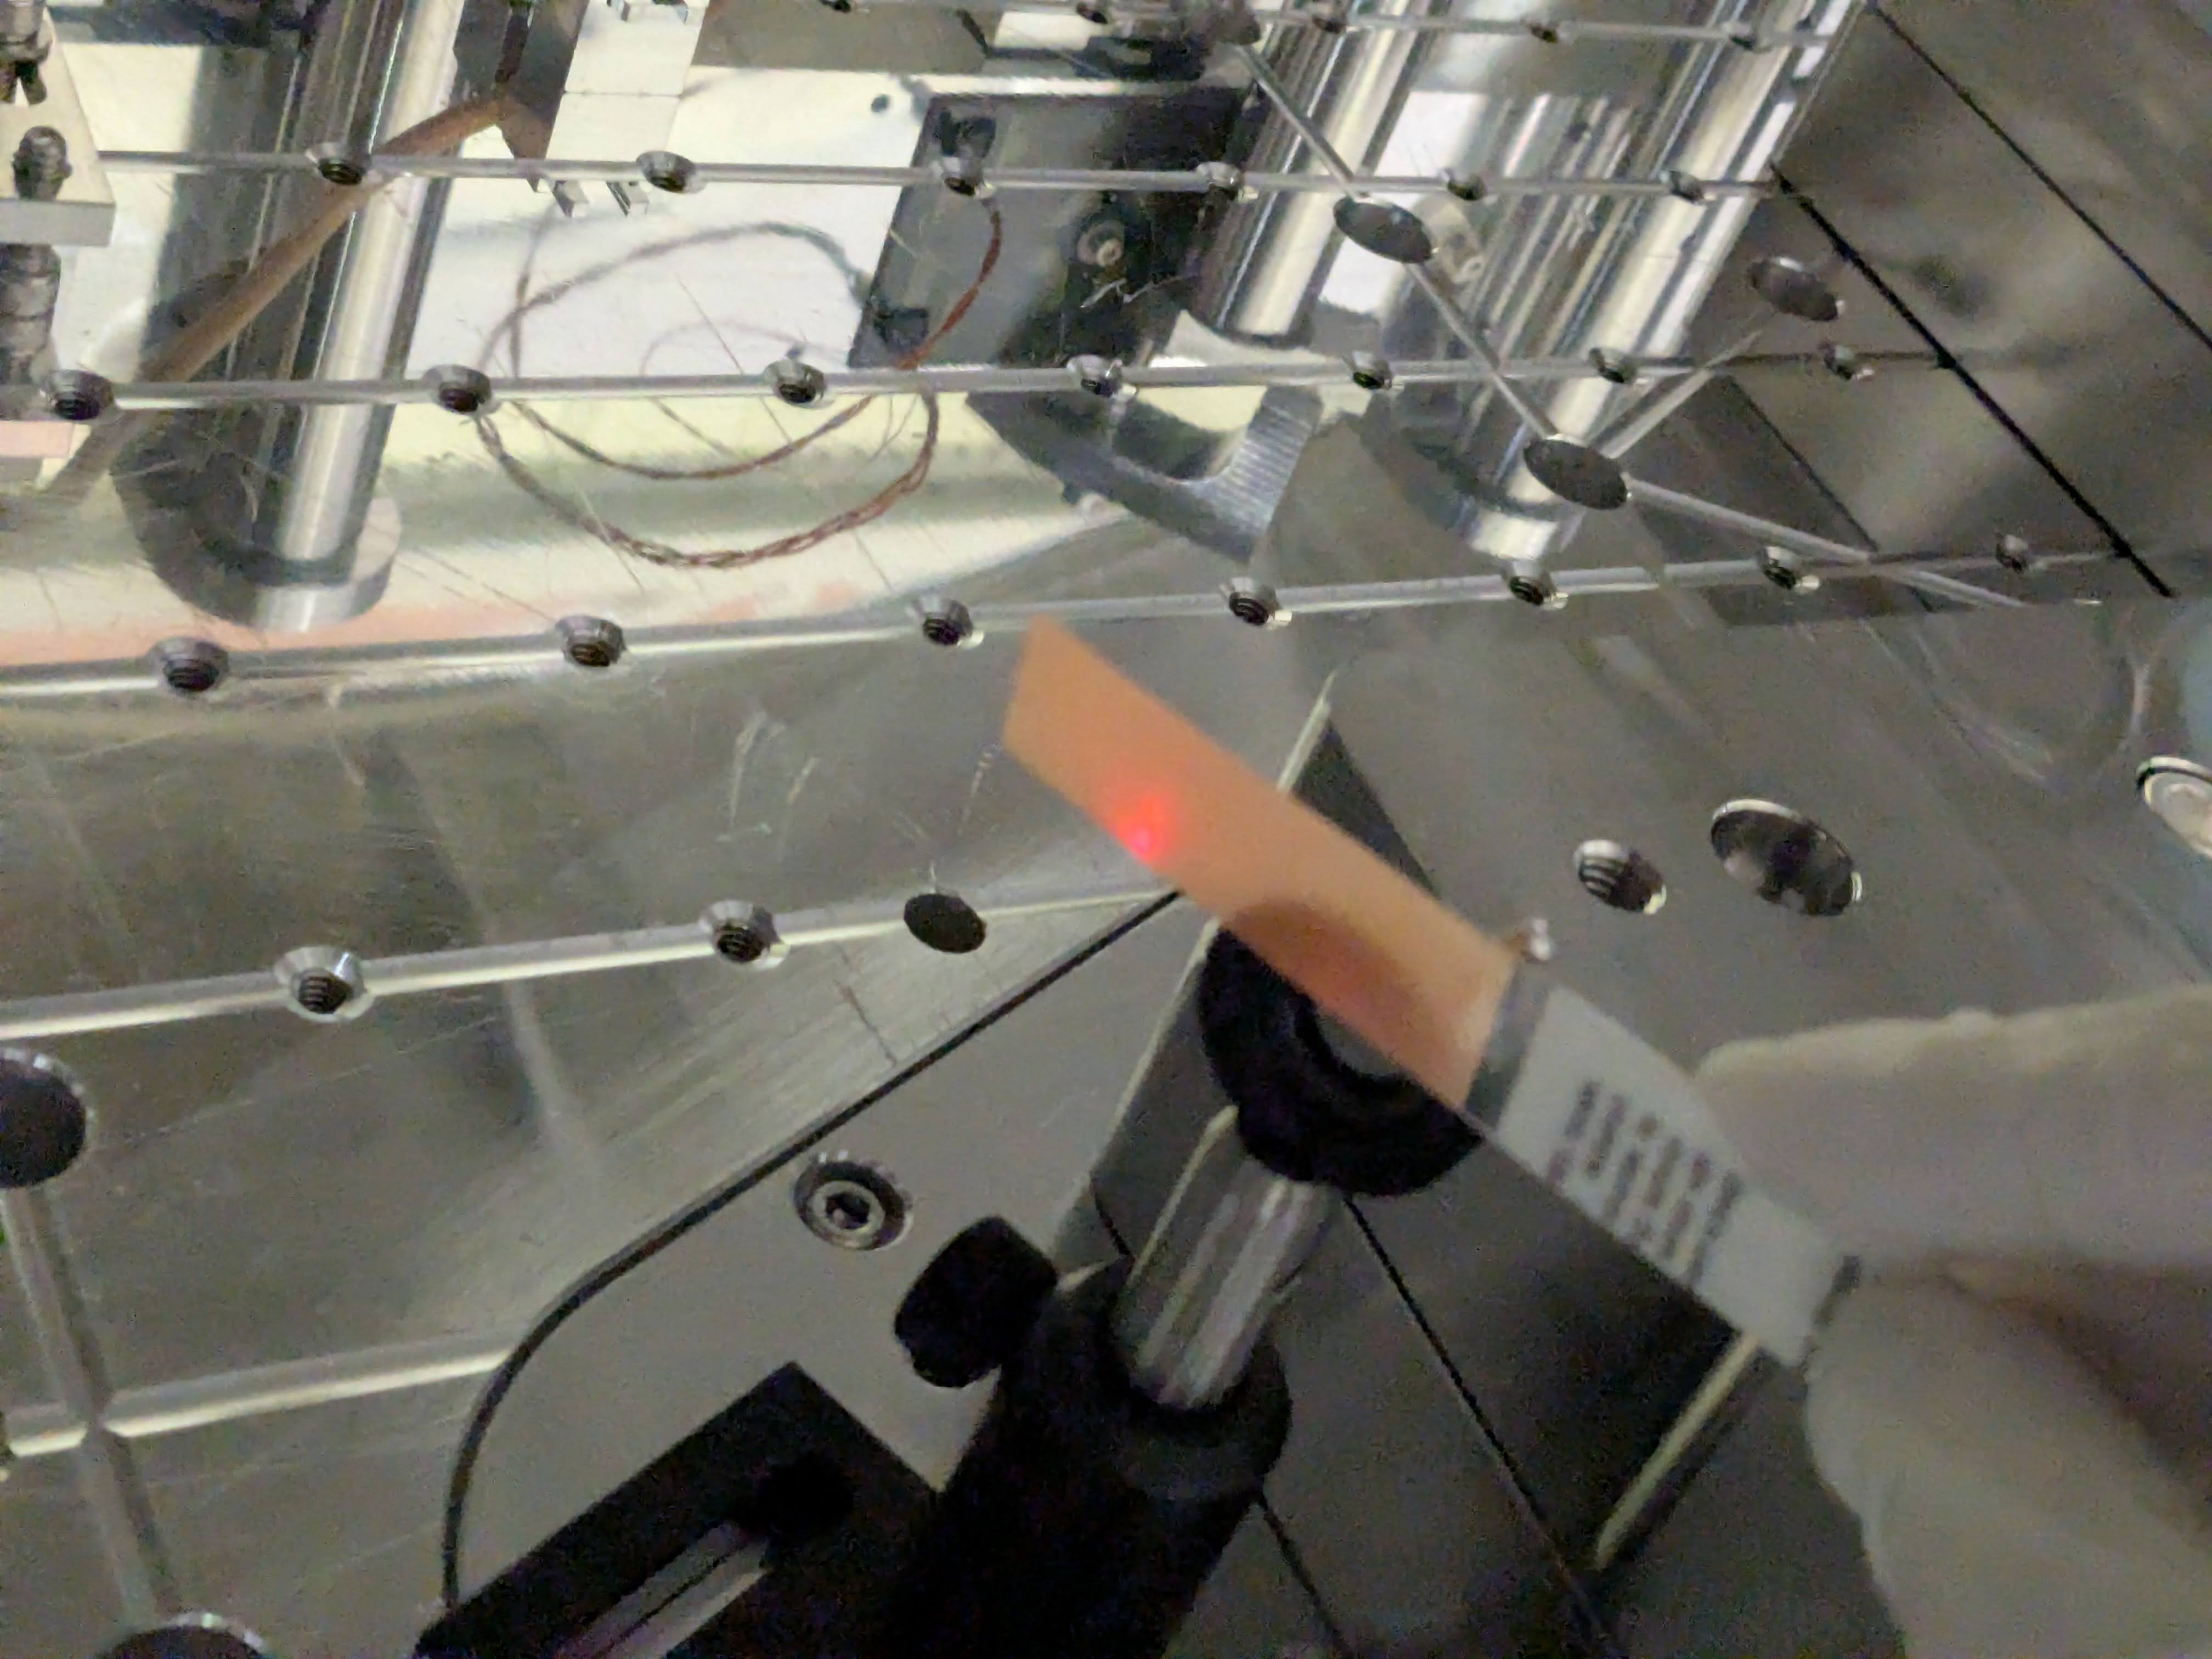
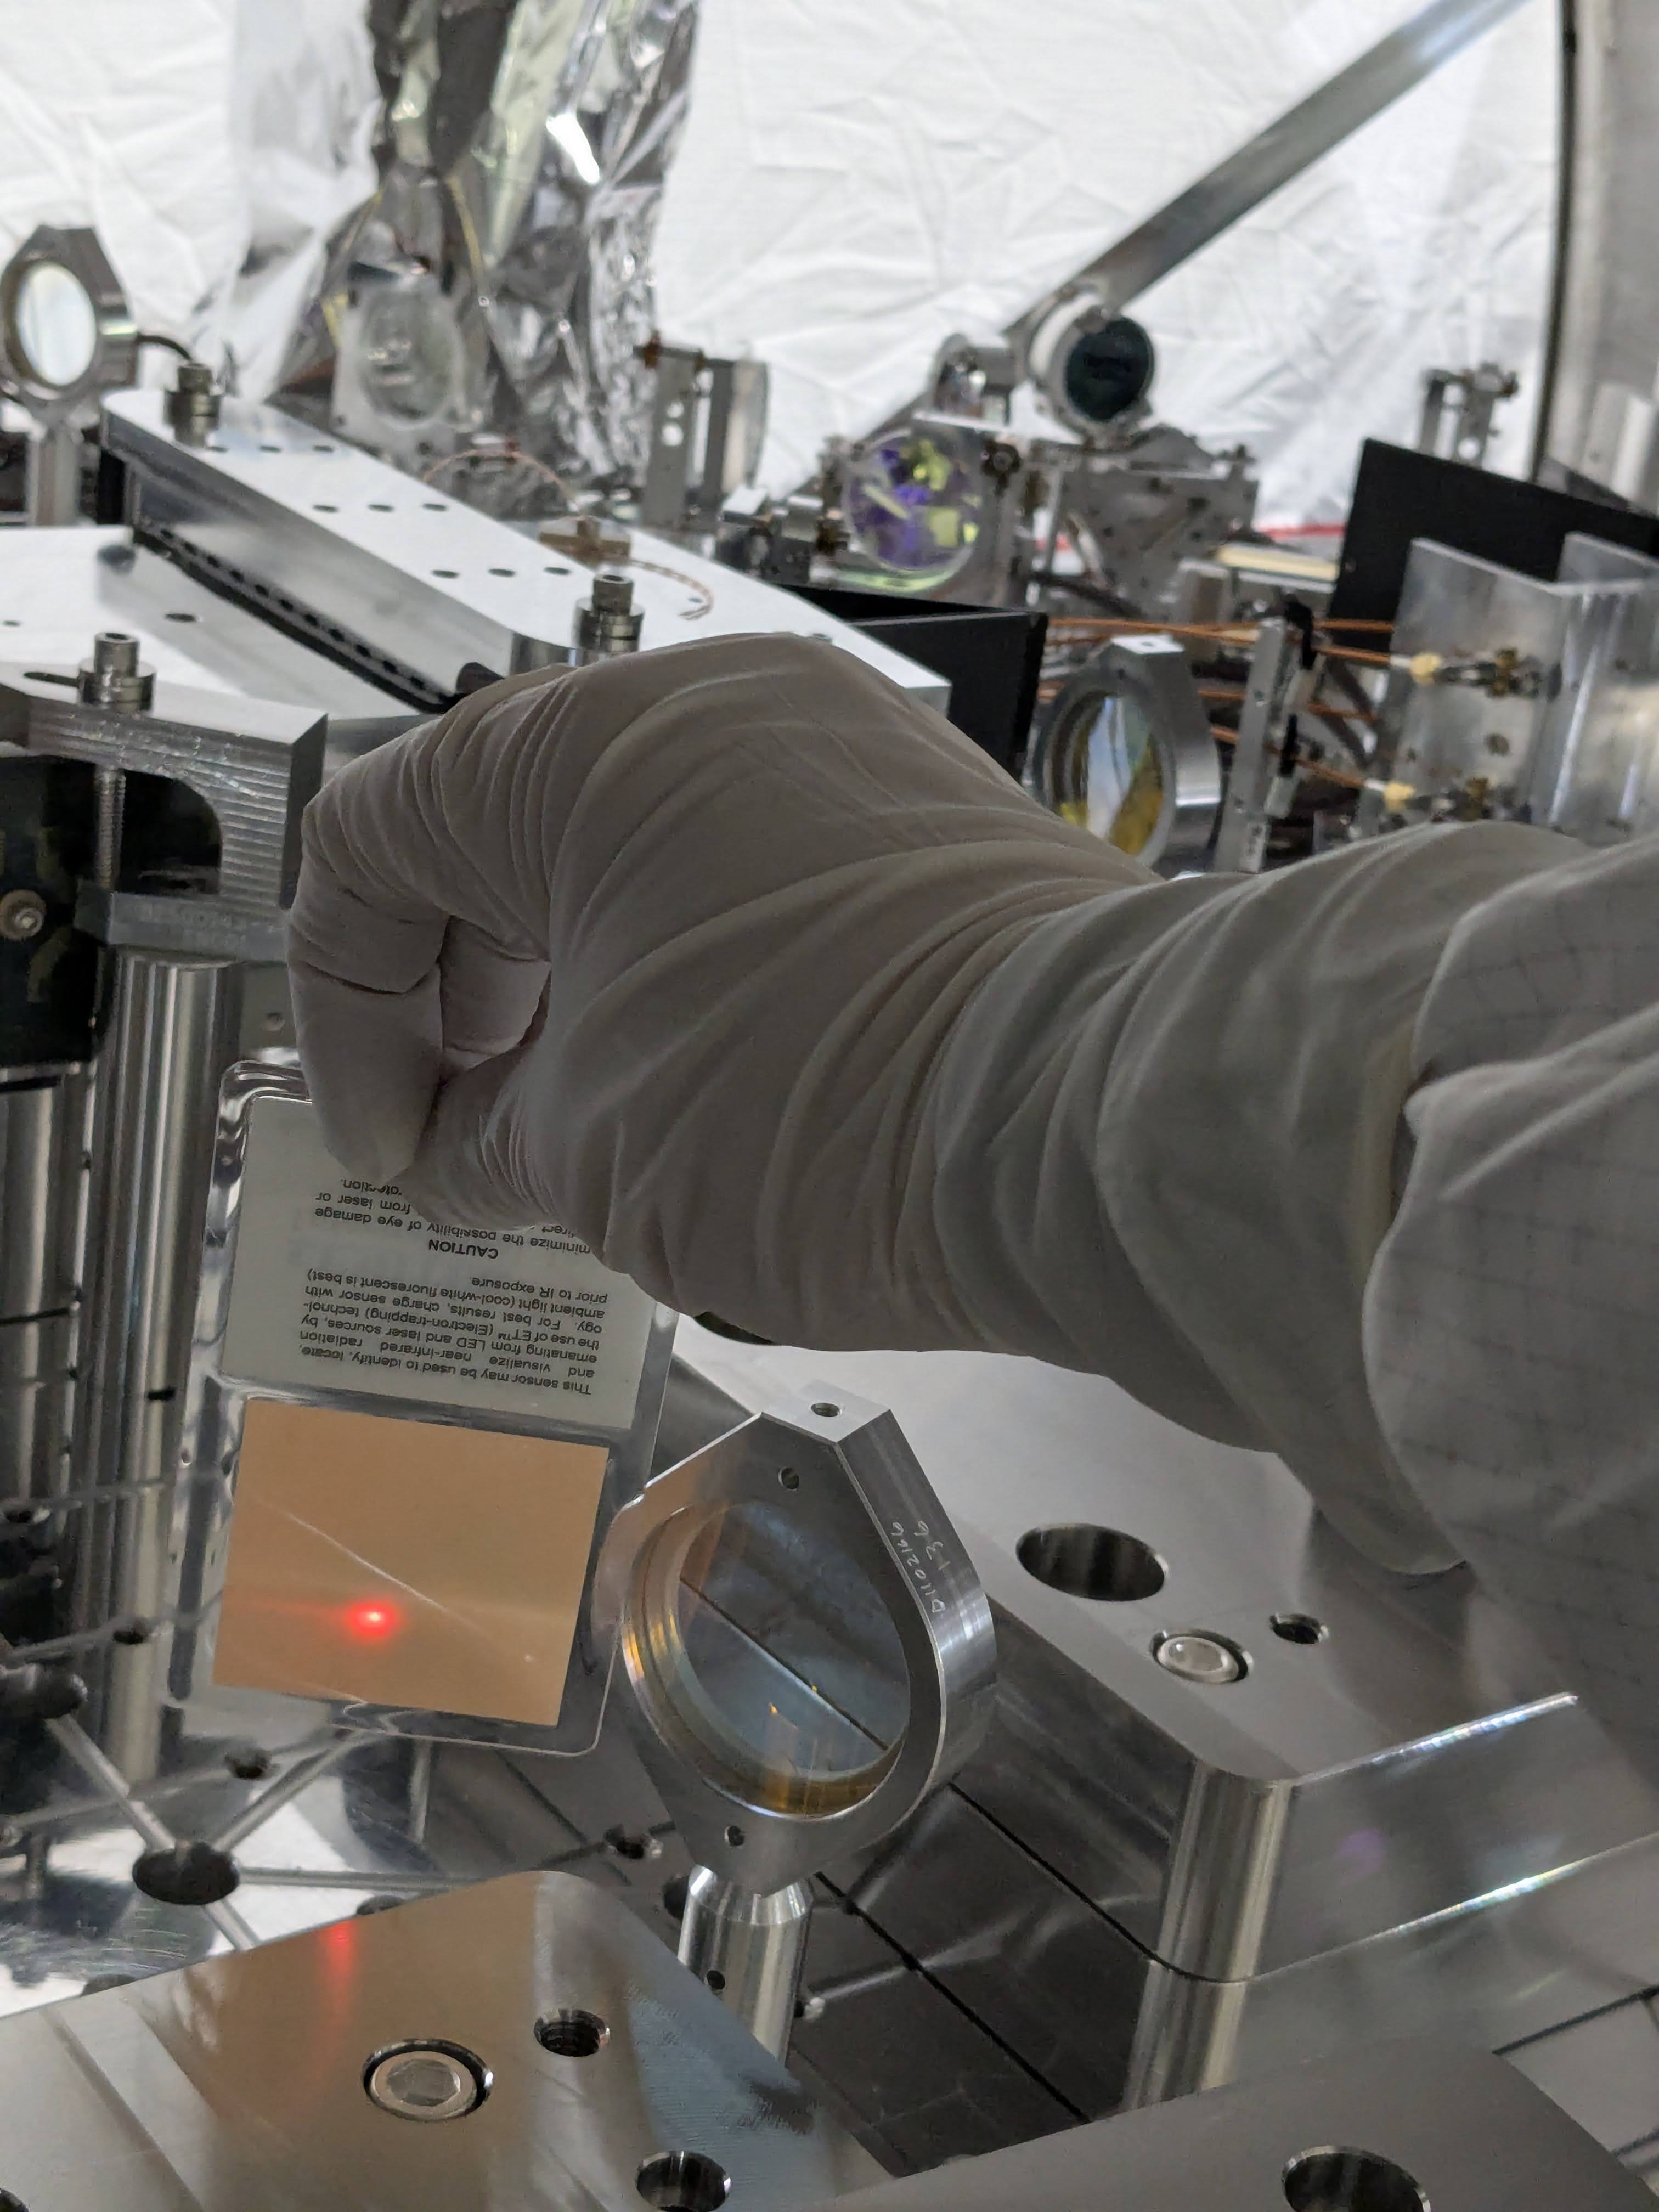
Based on the above knowledge, we took pictures of the beam position on the input/output aperture, paying attention to the errors that could arise from the parallax (which is unavoidable), i.e. the sensor card should be as close to the face of the side plate as possible and the beam spot on the sensor card should be as close to the sentor of the camera sensor as possible. This was a tougher job than you think.
Anyway, in the first round of measurements, we convinced ourselves that the beam was:
off in -Y direction by 0.7mm relative to the nominal beam position on the input plate of the EOM,
off in +Y direction by 0.5mm on the output,
give or take 0.2mm or so (the error is based on two pictures for the input beam position with random variation in parallax coming from camera position and the distance between the side plate surface and the viewer card).
We rotated the entire EOM base by using two dog clamps against the EOM base and inserting appropriate shims (EOM_rotation.png). We didn't use the YAW adjustment feature for the EOM pivot plate because there's no way to rotate it in a controlled manner.
After the first adjustment we thought that the beam coming out of the EOM looked better (which might have been false). On the second adjustment the beam looked the same or slightly worse (which might have been false) and we reverted back to the same position as the first adjustment.
Multiple beams mostly in PIT coming out of EOM (pictures and history)
1W into HAM1, otherwise it's hard to photograph these clearly.
The first picture is right after the YAW adjustment was made but before adjusting PIT. The card is held just ABOVE the main beam, you can see four blobs that look like some kind of ghost beams. (If you try to picture the main beam, it's so bright these ghosts become hard to capture.)
The second picture is after the first PIT adjustment. You can only see maybe two blobs, but later we found that the rest went below the main beam (sorry no "below" picture).
So, to recap the history of the beam quality,
Other things.
Just to make sure, we turned down the 9MHz and 45MHz RF power to 3dBm and disconnected the 118MHz and 24MHz cables and nothing changed.
We know that the crystal wedge is supposed to be horizontal and we know that the wedge orientation is correct. When we first installed the EOM in chamber, the EOM transmission was deflected horizontally in +Y direction.
Curoius thing about the EOM dimensions
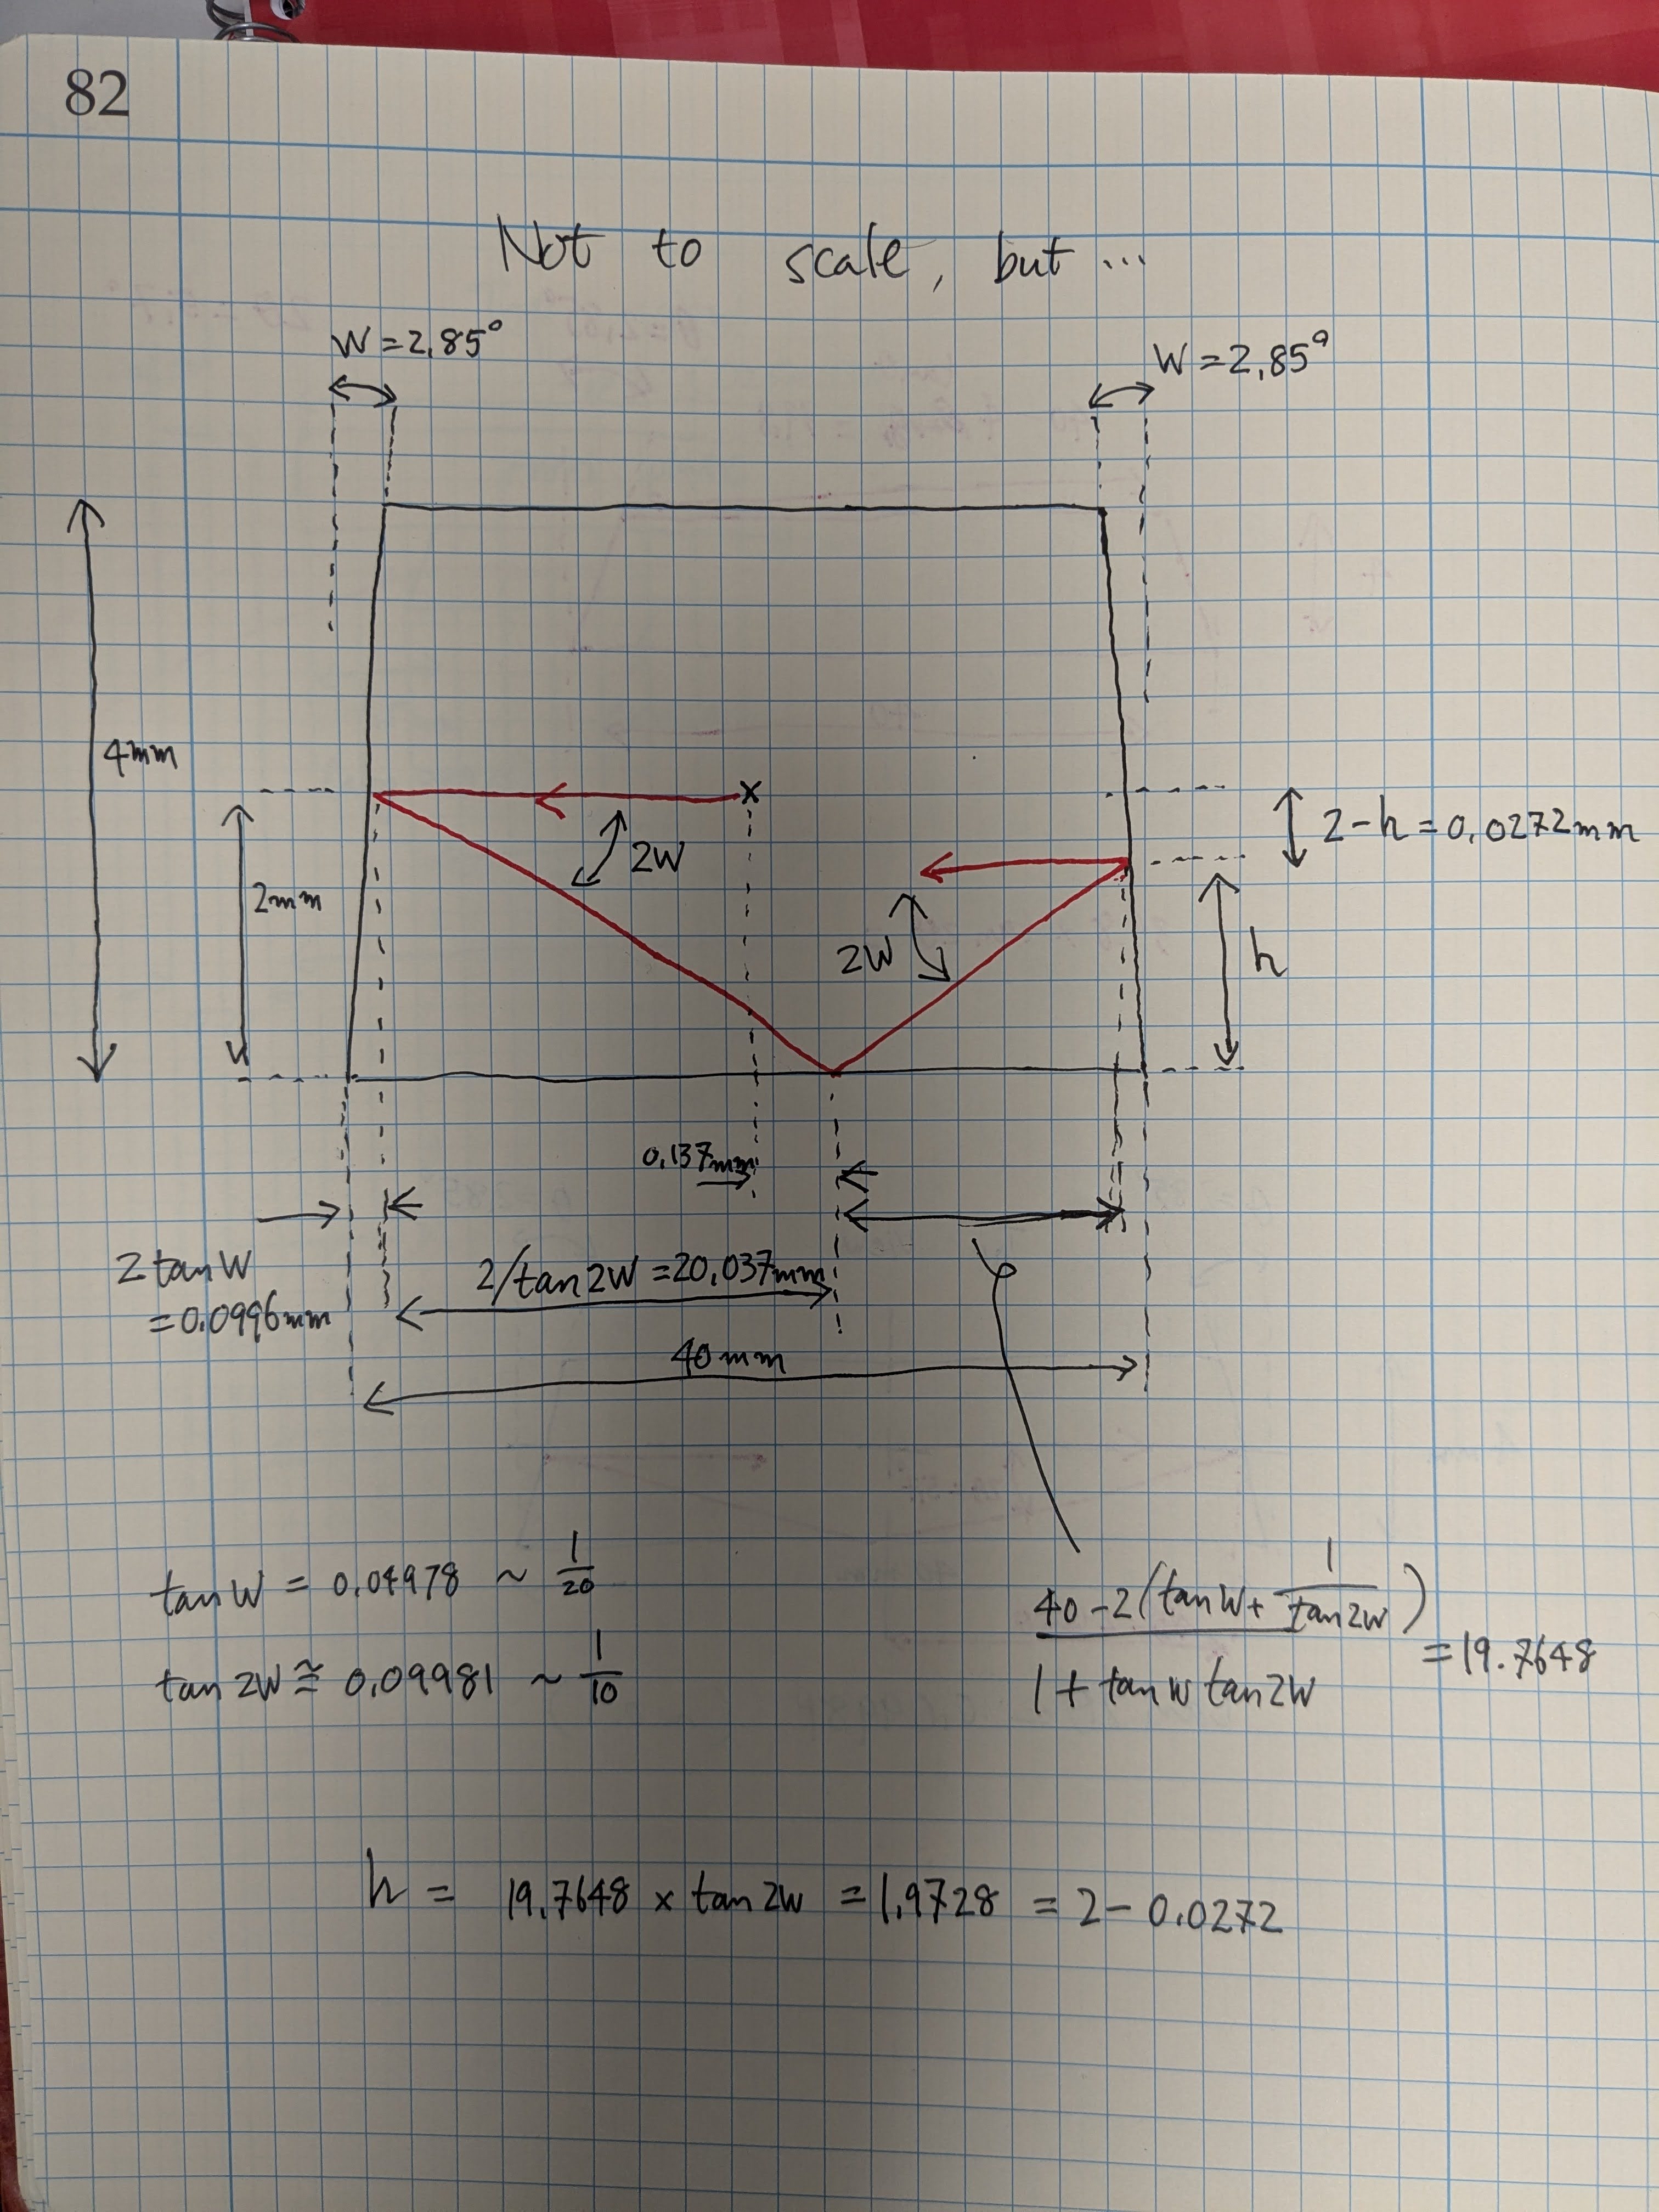
Crystal length L=40mm, thickness T=4mm=L/10, wedge angle w=2.85 deg, and tan(2w) = 0.09981 ~ 1/10.
Though this is probably not related to the ghost beams in PIT direction, when the beam is perfectly aligned with the EOM (i.e. the light traveling the center of the crystal), the internal AR reflection of at the output face of the crystal hits the side of the crystal and the specular reflection will hit the input surface of the crystal and almost exactly comes back on top of the main beam with only 0.0272mm offset. See the 1st cartoon.
Note that the side surfaces are not polished (though the AOI is 84.3 deg so most of the power is reflected back into the crystal due to total internal reflection).
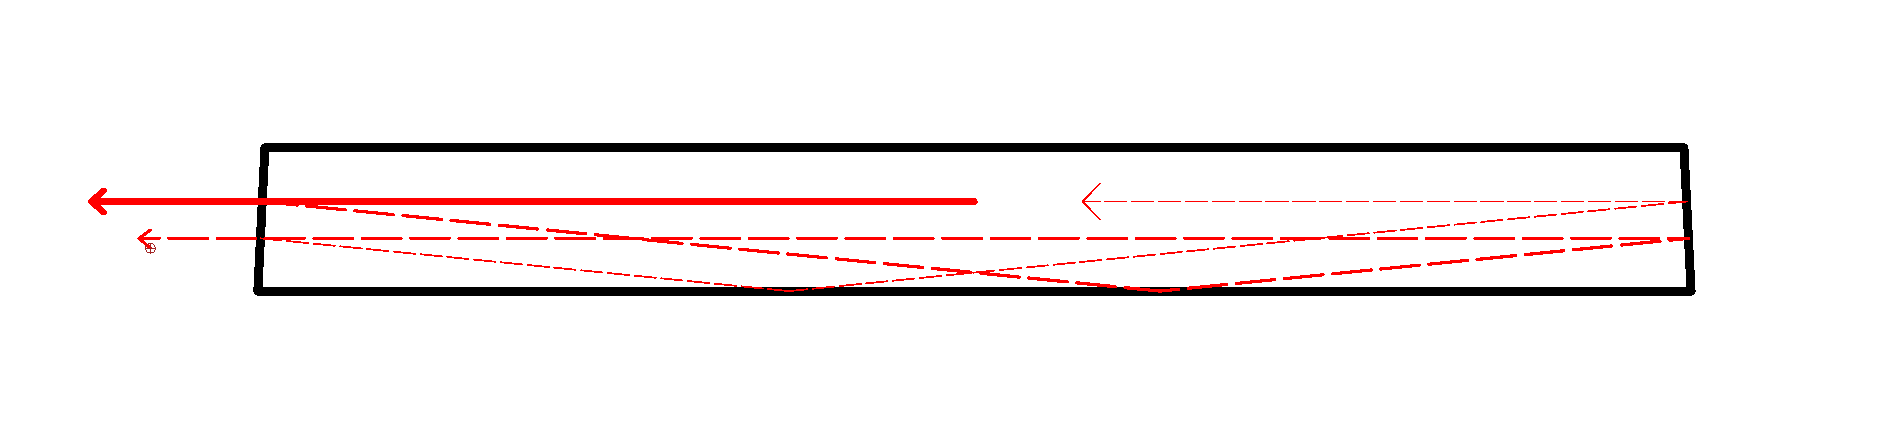
If you displace the beam in horizontal direction, the AR path is displaced in the opposite direction by about the same amount (i.e. if the main beam moves by 0.5mm toward the short face of the crystal, the AR-side-AR beam moves by about 0.5mm toward the long face). If you continue tracing the AR-side-AR beam, it turns out that the AR-side-AR-AR-side-AR beam will come back exactly on the main beam. See the 2nd cartoon (which is actually to scale, the main beam is off by 0.5mm and the 1st ghost is off by 0.5272 in the opposite direction, and the 2nd ghost is on top of the main beam).
Interesting design choice.
TITLE: 02/06 Day Shift: 1530-0030 UTC (0730-1630 PST), all times posted in UTC
STATE of H1: Planned Engineering
INCOMING OPERATOR: None
Super Bowl Weekend SHIFT SUMMARY:
JAC team continued with JAC alignment work in HAM1. HAM3 AIP was swapped & started pumping over the weekend.
(Go Seahawks!)
LOG:
FAMIS 28229
pH of PSL chiller water was measured to be between 10.0 and 10.5 according to the color of the test strip.
From the previous alog post, Sheila measured a power drop across BL2 lens.
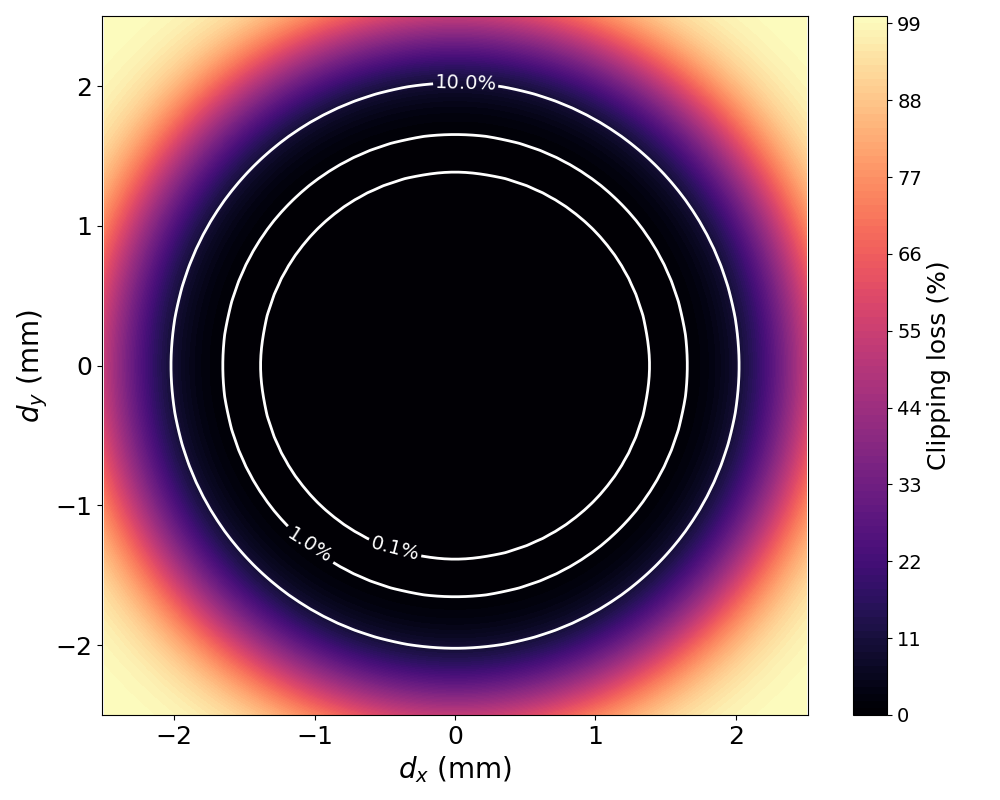
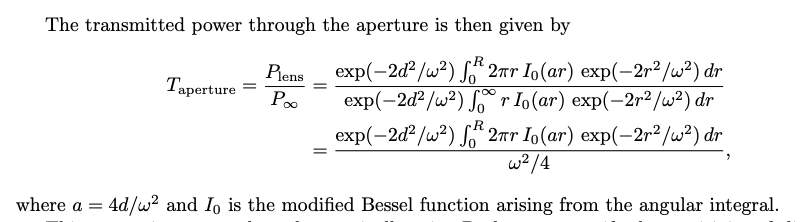
Here I modeled the loss of the 700um beam waist across the 2.5mm BL2 lens aperture.
The expression for the transmitted power obtained by modifying the Gaussian beam equation to include a displacement d2 = dx2 + dy2 is shown here.
And here's the contour plot for the loss (1-T) across the lens aperture for a beam transversing across various spots on the lens.
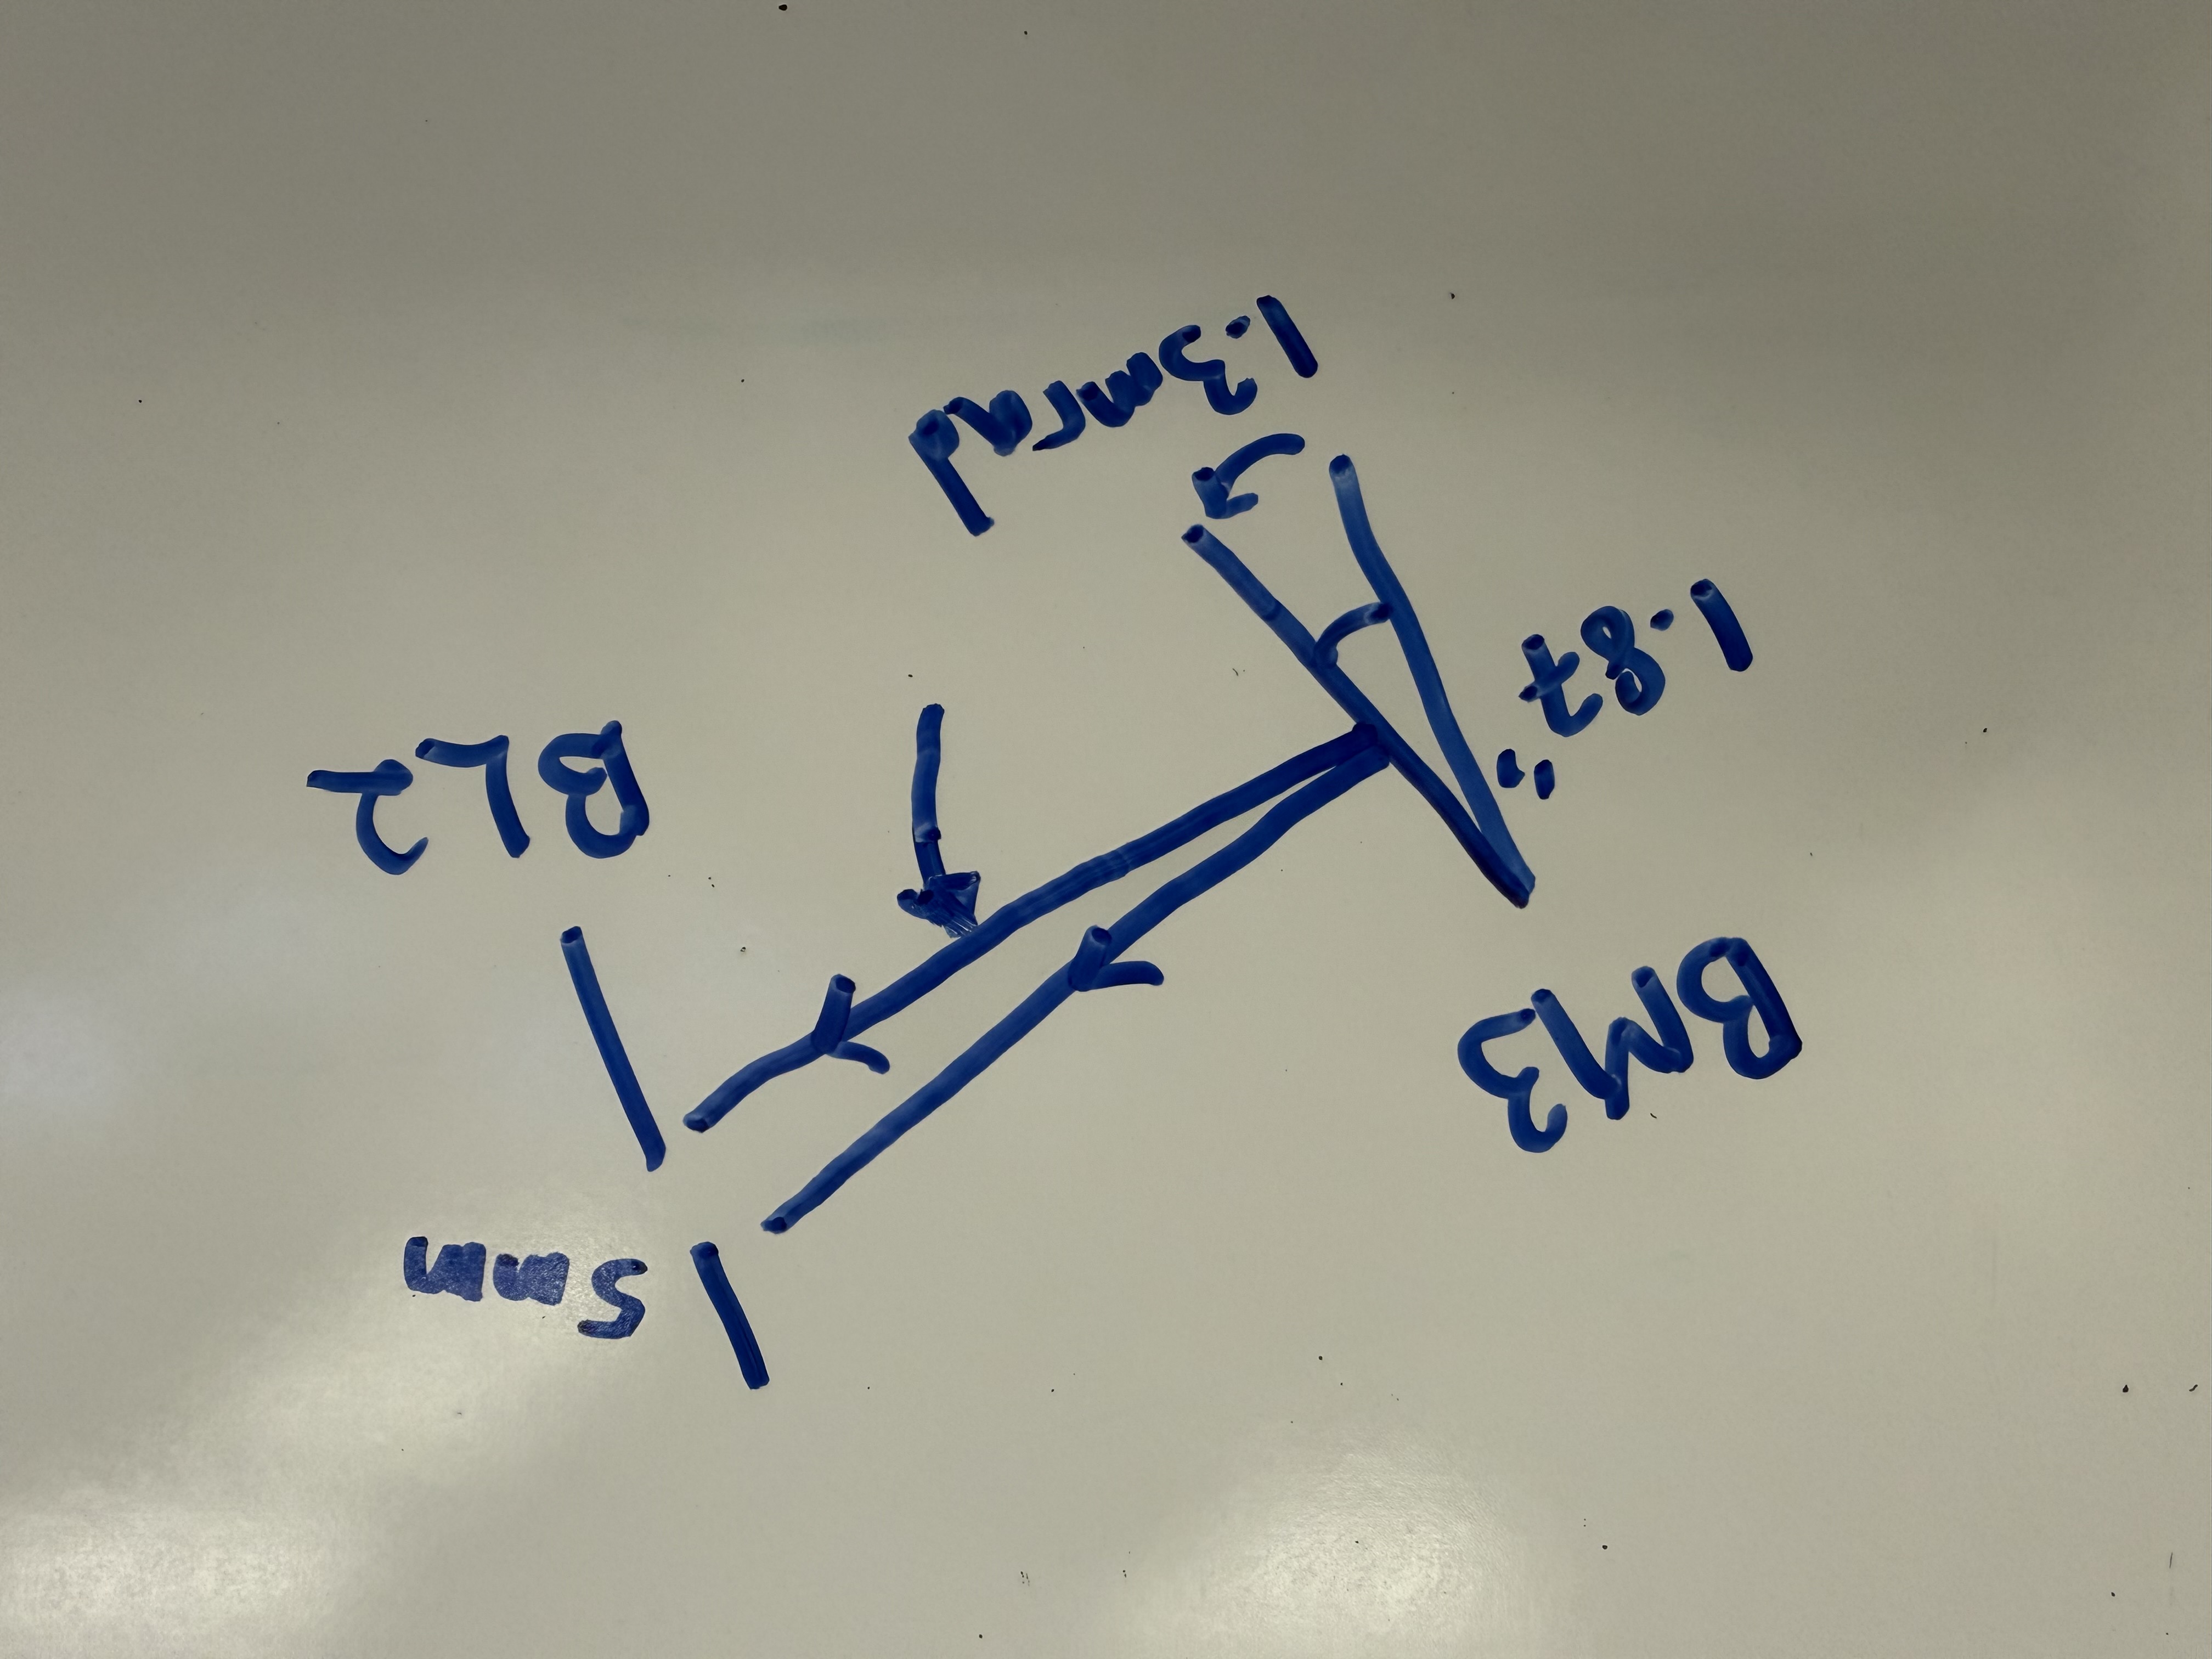
Me and Sheila are checking on the geometry of the setup.
The BM3 mirror mount IXM100.2 has a 100 pitch screw adjustment ( correspond to 100 turn per inch translation), and the beam appeared to be clipped symmetrically for 1/8 rev. For the mirror mount of 1.87" width, this correspond to a mirror rotation of 1.3mrad.
The distance between BM3 and BL2 is 148mm, from the mirror rotation, the IR beam angular deflection is 2.6mrad, this implies an aperture size of 0.4mm. Something is not right, and it's a mystery that requires more investigation.
The aperture stop installed is D2000339: 0.2" (5mm) diameter.
Following on from this log (alog #89046), we have already checked that the MC mirrors are restored to their previous positions from before the power cut in December. We know the seismic state now should be as close as we can manage to this time 2025-12-03 11:28:44 UTC when the mode cleaner was locked at 2W input power and before any HEPIs were locked for the vent.:
Summary of seismic state now:
HAM ISI locked. HAM 2, 3, 4, 5, 6 ISI isolated.
HAM1,2 and BSC2 HEPI locked. HAM 3,4,5,6 HEPI isolated - ie. as per nominal operation.
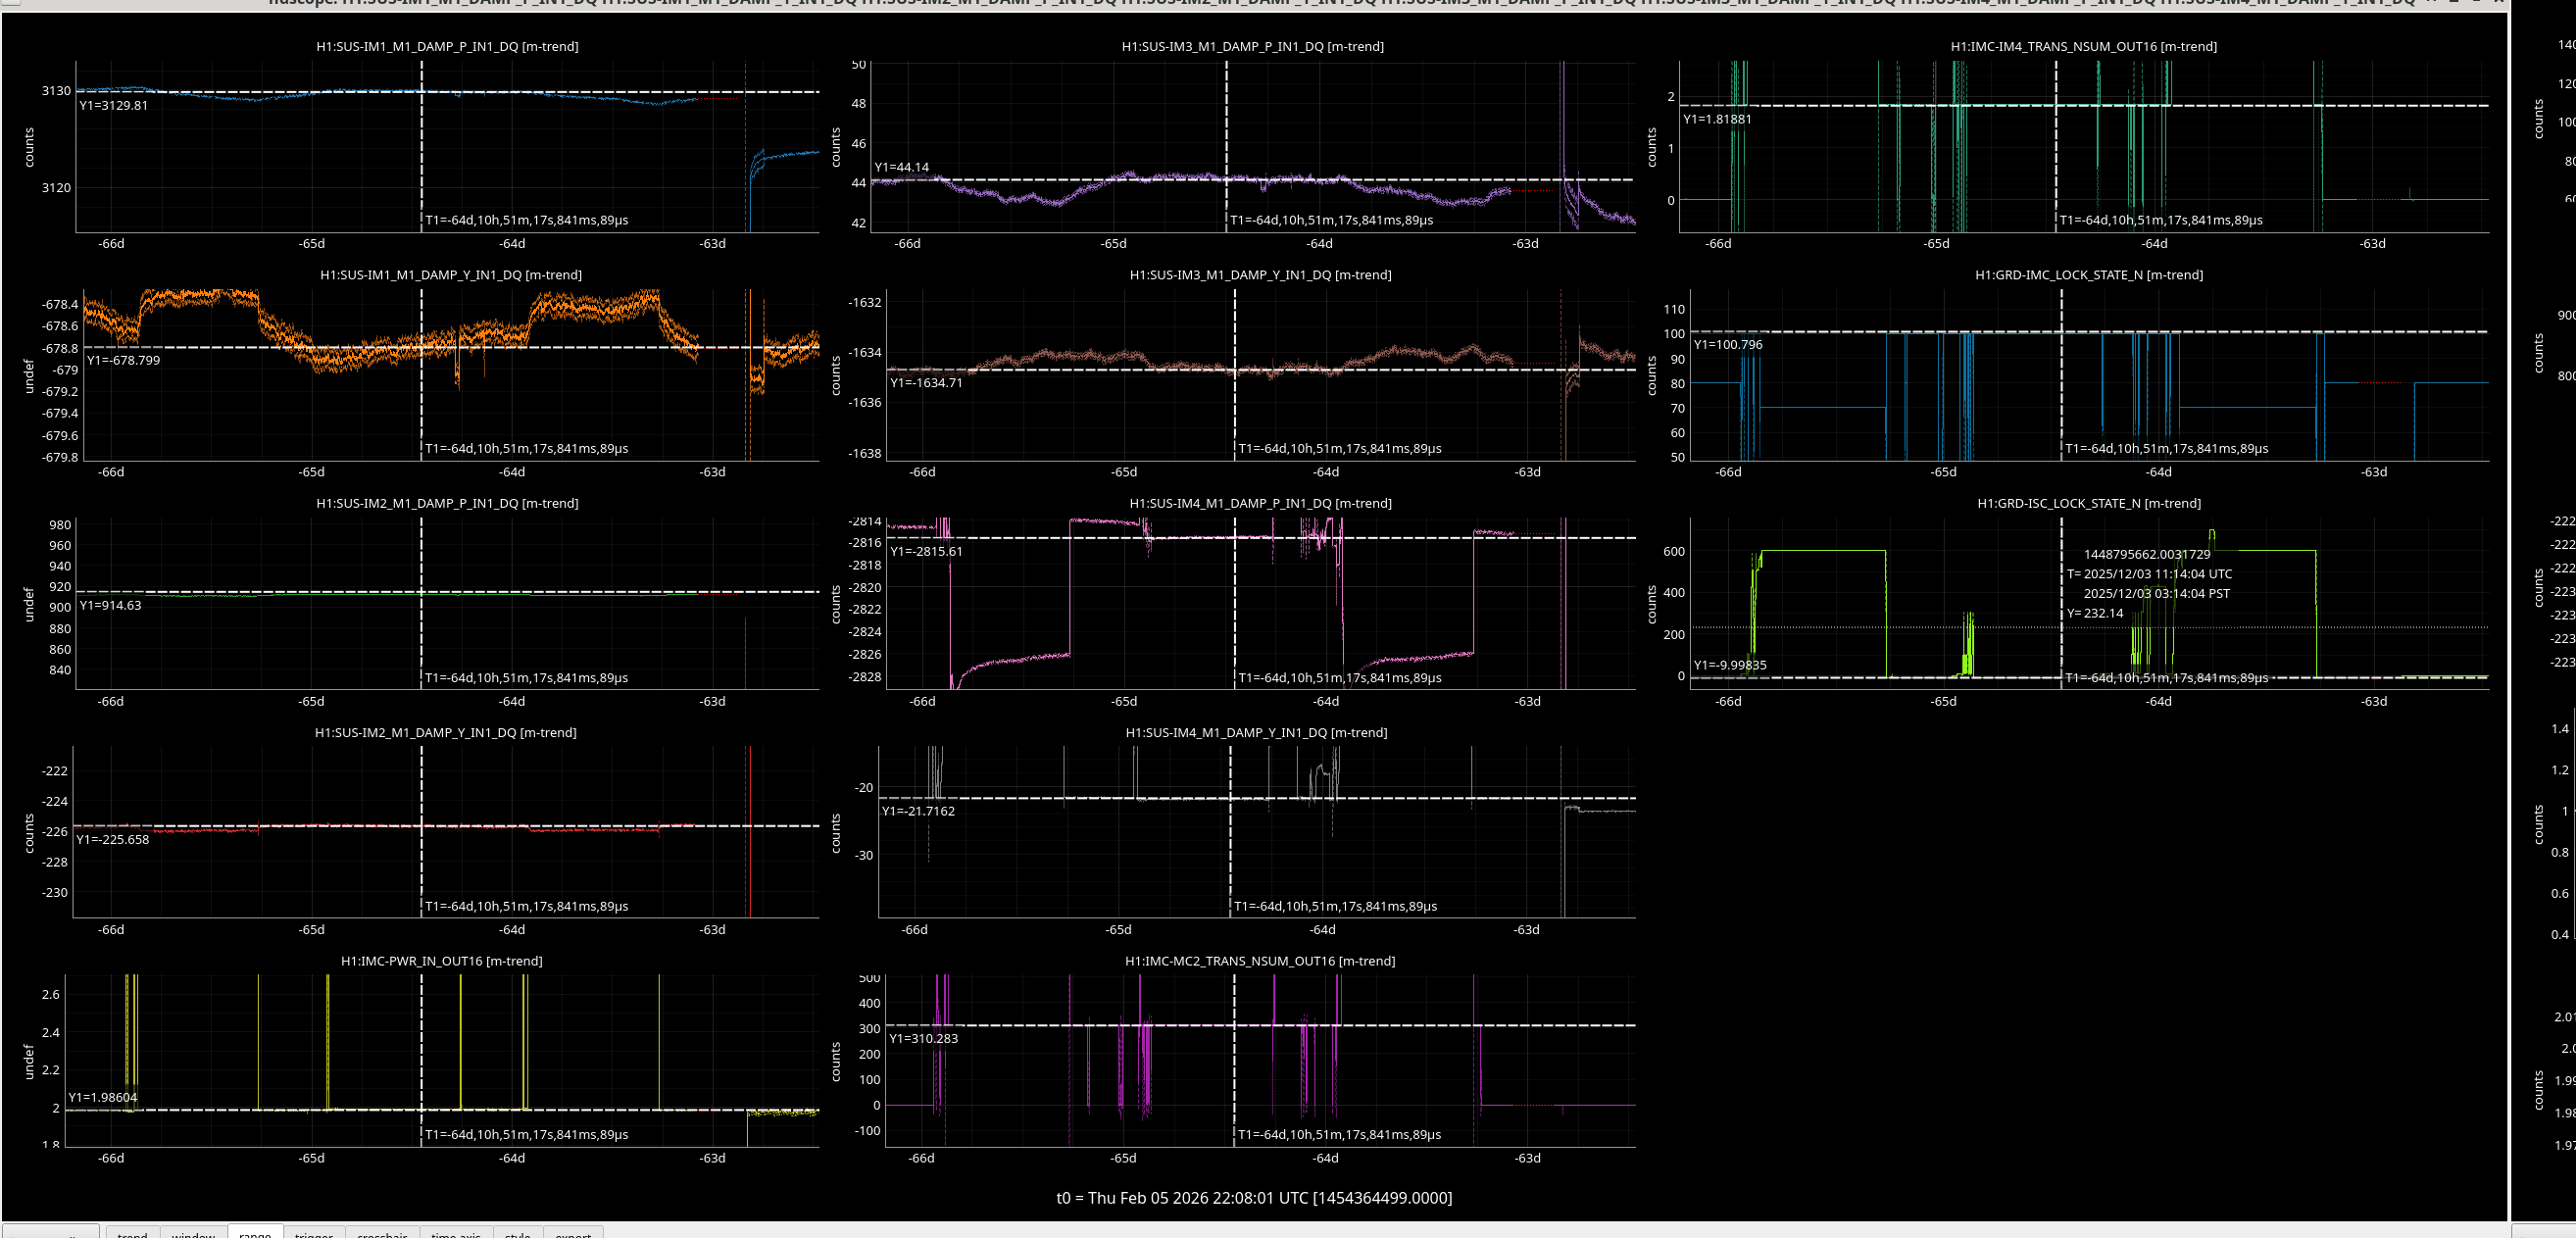
I trended the IM osems and the MC2 and IM4 QPDs in HAM2 while the mode cleaner was locked for mode scans yesterday (reference time is 2026-02-05 18:44:36 UTC).
It seem as though the MC2 and IM4 trans powers we have are lower now, but also the IM mirrors have changed.
As Sheila did yesterday I will try and summarise these changes in a table and compare whether this makes sense with the greater HAM1 loss we have because of the JAC (~40 %).
Just posting an updated version of Sheila's table to compare this new time (3rd December).
| 2025-12-03 | 2026-02-05 | ||
| seismic state | nominal | HAM1 ISI, HEPI locked, HAM2 HEPI locked. | MC mirrors should be at or close to nominal assuming table alignment didn't change much. |
| power into HAM1 H1:IMC-PWR_IN_OUT16 | 2W | 1W | |
| MC2 trans | 310 counts | 90 counts | consistent with 60% HAM1 throughput measured with a power meter (extra loss due to temporary mirror for JM3) |
|
IM4 trans nsum |
1.8W | 0.1W | should be 0.54 W so not consistent with JAC loss. |
| IM1 position P, Y | 3130, -679 | changed by -11, -0.44 | Off in pitch |
| IM2 P, Y | 915, -226 | -50, -3 | Off in both, mainly pitch. |
| IM3 P, Y | 44, -1634 | +4, -13 | Off in both, mainly yaw |
| IM4 P, Y | -2815, -22 | +64, -8 | Off in both, mainly pitch. |
So after this Sheila and I are going to try turning on the IMC ASC and working out if we can tune the alignment onto IM4-TRANS using the IMs.

Since the IMC is nicely locked, and we're only seeing 0.2 W on IM4 trans at a time when we expect ~1W, I moved the IM1, IM2, and IM3 to these positions. Still not very much on IM4_Trans.
WP13007
The rawminute trend copy to permanent archive completed 04feb2026. Today I reconfigured NDS1 to serve these data from their permanent archival location and started the deletion of the files from TW1.
NDS1 was restarted at 12:51 for the new configuration.
Deletion of last 6 months of raw minute trend files took 1hr56min. Disk usage reduced from 93% to 2%.
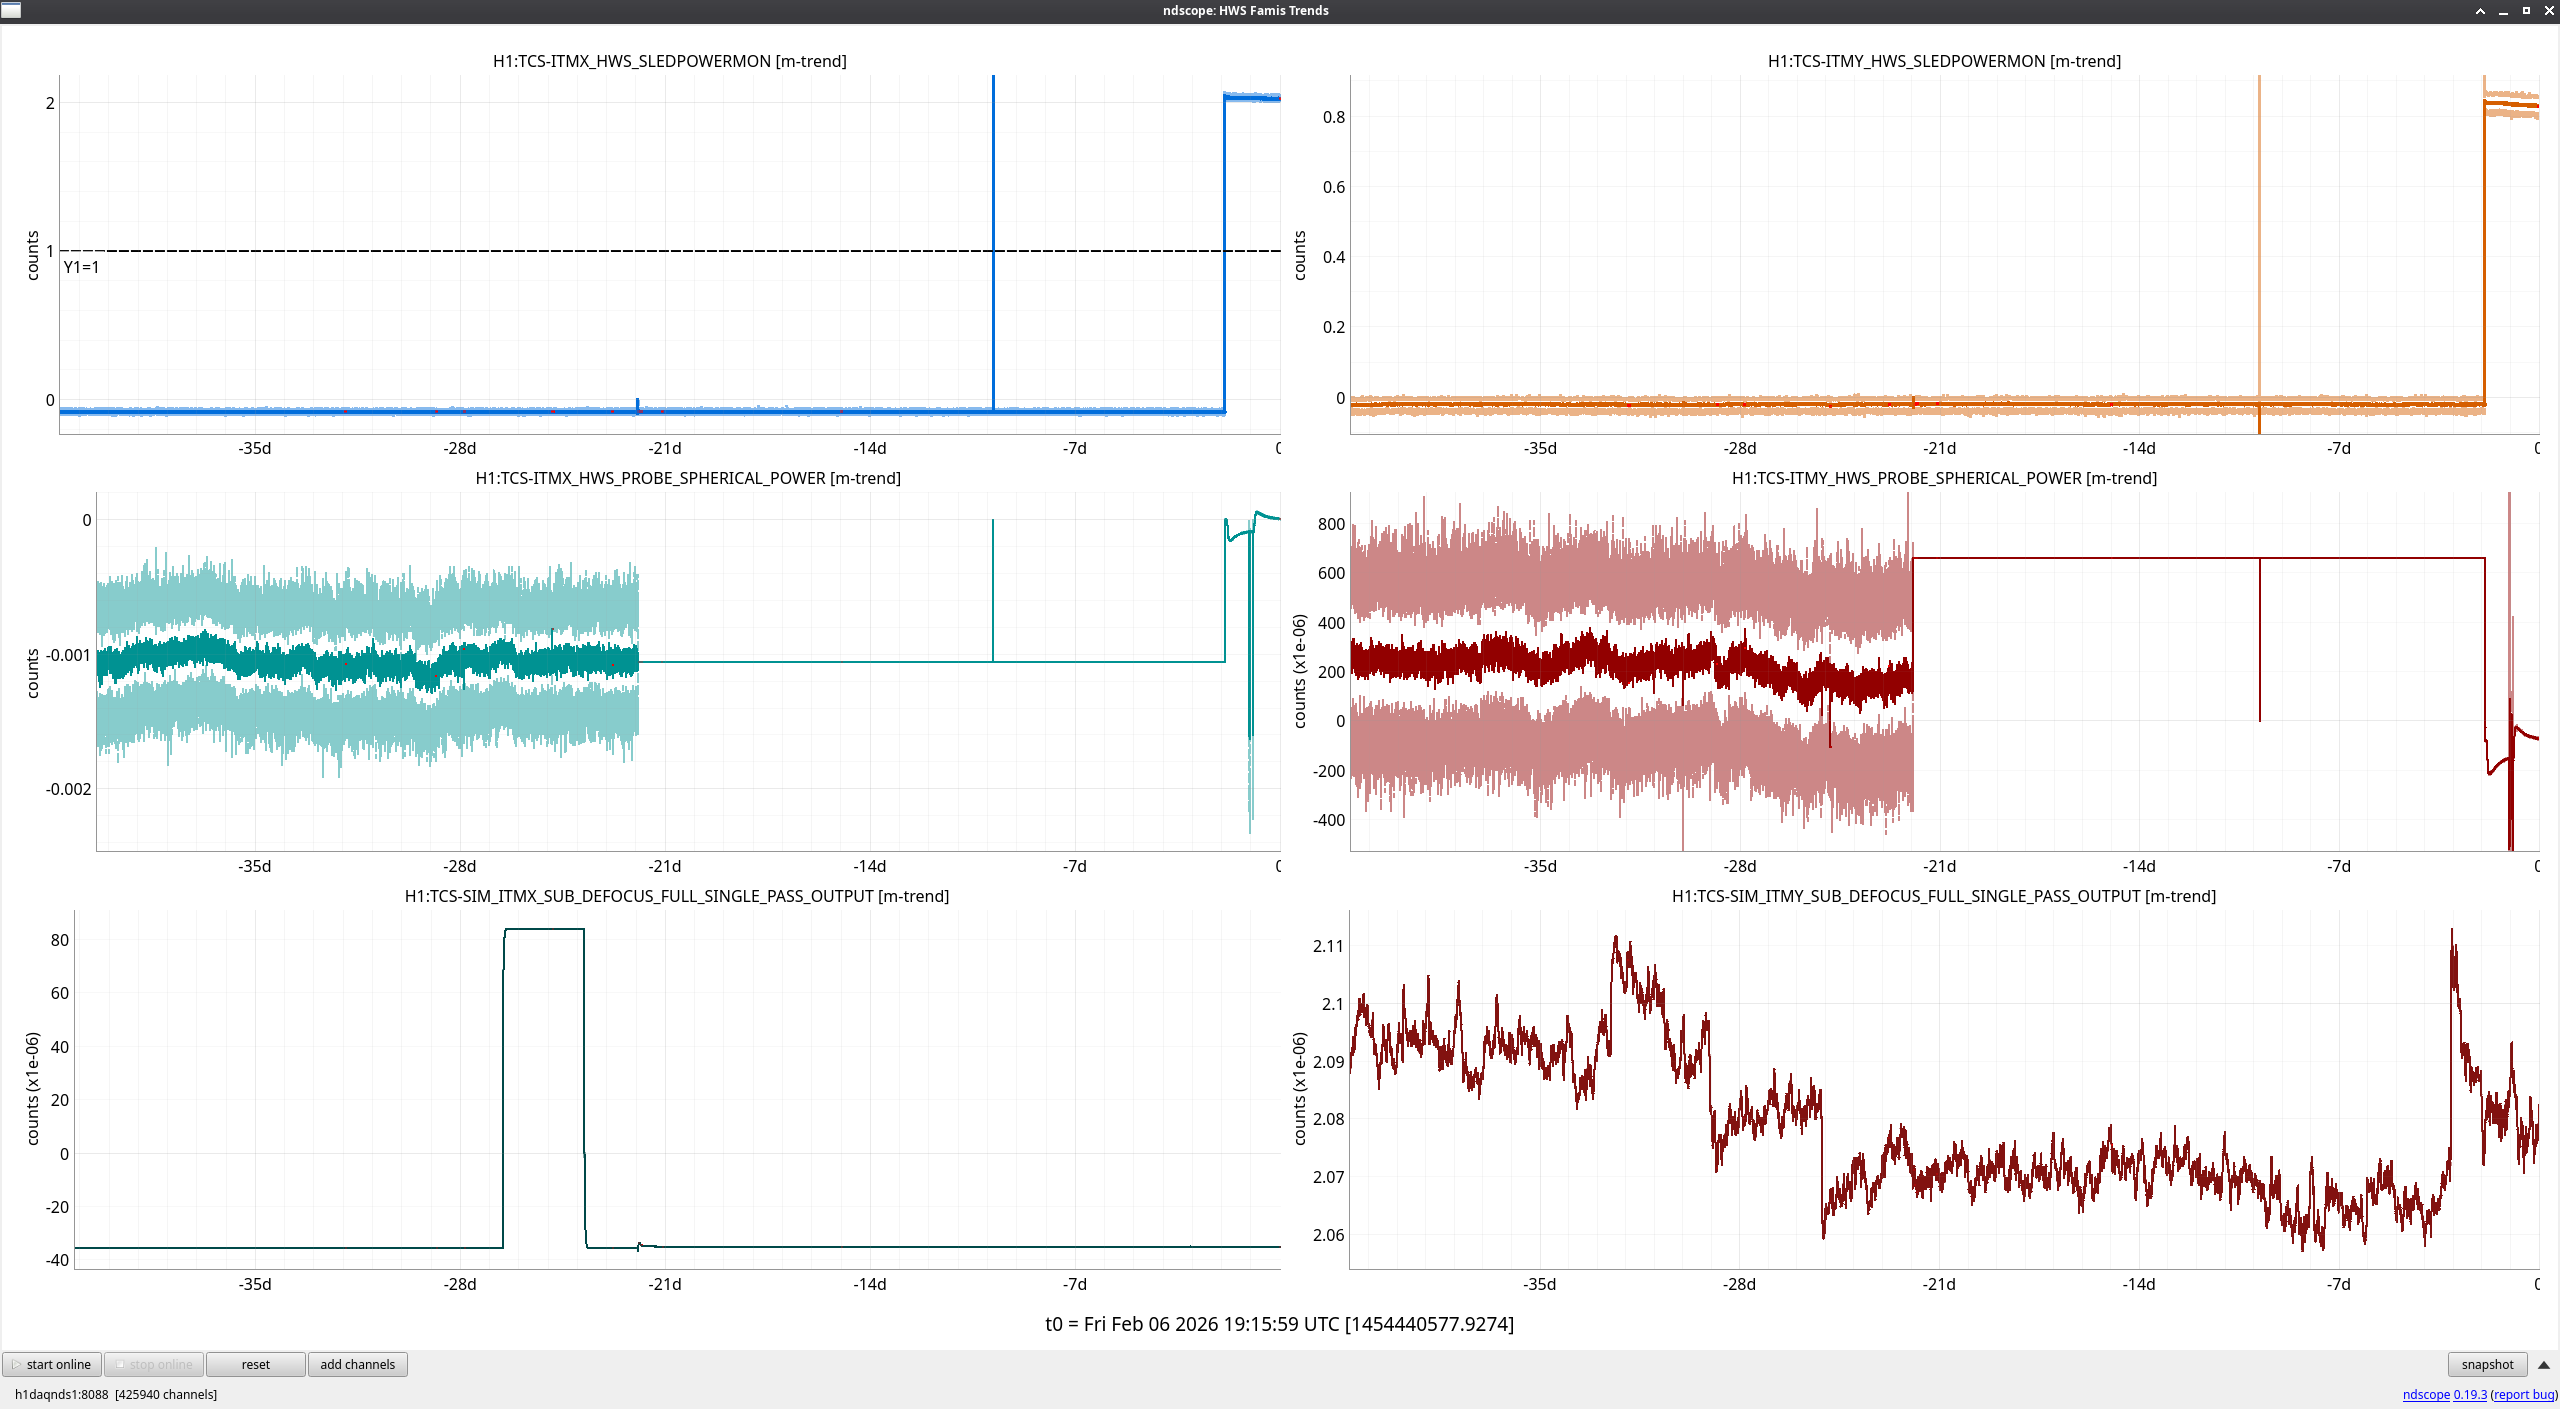
FAMIS 38837
CO2 lasers have been off for the past month for vent activities and HWS SLEDs were just turned on a few days ago, so this month's trends don't show much activity.

Fri Feb 06 10:08:33 2026 INFO: Fill completed in 8min 30secs
This is for FAMIS #39750.
Laser Status:
NPRO output power is 1.841W
AMP1 output power is 70.43W
AMP2 output power is 139.4W
NPRO watchdog is GREEN
AMP1 watchdog is GREEN
AMP2 watchdog is GREEN
PDWD watchdog is GREEN
PMC:
It has been locked 0 days, 21 hr 23 minutes
Reflected power = 27.19W
Transmitted power = 103.9W
PowerSum = 131.1W
FSS:
It has been locked for 0 days 18 hr and 54 min
TPD[V] = 0.4791V
ISS:
The diffracted power is around 4.0%
Last saturation event was 0 days 0 hours and 0 minutes ago
Possible Issues:
PMC reflected power is high
TITLE: 02/06 Day Shift: 1530-0030 UTC (0730-1630 PST), all times posted in UTC
STATE of H1: Planned Engineering
OUTGOING OPERATOR: None
CURRENT ENVIRONMENT:
SEI_ENV state: MAINTENANCE
Wind: 0mph Gusts, 0mph 3min avg
Primary useism: 0.02 μm/s
Secondary useism: 0.31 μm/s
QUICK SUMMARY:
HAM1 JAC work will continue. HAM7 is closed but pumpdown has not started yet. LVEA continues in the Bifurcated Laser Safe state.
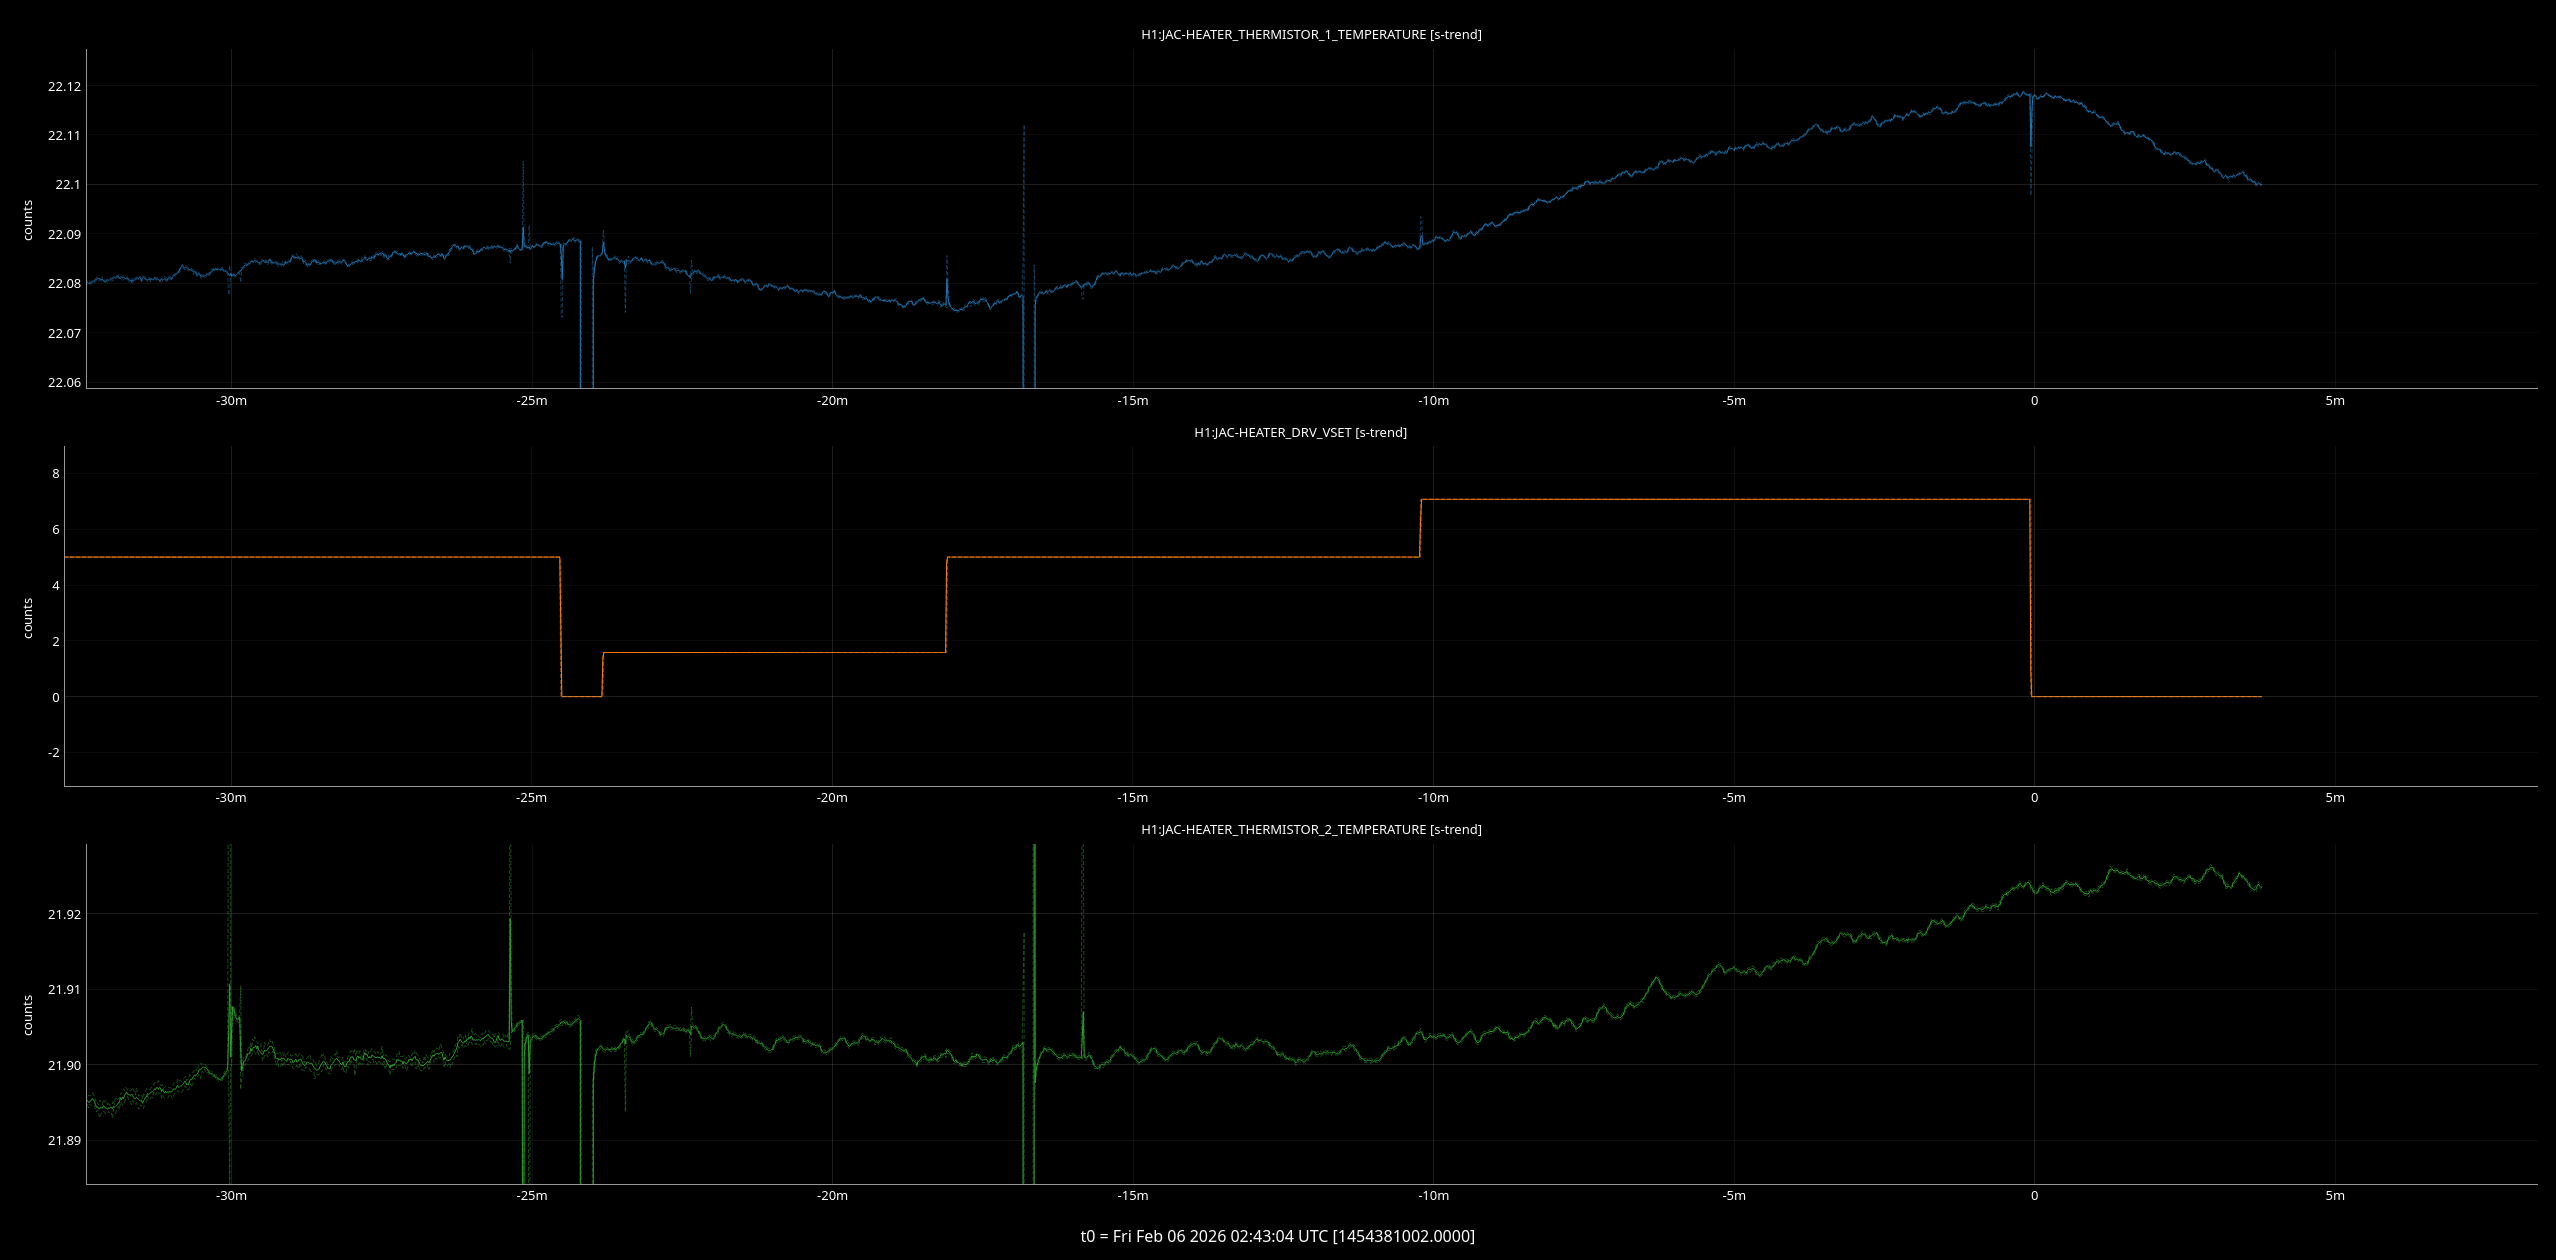
While Keita will report the detail about the heater wiring trouble shooting, here is the quick report for the JAC heater functionality.
The attatched plot shows the two thermistor signals (top/bottom) and the heater input (middle). The temperature is reasonably changing with the heater driver input.
JAC in-vac tri-cable was swapped. (Masayuki, Jennie, Jason, Keita)
The cable that failed (D2500336-V2, S2501241) was pulled out of the chamber. (In the process, one of the body mode damper crossbar had to be temporarily removed to release the cable. ) The cable was wrapped and put in a bag without further testing (yet).
Jennie and I tested the new tri-cable (D2500336-V2, S2501242) in the optics lab and it was good (i.e. every pin was connected to the pin it is supposed to be connected, no cross-wiring, no short circuits).
The new cable was installed in chamber.
I checked the in-chamber connection from the in-air side of the D4F10 feedthrough. Pin13 wasn't connected to anything, ditto for the chamber ground, thermistors showed about 11kOhm each, heaters were about 50 Ohm each, PD anode and cathode were good, no cross-wiring and no unintended short circuits.
After connecting the in-air cable to the feedthrough, PZT and Trans PD worked right away.
After connecting the heater cable to the driver chassis, we confirmed (using the breakout board and a DVM) that the voltage across the heater elements was ~1.4V when H1:JAC-HEATER_DRV_VSET~3.6[V?], H1:JAC-HEATER_DRV_VMON~1.6[V?] and H1:JAC-HEATER_DRV_IMON~-0.098[A?]. Maybe 1.4V is close enough to 1.6V (0.2V might be the voltage drop of the in-air cable?) but I don't understand the logic about VSET being 3.6V nor why IMON is negative (in my mind it seems logical if IMON~1.6V/25Ohm = 0.064A).
But it's good to know that it's doing something.
[Jason, Masayuki]
We still need to find the back reflection beam from the septum viewport, and discuss what we will do for the vertically separated beams.
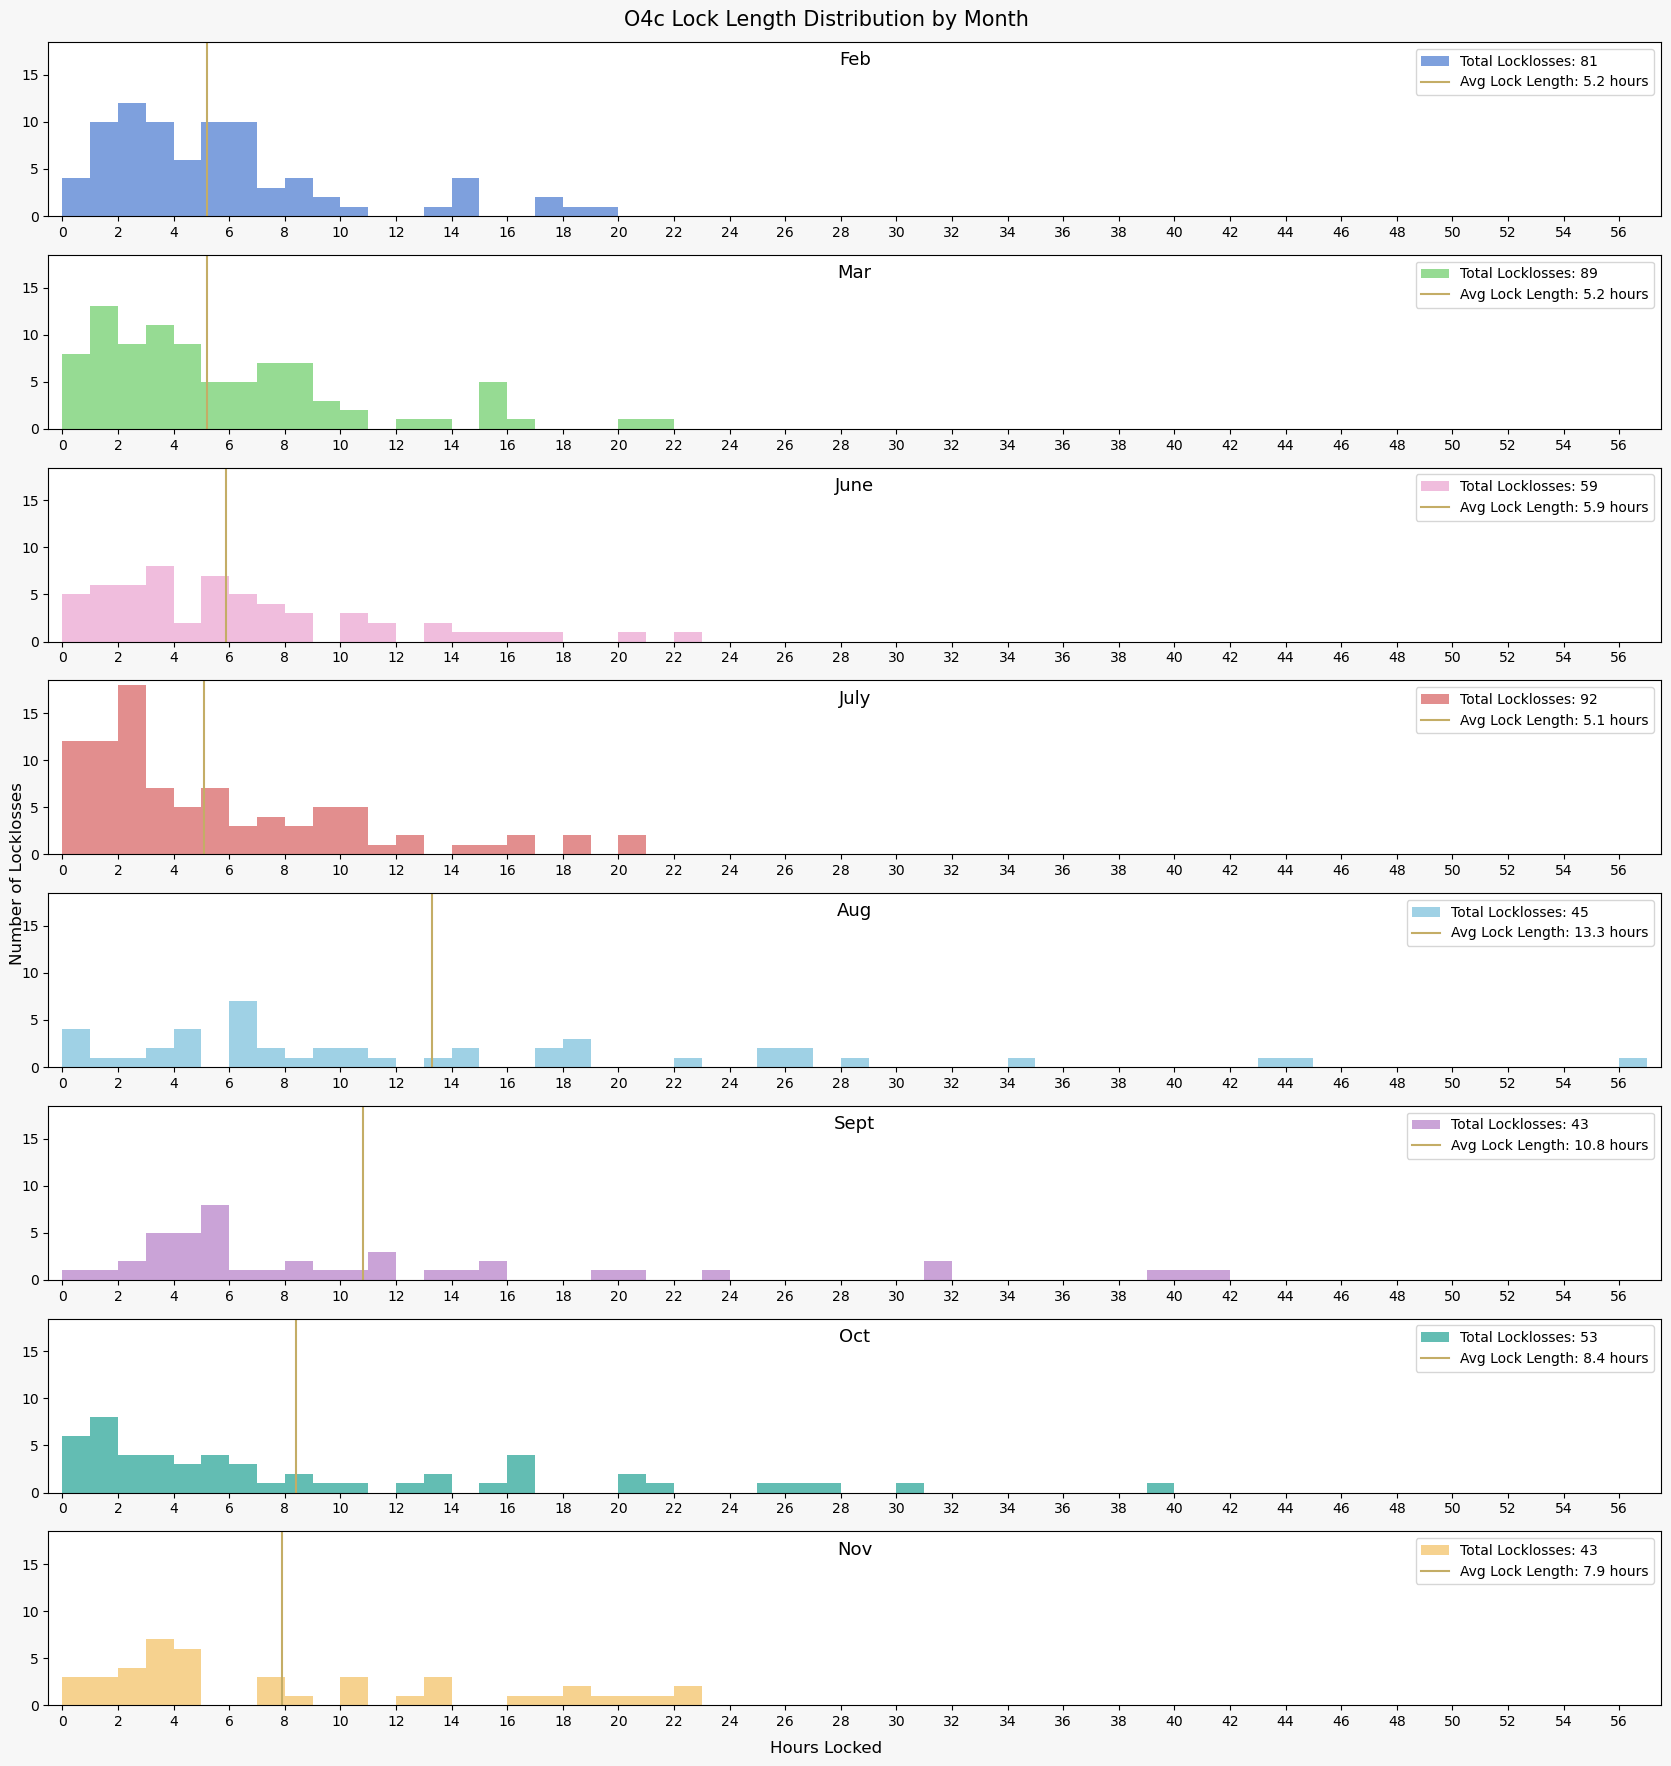
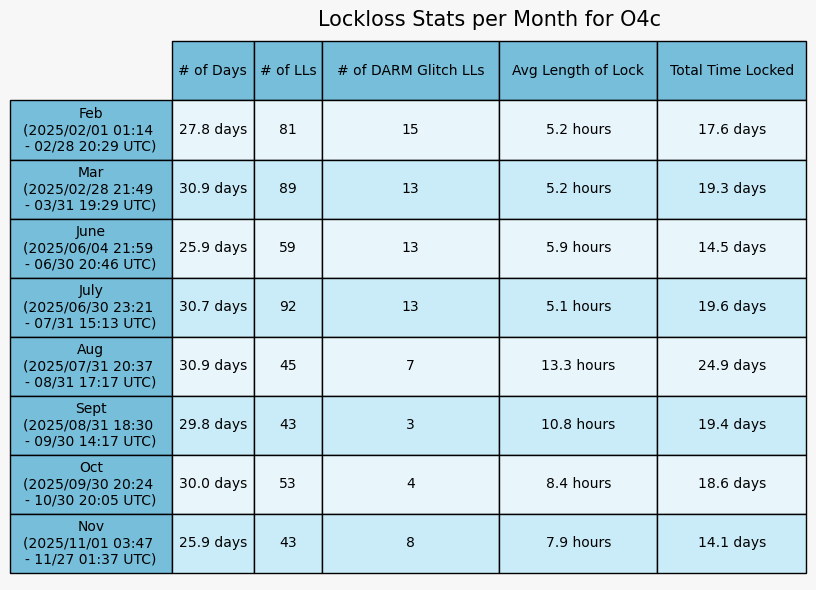
I never made updated plots for the lock duration and prevelance of the DARM glitch locklosses for the last couple months of O4c (up to Sept 1st, 2025, up to Oct 1, 2025), so here they are. The performance during October and November mostly line up with what we had been seeing in August and September following the bias change (86027).
Through October and November, the frequency of DARM glitch locklosses, and locklosses in general, was still lower than they had been before the ESD bias change. October went realy well. November wasn't the best month for ETM glitch locklosses - we had 8 locklosses due to ETM glitch during the month. That's only slightly worse than the amount we saw in August right after the bias was doubled, but during November we were locked for less time overall due to O4c ending on November 18th and PEM week not requiring us to keep the IFO locked overnight or on weekends, so that's not the best. However, we still had longer locks on average during November vs before the bias change.
O4 DARM Glitch vs All Locklosses
O4c Lock Length Distribution
O4c Lock Stats

TITLE: 02/06 Day Shift: 1530-0030 UTC (0730-1630 PST), all times posted in UTC
STATE of H1: Planned Engineering
INCOMING OPERATOR: None
SHIFT SUMMARY: Work continued in HAM1 on/around the JAC, including ghost beam hunting and fixing a shorting cable. OMC scans were also taken today at points when the IMC could be locked (manually, since the IMC_LOCK Guardian is struggling to lock the IMC itself). HAM7 sits with its doors on, but pumpdown timing is still being discussed.
LOG:
| Start Time | System | Name | Location | Lazer_Haz | Task | Time End |
|---|---|---|---|---|---|---|
| 22:49 | SAF | LVEA is Laser SAFE | LVEA | NO* | LVEA is Laser SAFE *BIFURCATED HAM1/2 | Ongoing |
| 16:03 | FAC | Kim | LVEA | N | Technical cleaning | 17:22 |
| 16:40 | FAC | Randy | LVEA | N | Cleanup in East bay | 17:09 |
| 17:11 | ISC | Sheila, Matt | LVEA | - | Opening light pipe; plugging in SR785 to IMC board | 17:38 |
| 17:53 | FAC | Randy | LVEA | N | Cleanup in East bay | 18:11 |
| 18:03 | TCS | Camilla, Sophie | Prep Lab | Local | CHETA work | 19:52 |
| 18:03 | ISC | Jason | LVEA | - | Turning up input power to 1W | 18:17 |
| 18:23 | JAC | Keita, Masayuki | LVEA | YES | JAC EOM work | 20:39 |
| 18:23 | JAC | Jennie | LVEA | YES | JAC EOM work | 18:53 |
| 18:32 | FAC | Kim | LVEA | N | Technical cleaning | 19:18 |
| 20:30 | SUS | Rahul | LVEA | - | Working on PM1 | 21:21 |
| 21:13 | ISC | Matt, Sophie | LVEA | - | Turning sidebands on | 21:17 |
| 21:17 | CAL | Tony | Pcal Lab | Local | Restarting voltmeters | 21:28 |
| 21:21 | VAC | Travis | LVEA | - | Taking picture of HAM3 | 21:25 |
| 21:36 | JAC | Keita, Jennie | Opt Lab | N | JAC cable work | 23:25 |
| 21:37 | JAC | Masayuki, Jason | LVEA | YES | JAC EOM work | Ongoing |
| 21:53 | CAL | Tony | PCal Lab | Local | Closing shutter | 21:58 |
| 21:59 | CDS | Dave | MER | N | Scouting rack install | 23:18 |
| 22:18 | VAC | Travis | LVEA | N | Grabbing parts | 22:23 |
| 22:25 | SEI | Jim | LVEA | N | Looking at feedthrus on HAM3 | 23:25 |
| 23:13 | ISC | Matt | LVEA | - | Unplugging SR785 | 23:16 |
| 23:25 | JAC | Keita, Jennie | LVEA | YES | JAC work | Ongoing |
| 23:51 | CDS | Dave | CER | N | Scouting rack install | 00:12 |
| 00:23 | CDS | Fil, Marc | LVEA | N | Measuring cables | Ongoing |