Summary:
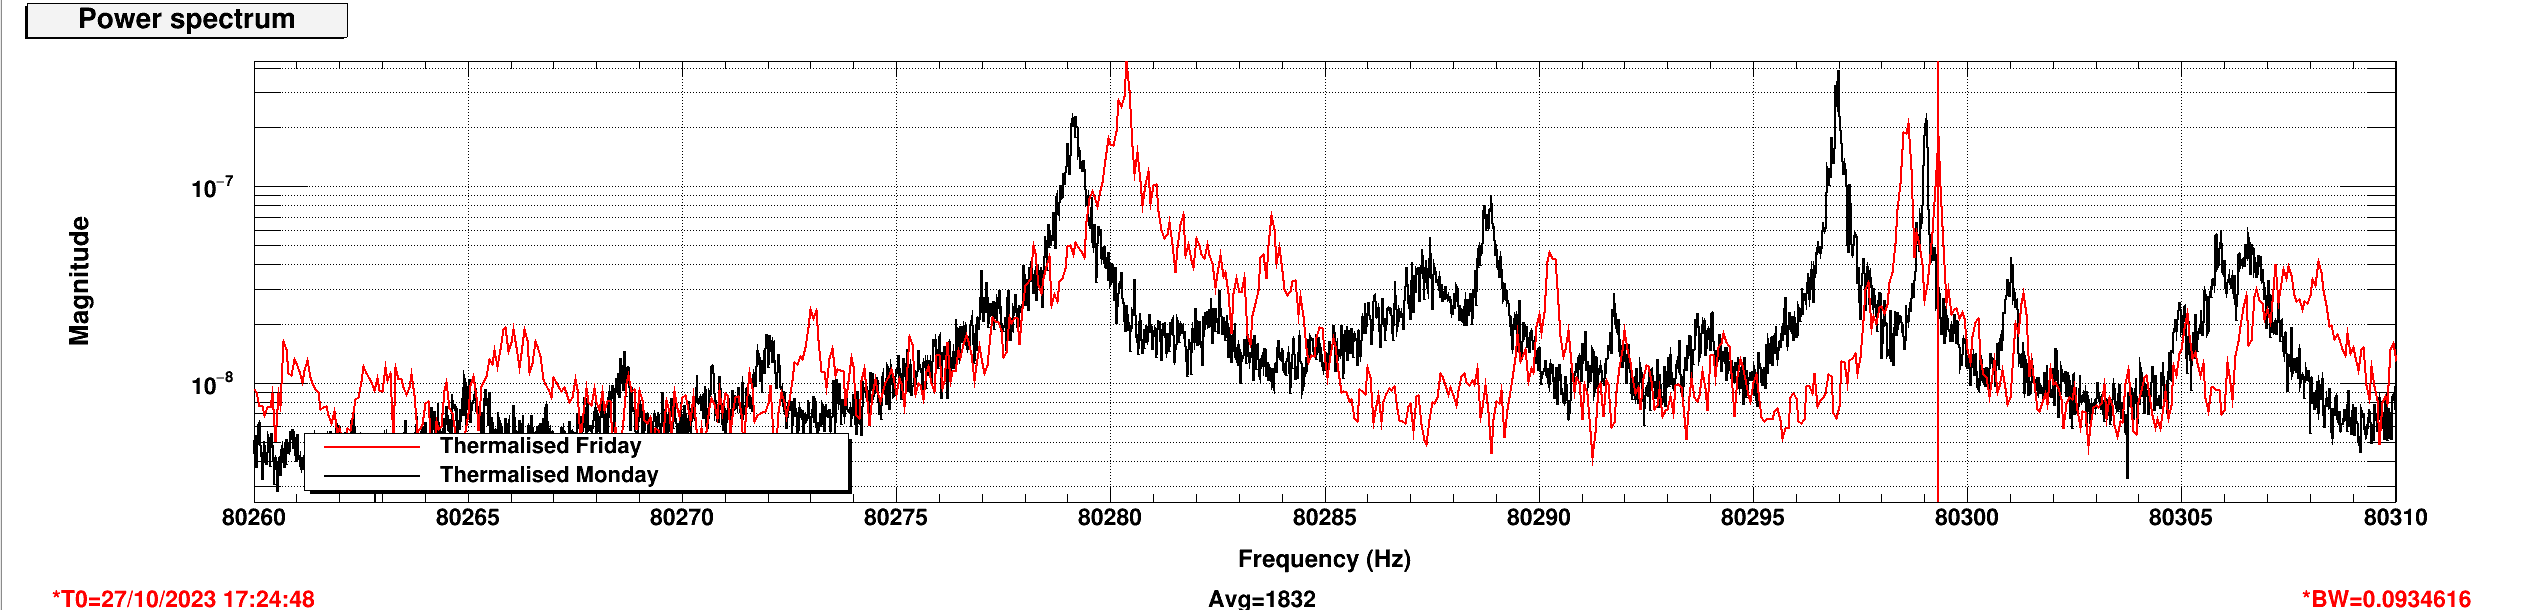
It seems that the supply voltage for thermistors is oscillating, the frequency depends on whether or not the supply is loaded with thermistors (830mHz open to 1.66Hz fully connected to the in-chamber thermistors), the amplitude of the oscillation jumps seemingly randomly, and this is also happening for the unused Beckhoff module for the yet-to-be-installed second T-SAMS unit, all measured at the back of the Beckhoff chassis. (Can't we measure this from Beckhoff itself, without me going to the floor?)
Fil and Fernando quickly set up the same Beckhoff module in the lab and didn't observe this. Could we swap or maybe restart the modules in the chassis?
As of now, Beckhoff cable is disconnected from the back of the heater driver chassis. (I'm applying DetChar-Request tag just so people know, but we're just changing from one no-comb configuration to the other.)
Detaisls:
Since the past findings about OM2 and 1.66Hz comb (alogs 73367, 73233, 72967 72241 and 72061) didn't make sense, I went to the floor and remeasured the comb in the Beckhoff heater output (which goes to the heater driver input) as well as thermistor pins in the back of the heater driver chassis while Beckhoff connection was intact.
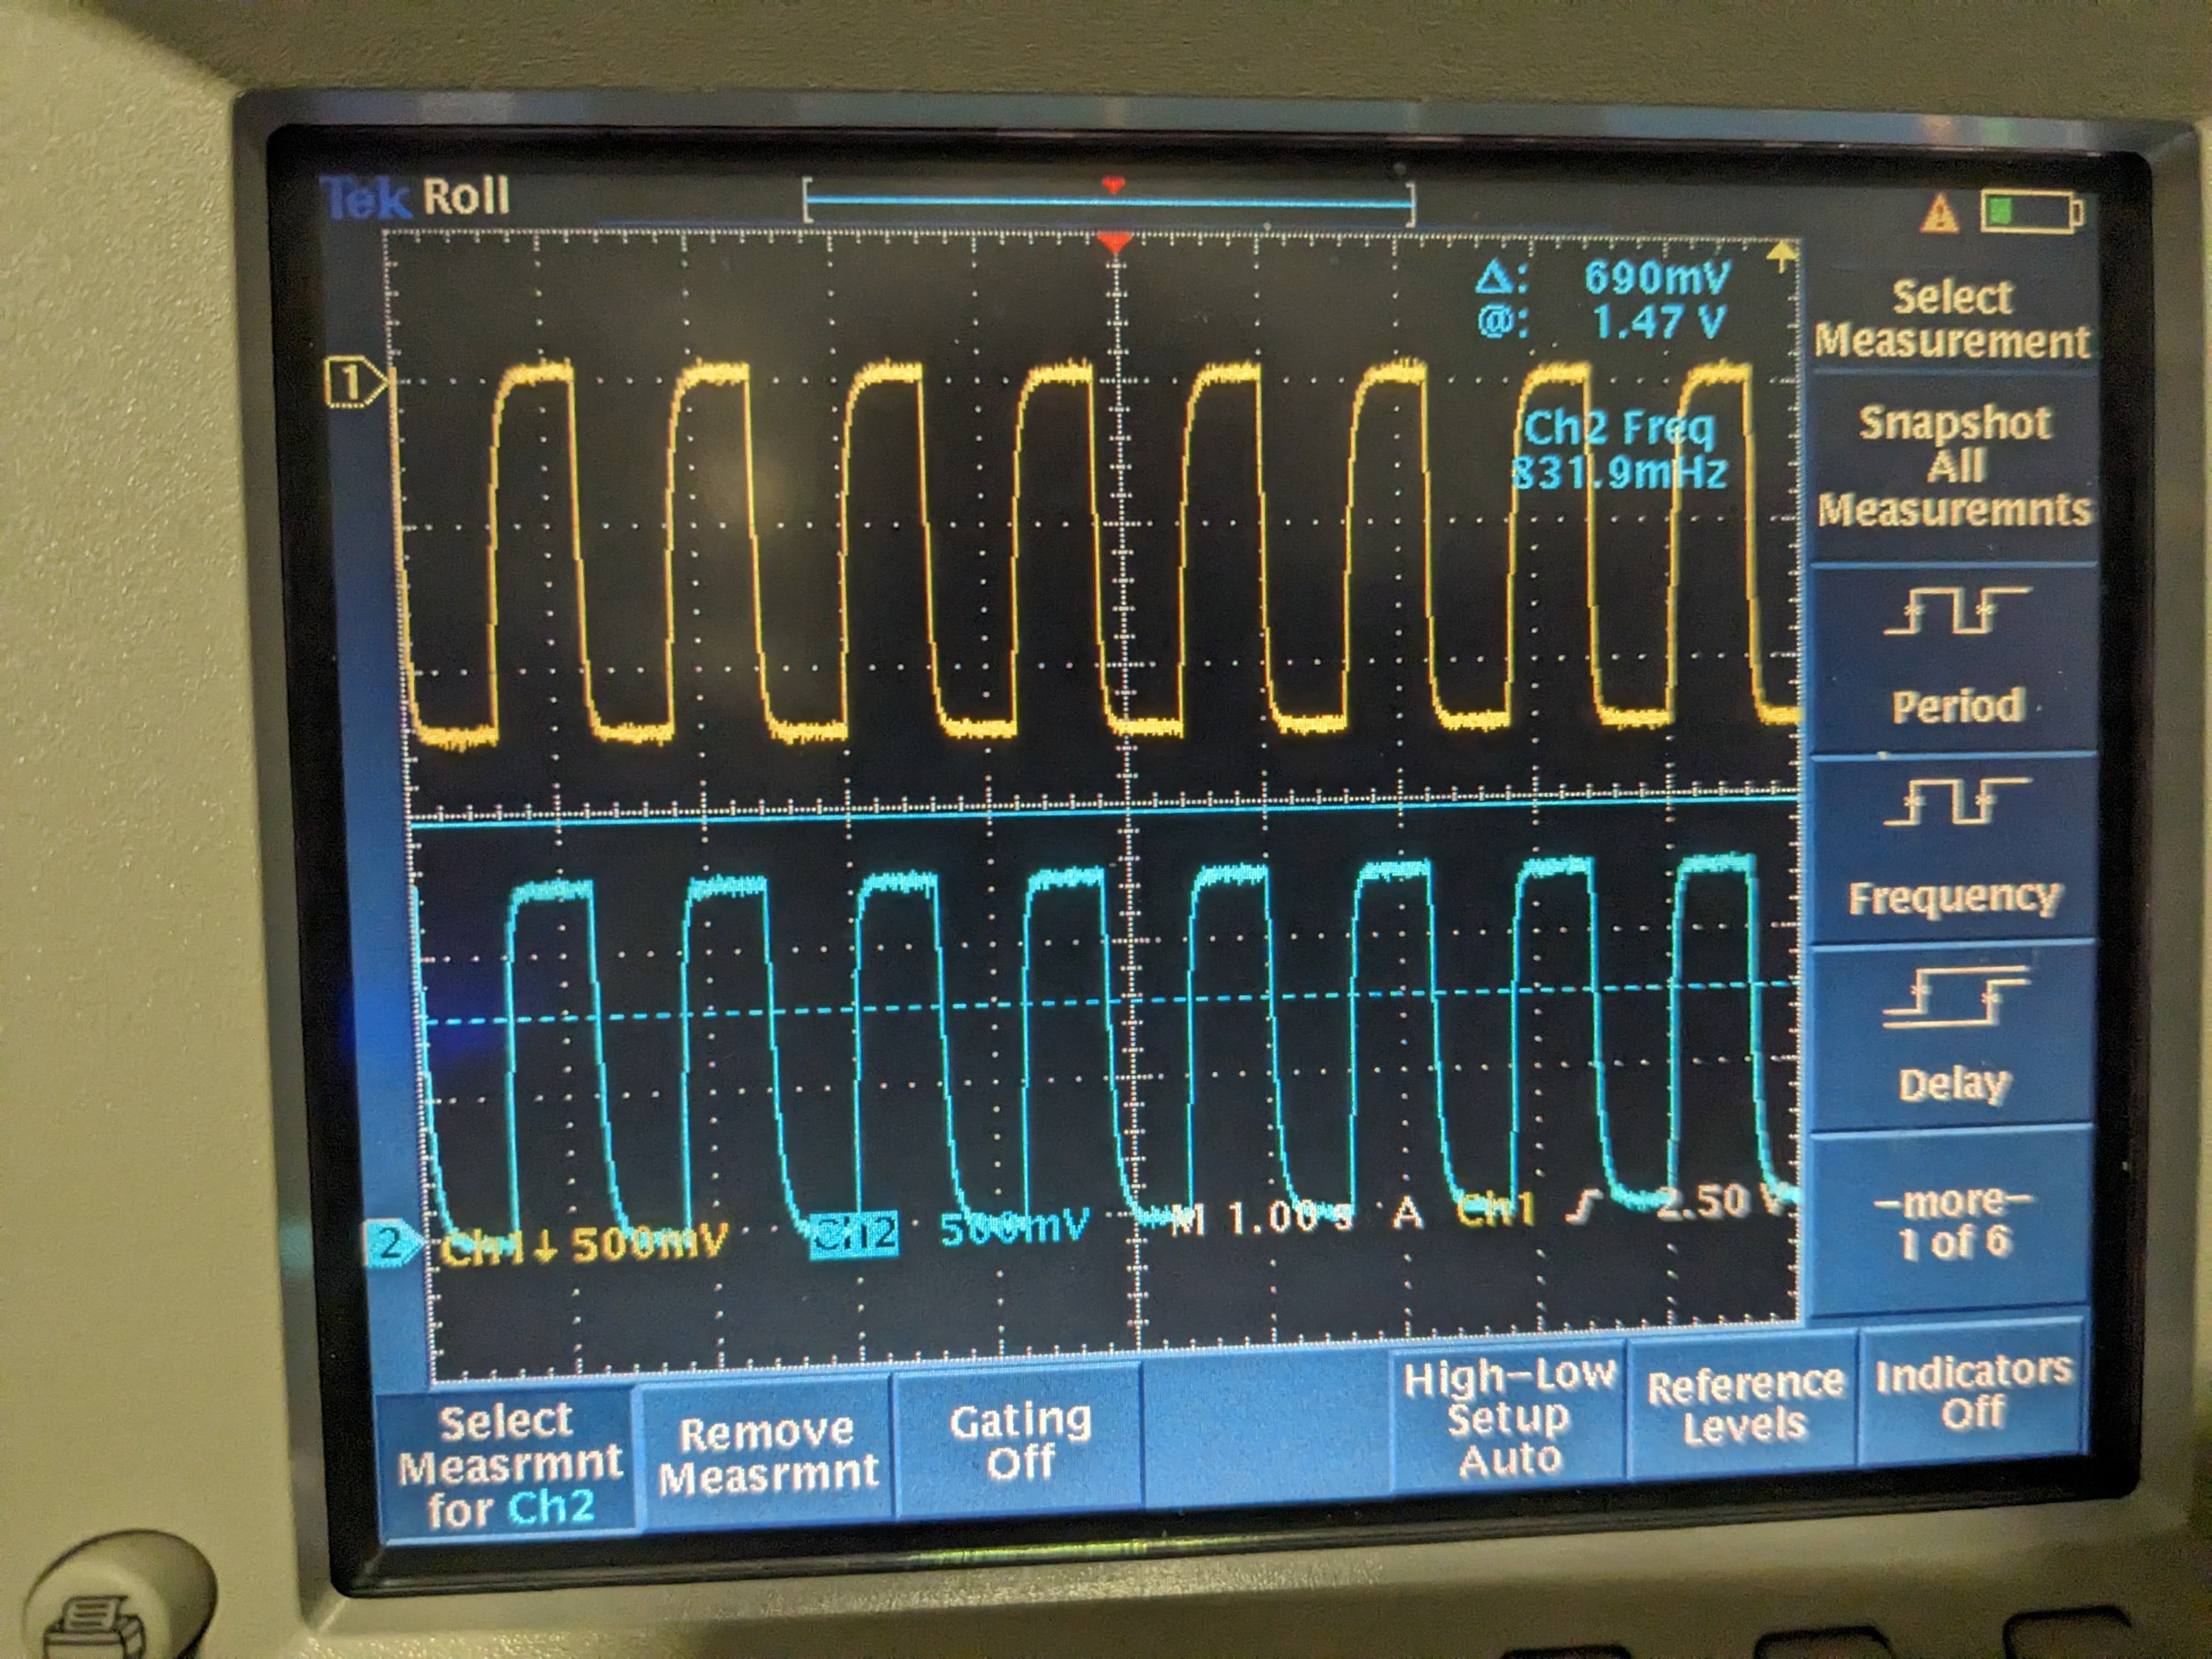
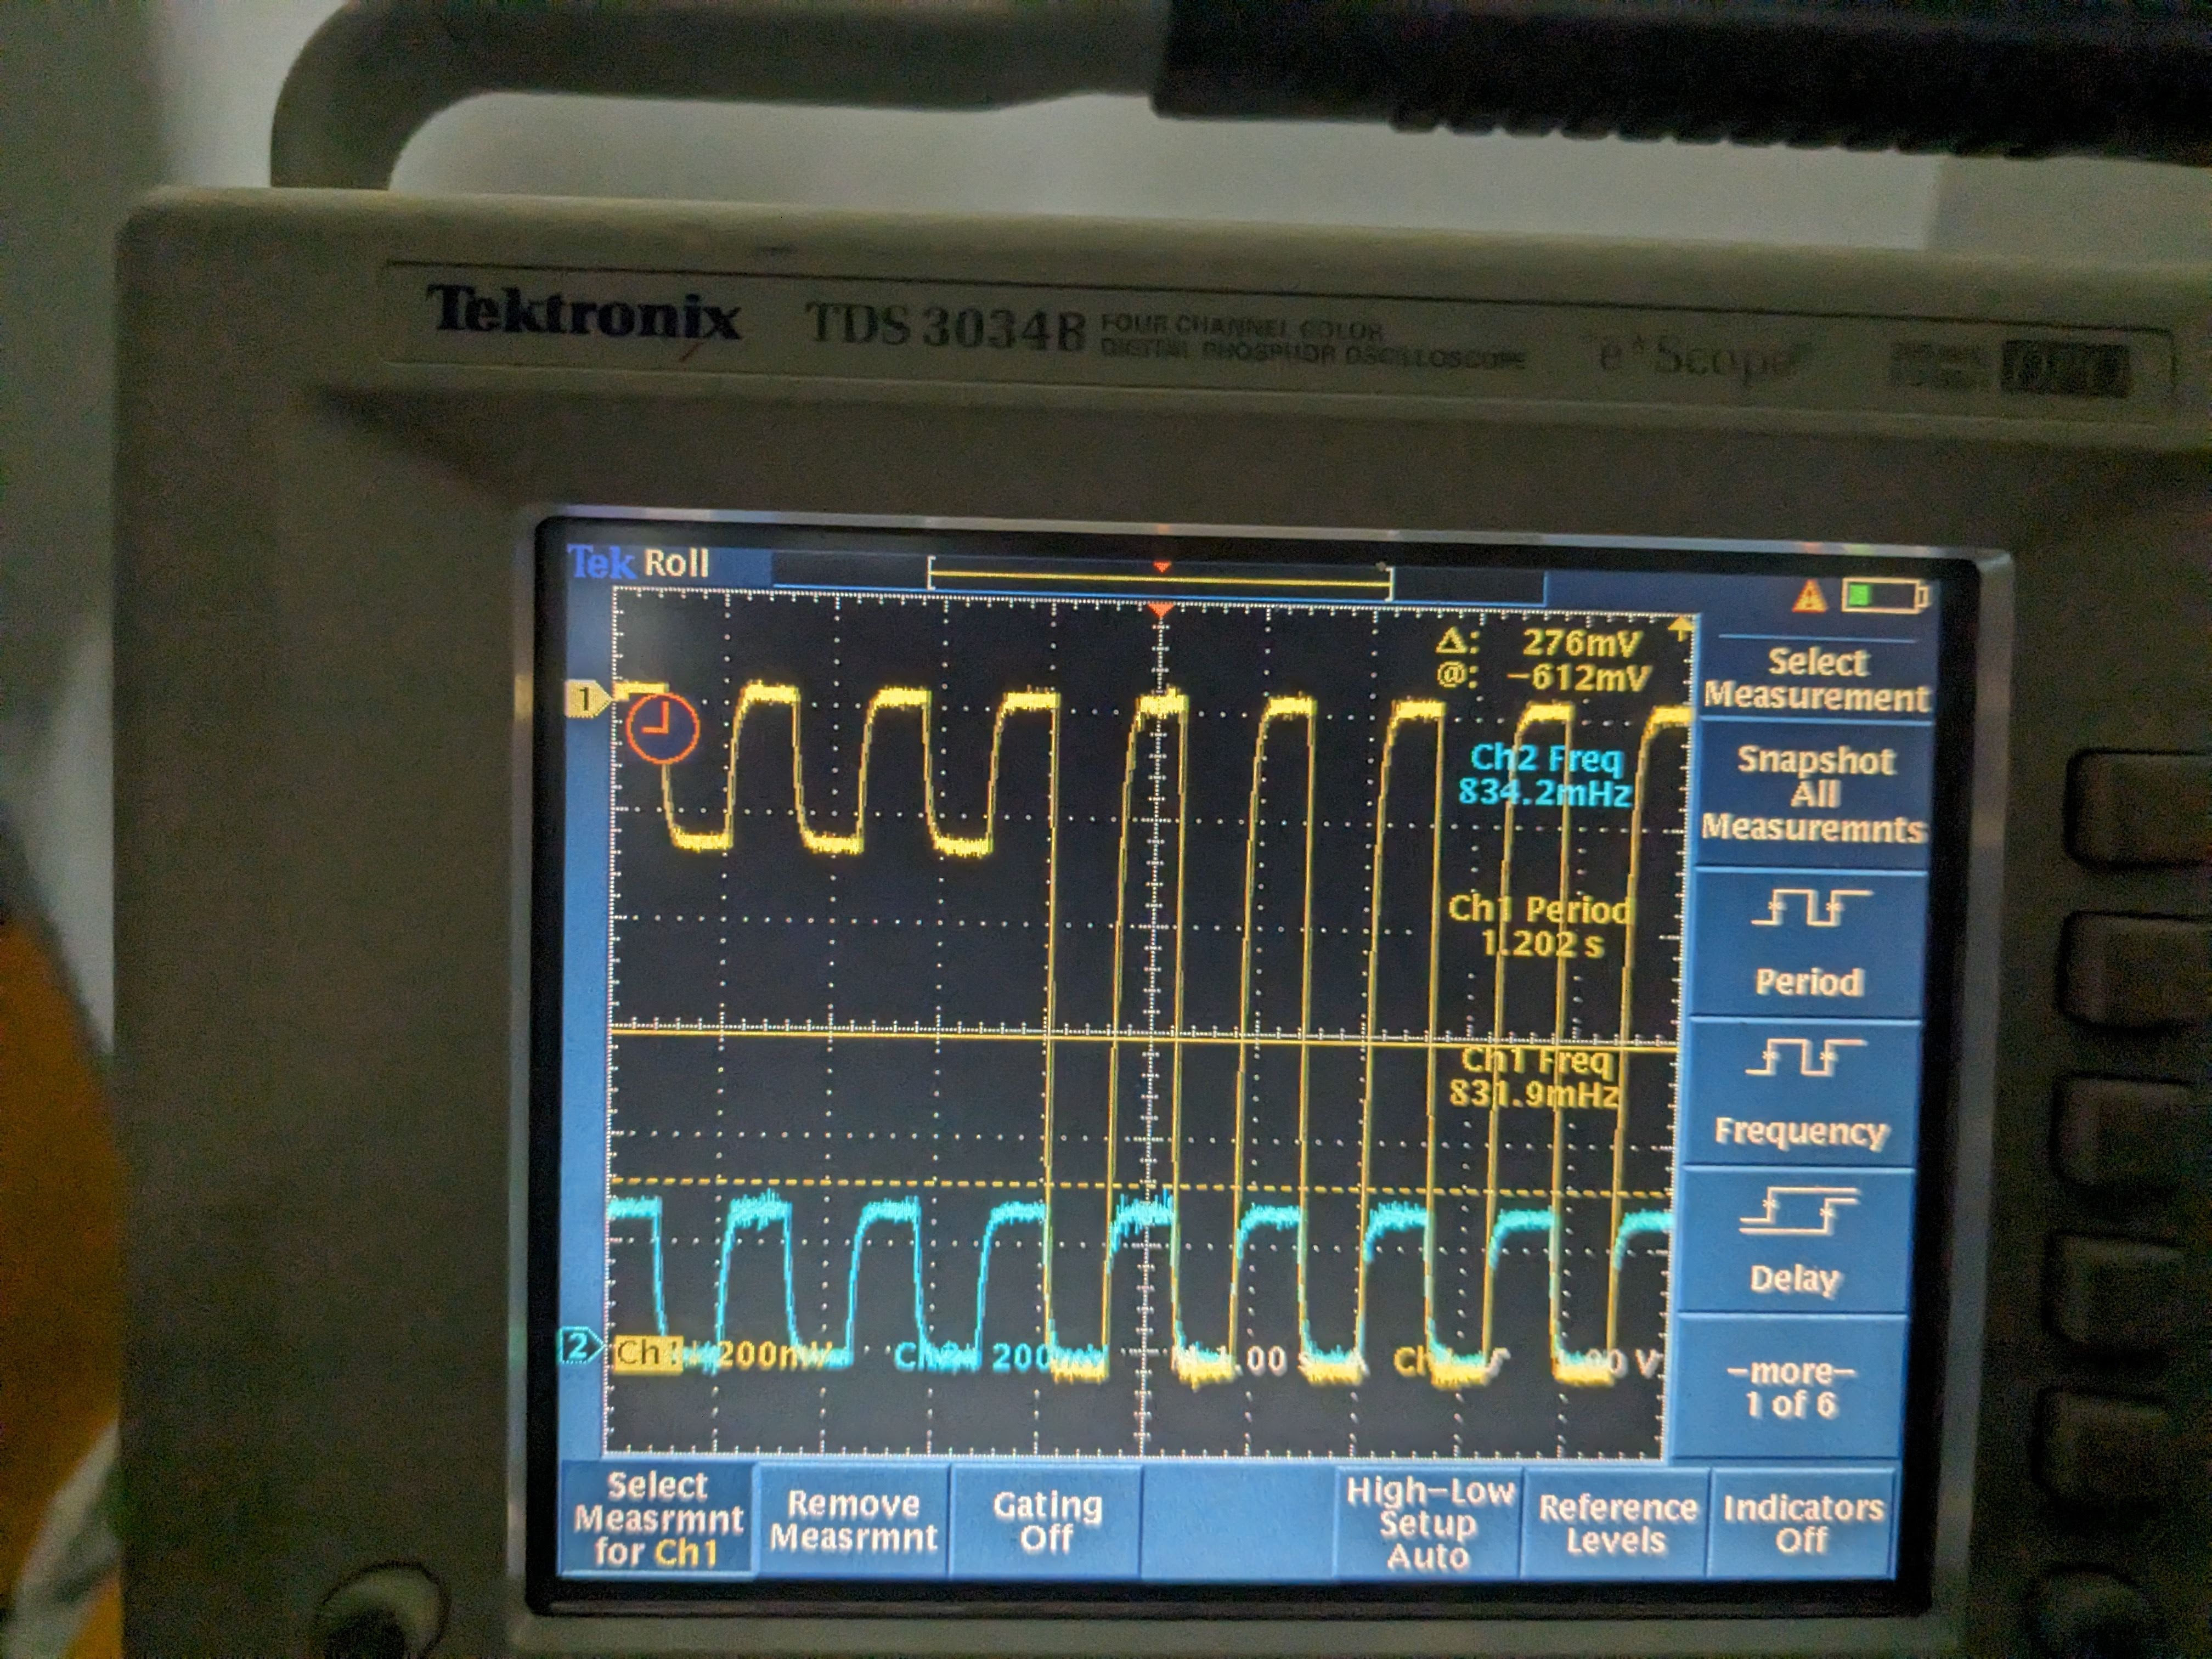
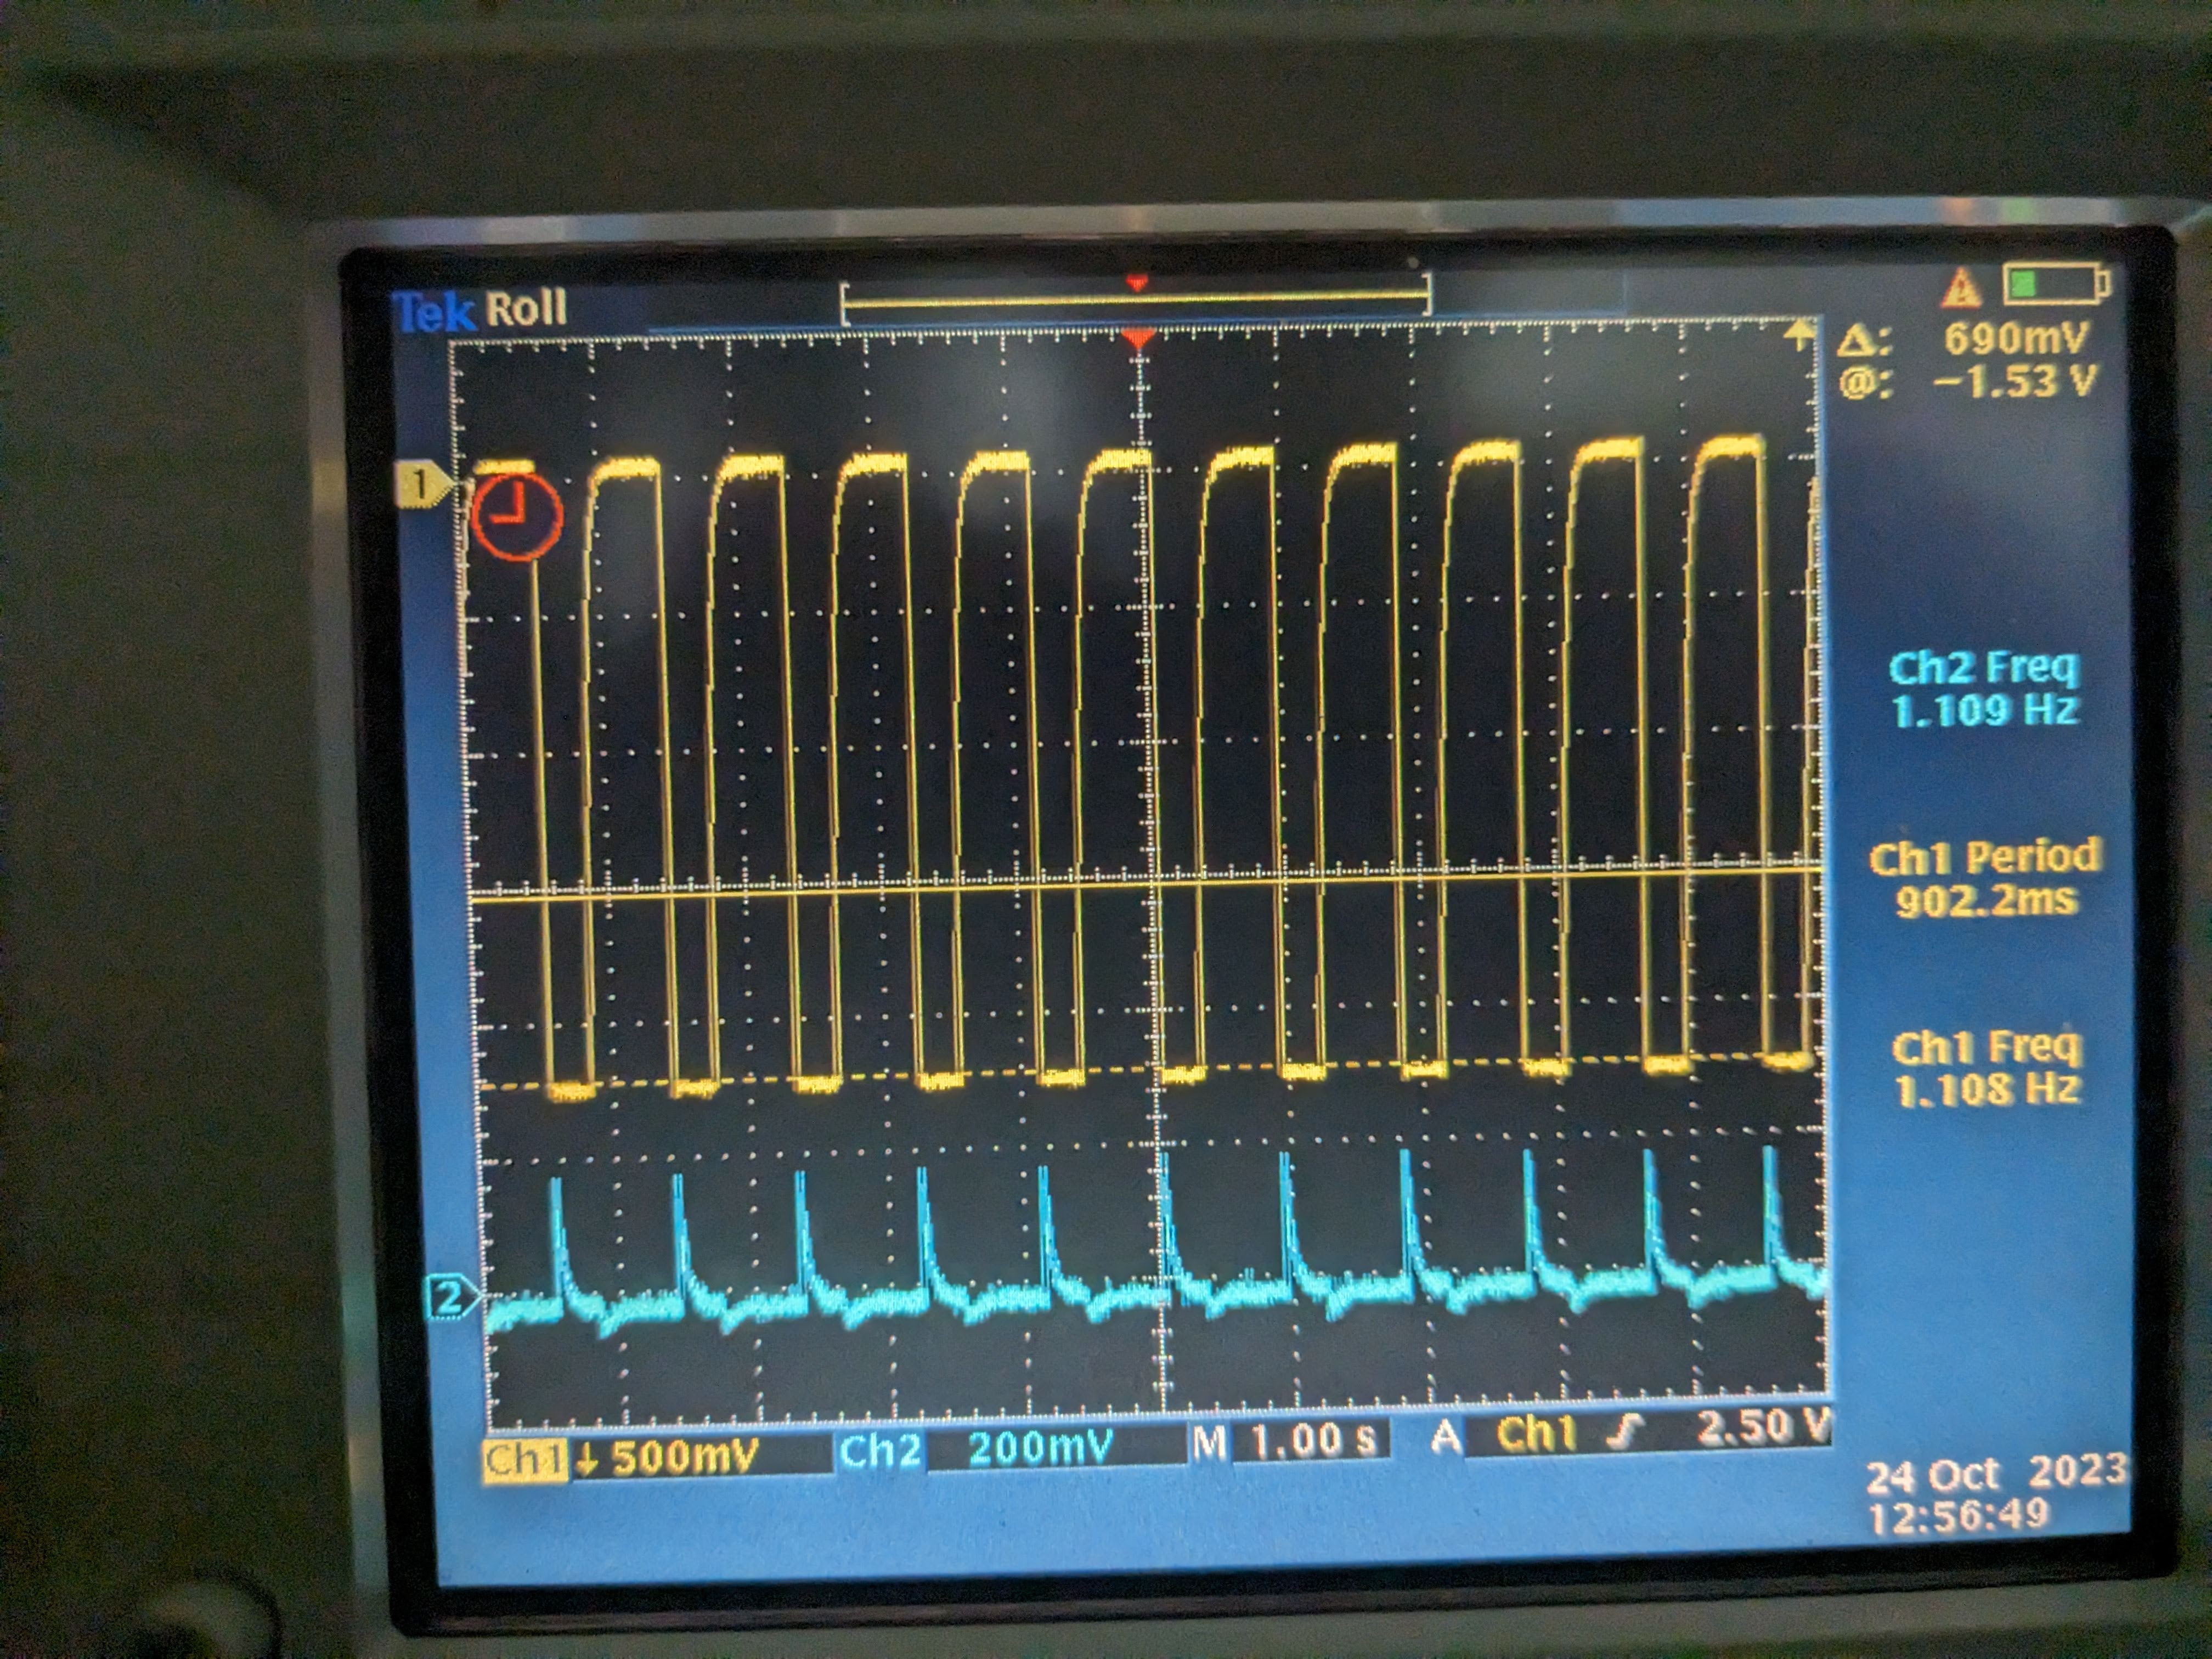
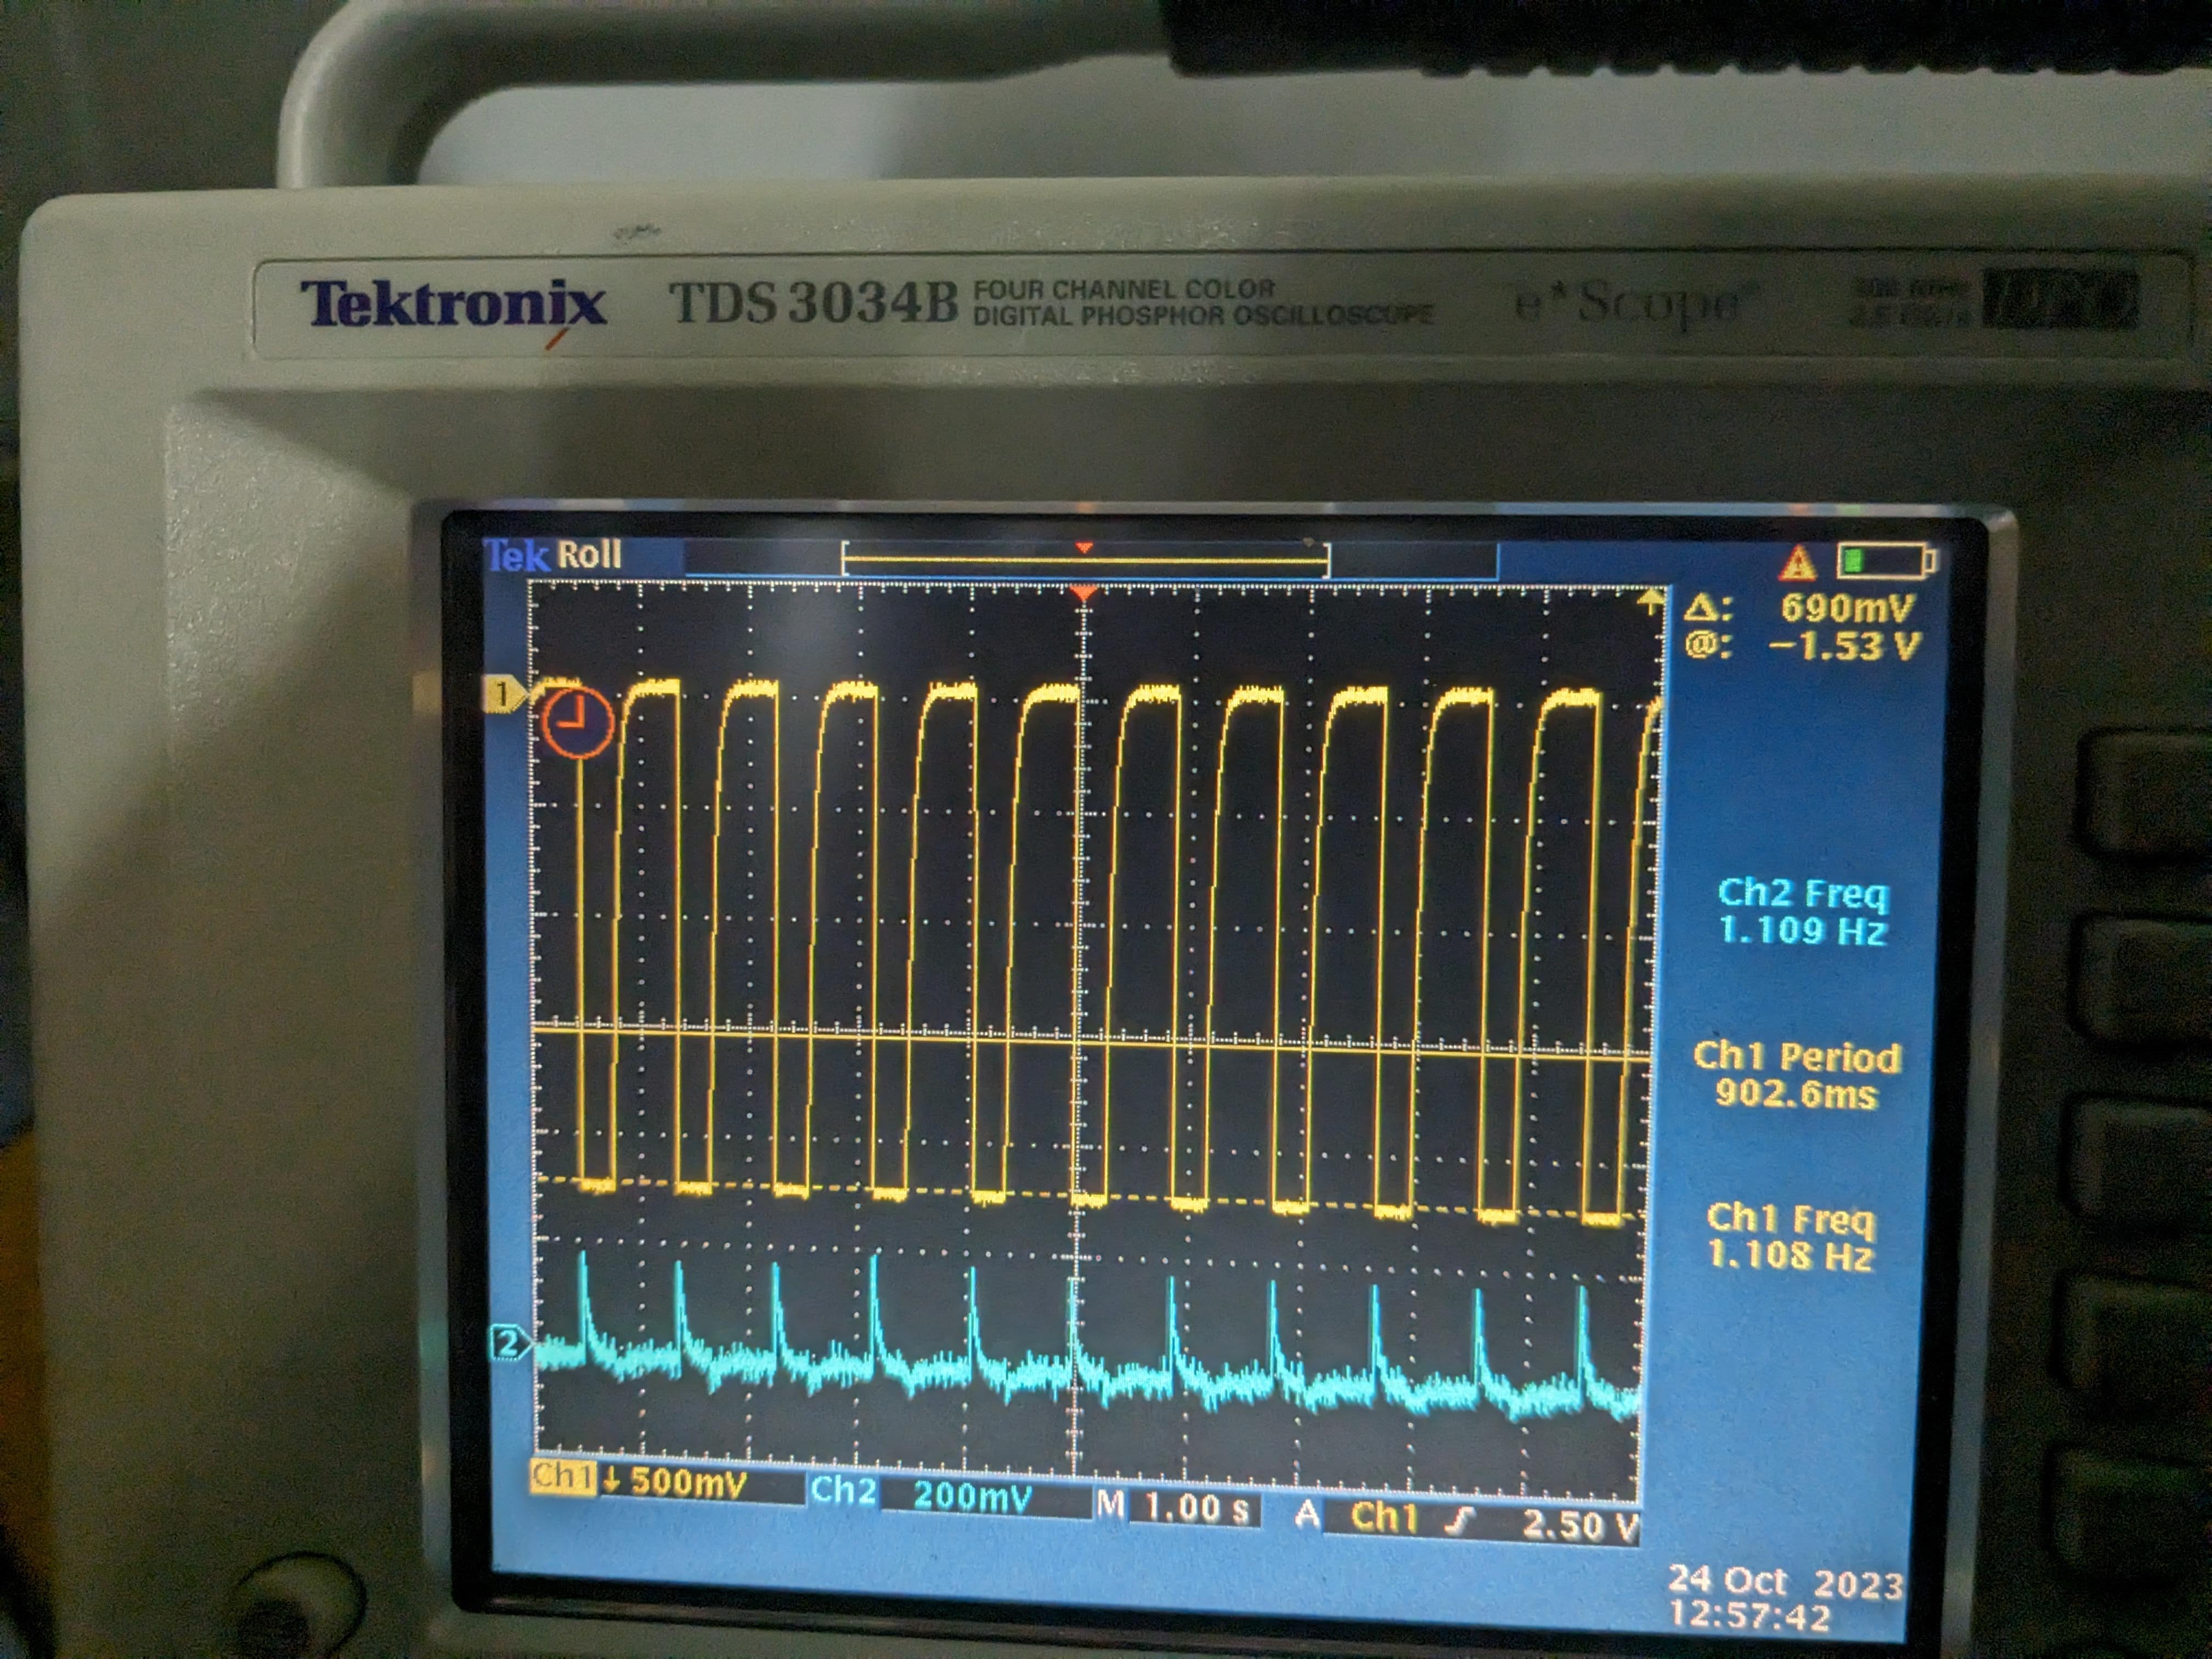
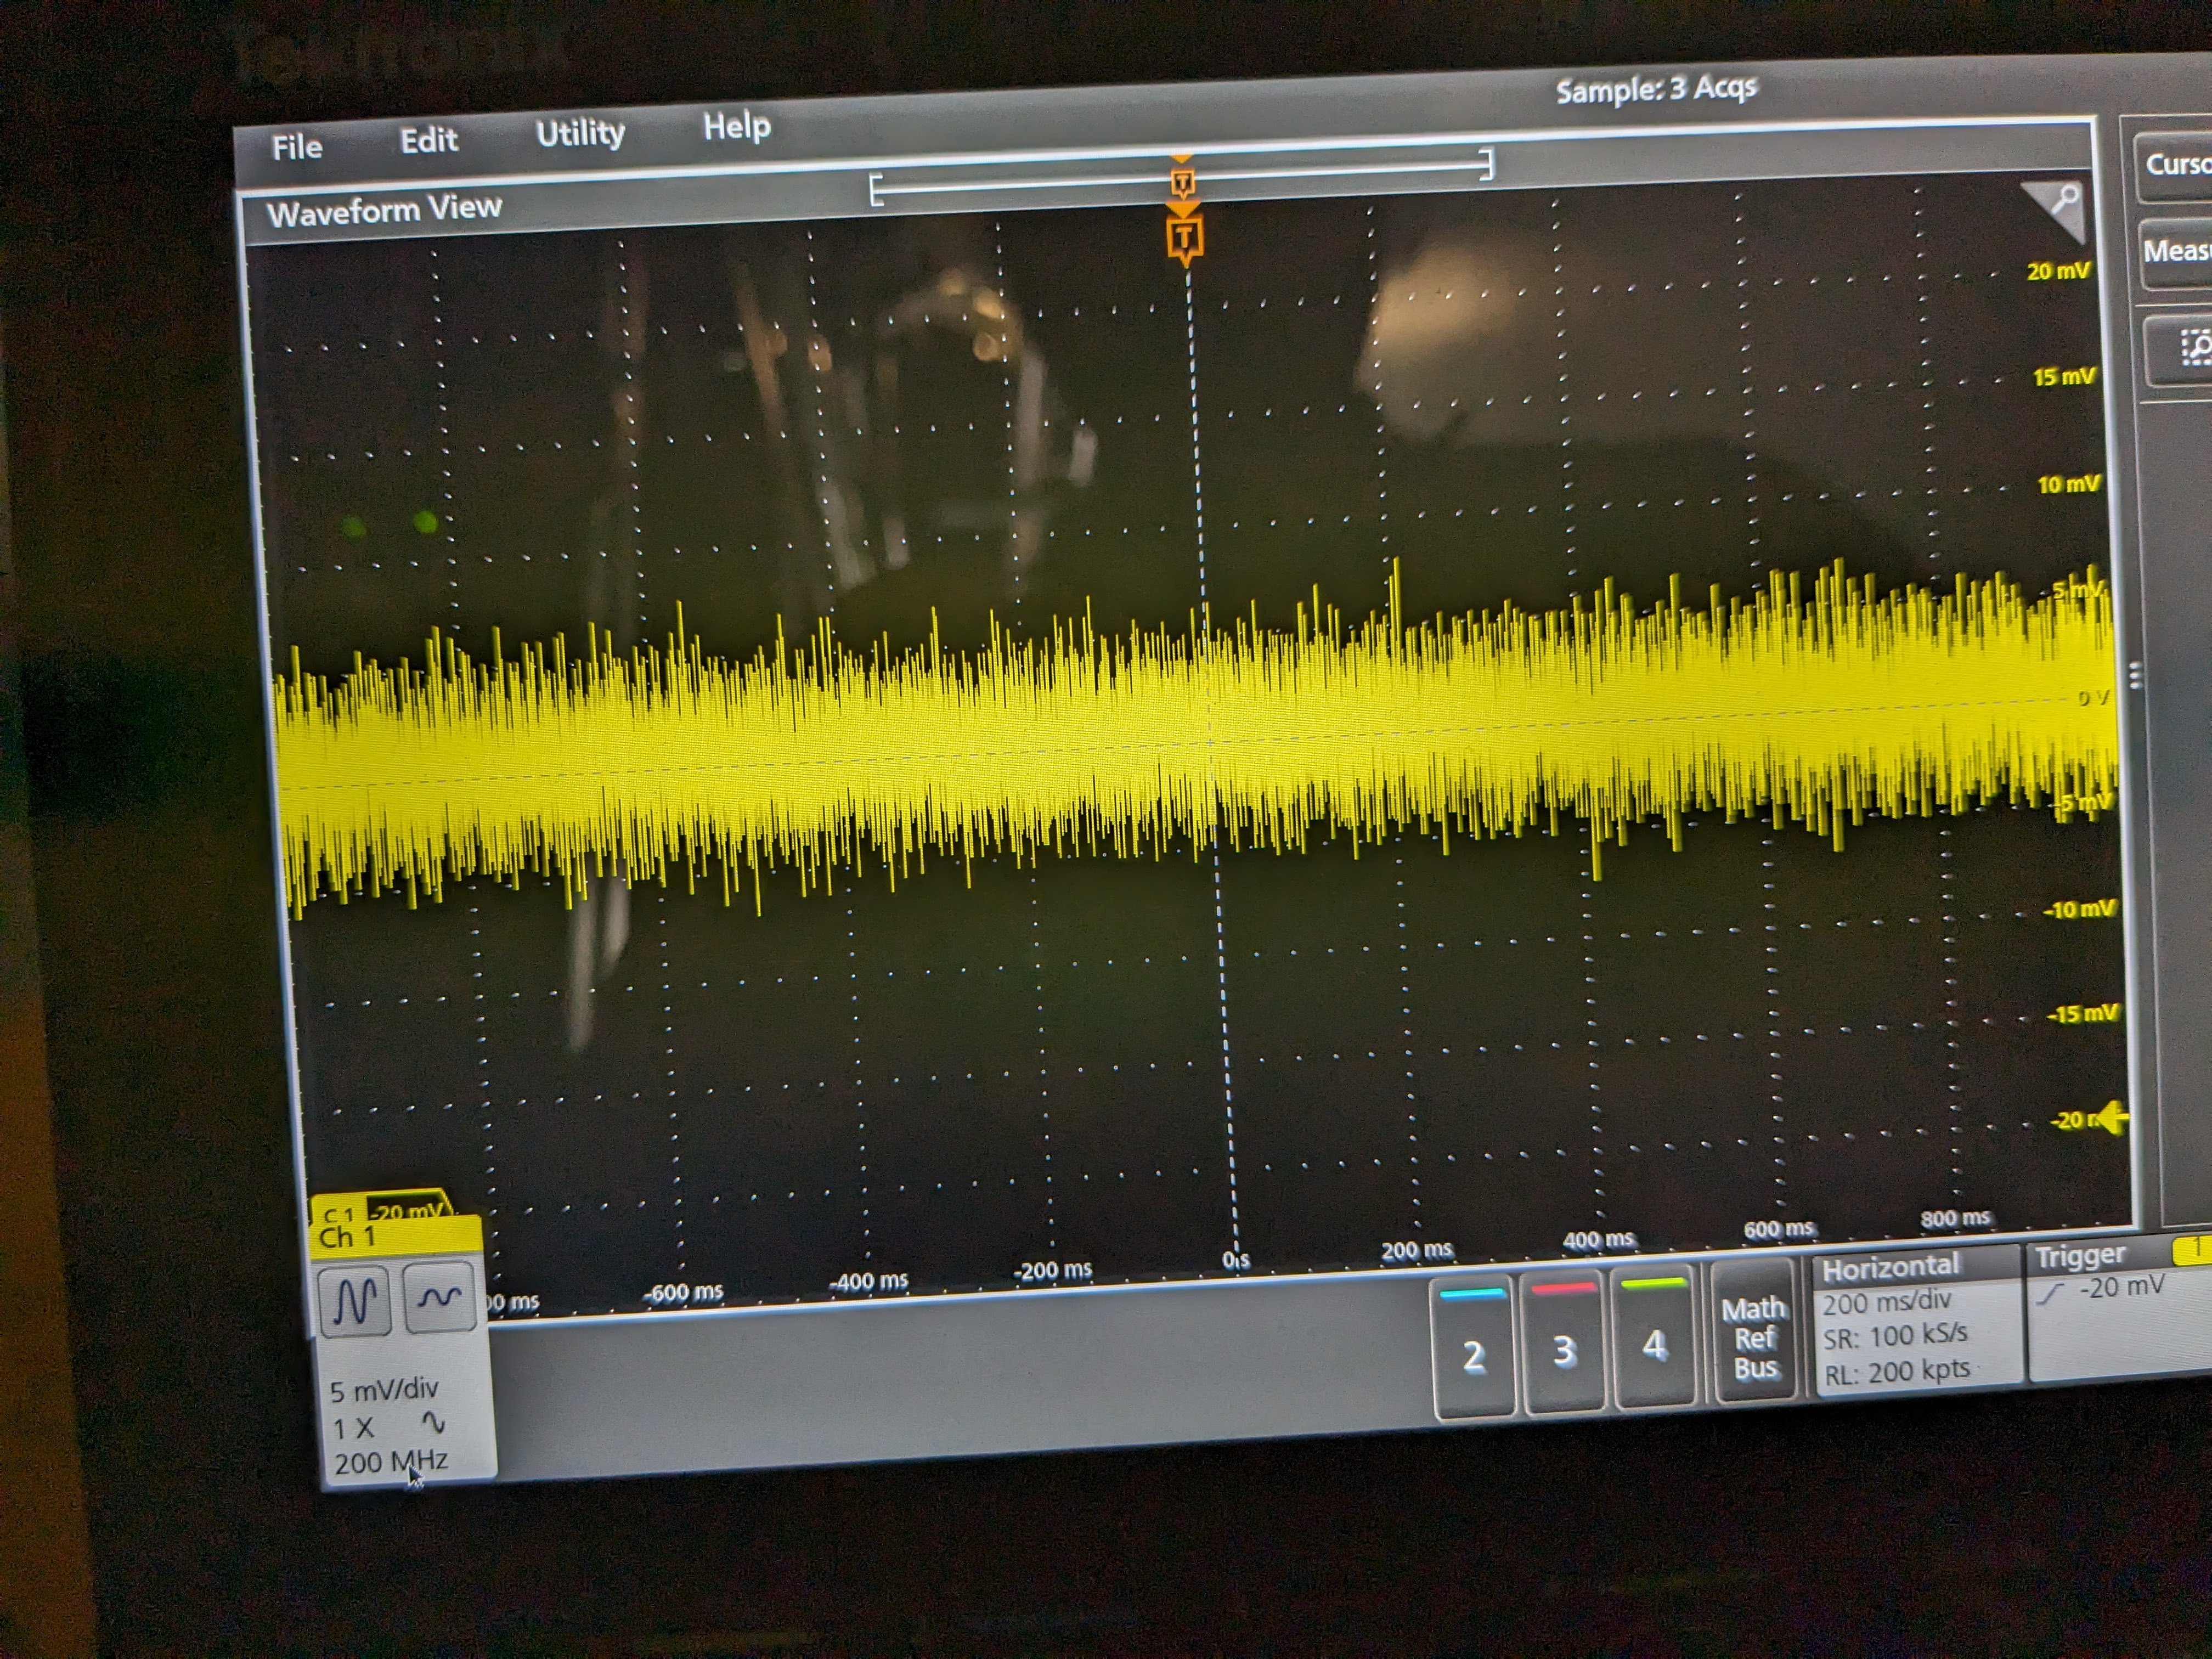
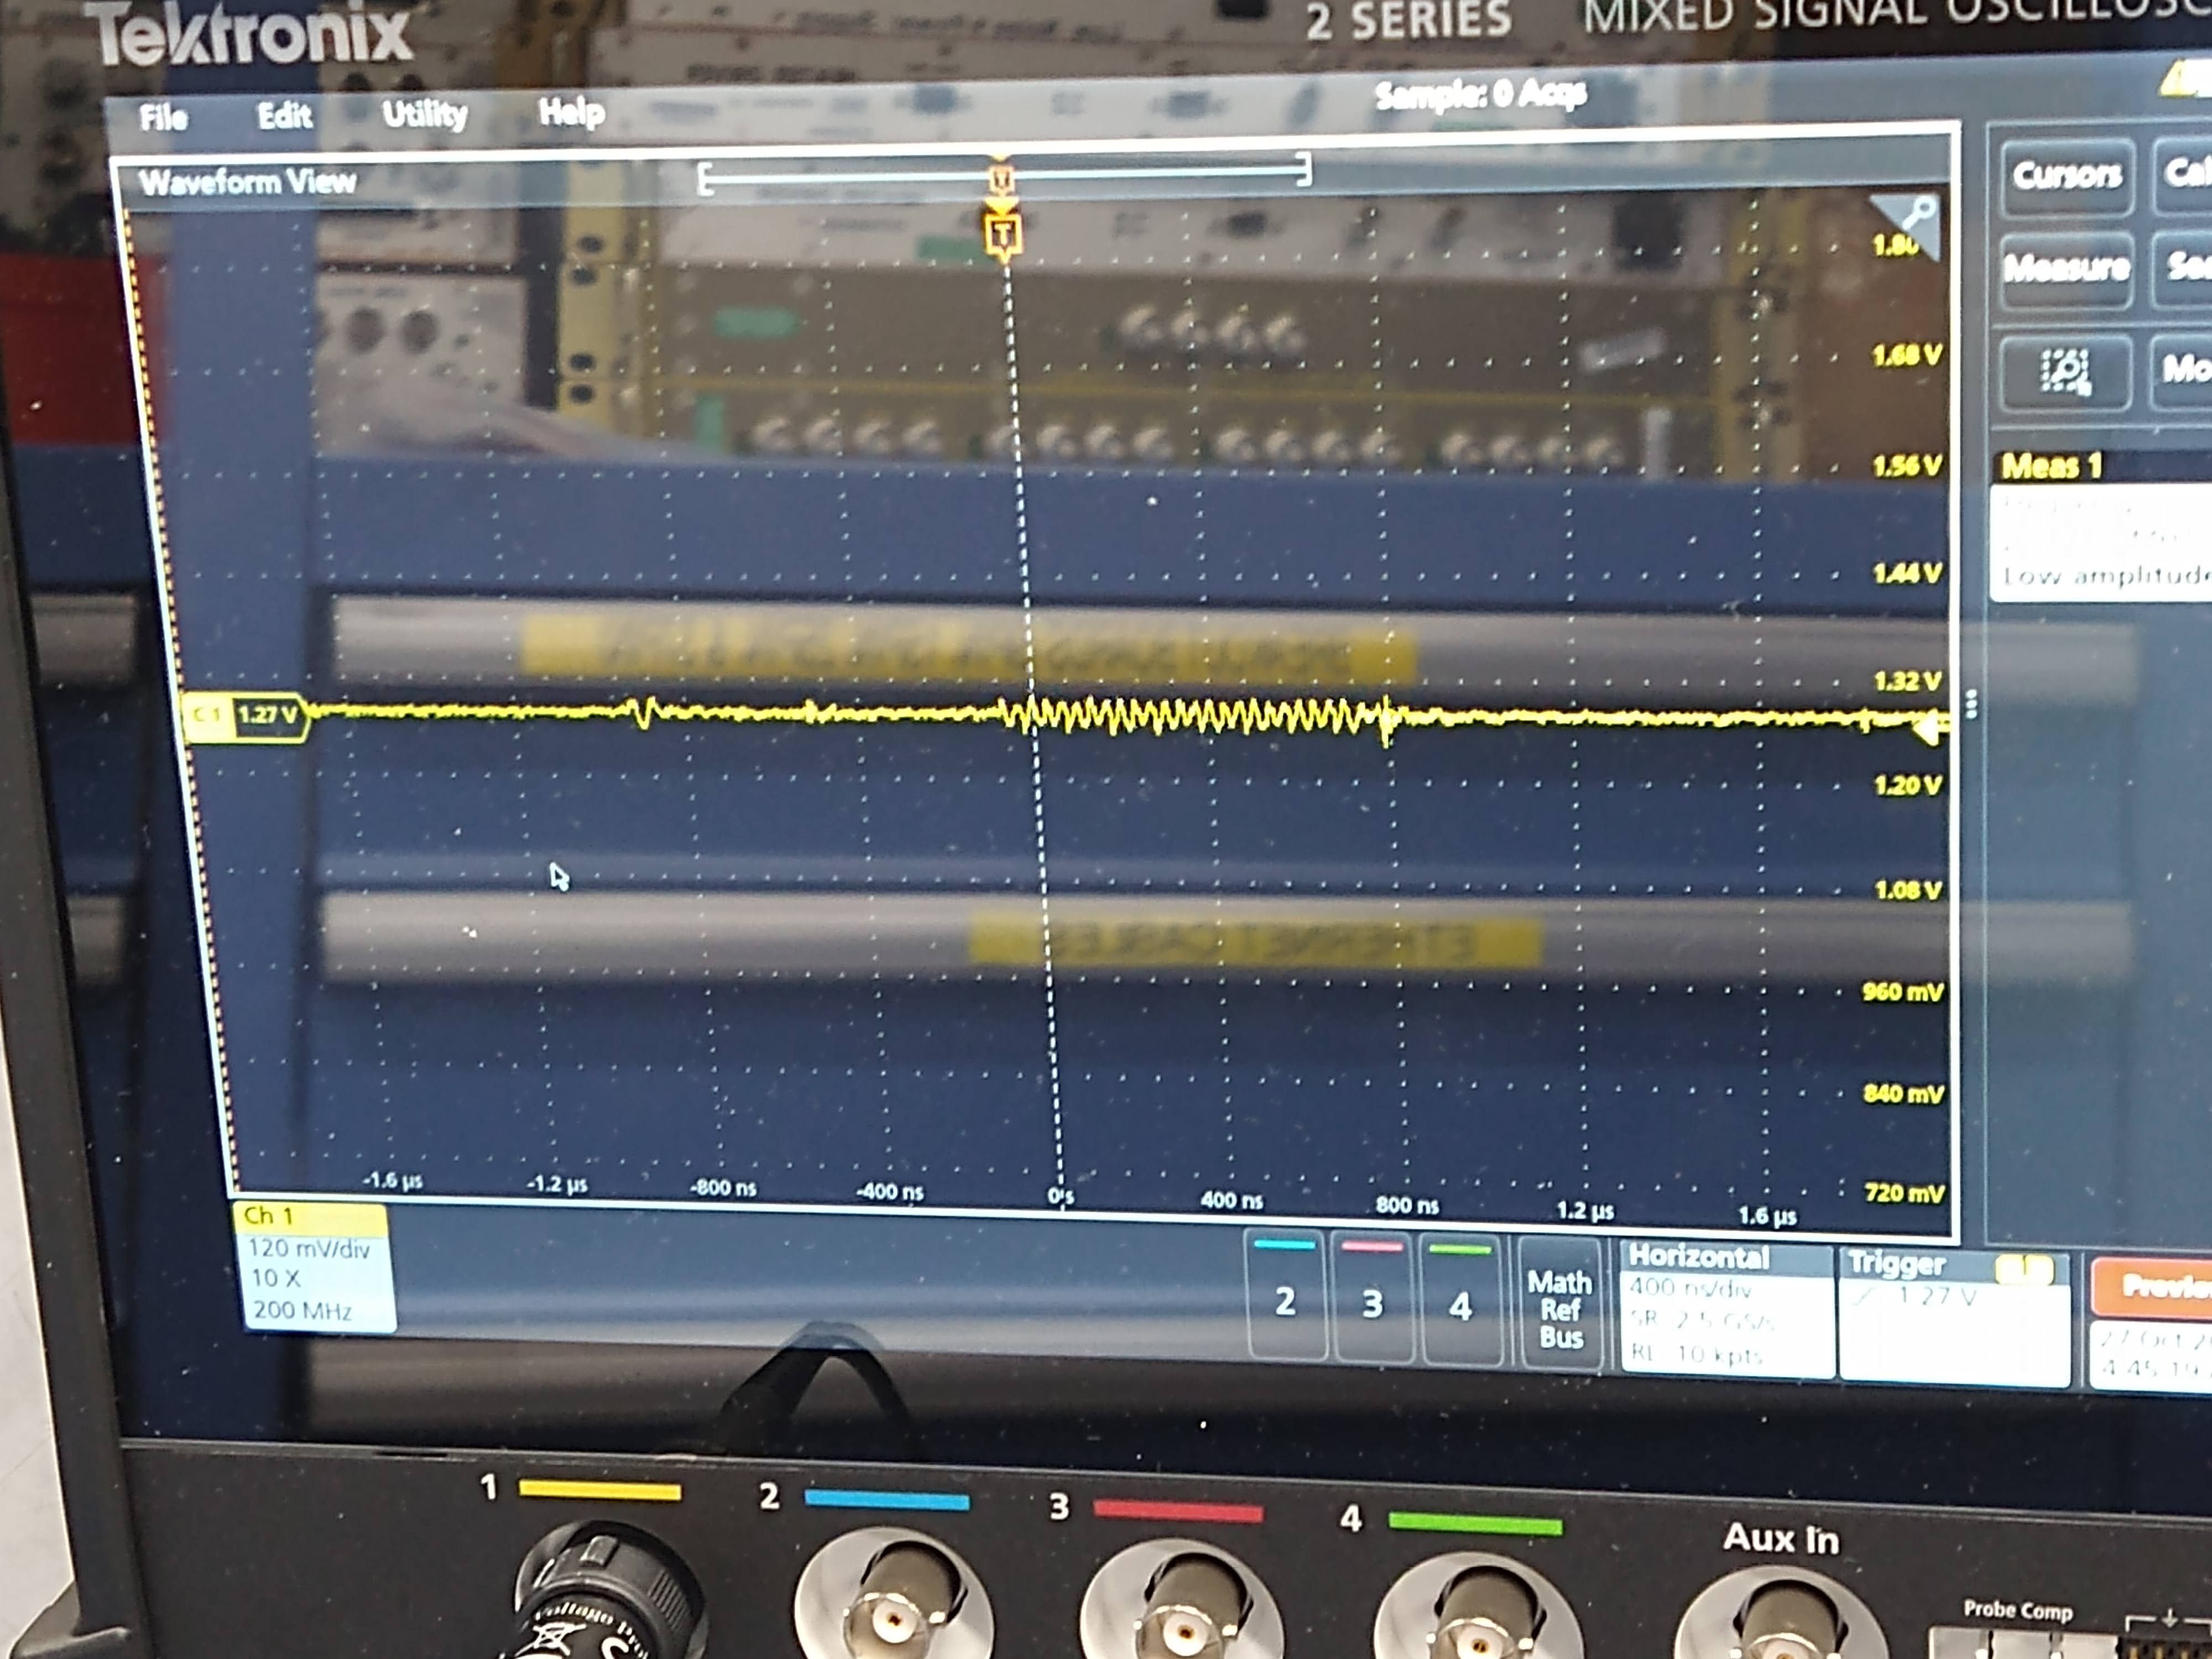
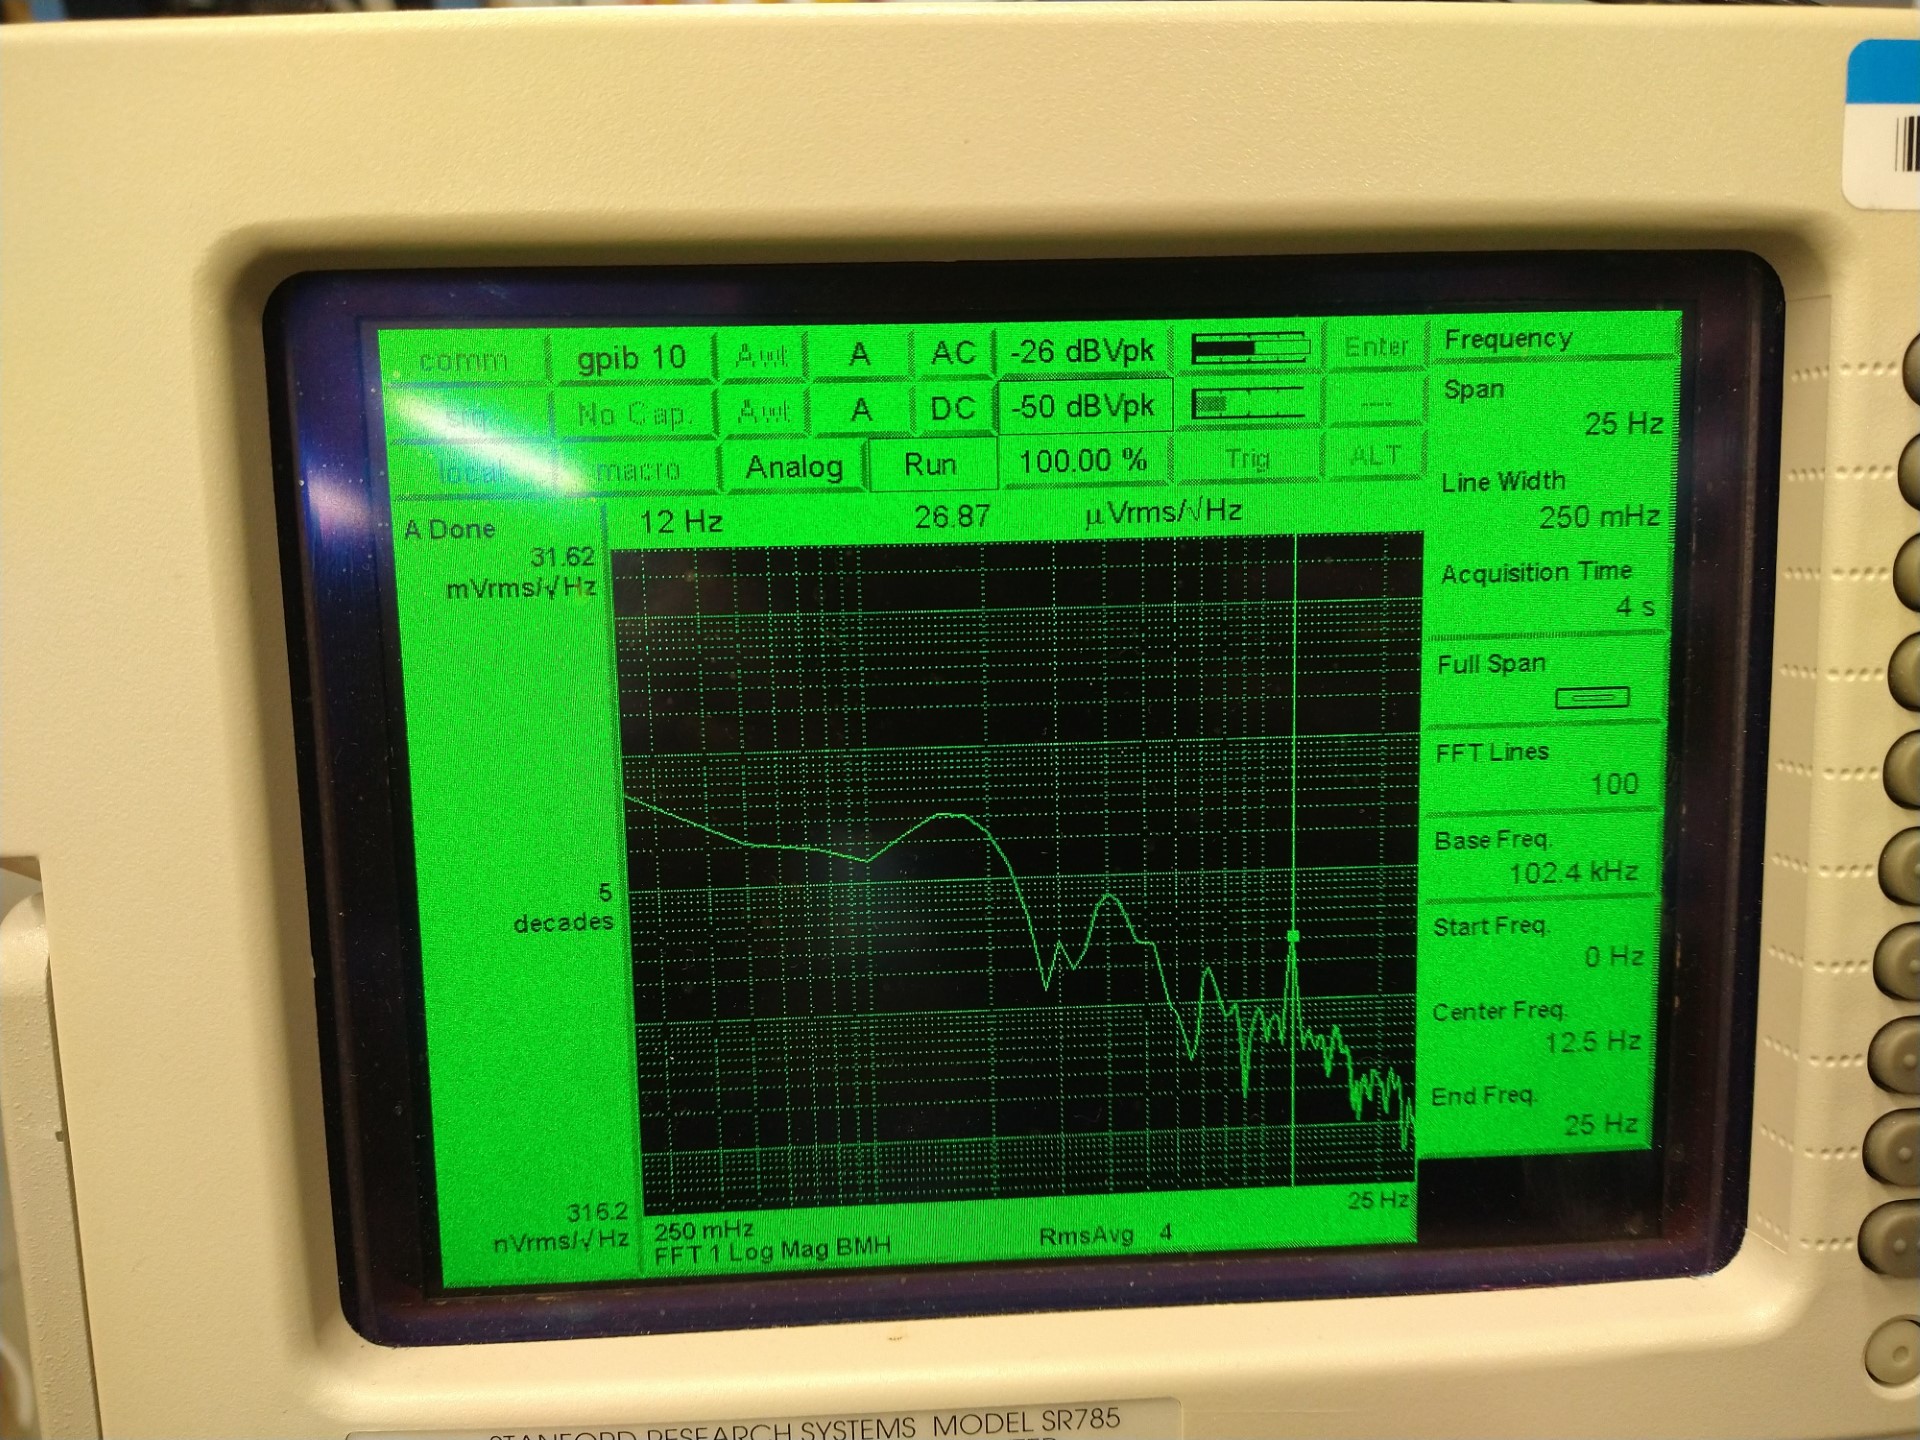
Turns out that all of these things share the same frequency but the voltage across thermistor pins was ~3 orders of magnitude larger than Beckhoff heater driver output pins (pin 9 and 19) (the latter were referenced from the driver board ground as it's common mode for both pins). I used a scope on battery and the thermistor voltage was like roughly 1Vpp 1.66Hz rectangular wave (1st pic). Yellow is the voltage across pin10 and 23 (across thermistor 1), blue is pin9 and 22 (thermistor 2) of the DB25 at the back of the driver chassis when the Beckhoff cable was still connected. Voltage difference seemed to have come from the temperature difference of the thermistors (I disconnected the Beckhoff cable and measured the thermistor 1 and 2 resistance incl. cables to be 7.41k and 4.08k, respectively). When I disconnected the cable from the chassis and just measured the pin10-23 and pin9-22 voltage coming from the cable (picture 2), they were both about 1.2V pp. This is supposed to be the source voltage for thermisters. The frequency slowed down by about a factor of 2 (832mHz) when the thermistors were disconnected.
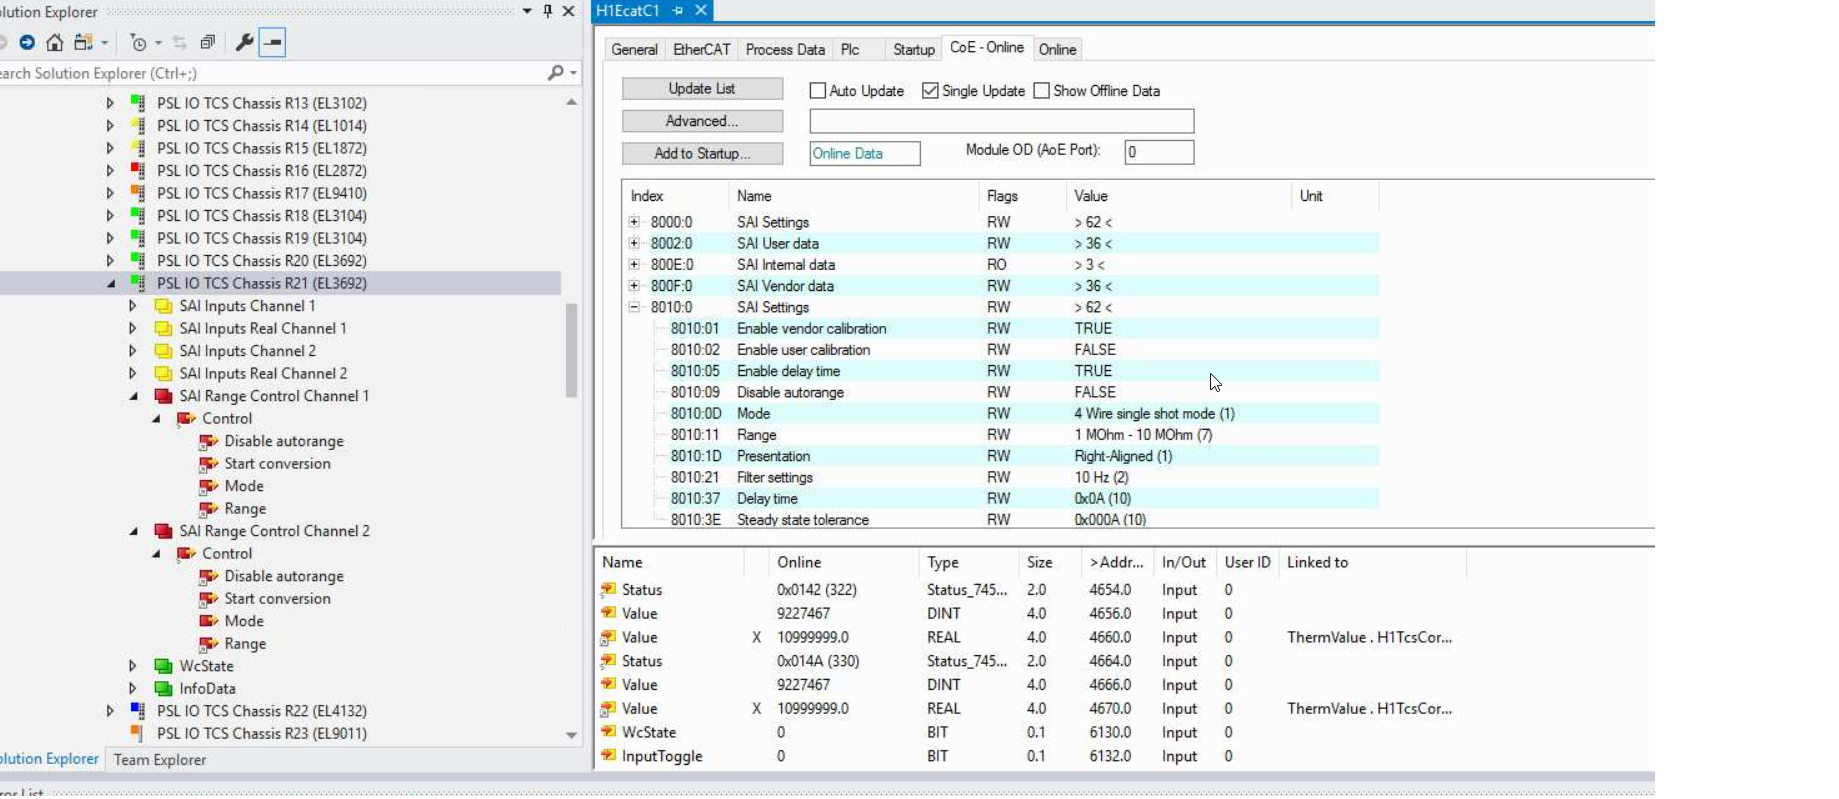
For your convenience, below is a table of which pins are what (see e.g. E1100530 and D2000212). Note that thermistors themselves only have two pins, therefore supply and readback pins are bundled together in chamber as shown. Supply is presumably a reference voltage supplied through a reference resistor.
| which thermistor? |
DB25 pin |
Beckhoff |
in chamber |
| 1 |
10 |
Temperature Supply 1A+ |
thermistor 1 pin 1
(10&12 bundled together in chamber) |
| 12 |
Temperature Readback 1A+ |
| 23 |
Temperature Supply 1A- |
thermistor 1 pin 2
(23&25 bundled together in chamber) |
| 25 |
Temperature Readback 1A- |
| 2 |
9 |
Temperature Supply 2A+ |
thermistor 2 pin 1
(9&11 bundled together in chamber) |
| 11 |
Temperature Readback 2A+ |
| 22 |
Temperature Supply 2A- |
thermistor 2 pin 2
(22&24 bundled together in chamber) |
| 24 |
Temperature Readback 2A- |
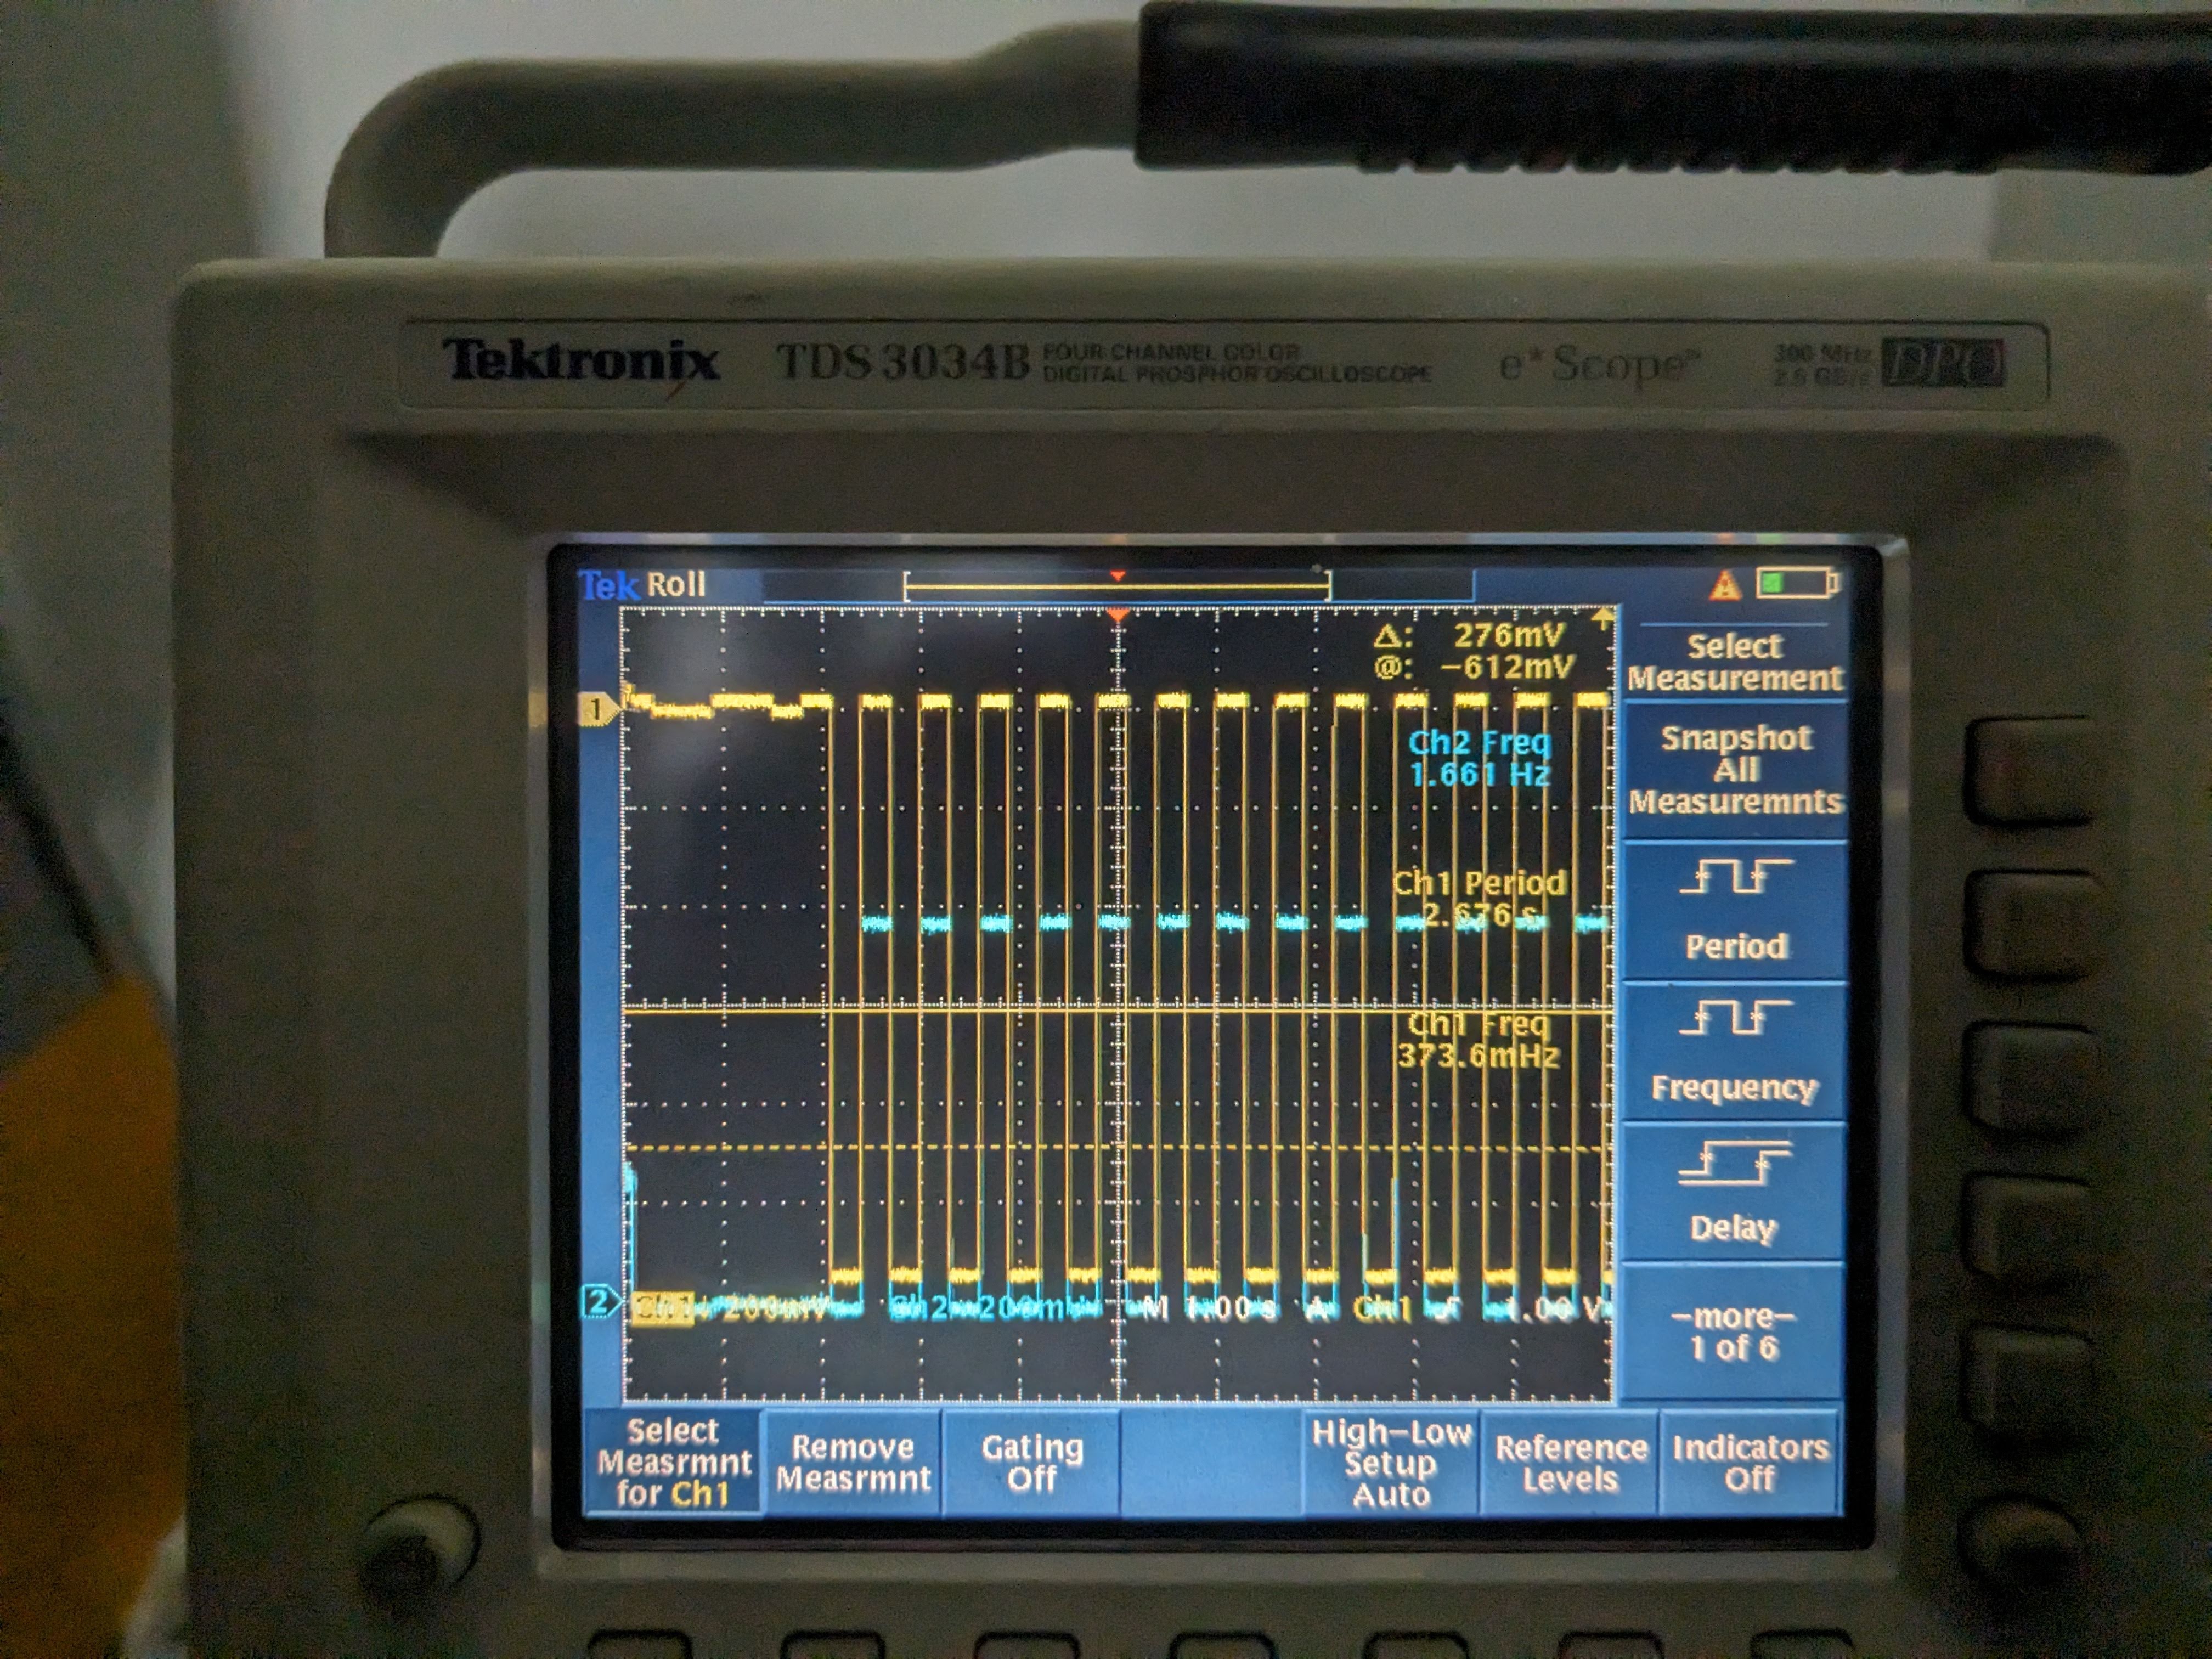
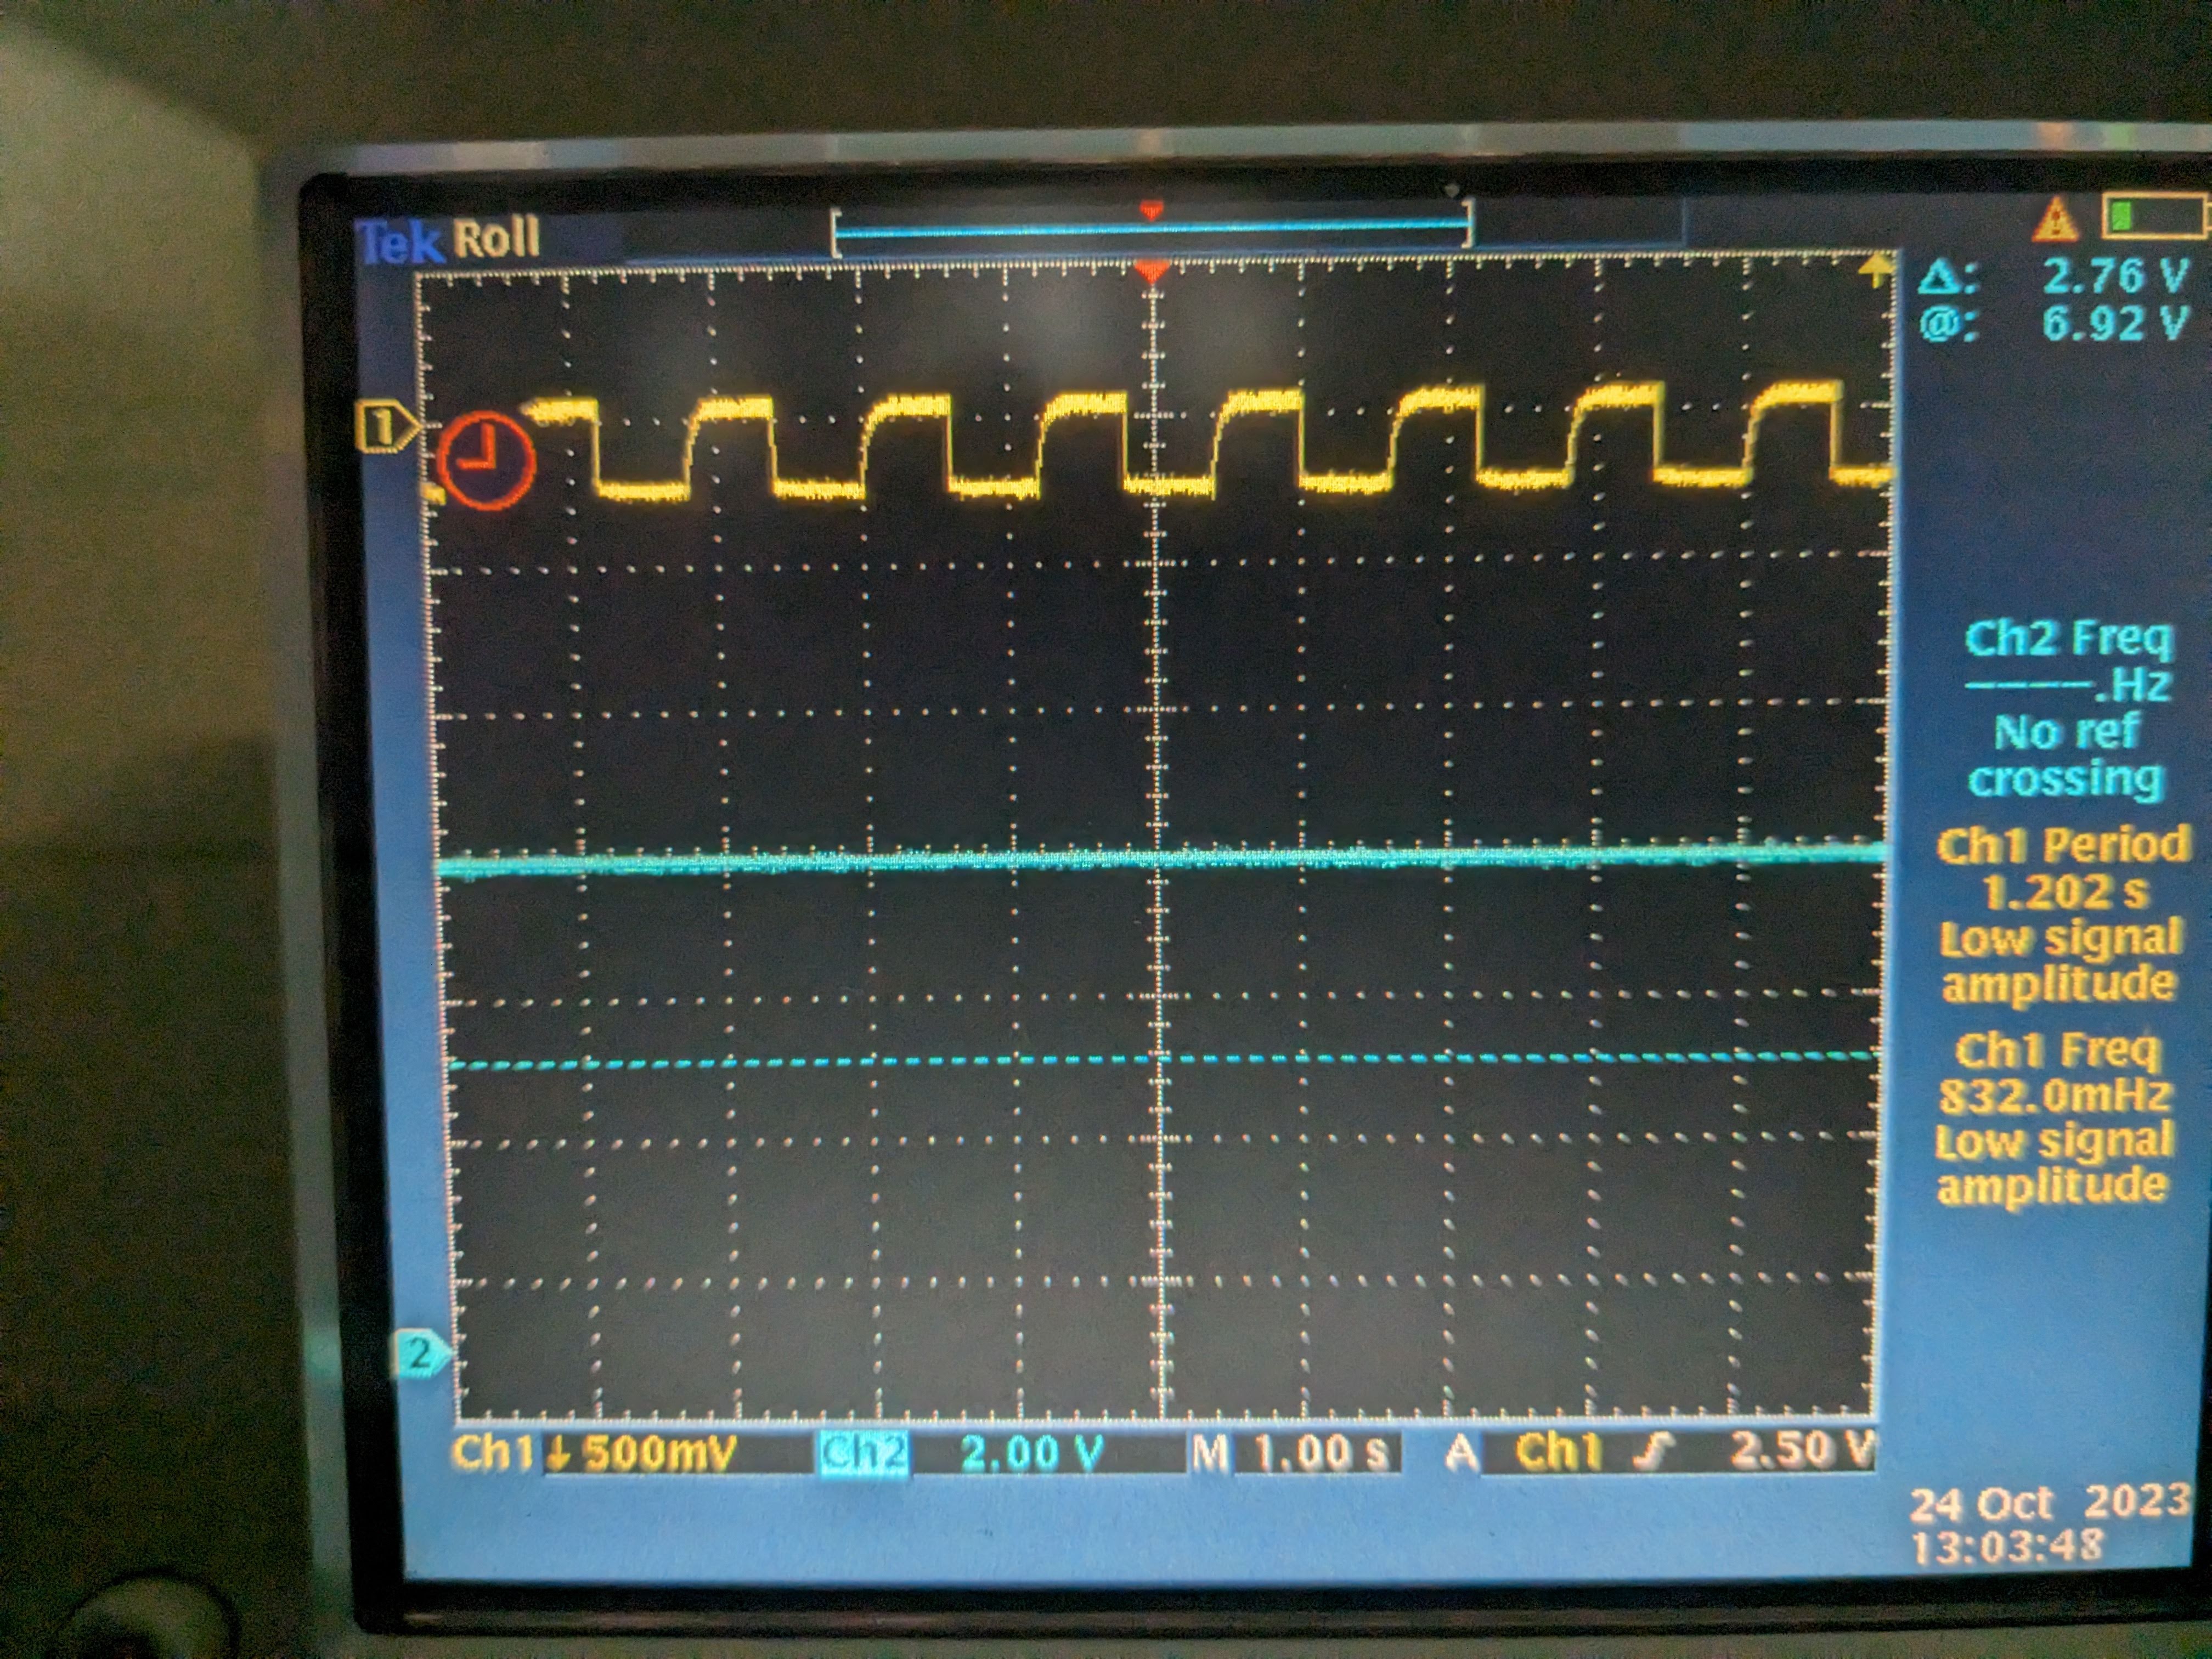
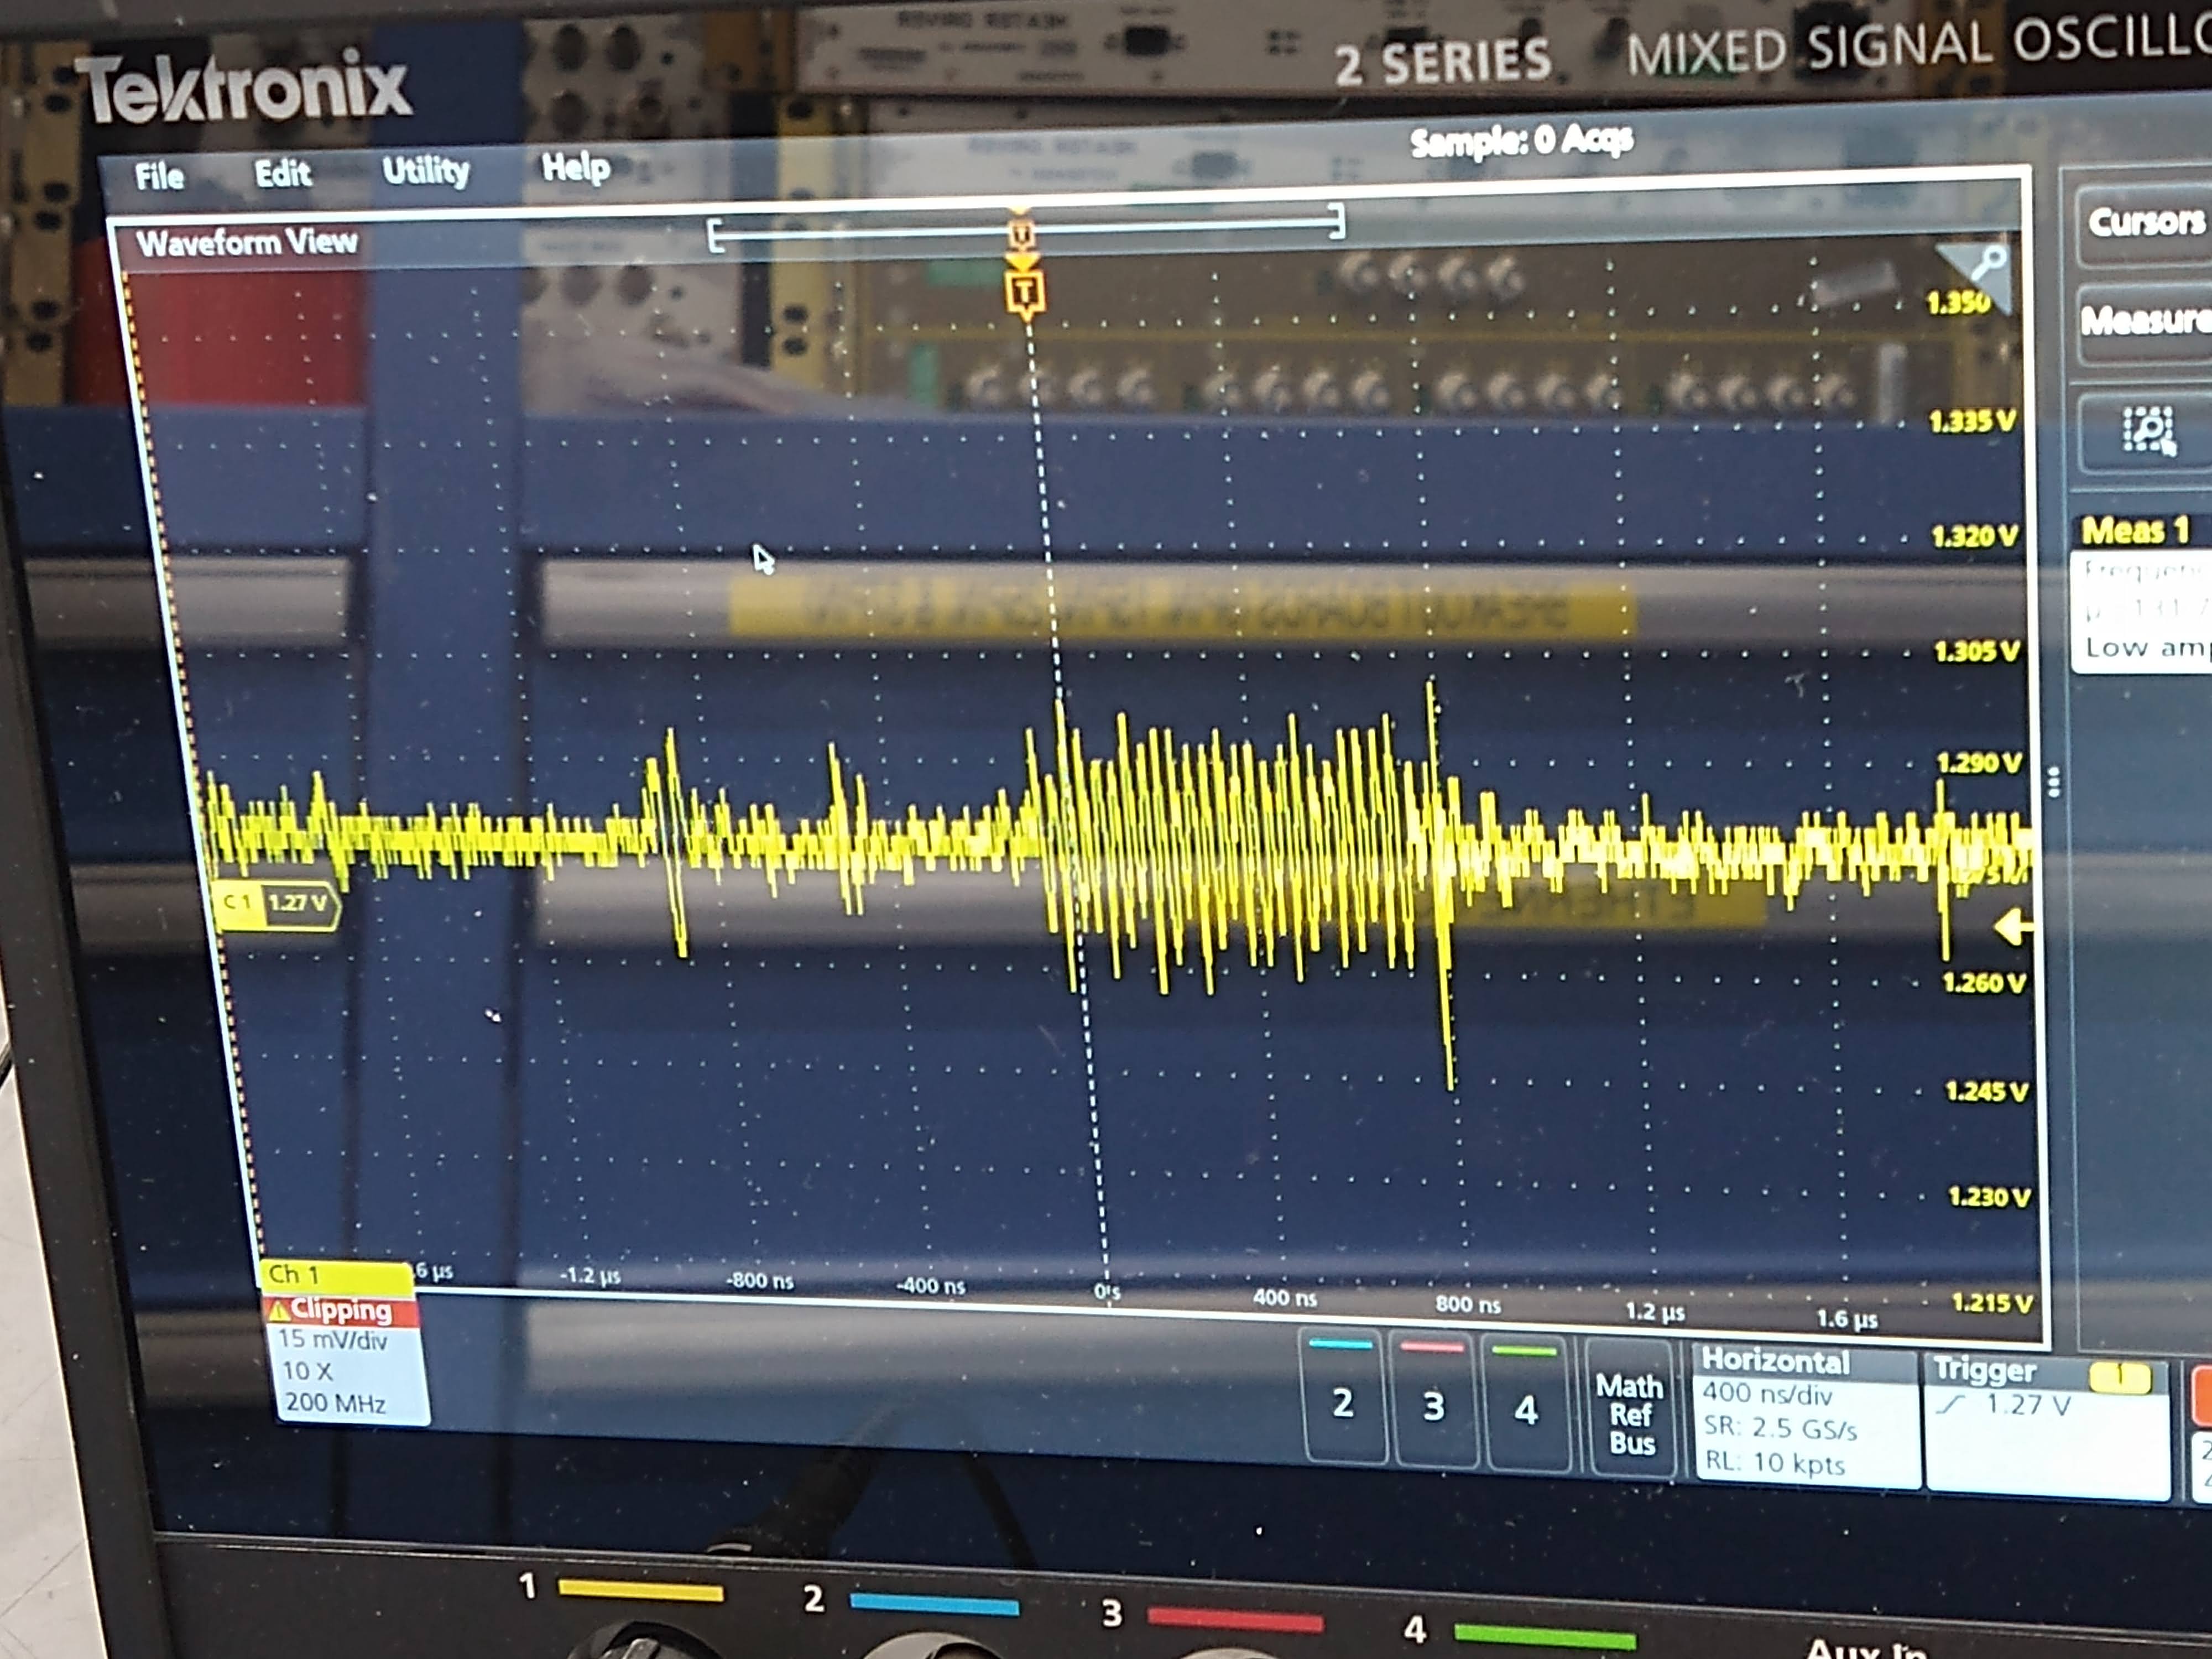
Went to the CER, disconnected the cable from the back of the Beckhoff chassis and did the same measurement. Frequency didn't change but the amplitude was much smaller (~280mVpp instead of 1.2Vpp) for a while, but suddenly the amplitude of the thermistor 1 supply changed back to 1.2V (pic 3). Nuts. When the beckhoff cable was reconnected (and the connection to in-chamber thermistor was restored) the frequency went back to 1.66Hz (picture 4).
Picture 5 shows pin 10-23 (thermistor 1 supply) and pin12-25 (thermistor 1 readback, which is not connected to anything). Picture 6 is the same thing but for the unused Beckhoff unit for the second T-SAMS. It's strange that the same thing is happening in two independent units. Picture 7 is the thermistor 1 supply and pin 6-19 (voltage output for the heater driver). It really seems that this is a problem of the supply voltage.
I checked the 24V power strip for the Beckhoff chassis but it was good (pic 8 and 9).
Fil and Fernando set up EL3692, which is the Beckhoff unit used for Thermistors. They didn't observe this oscillation behavior.
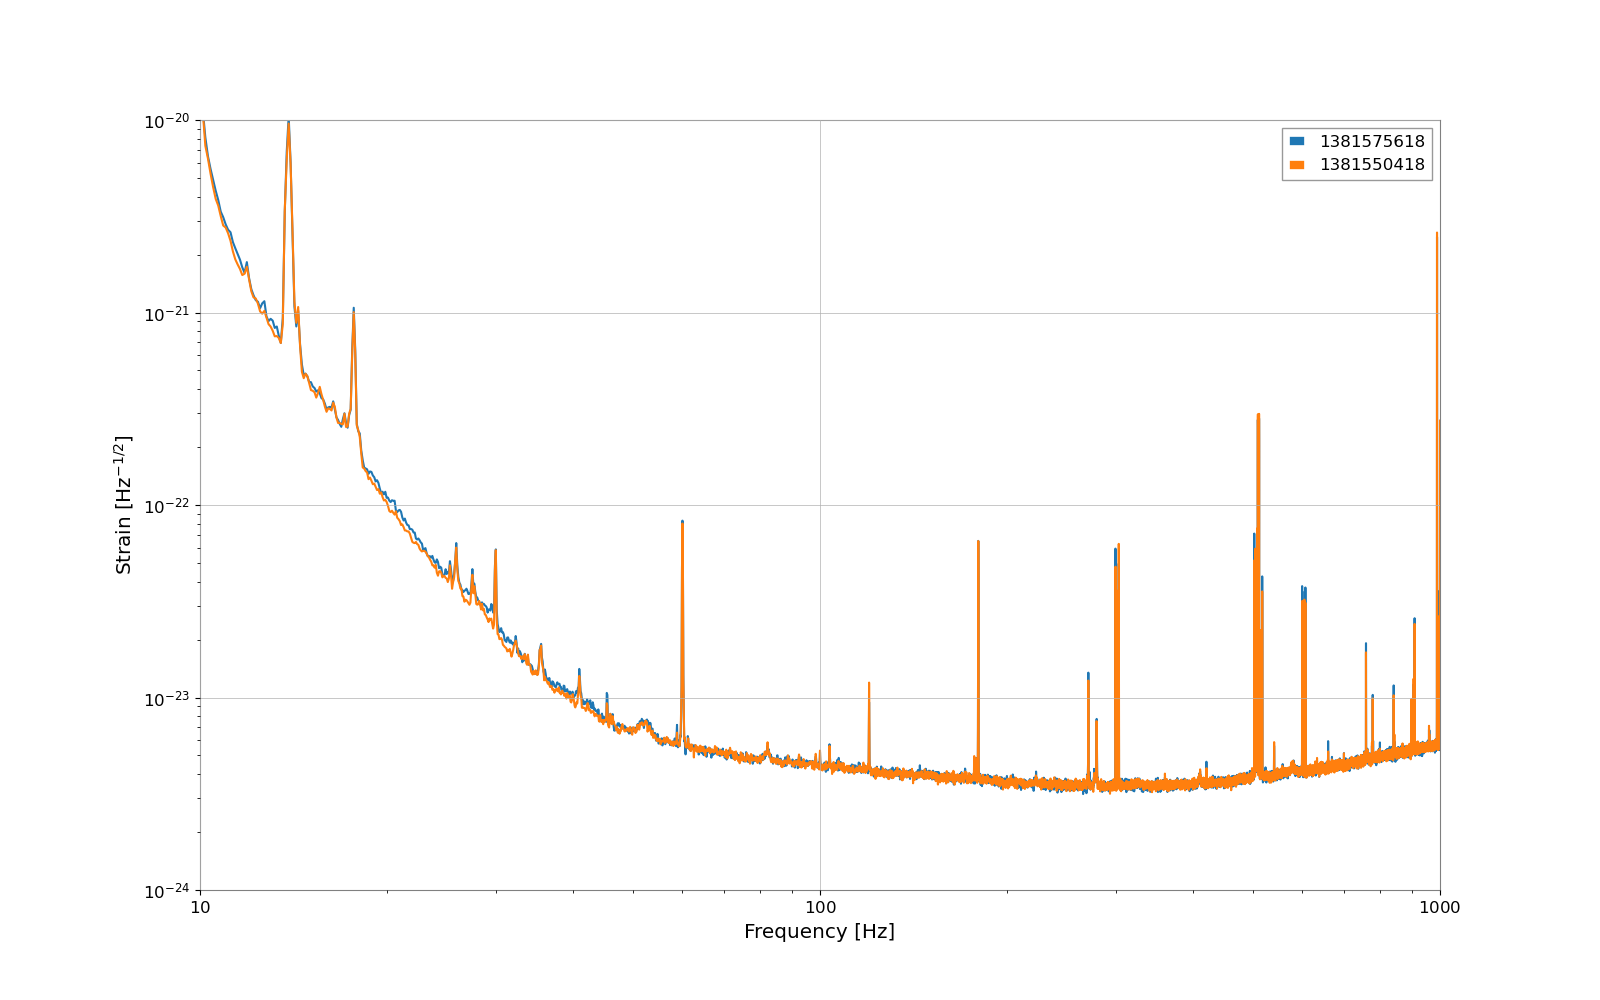
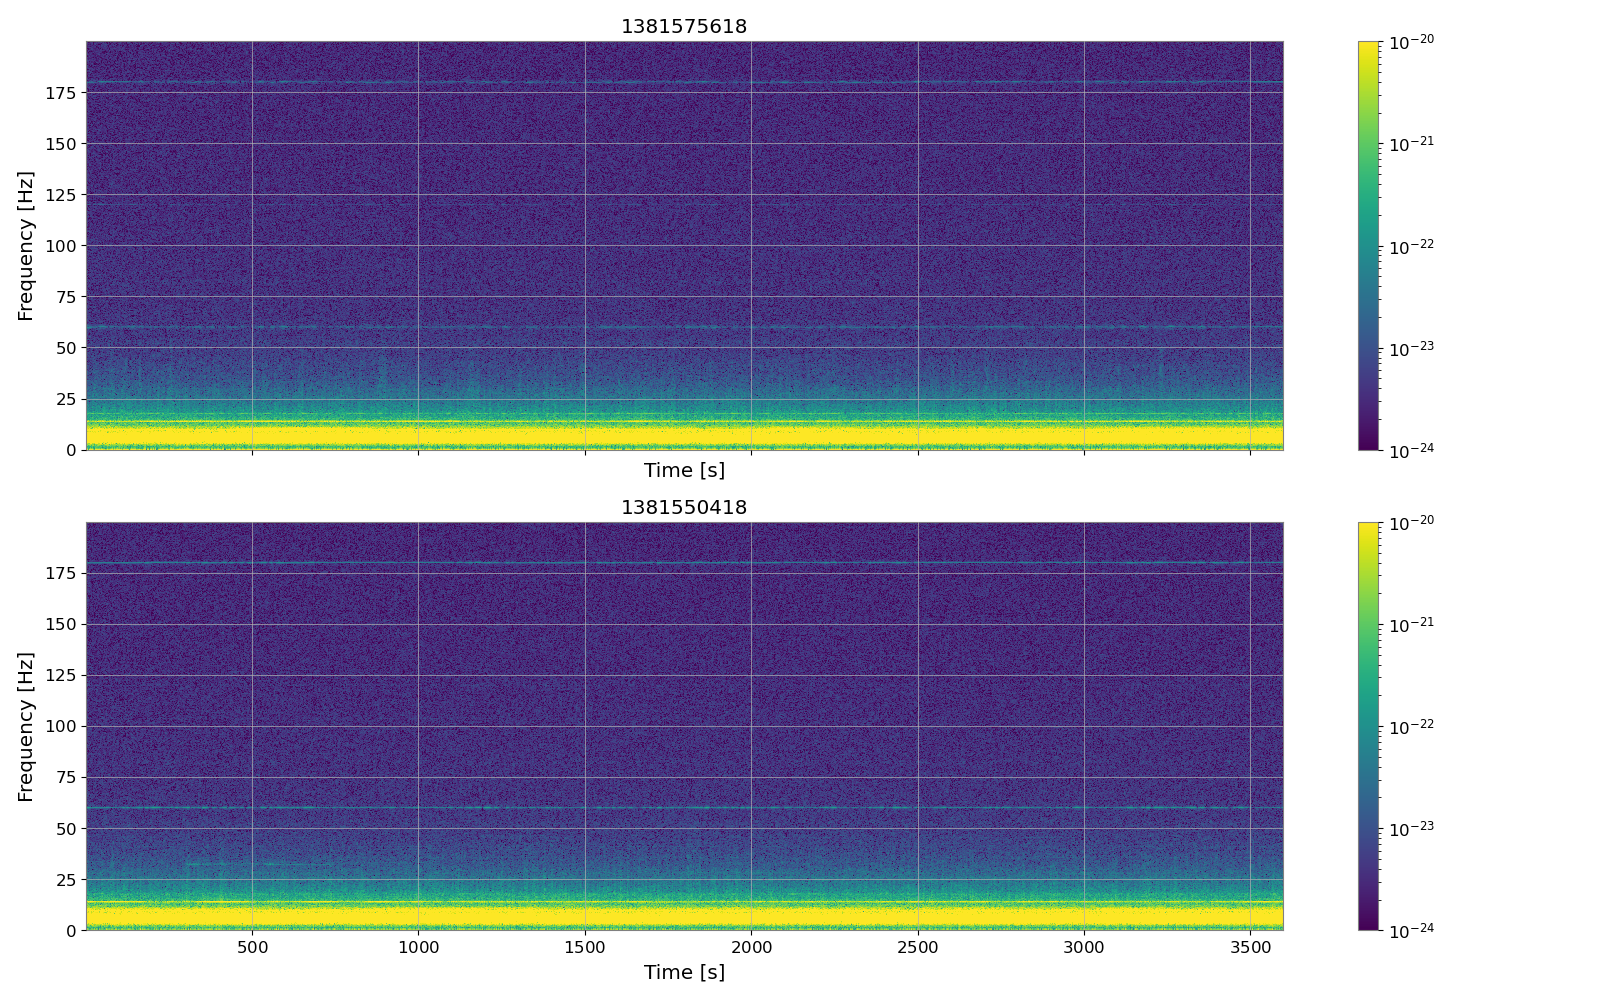
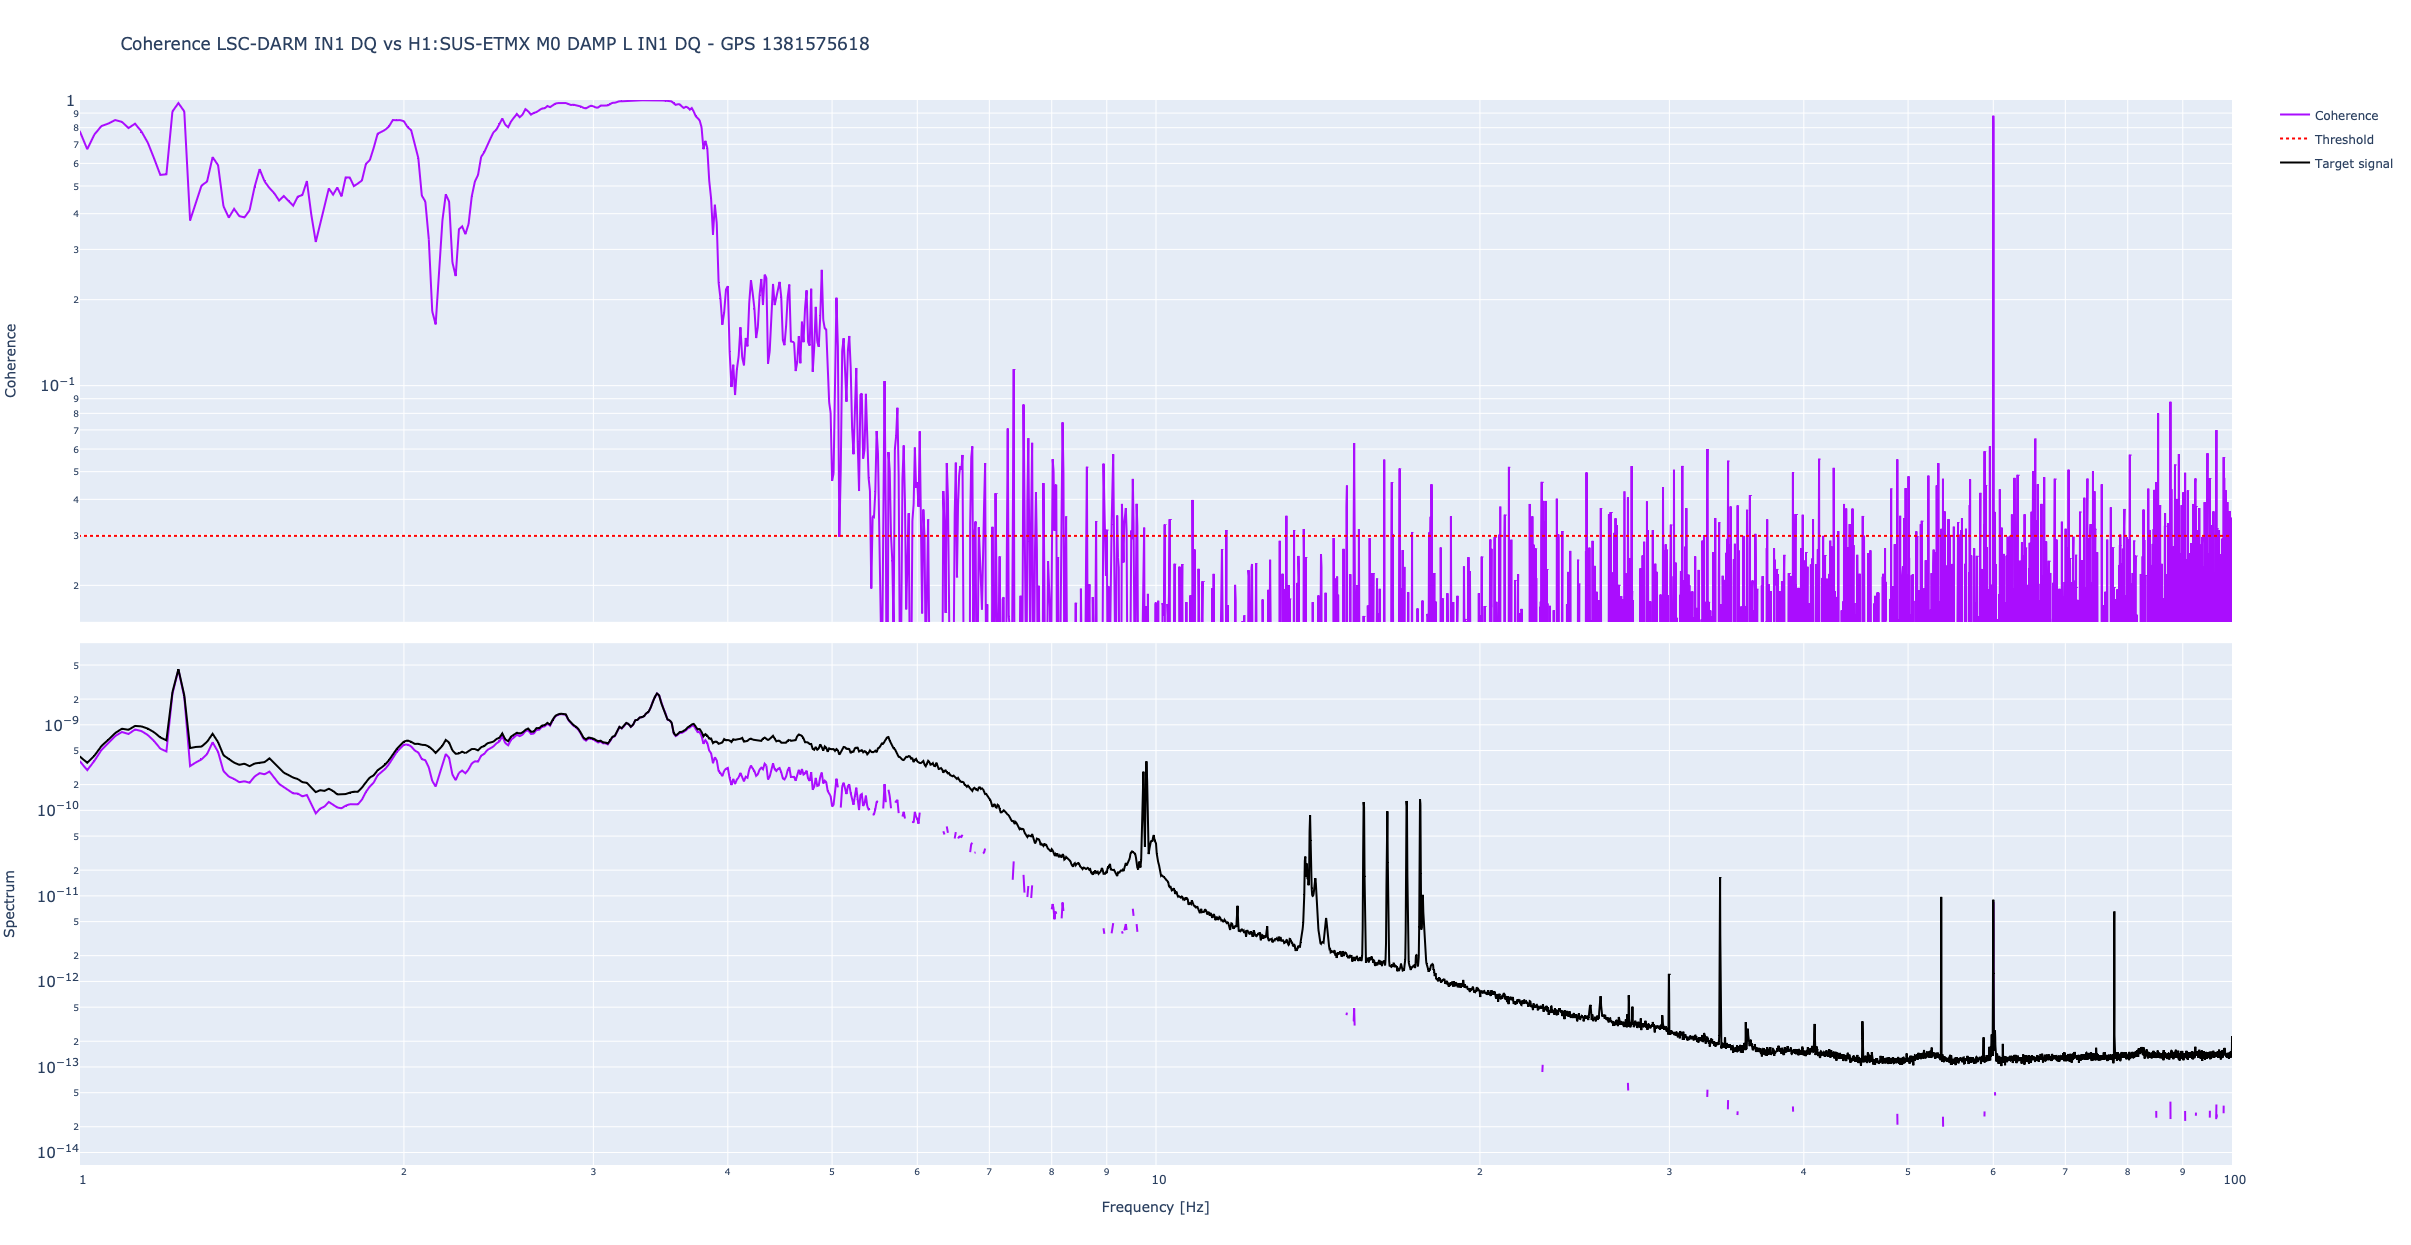
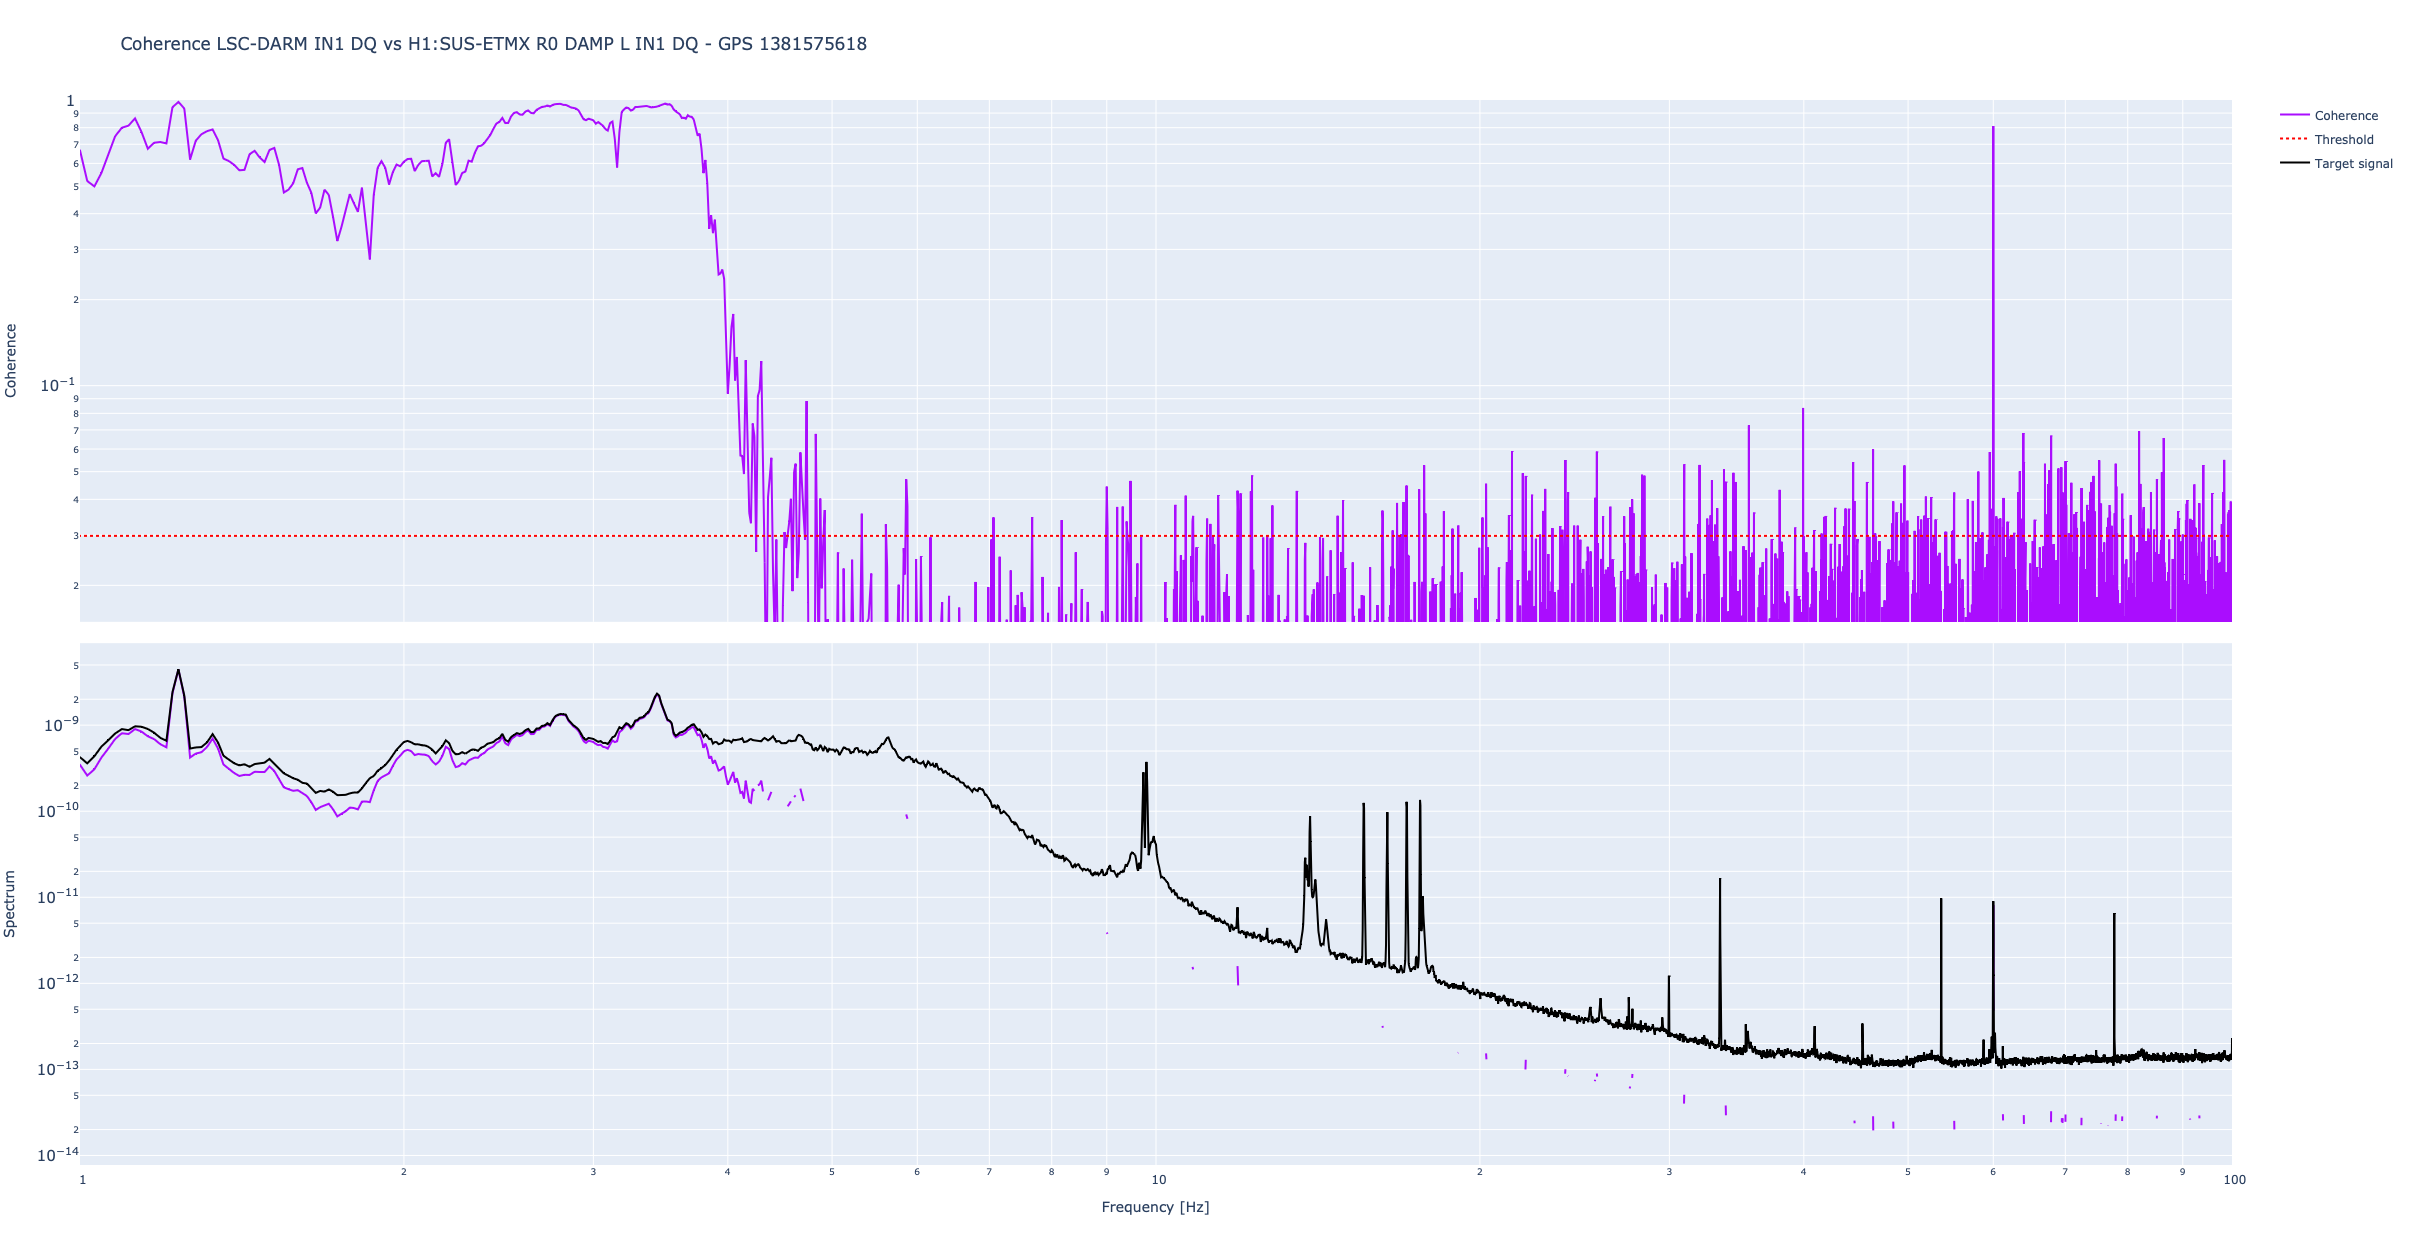
I wanted to do some injections into thermistors to see how this couples to DARM but didn't have time.


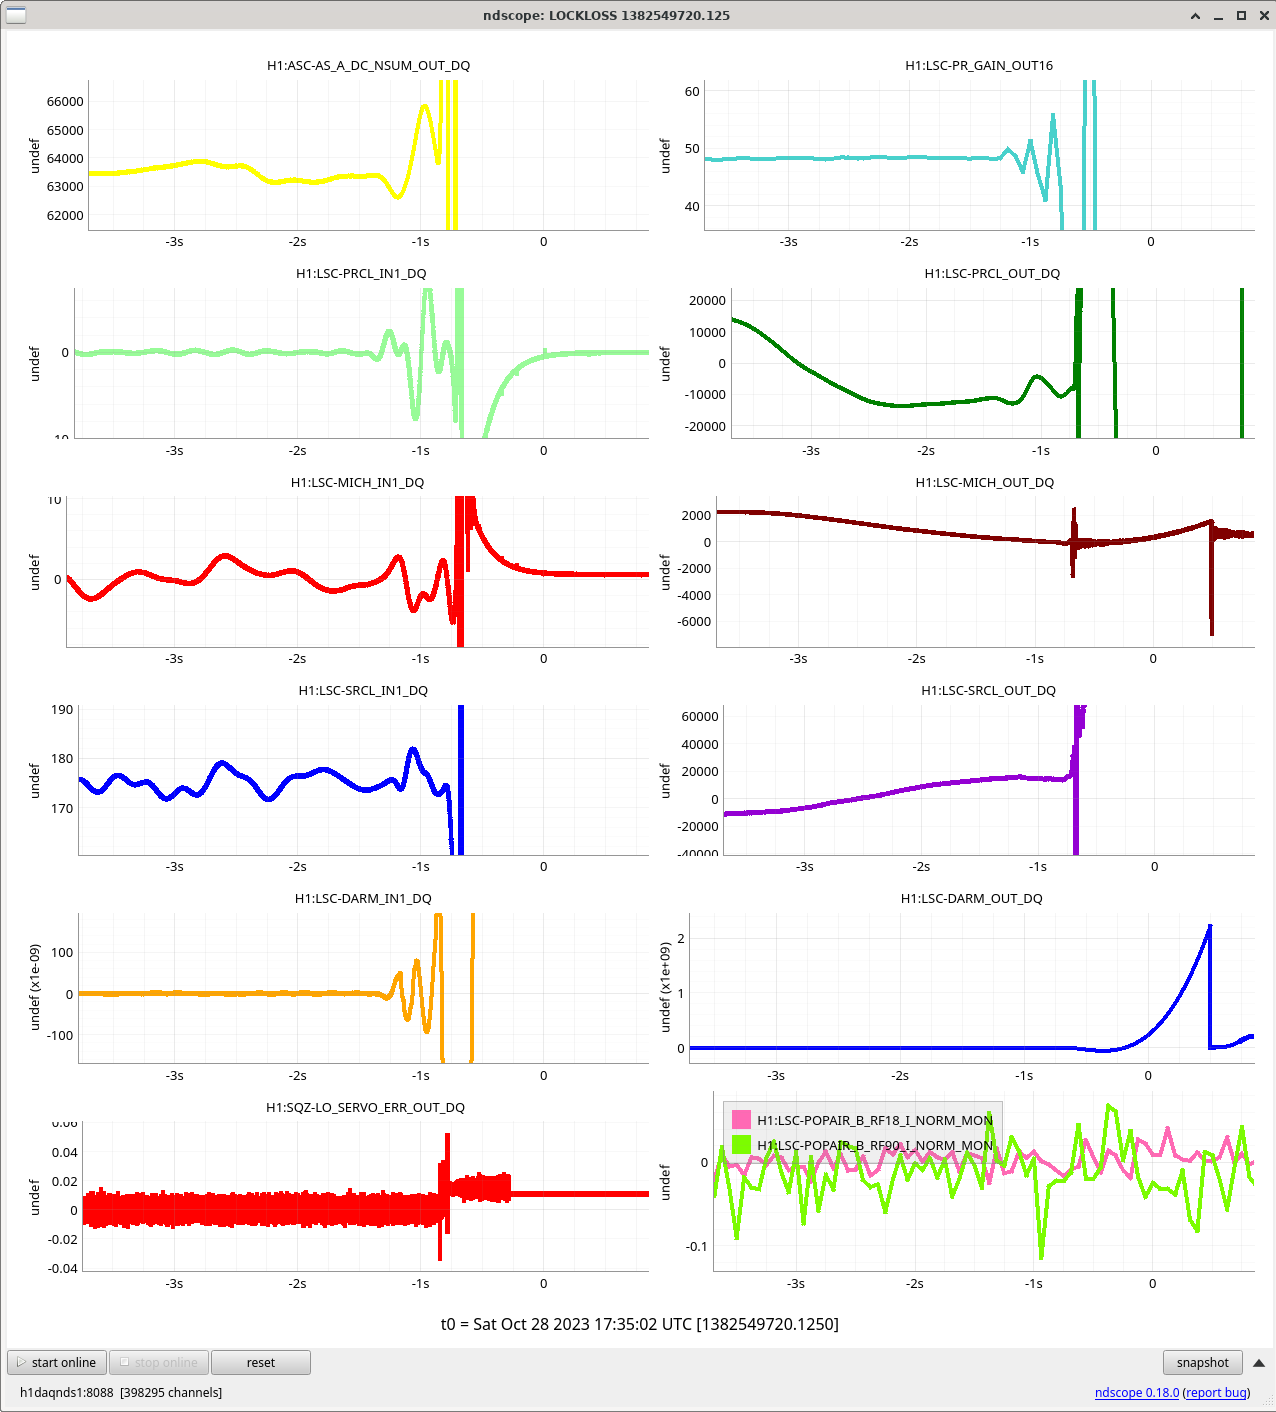
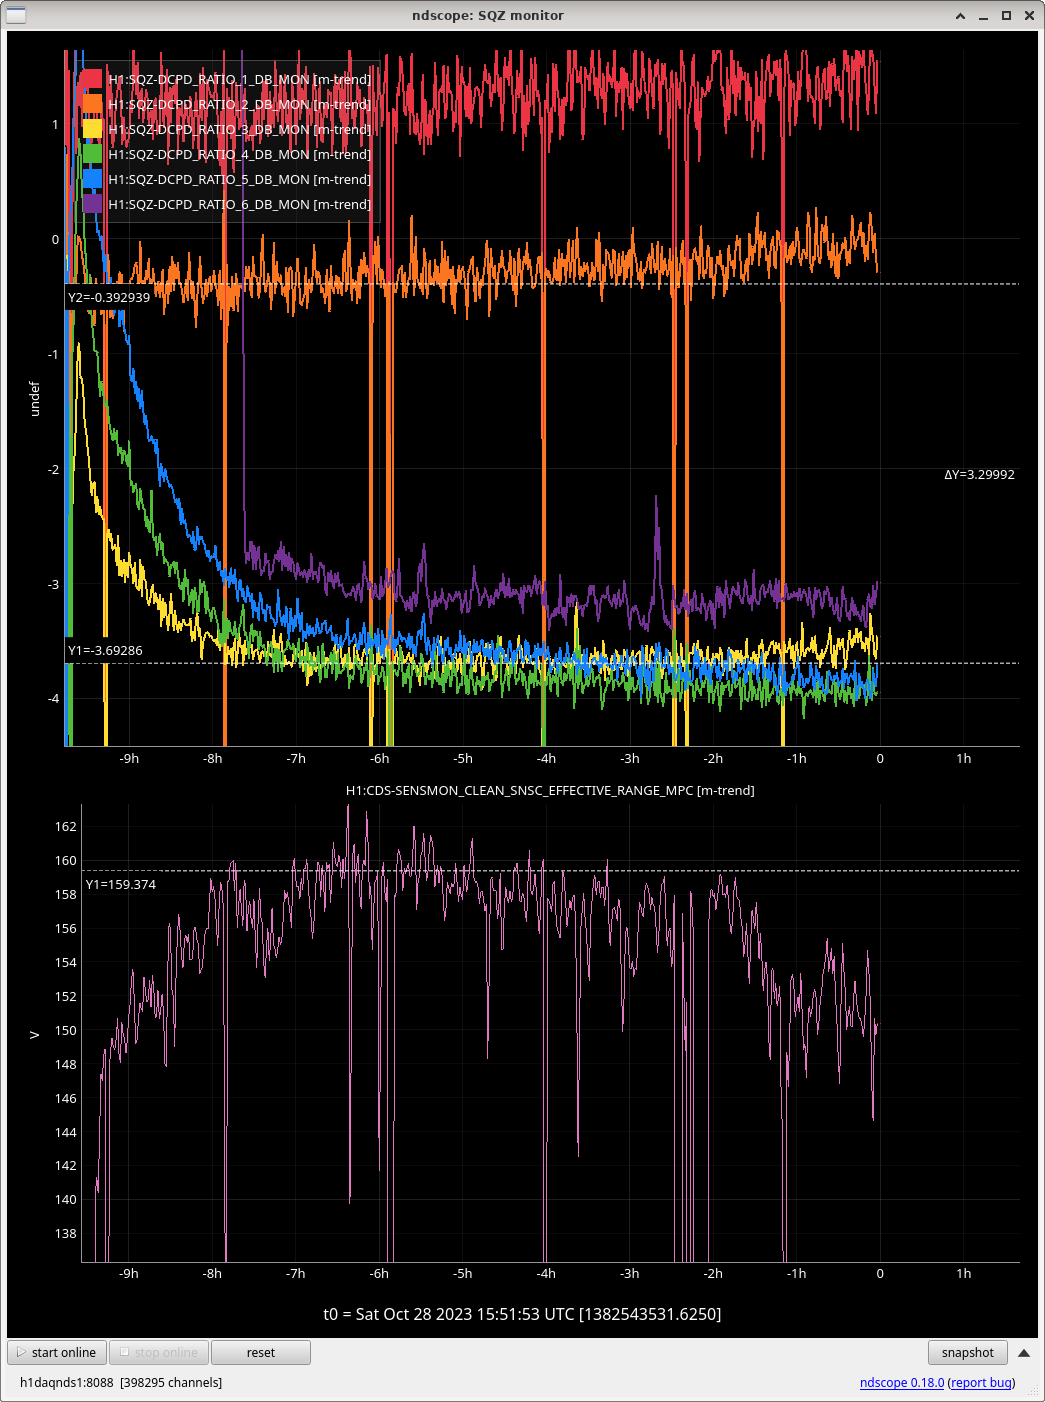
Reached NLN at 21:53UTC and while waiting for camera servos to converge we had a lockloss at 21:58UTC 73800. No issues with SQZ FC locking.