Below are the steps for a (failed) attempt at running a broadband + simmulines calibration mesaurement w/ H1 was locked for 3+hrs and with L1 still in recovery from a power outtage:
- Following instructions (link)
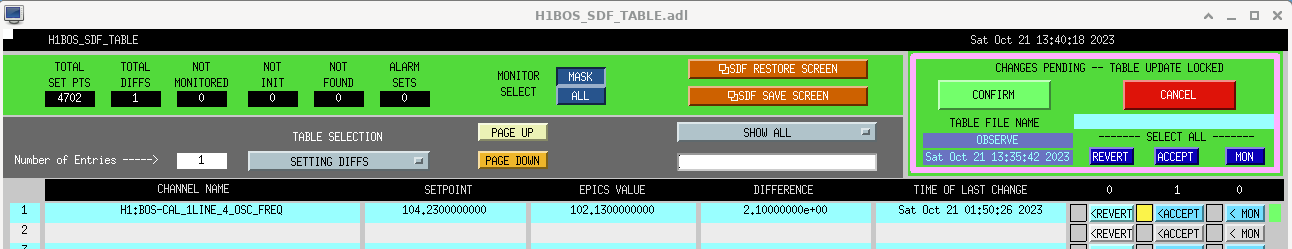
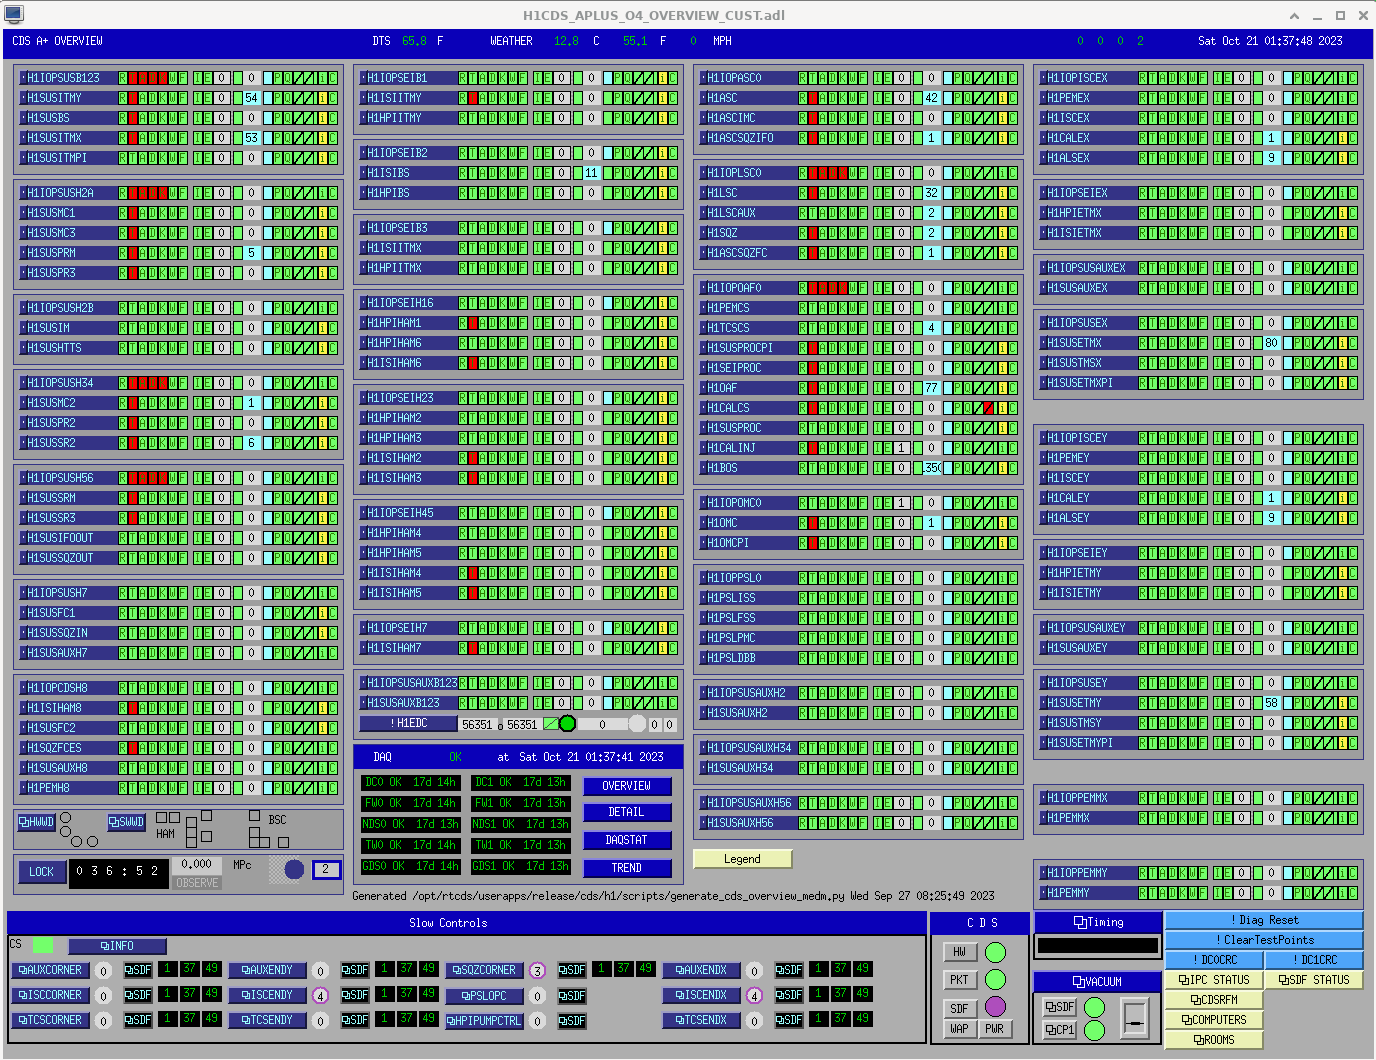
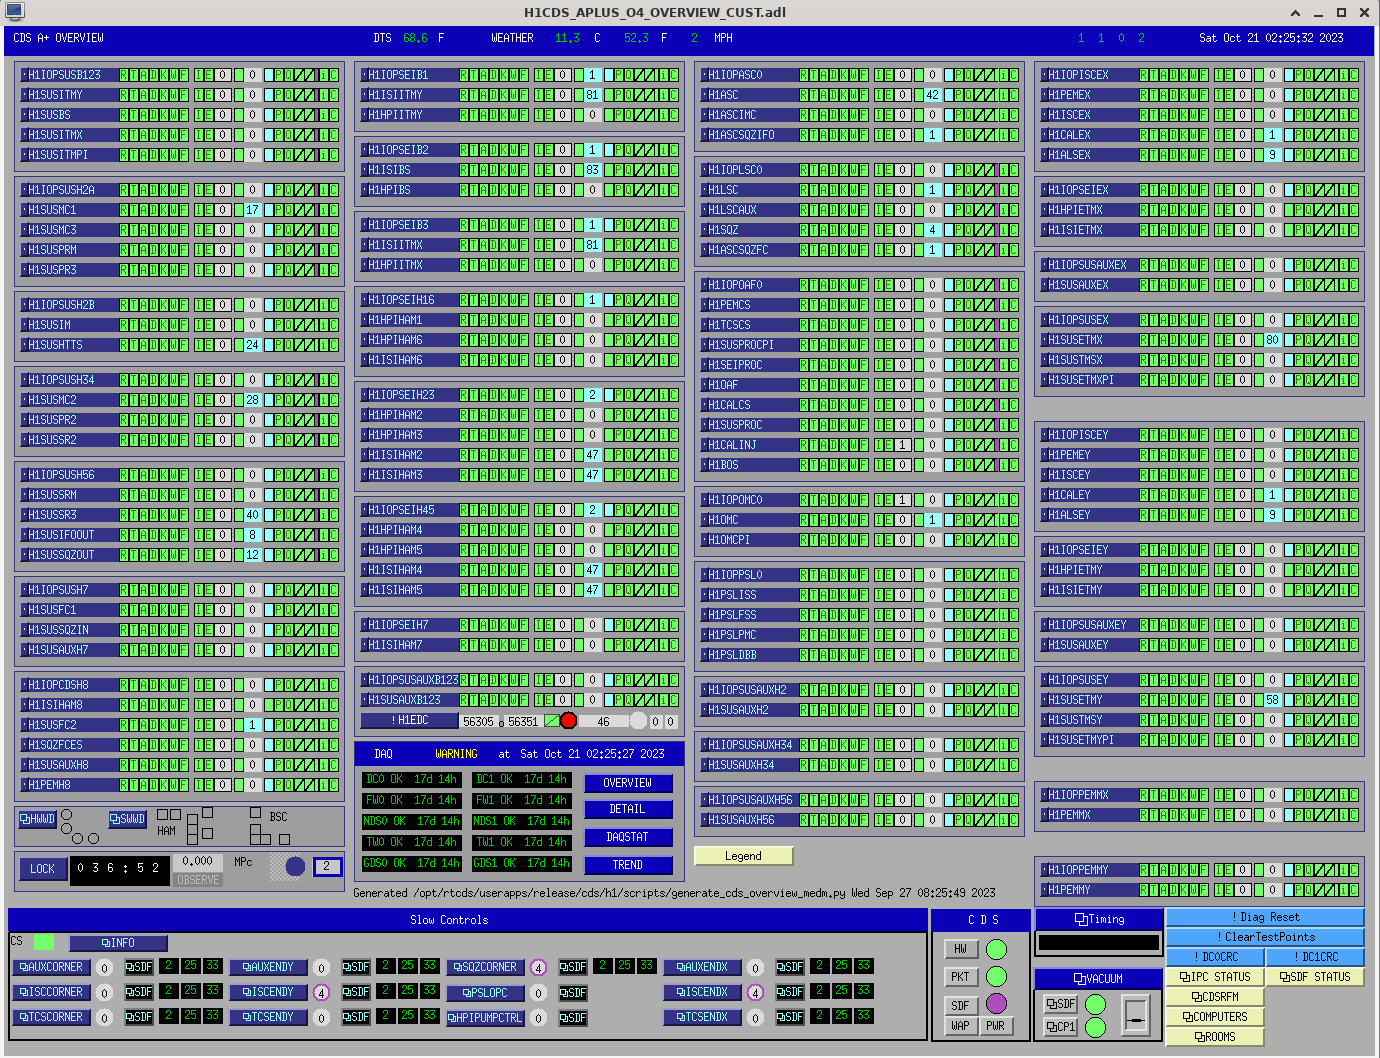
- Screenshot of Cailbratoin Monitor medm taken (see attached)
- 2332 Out of OBSERVING and ISC LOCK to NLN_CAL_MEAS
- 2333 in a terminal started broadband calibration meas: pydarm measure --run-headless bb
- 2339 this ended with: ICE default IO error handler doing an exit(), pid = 99711, errno = 32
- (Listing last few lines from this measurement below)
- 2340 Assuming this was the "end" of the broadband measurement, so I next ran simmulines measurement (in same terminal, per instructions): gpstime;python /ligo/groups/cal/src/simulines/simulines/simuLines.py -i /ligo/groups/cal/src/simulines/simulines/settings_h1.ini;gpstime
- This had a similar error after 2-min. Here are the last few lines from the terminal:
2023-10-22 23:42:28,941 | INFO | Drive, on L3_SUSETMX_iEXC2DARMTF, at frequency: 544.99, is now running for 23 seconds.
2023-10-22 23:42:35,388 | INFO | Drive, on PCALY2DARMTF, at frequency: 8.69, is finished. GPS start and end time stamps: 1382053346, 1382053370
2023-10-22 23:42:35,389 | INFO | Scanning frequency 8.99 in Scan : PCALY2DARMTF on PID: 106437
2023-10-22 23:42:35,389 | INFO | Drive, on PCALY2DARMTF, at frequency: 8.99, is now running for 31 seconds.
^C2023-10-22 23:42:40,347 | ERROR | Ramping Down Excitation on channel H1:SUS-ETMX_L1_CAL_EXC
2023-10-22 23:42:40,347 | ERROR | Ramping Down Excitation on channel H1:SUS-ETMX_L3_CAL_EXC
2023-10-22 23:42:40,347 | ERROR | Ramping Down Excitation on channel H1:SUS-ETMX_L2_CAL_EXC
2023-10-22 23:42:40,347 | INFO | Ending lockloss monitor. This is either due to having completed the measurement, and this functionality being terminated; or because the whole process was aborted.
2023-10-22 23:42:40,348 | ERROR | Ramping Down Excitation on channel H1:LSC-DARM1_EXC
2023-10-22 23:42:40,348 | ERROR | Aborting main thread and Data recording, if any. Cleaning up temporary file structure.
2023-10-22 23:42:40,348 | ERROR | Ramping Down Excitation on channel H1:CAL-PCALY_SWEPT_SINE_EXC
ICE default IO error handler doing an exit(), pid = 106373, errno = 32
PDT: 2023-10-22 16:42:44.751376 PDT
UTC: 2023-10-22 23:42:44.751376 UTC
GPS: 1382053382.751376
- 2351 After ligo.chat with Jenne, decided to stop Calibration Measurements (she mentioned possibly the dolphin crash from Fri night could be a possible culprit?)
- 2351 OBSERVING (and I restored H1 Manager to MANAGED)
Here were the last few lines at the end of the broadband measurement:
notification: new test result
notification: new test result
notification: new test result
notification: end of measurement
notification: end of test
diag> save /ligo/groups/cal/H1/measurements/PCALY2DARM_BB/PCALY2DARM_BB_20231022T233325Z.xml
/ligo/groups/cal/H1/measurements/PCALY2DARM_BB/PCALY2DARM_BB_20231022T233325Z.xml saved
diag> quit
EXIT KERNEL
INFO | bb measurement complete.
INFO | bb output: /ligo/groups/cal/H1/measurements/PCALY2DARM_BB/PCALY2DARM_BB_20231022T233325Z.xml
INFO | all measurements complete.
ICE default IO error handler doing an exit(), pid = 99711, errno = 32

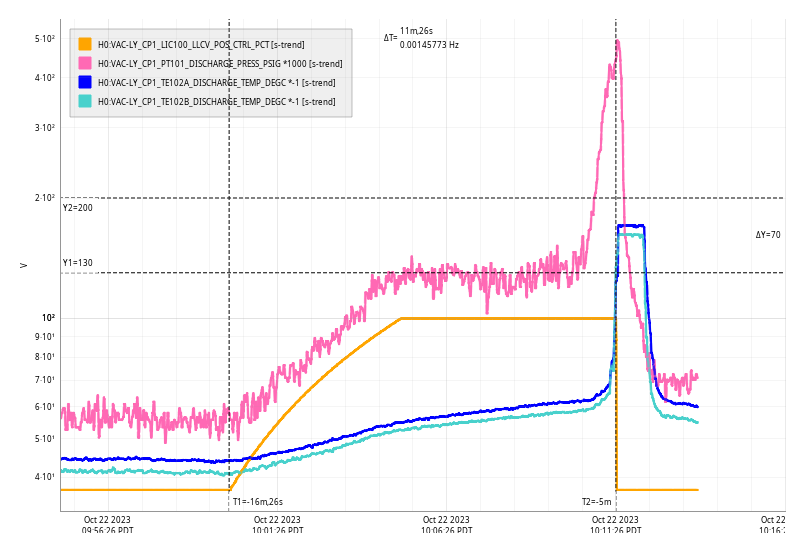

Dropped out of observing from 15:56:44 to 15:58:03UTC from the TCS_ITMX_CO2 laser losing lock and relocking itself.
Spike seen by ITMY_{X,Z}_BLRMS_10_30 mostly Z at 16:14UTC