Detector is in Observing and has been locked for 11hrs 22mins. There were a few earthquakes that rolled through so we did go into Earthquake mode a couple of times (8:44-8:54 and 9:29-9:50), but we rode them out.
The MY temp alarm hasn't been triggered since it went off during Ryan S's shift (71778).
TITLE: 07/28 Owl Shift: 07:00-15:00 UTC (00:00-08:00 PST), all times posted in UTC
STATE of H1: Observing at 146Mpc
CURRENT ENVIRONMENT:
SEI_ENV state: CALM
Wind: 14mph Gusts, 8mph 5min avg
Primary useism: 0.03 μm/s
Secondary useism: 0.06 μm/s
QUICK SUMMARY:
Taking over from Ryan S. We're Observing and have been Locked for 7hrs 29mins.
I'll keep watch on the MY station temps.
TITLE: 07/27 Eve Shift: 23:00-07:00 UTC (16:00-00:00 PST), all times posted in UTC
STATE of H1: Observing at 148Mpc
SHIFT SUMMARY: Quiet shift tonight, relocked easily and H1 has been observing for 7 hours.
Handing off to Oli for the rest of the night.
LOG:
No log for this shift.
State of H1: Observing at 150Mpc
H1 has been locked and observing for 3 hours. Locking at the start of the shift went smoothly (except for a small manual adjustment of the DIFF offset). Some dust alarms for the optics lab, these have since stopped.
DQ shifter: Katie Rink
Shadow: Caitlin Rawcliffe
Link to full report: https://wiki.ligo.org/DetChar/DataQuality/DQShiftLHO20230717
Week's Summary
FAMIS 17561, last checked in alog 70984
All BRS channels are well within their safe regions, as was the case with the previous check.
TITLE: 07/27 Day Shift: 15:00-23:00 UTC (08:00-16:00 PST), all times posted in UTC
STATE of H1: Aligning
SHIFT SUMMARY: A little over and hour this morning for calibration and SQZ tuning. We lost lock at 2124UTC ending a 24 hour lock. Relocking has been a great test for our H1_MANAGER node and the IFO_NOTIFY/calling system as we had Find_IR fail and HEPI HAM2 trip with a coefficient load. I forced an initial alignment which ran autonomously. Ryan is now bringing it back up.
LOG:
| Start Time | System | Name | Location | Lazer_Haz | Task | Time End |
|---|---|---|---|---|---|---|
| 16:17 | CAL | TJ | CR | n | CAL measurement | 16:44 |
| 16:17 | FAC | Cindi | MY | n | Tech clean | 17:54 |
| 16:44 | SQZ | Camilla | CR | n | SQZ NLG tuning | 16:59 |
| 17:00 | SQZ | Vicky, Camilla | CR,remote | n | SQZ tuning | 17:31 |
| 17:24 | PEM | Richard | FCTE | n | Retrieving temperature sensors | 17:48 |
TITLE: 07/27 Eve Shift: 23:00-07:00 UTC (16:00-00:00 PST), all times posted in UTC
STATE of H1: Lock Acquisition
CURRENT ENVIRONMENT:
SEI_ENV state: CALM
Wind: 18mph Gusts, 11mph 5min avg
Primary useism: 0.03 μm/s
Secondary useism: 0.05 μm/s
QUICK SUMMARY: Taking over from TJ. H1 has just finished initial alignment and starting with lock acquisition now.
No obvious cause yet
Marissa, Shania, Tabata, Gaby, Brennan, Andy While looking into jitter glitches (alog 71739), we found a time with a few similar glitches on July 17th. They happen when fiber was being pulled from the control room to the fire panel (alog 71416). The glitches have a similar appearance to the previous jitter glitches (plot 1), and are witnessed by the IMC and PSL periscope accelerometer, so they are probably through the same coupling mechanism. Plot 2 shows the Omicron triggers (21:12 to 21:18 UTC). The motion is very visible in the LVEA floor accelerometer near HAM1 (plot 3, compare to plot 4 of DARM), and also on many other PEM channels. A full Omega scan of one of these glitches is here.
Outside temperatures have been quite hot in the last week, near 100F at times. Luckily though, it looks like the temperature sensors in the FCTE are reporting ~15F below that. The attached plots are of the same time frame and I tried to scale as closely as possible. the FCTE clearly doesn't see the same extremes with its diurnal temps.
(Apologies for the seperate plots, I gave up combining due to different data formats, time formats, data rates)
Vicky, Camilla. Out of Observing today for squeezing optimization. No SQZ time 16:44UTC to 16:55UTC and 17:01UTC to 17:27UTC. See SQZ Troubleshooting Wiki for instructions.
Can see an increase in SQZ 350-1700Hz BLRMS comparing before and after this optimization.
Last time we re-aligned the pump aom due to clipping was in June, LHO:70198. In summary, I'd expect the power launched to the fiber, "H1:SQZ-SHG_REJECTED_DC_POWERMON", to be ~70% of the SHG output power, "H1:SQZ-SHG_GR_DC_POWERMON".
I added some scopes to the SQZT0 medm screen to make this easier to check, it is in:
--> $userapps/sqz/h1/Templates/ndscope/check_pump_aom_clipping.yaml
or from sitemap > SQZT0 > purple "! SQZT0 scopes" > "check pump aom" from the dropdown list.
From today's scope,
--> with all power going through the AOM (H1:SQZ-OPO_ISS_DRIVEPOINT = 0),
--> it looks like we're only getting ~22 mW out of the pump AOM (sum of bottom 2 traces)
--> when we should be getting 45.8*0.7 ~ 32mW, if the pump aom throughput was normal.
So, if we want to turn up squeeze levels, or if we start to get unstable at this sqz level, we could go into SQZT0 on a Tuesday to check the pump aom + fiber input alignments.
Also adding in a screenshot for how we "Aligned fiber polarization using pico waveplates on SQZT0..," circling the relevant parts of medm screens.
No-sqz times from this work, 1374512130-1374512500.
Marissa, Sidd
There is evidence that the current 20-50 Hz transients in the LHO data were present during the O3 as well. They were nearly not as ubiquitous as they are now, which can be explained by the increase in low frequency sensitivity in the current Observing run. However, I am not sure if the difference in low frequency sensitivity can completely explain the emergence of this noise, the existing noise coupling could also have gotten worse.
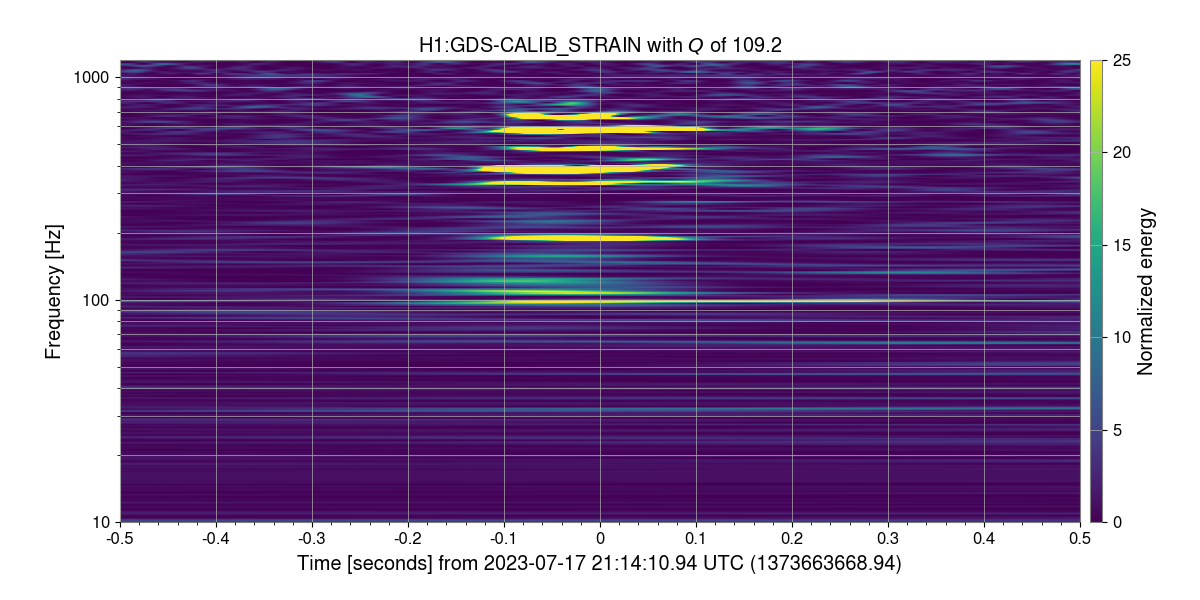
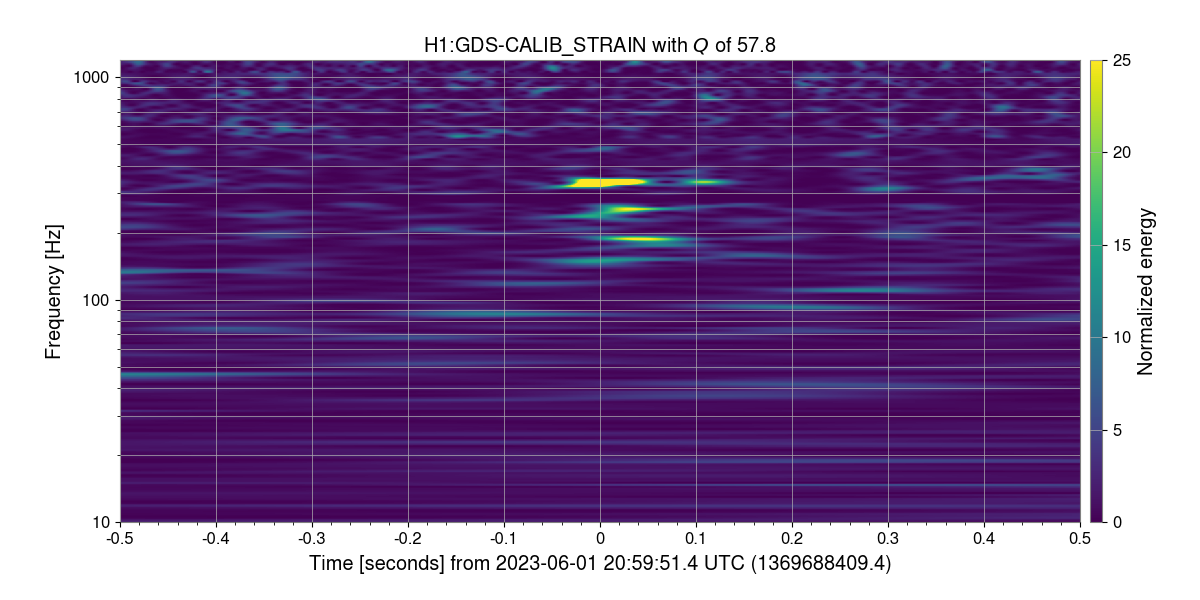
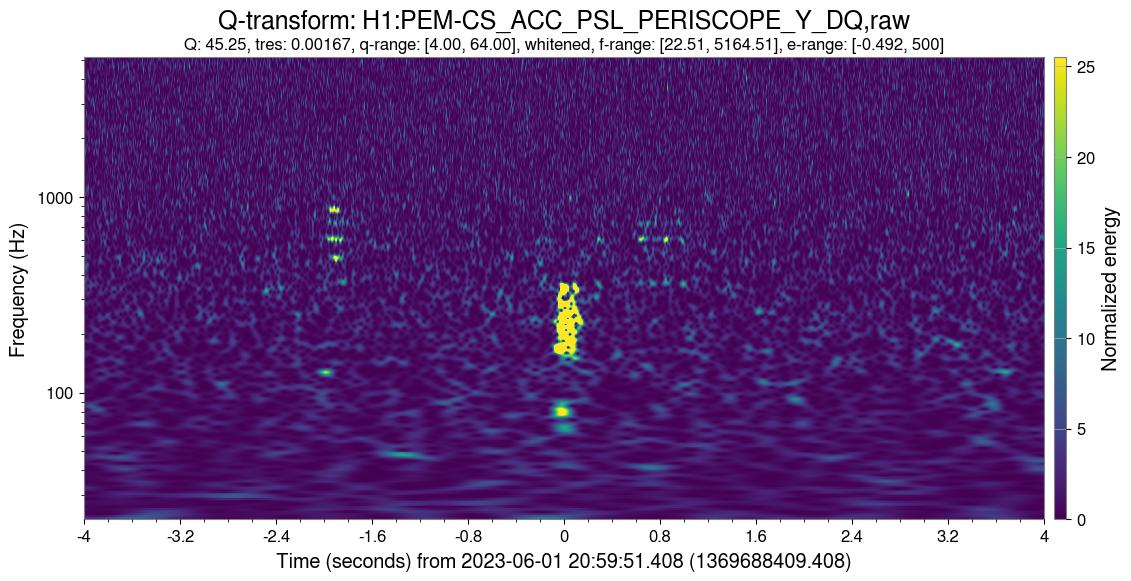
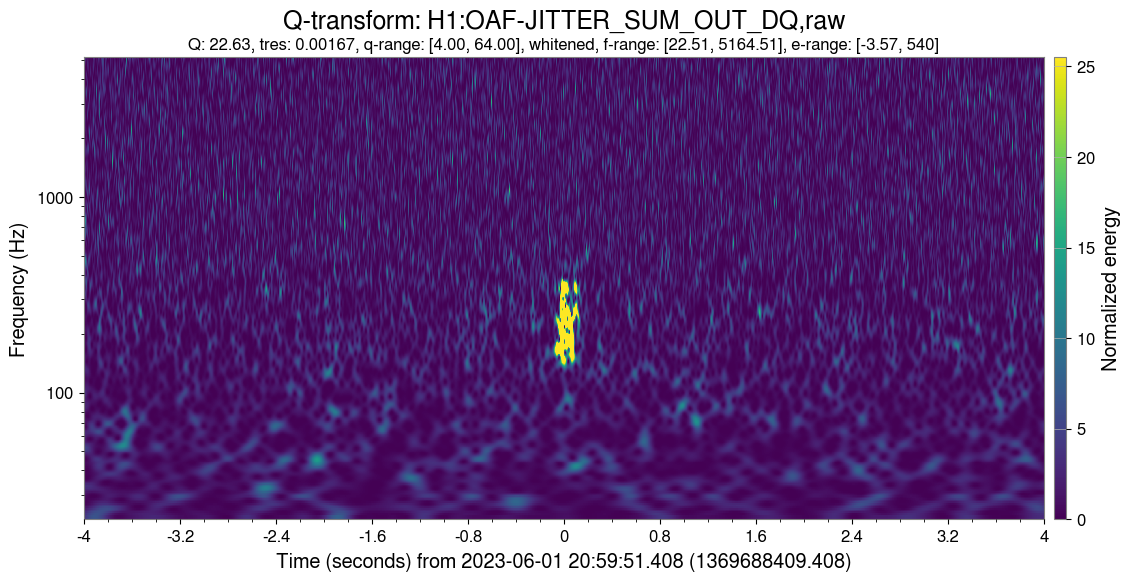
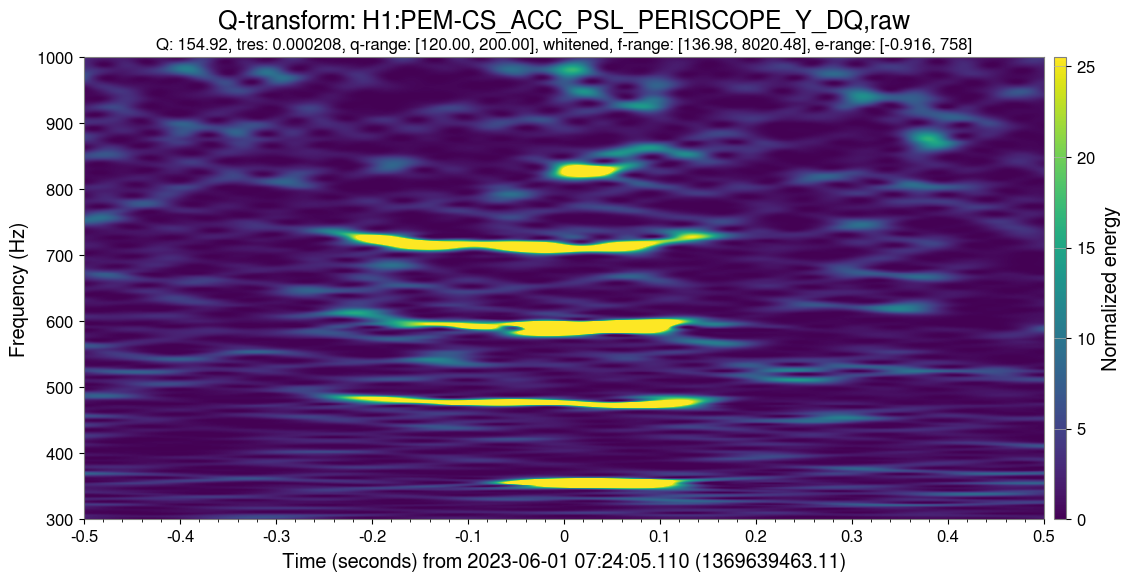
The first scan is from O3 and the second from O4. The separation between the blobs is similar (about 0.2 secs). A gravityspy search for fast scatter in O3b shows a whole lot of these transients.
In the current Observing run as well, we have noticed that when the sensitivity gets better, the transient rate goes up. The third plot shows the glitch rate between June 1 and July 12. For the days after June 22, when the LHO powered down and the low frequency sensitivity improved as shown by the fourth plot, the glitch rate is higher.
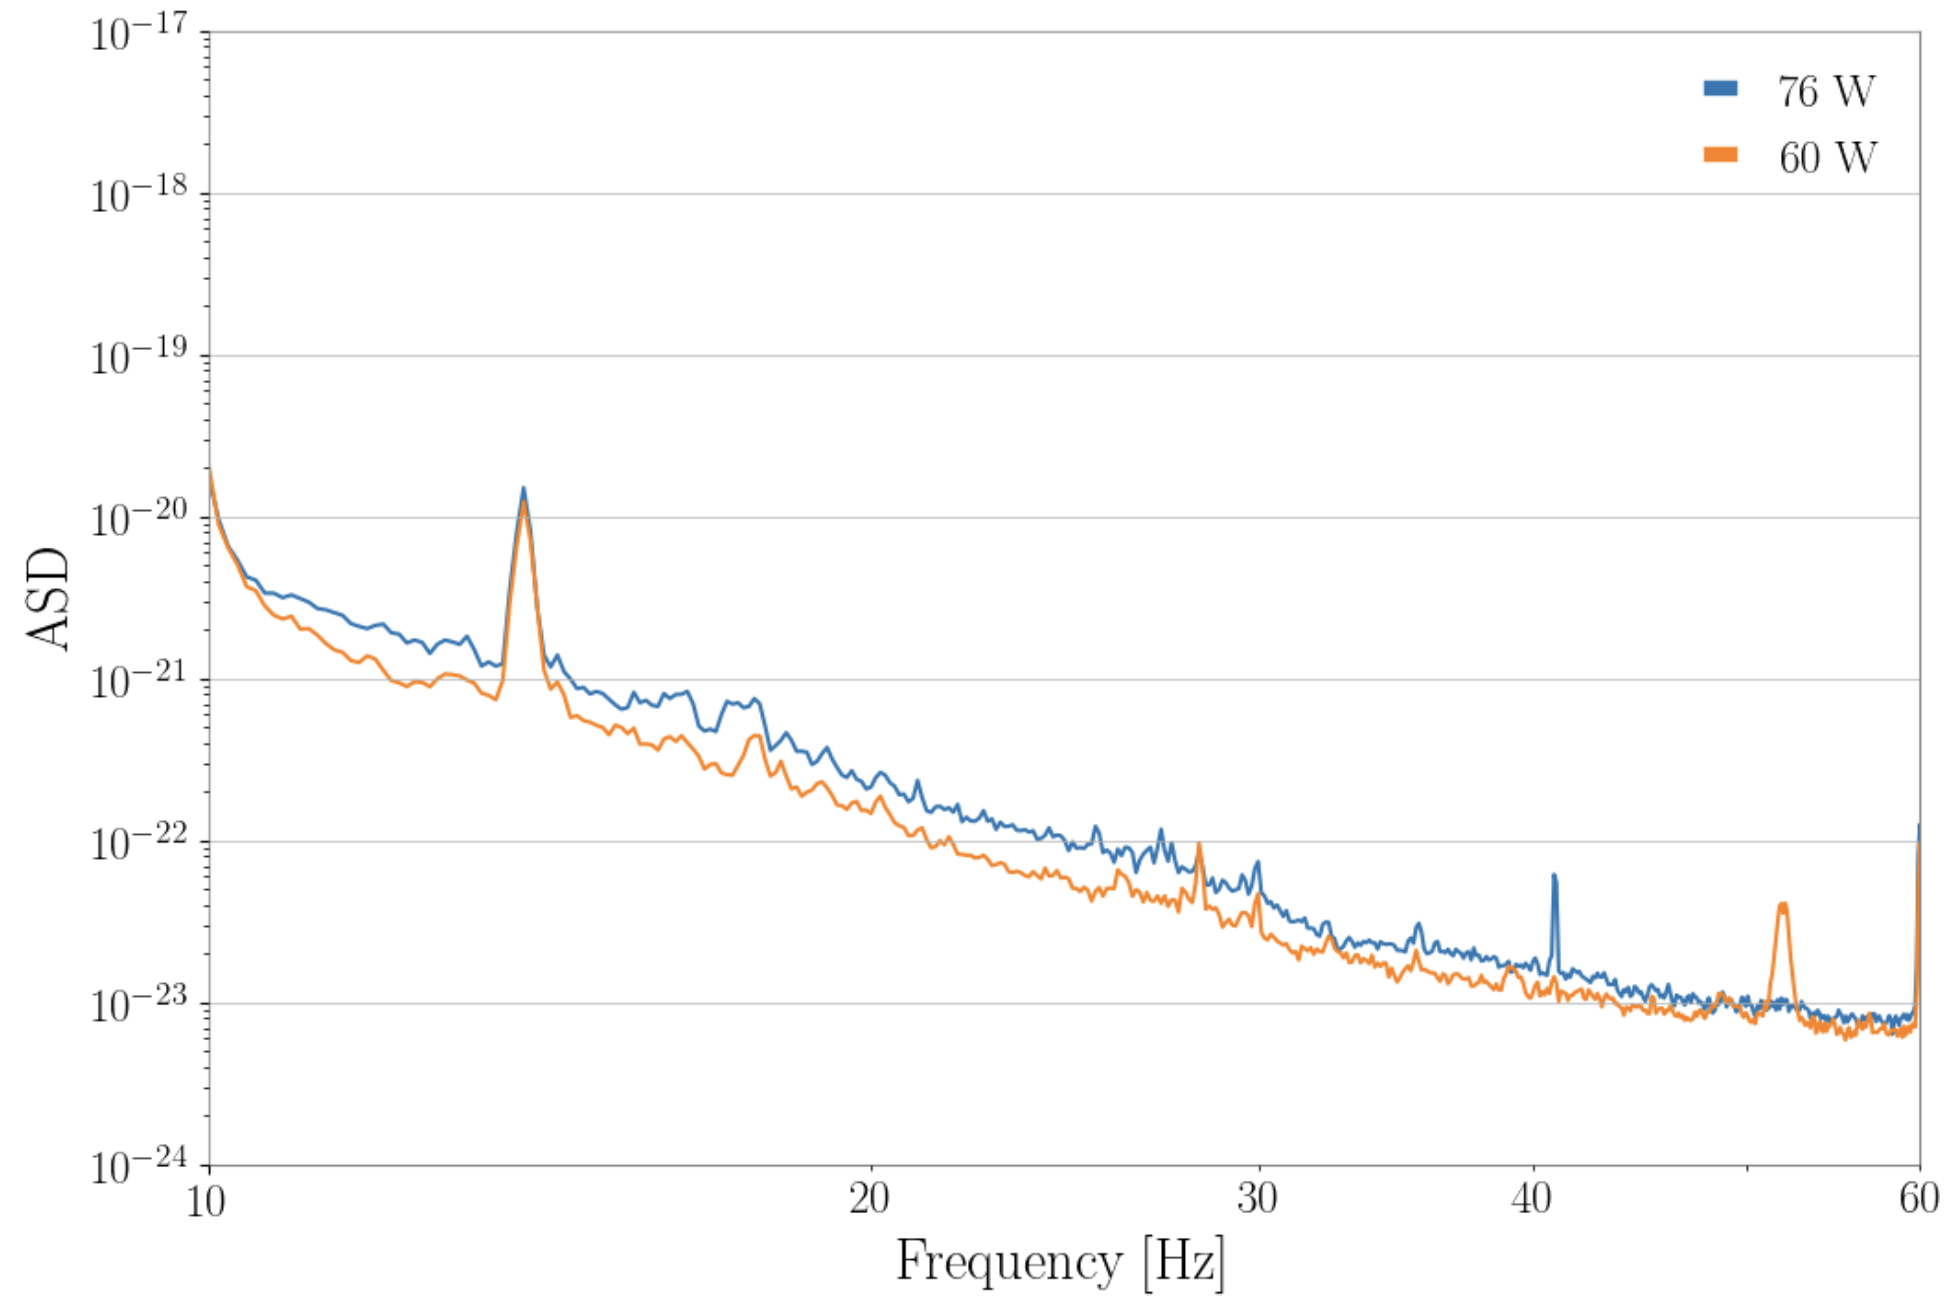
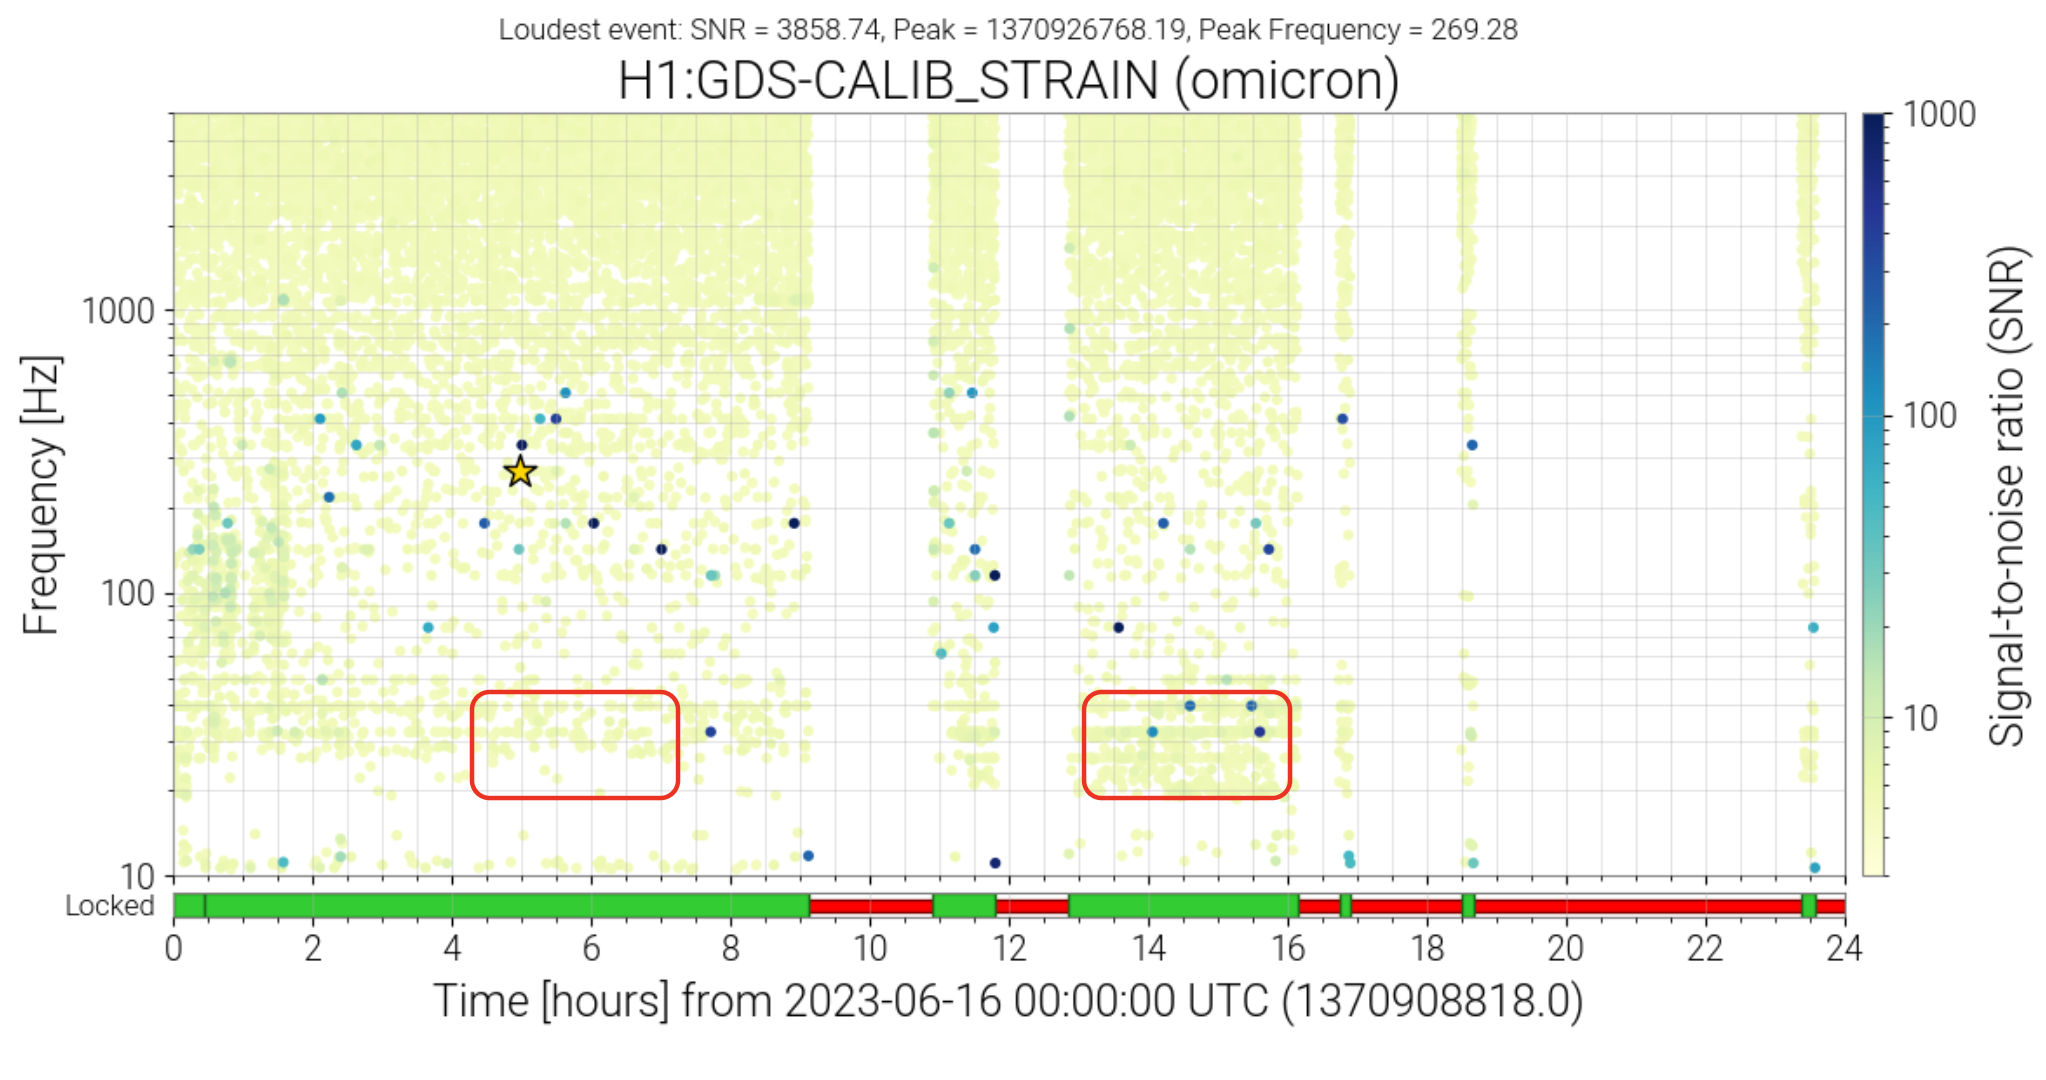
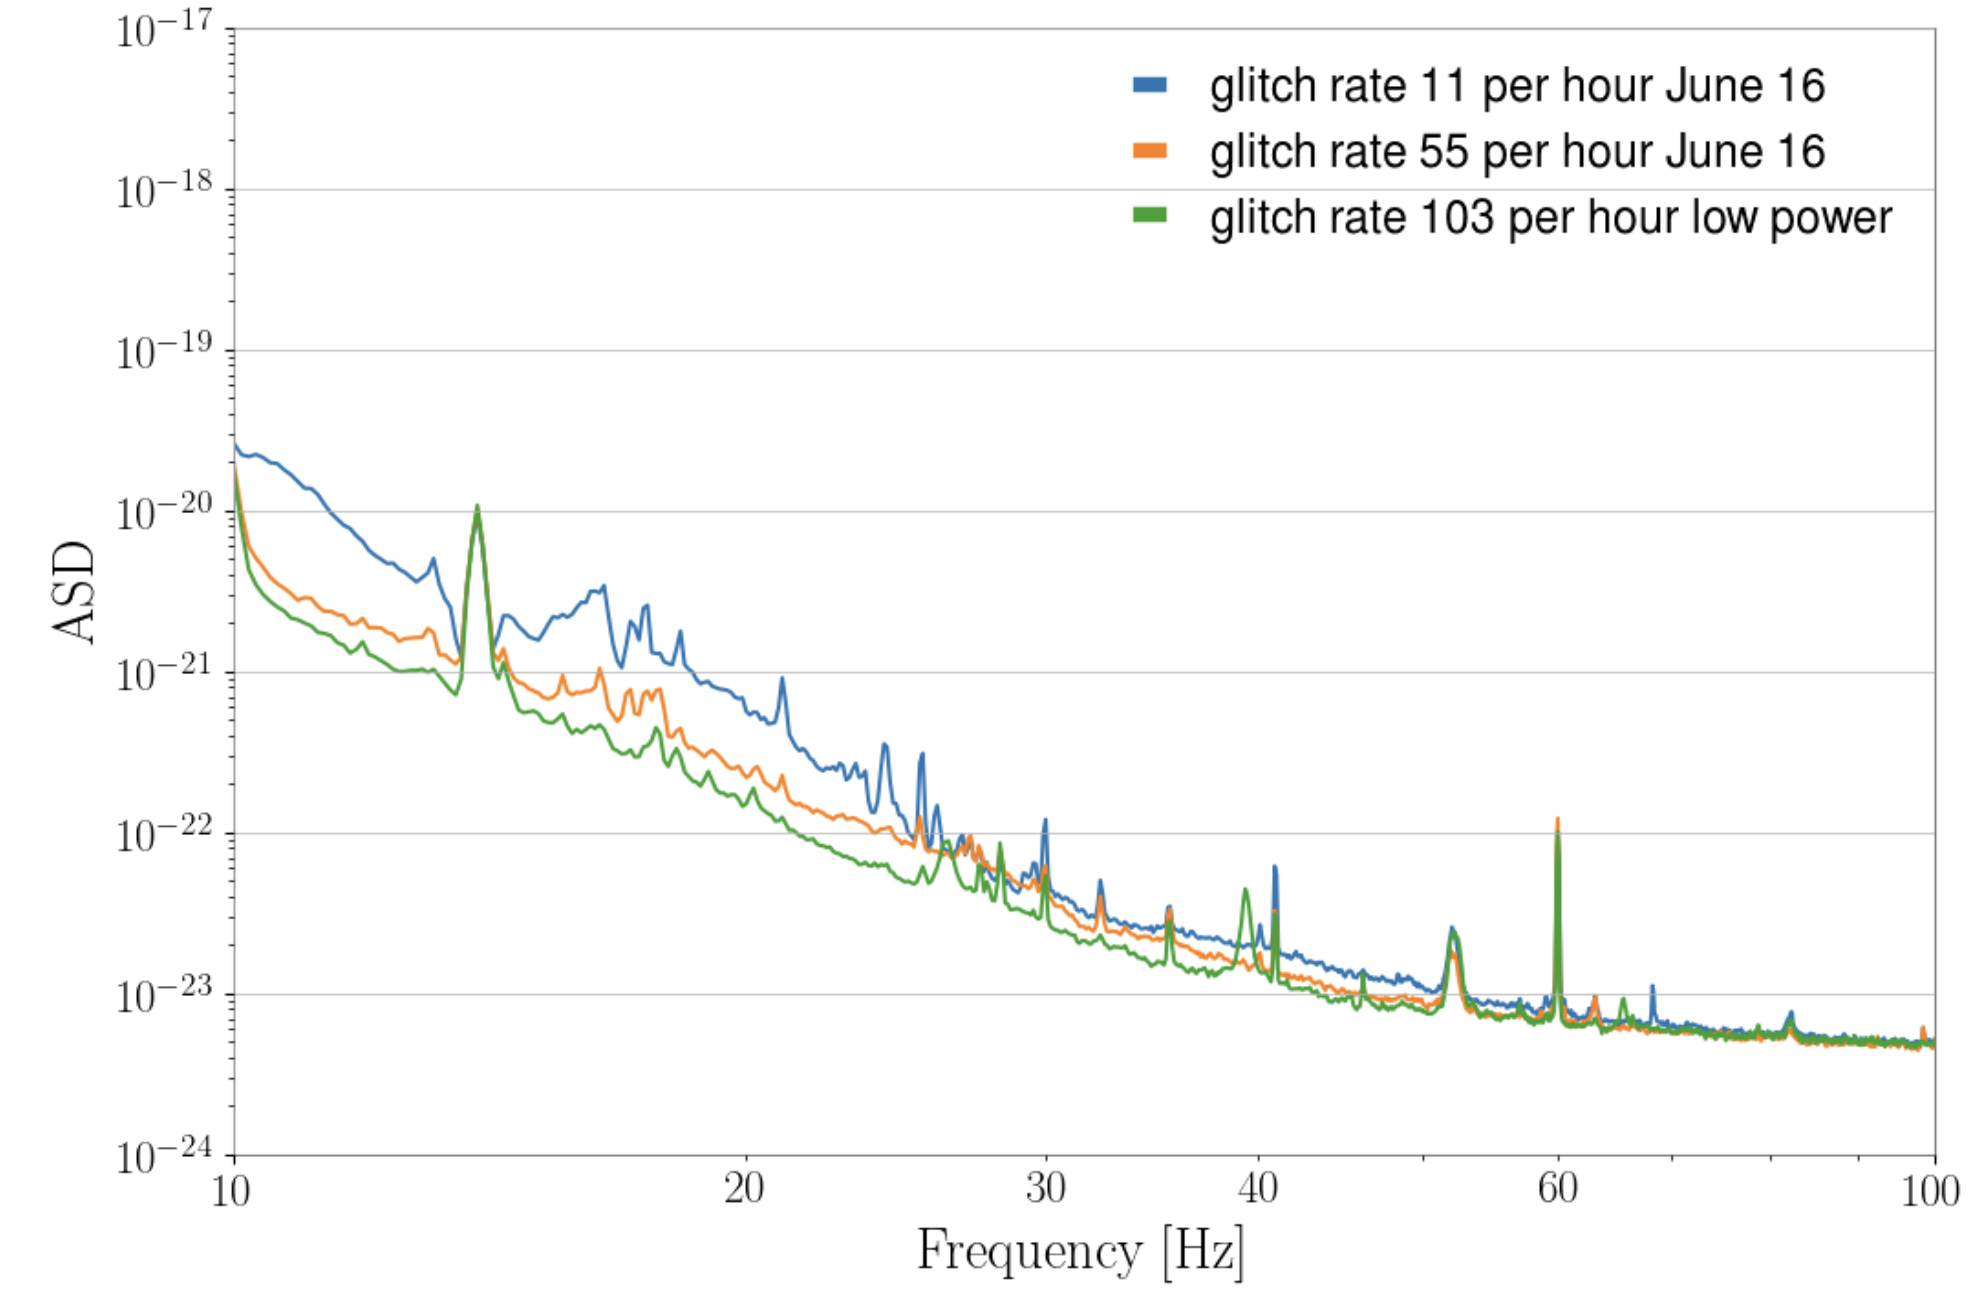
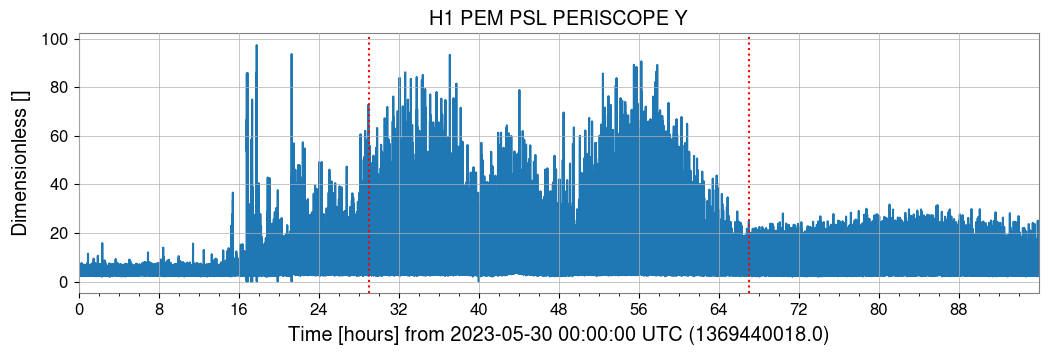
There are times when within the same day, the change in sensitivity resulted in very different rate of transients. One such example is June 16 2023 (fifth plot). As seen from this plot, there are more glitches in the second red box compared to the first one. From the sixth ASD plot, we can see that as the DARM sensitivity got better on June 16, the transient rate went up. And it went further up after the power down (76 W to 60 W) as the low frequency sensitivity improved (green curve).
This analysis shows that some processes are continuously generating these transients and as the DARM sensitivity gets better, the rate of transients go up. We are looking for times when there is a change in the amplitude or frequency of this noise and correlate it with changes in different parts of the detector. We are more and more certain that the coupling does not depend on the ground motion, else we would have seen noise variations in the last two months of data.
Yesterday during commissioning time I did a couple of experiments with CHARD_Y (71738)
How much margin do we have for CHARD_Y noise?
With the 10-100 Hz noise injection, I could estimate a CHARD_Y noise projection to DARM, using the excess power method (ratio of PSD). Using the measured transfer function between CHARD_Y and DARM gies the same result. The first plot shows the effect of the noise injection in CHARD_Y. The second plot shows the noise projection, and that we have a safety factor of about 30-100 above 15 Hz. We can use this information to design a new CHARD_Y filter.
Increasing the CHARD_Y gain by 3
In the second experiment I increased the CHARD_Y gain by a factor of 3, since the model predicted that the loop would be stable. This would give me more suppression at low frequency and a bit of suppression of the 2.6 Hz peak. This is pretty much what we observed. The change in the DARM or CHARD_Y residual RMS isn't large, as expected. So there is no effect on the sensitivity. We should try to design a better filter that gives us suppression at 1 Hz and 2.6 Hz to reduce the CHARD_Y RMS.
Note that the 1 Hz peak in CHARD_Y is coherent with PR2 and PR3 damping loops, so maybe we can gain something by also looking at those damping loops.
Here's a proposed new CHARD_Y controller, based on the 3x gain, adding more suppression at 1 and 2.6 Hz, and with increased noise injection above 10 Hz that should be ok given the measured coupling to DARM.
The last plot shows the predicted performance of this new loop: residual motion below 3 Hz should be largely suppressed. Only the 3.4 Hz peak is increased less than a factor 2.
Engaging this new controller with a gain of 180 caused a lock loss with an oscillation at 3.4 Hz, which is the expected higher UGF.
Probably the plant measurement is not accurate enough at such high frequency.
Tried a slighlty modified controller with more phase margin at 3-4 Hz. Now uploaded to FM9. This can be engaged with the nominal gain of 60, and it is supposed to be stable all the way to the working gain of 180.
However, incrreasing the gain to 120 already generates a large peak at 3.4 Hz. This is consistent with the previous lock loss.
The low frequency performance with this new controller with a gain of 120 is good as expected, but the new peak at 3.4 Hz actually increases the DARM RMS. I believe thin increase is responsible for the higher noise in DARM at >10 Hz, since there isn't much coherence between CHARD_Y and DARM.
I wanted to measure again the CHARD_Y plant, since the previous measurement was not very good at >2 Hz, and I suspect the real plant gives less phase margin that the fit model we have now. Unfortunately I incraesed the noise amplitude too much and we lost lock. To be repeated.
I also tried to reduce the coupling of CHARD_Y to DARM by fine tuning the ITMY A2L, but I couldn't get any improvement. I injected a 21.5 Hz line in CHARD_Y, but that showed up in DARM with a lot of sidebands and appeared quite non-stationary. More care will be needed to retuned the A2L to reduce CHARD_Y coupling to DARM: this might be necessary if the new controller injects too much noise at frequencies above 10 Hz
Back to observing after CAL measurements and SQZ tuning.
Marissa, Shania, Tabata, Gaby, Brennan, Andy GravitySpy volunteers noticed a new type of glitch that happened on May 31 and June 1 (GSpy link). Many of these glitches appeared as a high-Q line at 590 Hz, but they also appear as a stack of high-Q lines in the 100 to 600 Hz range, and sometimes only below 300 Hz (plot 1). The cause seems to be physical motion of the PSL periscope (plot 2) in short bursts. The coupling to DARM is through the periscope motion causing beam jitter (plot 3). The MCL/REFL_SERVO loop are also witnesses. Some of the glitches in the periscope are broadband, while others have a few well-defined frequencies (plot 4). There was an increase in the motion of the periscope during this period, seen by BLRMS of the periscope accelerometer (plot 5). The motion was still elevated above the previous level when this period ended. This kind of jitter glitch has occurred again in short bursts in some later days, but not for sustained periods. Scans of selected times are at this link (needs LVK login). Note that this configuration does not include the jitter or periscope accelerometer channels.
We also see in some of these glitches a loud noise in HAM1 HPI and LVEA floor accelerometer channels. See the attached example omega scans showing one glitch from June 26 showing up in H1:HPI-HAM1_BLND_L4C_Y_IN1_DQ and H1:PEM-CS_ACC_LVEAFLOOR_HAM1_Z_DQ. You can also see other accelerometers showing up in the full omega scans here but those were ones that showed up especially strong in several of the glitch times we examined. These are obvious in the omega scans at the specific glitch times, but this motion can't be clearly seen in the day-long spectrograms in the summary pages.